 Hailun Liang
 Jijuan Zhang2
- 1School of Public Administration and Policy, Renmin University of China, Beijing, China
- 2Institute for Medical Dataology, Cheeloo College of Medicine, Shandong University, Jinan, China
- 3Department of Health Management, Beijing Physical Examination Center, Beijing, China
Background: Evidence regarding the association between metabolism-related indicators and serum urate (SU) is limited. We aimed to obtain the incidence density of hyperuricemia and to explore the association between metabolism-related predisposing risk factors and SU.
Methods: A total of 48,979 Chinese adults from the Beijing Physical Examination Center were included in the study. The partial least squares path model was used to explore the relationship between SU and metabolism-related risk factors. The generalized additive model was used for smooth curve fitting, showing the sex-specific associations of SU at follow-up with baseline fasting blood glucose (FBG) concentrations and age.
Results: The incidence density of hyperuricemia was 78/1000 person-years. Baseline SU, age, sex, obesity, FBG, and lipid metabolism were significantly associated with SU at follow-up (all P values <0.05). Non-linear relationships were found between the baseline FBG concentrations and SU at follow-up, while U-shaped associations were observed between baseline age and SU at follow-up.
Conclusions: The SU concentration is associated with several metabolism-related risk factors such as obesity and FBG. Recognition of these associations will aid in a deeper understanding of the multifaceted nature of SU regulation.
Background
Serum urate (SU) is the final metabolite of purine compounds in the human body. Hyperuricemia occurs when the body’s purine metabolism and urate excretion are in disorder. Studies have reported a hyperuricemia prevalence of 21.4% among adults in the United States (1). In Europe, a cohort study in Ireland noted an increase in hyperuricemia prevalence from 20.1% to 24.5% between 2006 and 2014 (2), while in Italy, the prevalence is 6.3% among the general population (3) and 14.5% among individuals with hypertension (4). Also, Eastern Europeans with hypertension have a hyperuricemia prevalence of 25% (5). In Asia, Thailand’s prevalence stands at 10.6% (6). In mainland China, the pooled prevalence of hyperuricemia was 13.3% (7). Thus, hyperuricemia constitutes a growing threat to the public health.
The metabolic factors might be associated with the pathogenesis of hyperuricemia. Some studies have employed multivariable regression models to explore the associations of SU with fasting blood glucose (FBG), blood pressure (BP) or body mass index (BMI) (8–10). However, most of these studies were cross-sectional studies. Hence, the prospective association between SU and diverse metabolic factors remains unclear.
In this cohort study, we aimed to investigate the relationship between baseline metabolic risk factors and SU at follow-up in a large sample of Chinese adults using a relatively novel method named “partial least squares path model” (PLSPM). PLSPM is a structural equation model with few restrictions on the distribution of variables. PLSPM can be used to illustrate the importance of various factors that affect SU as well as reveal the interrelationships of various factors, and relevant findings may elucidate the underlying mechanisms behind the indicators.
Methods
Population
The Han Chinese adults aged from 18 to 94 years old who received annual medical examinations at Beijing Physical Examination Center joined this study. Beijing Physical Examination Center provided Beijing citizens with medical services widely, and the cohort established based on the agency could represent citizens in Beijing. At the beginning of the study, participants with incomplete information, suffering from hyperuricemia, cancer, hepatosis and renal dysfunction were excluded, and then the participants who met the inclusion criteria were followed up for hyperlipidemia. The subjects took the first medical examination in 2014, 2015 or 2016 respectively, and had at least two examination records during the follow-up. The interval between the first and the second physical examination was required to be at least 3 months. A total of 48,979 participants (24,273 men, 24,706 women) were included in the study. Flow chart of the study was shown in Supplementary Figure S1.
Data collection and measurements
The age and sex of the subjects were registered in the information system. Under the condition of wearing light clothes and taking off shoes, the height and weight were measured with an electronic instrument. BMI was calculated as weight (kg) divided by the square of height (m2). A non-elastic, adjustable tape was used to measure the waist circumference (WC). The subjects rested for 5 minutes before measuring the systolic blood pressure (SBP) and diastolic blood pressure (DBP), and an electronic monitor was used to measure the blood pressure. After fasting for at least 12 hours, the blood samples of the subjects were taken away. Biochemical indicators such as FBG, total triglycerides (TG), total cholesterol (TC), high-density lipoprotein cholesterol (HDL-C), low-density lipoprotein cholesterol (LDL-C) and SU were tested using standard methods.
Definition of hyperuricemia
Hyperuricemia was defined as the SU concentration >420 μmol/L (men) or >360 μmol/L (women) (11). We also performed a sensitivity analysis using cut-offs reported in the URRAH (Uric Acid Right for Heart Health) Project as requested by a reviewer (12).
Statistical analyses
Continuous variables conformed to the normal distribution were expressed as mean ± standard deviation, and those not normally distributed were represented by the median and interquartile range (IQR). Student’s t test was used for comparison of continuous variables with normal distribution, and nonparametric Wilcoxon test was used for continuous variables not normally distributed. The χ2 test was used for comparison of categorical variables between groups. The incidence density was calculated using the following formula:
The PLSPM was used to explore the relationship between SU and metabolism-related risk factors. The PLSPM model is a kind of structural equation model, which consists of measurement models and structural models. The measurement model reflects the relationship between the observed variables and the latent variables, and the structural model is used to analyze the structural relationship between the latent variables (13, 14). In this study, latent variables included SU at follow-up, age, sex, obesity, FBG, lipid metabolism, blood pressure and baseline SU. Observed variables included SU at follow-up, age, sex, FBG, BMI, WC, TG, TC, HDL-C, LDL-C, SBP, DBP and baseline SU. Apart from SU at follow-up, which was measured at the end of the follow-up, the other observed variables were measured at baseline. Referring to relevant medical knowledge and literature, we established the measurement model, showing the relationship between latent variables and observed variables. The structural model was used to analyze the relationships between SU at follow-up and other latent variables. Considering that the follow-up time of different individuals was not necessarily the same, and the PLSPM couldn’t deal with the factor of follow-up time, therefore, we added a subgroup analysis to divide the population into different groups according to the follow-up time, and models of different groups were established and compared. The generalized additive model was used for smooth curve fitting, showing the sex-specific associations of SU at follow-up with baseline FBG concentrations and age. All statistical tests were two-sided tests, and a P value<0.05 was considered statistically significant. R 4.0.3 software was used for statistical analysis.
Results
Incidence density of hyperuricemia and participant characteristics
The total incidence density was 78/1000 person-years (115/1000 person-years for men, 42/1000 person-years for women) (Supplementary Table S1). Prevalence of hyperuricemia was shown in Supplementary Table S2.
Table 1 showed the characteristics of the subjects of different sex grouped by hyperuricemia (hyperuricemia and non-hyperuricemia).
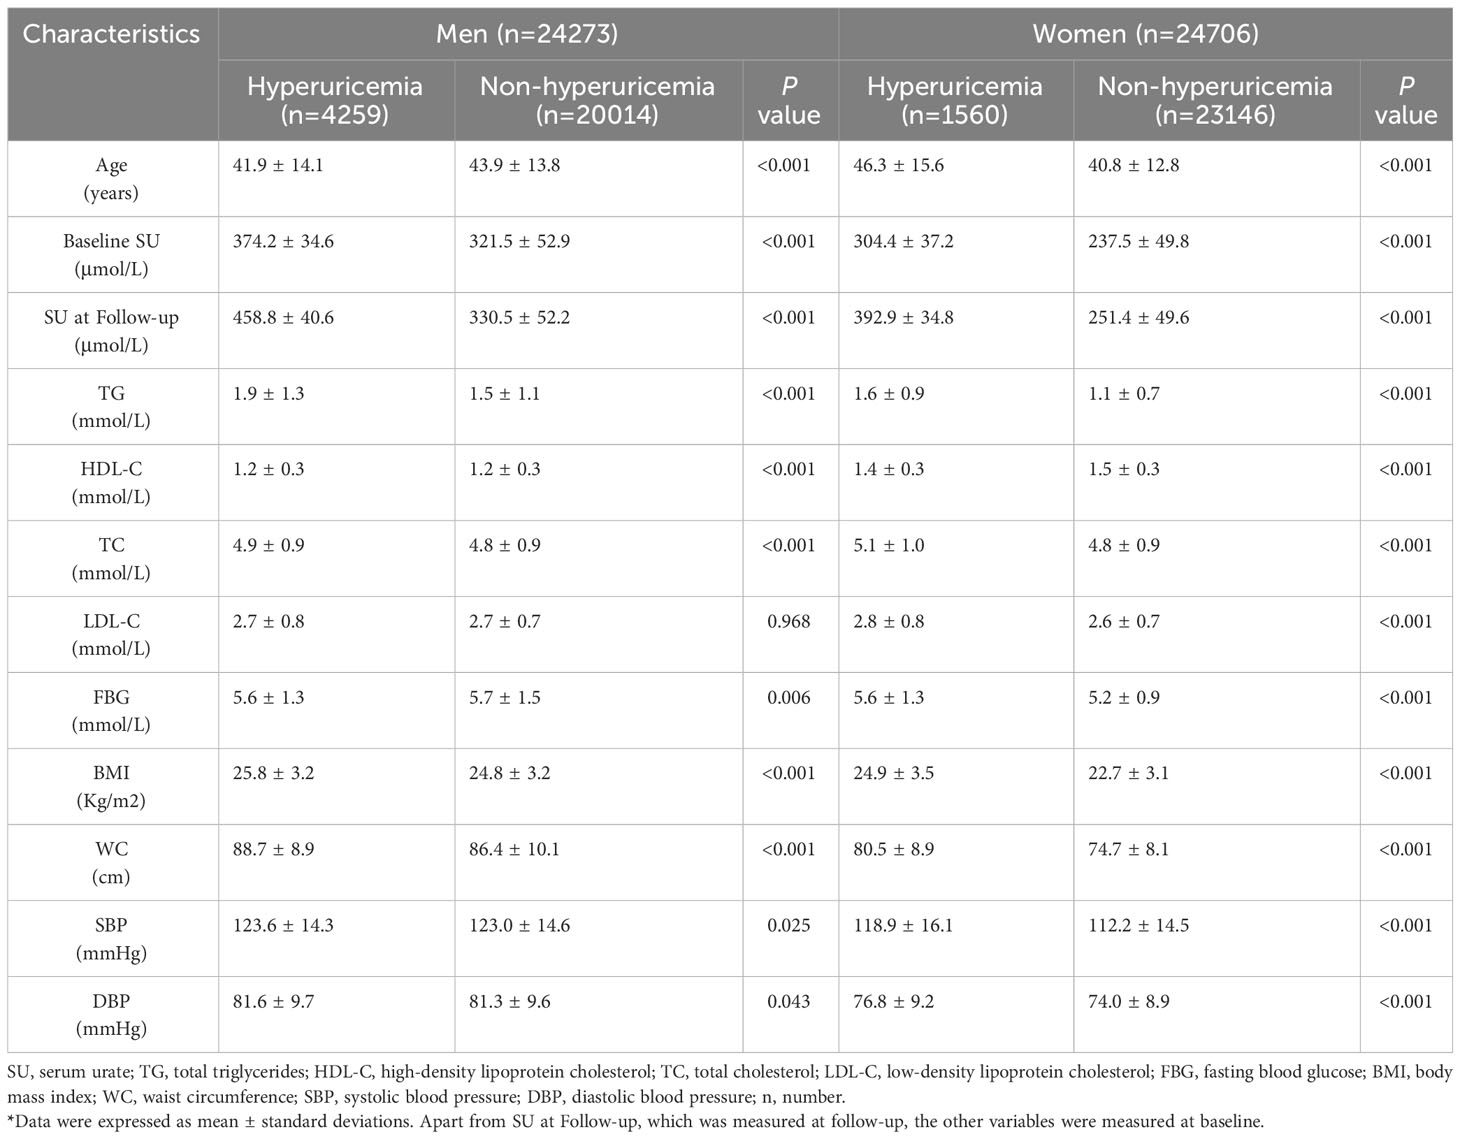
Table 1 Characteristics between men and women grouped by hyperuricemia*.
Association between metabolism-related risk factors and SU
As shown in Figure 1, the determination coefficient (R2) of the PLSPM was 0.631, indicating that the model could explain 63.1% of the total variation. In the measurement model, WC had the largest contribution to obesity (loading = 0.999), followed by BMI (loading = 0.858). SBP (loading = 0.985) contributed slightly more to blood pressure than DBP (loading = 0.908). TG (loading = 0.931) had the largest contribution to lipid metabolism, followed by TC (loading = 0.626), again was LDL-C (loading = 0.417), and final was HDL-C (loading = -0.329). According to the structural model, baseline SU (coefficient = 0.682), lipid metabolism (coefficient = 0.041), sex (coefficient = 0.106) and obesity (coefficient = 0.049) were positively associated with SU at follow-up. Conversely, age (coefficient = -0.012) and FBG (coefficient = -0.008) were negatively associated with SU at follow-up.
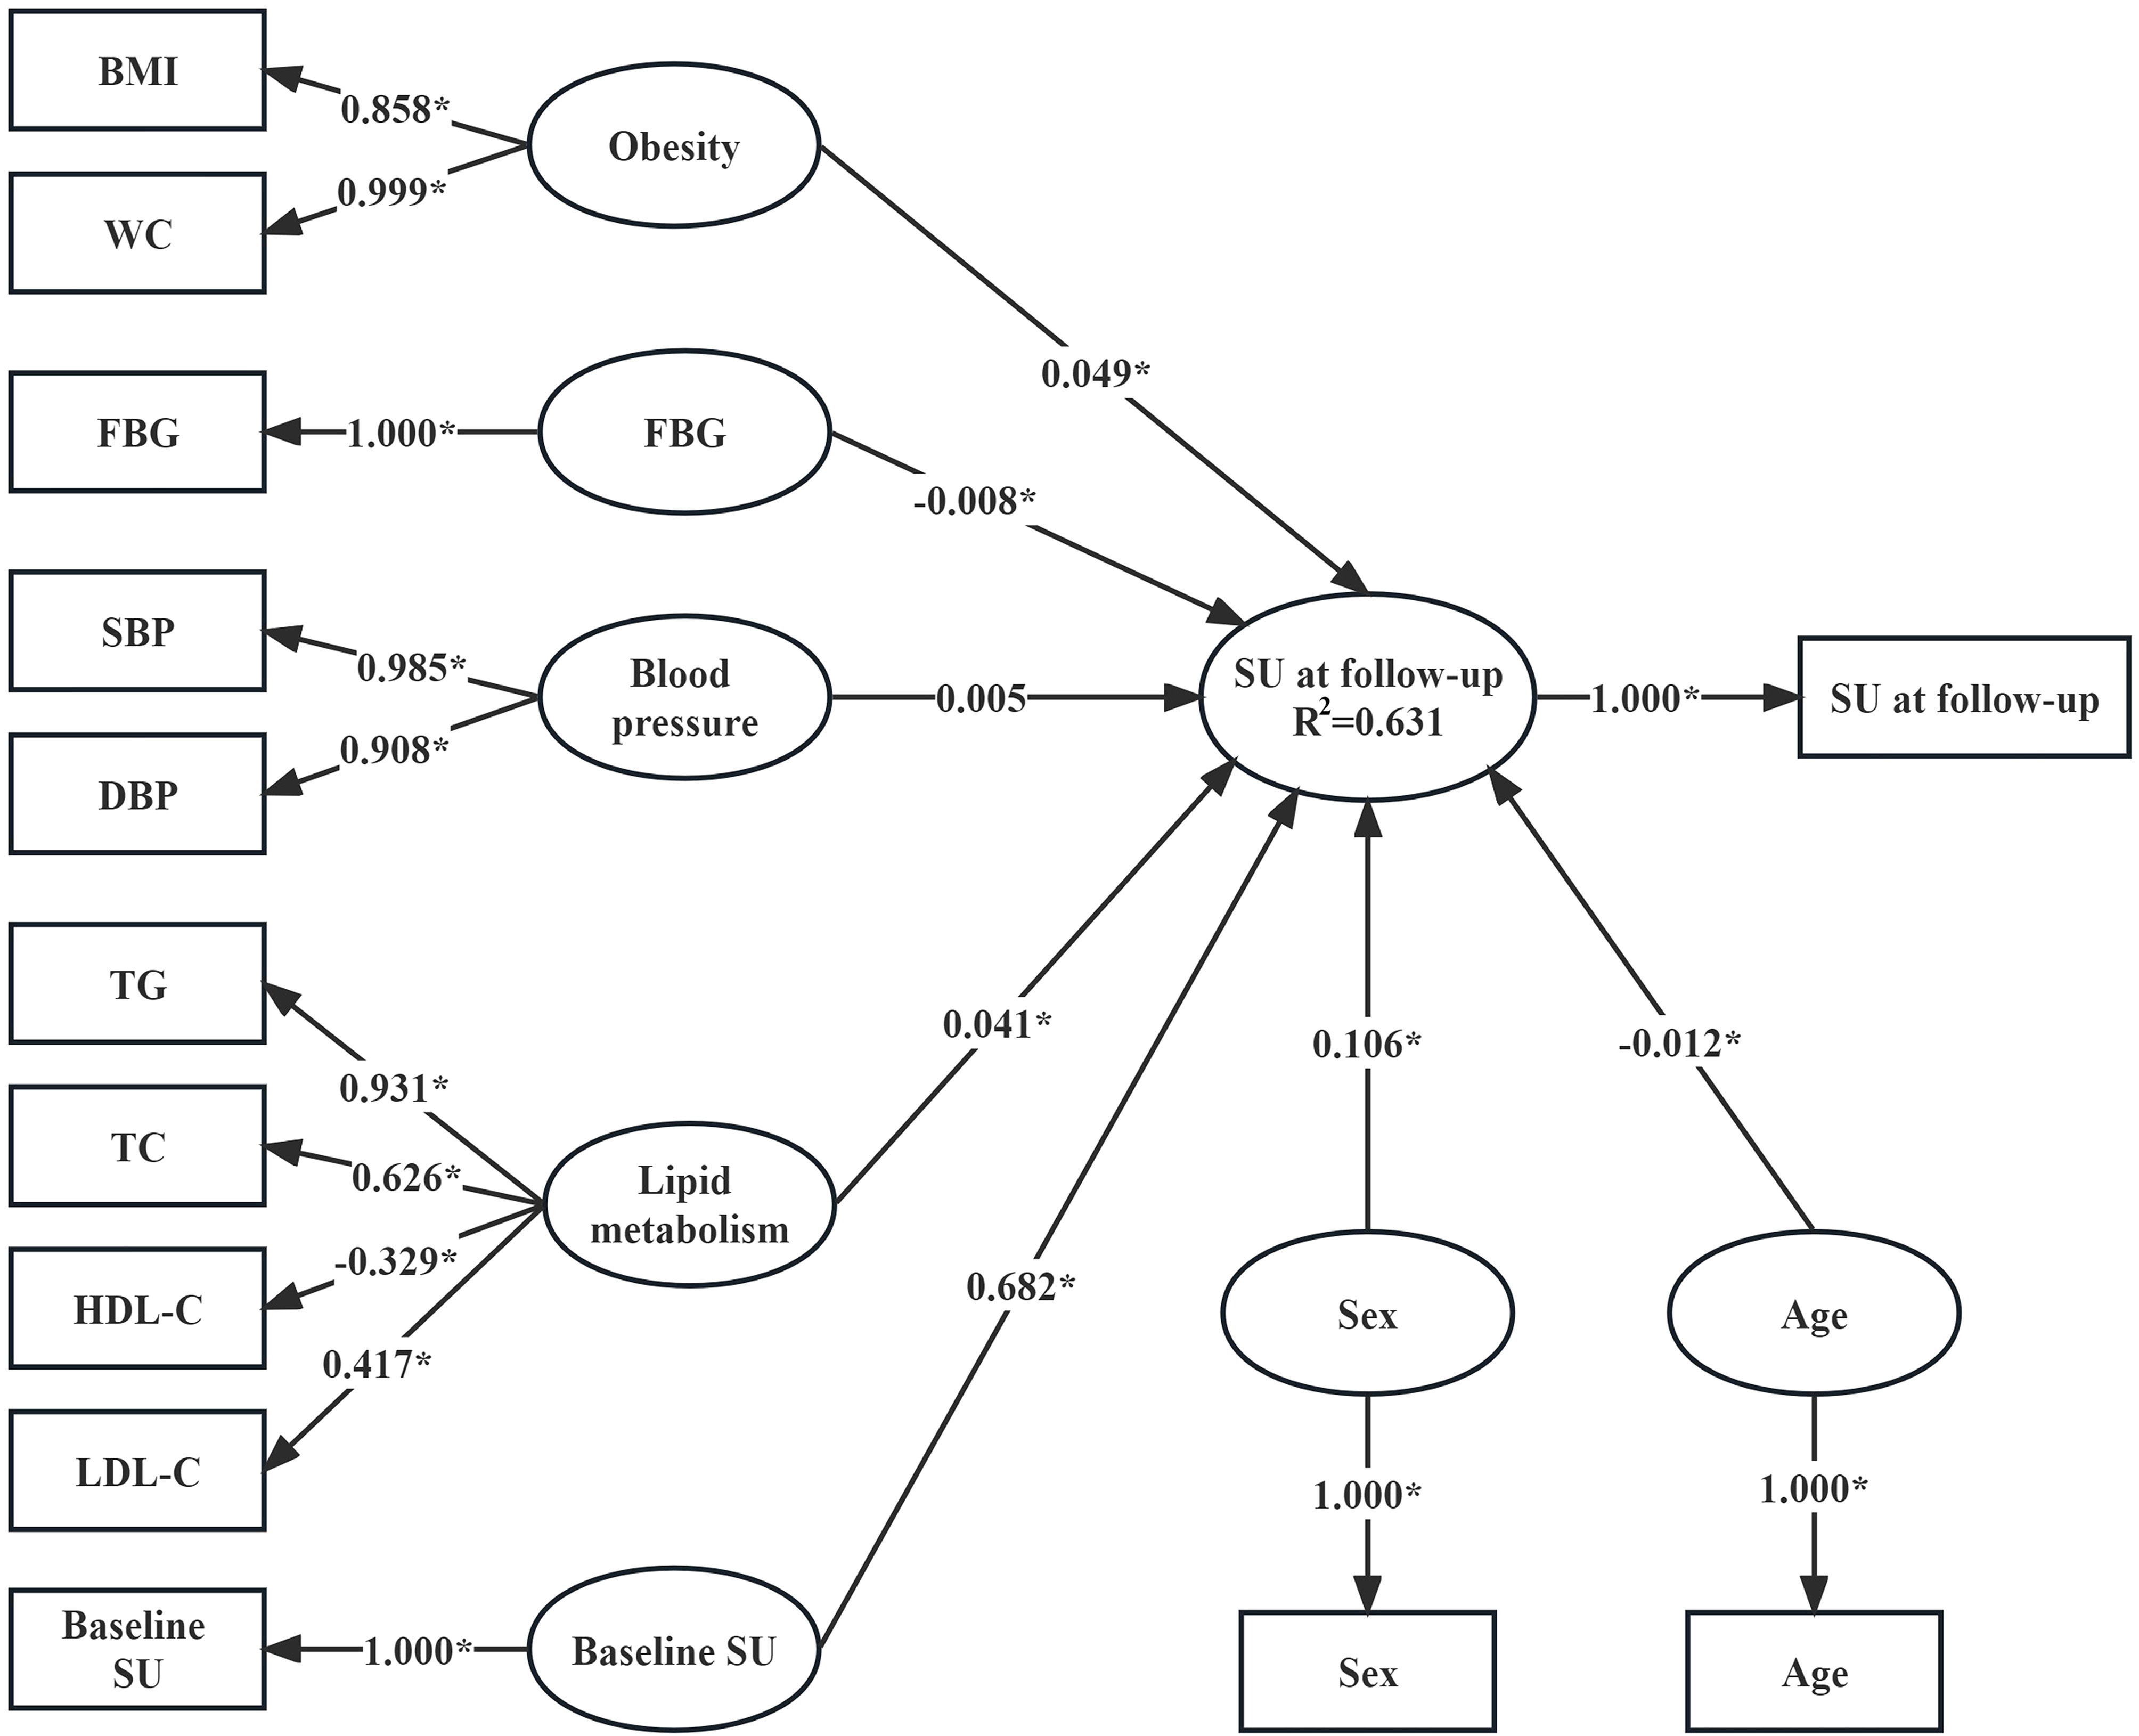
Figure 1 Association between SU concentrations at follow-up and baseline metabolism-related risk factors (n=48,979). Variables in the rectangle are observed variables, those in the ellipse are latent variables. Apart from SU at follow-up, which was measured at follow-up, the other observed variables were measured at baseline. The coefficients linking the latent variable “SU at follow-up” and other latent variables are the path coefficients (β coefficients) and they represent the direction and strength of the relations between the latent response variable “SU at follow-up” and other latent predictors. The coefficients linking the latent variables and the observed variables are the loadings (λ coefficients) and they represent in what direction and to what extent the observed variables reflect the latent variables. The R2 is the determination coefficient of the model where the latent “SU at follow-up” is the response variable and other latent variables are predictors, and it indicates the amount of variance in the latent response variable explained by its independent latent predictors. *P<0.05.
Subgroup and sensitivity analysis
Supplementary Table S3 showed no significant difference in the estimation of the latent variables, the loading of the observed variables and the R2 of the models of different follow-up period groups. The results remain largely unchanged when using the cut-offs reported in the URRAH project to define hyperuricemia (Supplementary Figure S2).
Associations of SU at follow-up with baseline FBG and age
Non-linear relationships were found between baseline FBG levels and SU at follow-up. A reversed U-shaped association was observed between baseline FBG concentration and SU at follow-up among men, with SU levels being highest when FBG concentration was approximately 6 mmol/L. In women, the SU at follow-up exhibited a positive relation with baseline FBG until the FBG concentration was approximately 7 mmol/L, then a phase of fluctuation of SU concentration was observed as FBG concentration progressed (Supplementary Figure S3). In addition, U-shaped relationships were found between baseline age and SU at follow-up, and the SU at follow-up was lowest when baseline age was approximately 57 years for men and 40 years for women (Supplementary Figure S4).
Discussion
In this study, we observed that the incidence density of hyperuricemia was 78/1000 person-years. A previous study showed that the incidence density of hyperuricemia was 68.6/1000 person-years in China (15), and another Chinese study showed it was 43.6/1000 person-years (16). We noticed the incidence density in this study was higher than the previous results. This might be the result of increasing incidence of hyperuricemia due to the changes in lifestyles in China. Another reason could be the differences in the cut-off value used to define hyperuricemia.
In PLSPM models, we found that baseline SU is the most important factor associated with SU at follow-up. Previous study demonstrated that the risk of hyperuricemia is increased 2.33 times for every 1 mg/dL increase in baseline SU (17). Therefore, monitoring of SU concentration, identifying of high-risk individuals early and determining appropriate interventions timely will help to delay the occurrence or reduce the incidence of hyperuricemia.
In this study, we found that higher level of serum TG, TC, and LDL-C is directly associated with higher SU levels, whereas higher level of HDL-C is inversely associated with SU level, which is in agreement with the previous studies (18, 19). Thus, we proposed that lipid metabolism might have a regulatory role in urate homeostasis (20). In addition, men had a higher SU level compared to women in our research, which is consistent with previous studies (21, 22). This might be attributed to the innate metabolic characteristics and the acquired personal lifestyle (preference for alcohol, smoking, meat, etc. (23)) of men. In addition, our research showed that baseline BMI and WC, the predisposing risk factors of obesity, were positively associated with SU at follow-up. This result is consistent with previous studies that indicated obesity was one of the risk factors of hyperuricemia (1, 24).
This study revealed a non-linear trend between baseline FBG and SU at follow-up. In men, the results suggest an initial rise in SU levels with increasing FBG up to a critical cut-off, which was consistent with the observations reported in previous research (8, 25). However, above the cut-off value of FBG, SU concentration decreases with the increase of FBG level. The inverse relationship between SU and FBG above the cut-off value can be explained by increased glomerular filtration at higher FBG level, resulting in increased excretion of urate (8). In terms of renal tubular reabsorption of urate from glomerular filtrate, it was suggested that glucose at higher concentrations might compete with urate during urate reabsorption in the proximal tubule (26, 27) but that has not yet been experimentally verified. We also found that the SU concentration in women increased rapidly after 40 years, which might be related to menopause (28, 29). In postmenopausal women, a lower estrogen level causes increased urate reabsorption, resulting in higher SU levels (30).
The strengths of the current study include a large sample size from the Han Chinese population in Beijing. Also, in this study we employed a relatively more updated approach called partial least squares path model (PLSPM; a structural equation model) to explore the interrelationship between SU and metabolism-related predisposing risk factors. This approach has its data-analytic capability and flexibility to include various important metabolism-related predisposing risk factors with a few restrictions on the distribution of variables (13). However, limitations should be noted. Personal lifestyle-related risk factors (e.g., smoking, drinking, physical activity, sedentary activity, sleep etc.) (31, 32) or drug usage (such as diuretics) (33) that may affect SU concentrations were not considered in this study due to data unavailable.
Conclusions
This study revealed the associations of SU levels with sex, age and several metabolism-related risk factors, emphasizing the importance of these metabolism-related risk factors in SU management.
Data availability statement
The authors are sure that all data and materials support the article. The datasets used in this study are available from the corresponding author upon reasonable request.
Ethics statement
The study has been approved by Medical Ethics Committee of Beijing Physical Examination Center. The participants in this study have given informed consent and patient anonymity has been preserved.
Author contributions
HL: Writing – review & editing. JZ: Formal analysis, Writing – original draft. HY: Formal analysis, Writing – review & editing. LD: Writing – review & editing. FL: Data curation, Formal analysis, Writing – review & editing. JW: Writing – review & editing.
Funding
The author(s) declare financial support was received for the research, authorship, and/or publication of this article. The study was funded by the National Natural Science Foundation of China (No.72274201) and the Interdisciplinary team of Health Science, Hospital Reform and Health Big Data”, School of Interdisciplinary Studies, RUC.
Acknowledgments
We thank the participants and the staff in Beijing Physical Examination Center for their contributions to this study.
Conflict of interest
The authors declare that the research was conducted in the absence of any commercial or financial relationships that could be construed as a potential conflict of interest.
Publisher’s note
All claims expressed in this article are solely those of the authors and do not necessarily represent those of their affiliated organizations, or those of the publisher, the editors and the reviewers. Any product that may be evaluated in this article, or claim that may be made by its manufacturer, is not guaranteed or endorsed by the publisher.
Supplementary material
The Supplementary Material for this article can be found online at: https://www.frontiersin.org/articles/10.3389/fendo.2023.1253470/full#supplementary-material
Abbreviations
BMI, body mass index; CI, confidence interval; DBP, diastolic blood pressure; FBG, fasting blood glucose; HbA1c, hemoglobin A1c, glycated hemoglobin that reflects average blood sugar level; HDL-C, high-density lipoprotein cholesterol; IQR, inter-quartile range; LDL-C, low-density lipoprotein cholesterol; n, number; OGTT, Oral glucose tolerance tests; PLSPM, partial least squares path model; SBP, systolic blood pressure; SU, serum urate; TC, total cholesterol; TG, total triglycerides; WC, waist circumference.
References
1. Zhu Y, Pandya BJ, Choi HK. Prevalence of gout and hyperuricemia in the US general population: the National Health and Nutrition Examination Survey 2007-2008. Arthritis Rheum (2011) 63:3136–41. doi: 10.1002/art.30520
2. Kumar AUA, Browne LD, Li X, Adeeb F, Perez-Ruiz F, Fraser AD, et al. Temporal trends in hyperuricaemia in the Irish health system from 2006-2014: A cohort study. PLoS One (2018) 13:e0198197. doi: 10.1371/journal.pone.0198197
3. Maloberti A, Qualliu E, Occhi L, Sun J, Grasso E, Tognola C, et al. Hyperuricemia prevalence in healthy subjects and its relationship with cardiovascular target organ damage. Nutr Metab Cardiovasc Dis (2021) 31:178–85. doi: 10.1016/j.numecd.2020.08.015
4. Maloberti A, Rebora P, Andreano A, Vallerio P, De Chiara B, Signorini S, et al. Pulse wave velocity progression over a medium-term follow-up in hypertensives: Focus on uric acid. J Clin Hypertens (Greenwich) (2019) 21:975–83. doi: 10.1111/jch.13603
5. Redon P, Maloberti A, Facchetti R, Redon J, Lurbe E, Bombelli M, et al. Gender-related differences in serum uric acid in treated hypertensive patients from central and east European countries: findings from the Blood Pressure control rate and CArdiovascular Risk profilE study. J Hypertens (2019) 37:380–8. doi: 10.1097/HJH.0000000000001908
6. Lohsoonthorn V, Dhanamun B, Williams MA. Prevalence of hyperuricemia and its relationship with metabolic syndrome in Thai adults receiving annual health exams. Arch Med Res (2006) 37:883–9. doi: 10.1016/j.arcmed.2006.03.008
7. Liu R, Han C, Wu D, Xia XH, Gu JQ, Guan HX, et al. Prevalence of hyperuricemia and gout in Mainland China from 2000 to 2014: A systematic review and meta-analysis. BioMed Res Int (2015) 2015:762820. doi: 10.1155/2015/762820
8. Li Q, Yang Z, Lu B, Wen J, Ye Z, Chen LL, et al. Serum uric acid level and its association with metabolic syndrome and carotid atherosclerosis in patients with type 2 diabetes. Cardiovasc Diabetol (2011) 10:72. doi: 10.1186/1475-2840-10-72
9. Liu DM, Jiang LD, Gan L, Su Y, Li F. Association between serum uric acid level and body mass index in sex- and age-specific groups in southwestern China. Endocr Pract (2019) 25:438–45. doi: 10.4158/EP-2018-0426
10. Duan Z, Fu J, Zhang FF, Cai Y, Wu G, Ma W, et al. The association between BMI and serum uric acid is partially mediated by gut microbiota. Microbiol Spectr (2023) 11:e0114023. doi: 10.1128/spectrum.01140-23
11. Multi-disciplinary expert task force on hyperuricemia and its related diseases, Zou HJ, Wu HS, Zhou JG, Zeng XJ, Dai L, et al. Chinese multi-disciplinary consensus on the diagnosis and treatment of hyperuricemia and its related diseases. Chin J Intern Med (2017) 56:235–48. doi: 10.3760/cma.j.issn.0578-1426.2017.03.021
12. Maloberti A, Giannattasio C, Bombelli M, Desideri G, Cicero AFG, Muiesan ML, et al. Hyperuricemia and risk of cardiovascular outcomes: the experience of the URRAH (Uric acid right for heart health) project. High Blood Press Cardiovasc Prev (2020) 27(2):121–8. doi: 10.1007/s40292-020-00368-z
13. Tenenhaus M, Vinzi VE, Chatelinc YM, Laurob C. PLS path modeling. Comput Stat Data Anal (2005) 48:159–205. doi: 10.1016/j.csda.2004.03.005
14. Sanchez G. PLS Path Modeling with R. Berkeley (2013). Available at: http://www.gastonsanchez.com/PLS.
15. Ni Q, Lu X, Chen C, Du H, Zhang R. Risk factors for the development of hyperuricemia: A STROBE-compliant cross-sectional and longitudinal study. Med (Baltimore) (2019) 98:e17597. doi: 10.1097/MD.0000000000017597
16. Zeng C, Wei J, Yang T, Li H, Xiao WF, Luo W, et al. Higher blood hematocrit predicts hyperuricemia: a prospective study of 62,897 person-years of follow-up. Sci Rep (2015) 5:13765. doi: 10.1038/srep13765
17. McAdams-DeMarco MA, Law A, Maynard JW, Coresh J, Baer AN. Risk factors for incident hyperuricemia during mid-adulthood in African American and white men and women enrolled in the ARIC cohort study. BMC Musculoskelet Disord (2013) 14:347. doi: 10.1186/1471-2474-14-347
18. Xu J, Peng H, Ma QH, Zhou XH, Xu WX, Huang L, et al. Associations of non-high density lipoprotein cholesterol and traditional blood lipid profiles with hyperuricemia among middle-aged and elderly Chinese people: a community-based cross-sectional study. Lipids Health Dis (2014) 13:117. doi: 10.1186/1476-511X-13-117
19. Peng TC, Wang CC, Kao TW, Chan JY, Yang YH, Chang YW, et al. Relationship between hyperuricemia and lipid profiles in US adults. BioMed Res Int (2015) 2015:127596. doi: 10.1155/2015/127596
20. Maloberti A, Vanoli J, Finotto A, Bombelli M, Facchetti R, Redon P, et al. Uric acid relationships with lipid profile and adiposity indices: Impact of different hyperuricemic thresholds. J Clin Hypertens (Greenwich) (2023) 25:78–85. doi: 10.1111/jch.14613
21. Zitt E, Fischer A, Lhotta K, Concin H, Nagel G. Sex- and age-specific variations, temporal trends and metabolic determinants of serum uric acid concentrations in a large population-based Austrian cohort. Sci Rep (2020) 10:7578. doi: 10.1038/s41598-020-64587-z
22. Kim Y, Kang J, Kim GT. Prevalence of hyperuricemia and its associated factors in the general Korean population: an analysis of a population-based nationally representative sample. Clin Rheumatol (2018) 37:2529–38. doi: 10.1007/s10067-018-4130-2
23. Yu SS, Yang HM, Guo XF, Zhang XG, Zhou Y, Ou QY, et al. Prevalence of hyperuricemia and its correlates in rural Northeast Chinese population: from lifestyle risk factors to metabolic comorbidities. Clin Rheumatol (2016) 35:1207–15. doi: 10.1007/s10067-015-3051-6
24. Trifirò G, Morabito P, Cavagna L, Ferrajolo C, Pecchioli S, Simonetti M, et al. Epidemiology of gout and hyperuricaemia in Italy during the years 2005-2009: a nationwide population-based study. Ann Rheum Dis (2013) 72:694–700. doi: 10.1136/annrheumdis-2011-201254
25. Cheserek MJ, Shi Y, Le G. Association of hyperuricemia with metabolic syndrome among university workers: sex and occupational differences. Afr Health Sci (2018) 18:842–51. doi: 10.4314/ahs.v18i4.2
26. Tuomilehto J, Zimmet P, Wolf E, Taylor R, Ram P, King H. Plasma uric acid level and its association with diabetes mellitus and some biologic parameters in a biracial population of Fiji. Am J Epidemiol (1988) 127:321–36. doi: 10.1093/oxfordjournals.aje.a114807
27. Herman JB, Medalie JH, Goldbourt U. Diabetes, prediabetes and uricaemia. Diabetologia (1976) 12:47–52. doi: 10.1007/BF01221964
28. Hak AE, Choi HK. Menopause, postmenopausal hormone use and serum uric acid levels in US women–the Third National Health and Nutrition Examination Survey. Arthritis Res Ther (2008) 10:R116. doi: 10.1186/ar2519
29. Lin KC, Lin HY, Chou P. Community based epidemiological study on hyperuricemia and gout in Kin-Hu, Kinmen. J Rheumatol (2000) 27:1045–50.
30. Koga M, Saito H, Mukai M, Kasayama S, Yamamoto T. Factors contributing to increased serum urate in postmenopausal Japanese females. Climacteric (2009) 12:146–52. doi: 10.1080/13697130802607719
31. Ryu S, Chang Y, Zhang Y, Kim SG, Cho J, Son HJ, et al. A cohort study of hyperuricemia in middle-aged South Korean men. Am J Epidemiol (2012) 175:133–43. doi: 10.1093/aje/kwr291
32. Park DY, Kim YS, Ryu SH, Jin YS. The association between sedentary behavior, physical activity and hyperuricemia. Vasc Health Risk Manag (2019) 15:291–9. doi: 10.2147/VHRM.S200278
Keywords: incidence density, hyperuricemia, serum urate, metabolism-related risk factor, cohort study
Citation: Liang H, Zhang J, Yu H, Ding L, Liu F and Wang J (2023) Incidence density of hyperuricemia and association between metabolism-related predisposing risk factors and serum urate in Chinese adults: a cohort study. Front. Endocrinol. 14:1253470. doi: 10.3389/fendo.2023.1253470
Received: 05 July 2023; Accepted: 03 November 2023;
Published: 07 December 2023.
Edited by:
Åke Sjöholm, Gävle Hospital, SwedenReviewed by:
Alessandro Maloberti, University of Milano Bicocca, ItalyAsim Kumar Mandal, Brigham and Women’s Hospital and Harvard Medical School, United States
Copyright © 2023 Liang, Zhang, Yu, Ding, Liu and Wang. This is an open-access article distributed under the terms of the Creative Commons Attribution License (CC BY). The use, distribution or reproduction in other forums is permitted, provided the original author(s) and the copyright owner(s) are credited and that the original publication in this journal is cited, in accordance with accepted academic practice. No use, distribution or reproduction is permitted which does not comply with these terms.
*Correspondence: Jun Wang, aHByZTY2NkAxMjYuY29t