
94% of researchers rate our articles as excellent or good
Learn more about the work of our research integrity team to safeguard the quality of each article we publish.
Find out more
REVIEW article
Front. Endocrinol., 16 October 2023
Sec. Cancer Endocrinology
Volume 14 - 2023 | https://doi.org/10.3389/fendo.2023.1248575
This article is part of the Research TopicAltered Metabolic Traits in Gastrointestinal Tract CancersView all 6 articles
 Arnaud Jannin1,2
 Anne-Frédérique Dessein1Christine Do Cao2Marie-Christine Vantyghem2
 Benjamin Chevalier3
 Isabelle Van Seuningen1*
 Nicolas Jonckheere1†
 Lucie Coppin1†
Introduction: Reprogramming of cellular metabolism is now a hallmark of tumorigenesis. In recent years, research on pancreatic neuroendocrine tumors (pNETs) has focused on genetic and epigenetic modifications and related signaling pathways, but few studies have been devoted to characterizing the metabolic profile of these tumors. In this review, we thoroughly investigate the metabolic pathways in pNETs by analyzing the transcriptomic and metabolomic data available in the literature.
Methodology: We retrieved and downloaded gene expression profiles from all publicly available gene set enrichments (GSE43797, GSE73338, and GSE117851) to compare the differences in expressed genes based on both the stage and MEN1 mutational status. In addition, we conducted a systematic review of metabolomic data in NETs.
Results: By combining transcriptomic and metabolomic approaches, we have identified a distinctive metabolism in pNETs compared with controls without pNETs. Our analysis showed dysregulations in the one-carbon, glutathione, and polyamine metabolisms, fatty acid biosynthesis, and branched-chain amino acid catabolism, which supply the tricarboxylic acid cycle. These targets are implicated in pNET cell proliferation and metastasis and could also have a prognostic impact. When analyzing the profiles of patients with or without metastasis, or with or without MEN1 mutation, we observed only a few differences due to the scarcity of published clinical data in the existing research. Consequently, further studies are now necessary to validate our data and investigate these potential targets as biomarkers or therapeutic solutions, with a specific focus on pNETs.
It has been a century since the 1923 publication of Otto Warburg’s paper, which first described alterations in cancer metabolism compared to surrounding healthy tissue (1). Reprogramming of cellular metabolism has now become a hallmark of tumorigenesis (2–4) and has been implicated in tumor initiation, proliferation, metastasis, and chemoresistance (5–8). However, the main pathways involved in cancer metabolic plasticity may vary according to cancer type and thus require specific clarification. These aspects are particularly relevant in the case of pancreatic neuroendocrine tumors (pNETs), as only a few studies have explored their metabolism. pNETs are rare tumors, accounting for only 3%–5% of all cases of pancreatic neoplasms (9), and they originate from pancreatic hormone-producing cells (islet cells). Over the past decades, an increased incidence of pNETs has been observed due to improvements in imaging, endoscopy, and biomarker detection technologies (9–12). Despite these advances, overall survival (OS) rates have remained relatively unchanged (10).
pNETs display tumor heterogeneity depending on several factors: 1) WHO tumor grade, 2) functional status (hormone secretion), 3) stage, and 4) the genetic and epigenetic molecular signatures. For example, well-differentiated non-functional pNETs commonly have mutations in MEN1, ATRX, and DAXX, as well as activation of specific pathways such as mTOR, contrary to TP53 and RB1 mutations, which are found in more aggressive pancreatic neuroendocrine carcinomas (13–21). Many studies on pNETs have been dedicated to describing genetic or epigenetic abnormalities and their associated signaling pathways (13, 21–25). However, to the best of our knowledge, no studies have specifically investigated the metabolism of pNETs.
In addition to these now increasingly considered aspects, it is important to study the metabolism of each tumor type and identify common characteristics to establish metabolomic signatures (or biomarkers) that can predict the tumor type, its aggressiveness, and the patient’s prognostic outcome (26). A better understanding of tumor metabolism would also provide essential information for developing new therapeutic strategies, which are still lacking in this field. Several large-scale studies have used transcriptomics to compare metabolic pathways between cancer and adjacent normal tissue, as well as between different cancer types showing dysregulated genes involved in the tricarboxylic acid (TCA) cycle, oxidative phosphorylation (OXPHOS), and amino acid, fatty acid (FA), and vitamin metabolism (27, 28). The objective of this review is to describe the metabolic pathway features of pNETs by analyzing available transcriptomic and metabolomic data from the perspective of metabolic genes.
In the present study, we retrieved and downloaded gene expression profiles and clinical data (TMN stage and molecular profile) from all gene expression data series (GSE) datasets available in the Gene Expression Omnibus (GEO) database (http://www.ncbi.nlm.nih.gov/geo/) (GSE43797, GSE73338, and GSE117851). These datasets were used to compare differentially expressed genes (DEGs) across different pNET datasets using the GEO2R tool (Figure 1). Only DEGs with an adjusted p-value < 0.05 were included in the analysis.
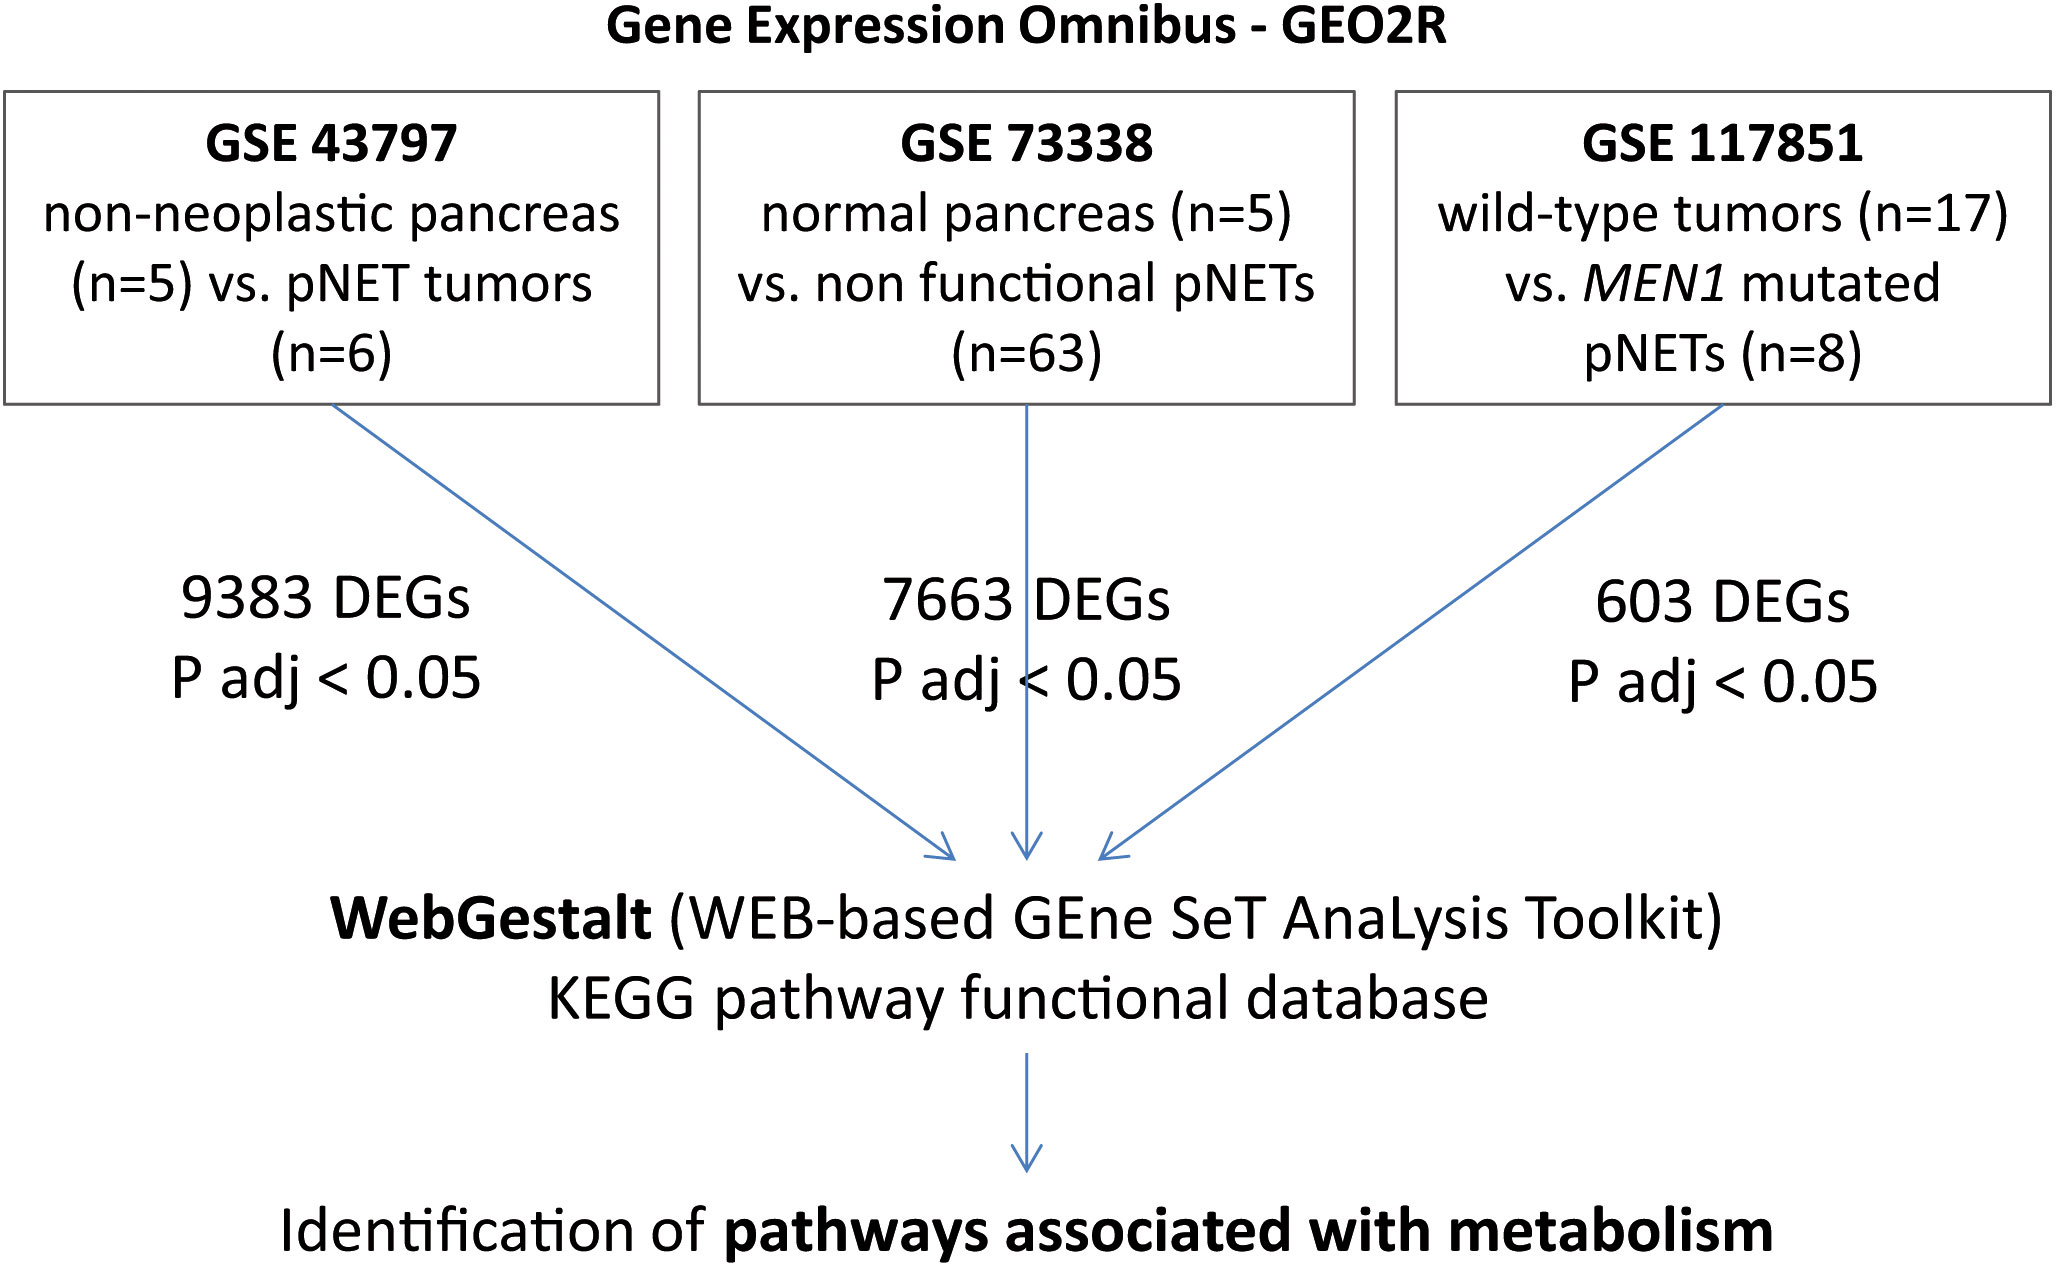
Figure 1 GSEA and WebGestalt analysis methodology. In GSE43797, mRNA expression in pNETs (n = 6) and non-neoplastic pancreatic tissues (n = 5). In GSE73338, we selected 63 non-functional pNETs and 5 normal pancreas samples. In GSE117851, among 47 pNET tumor specimens, 8 presented with MEN1 mutation and 17 were wild-type. Only DEGs with an adjusted p-value < 0.05 were included. GSEA, gene set enrichment analysis; pNETs, pancreatic neuroendocrine tumors; DEGs, differentially expressed genes; ADJ, adjusted; MEN1, multiple endocrine neoplasia type 1.
GSE43797 was used to characterize mRNA expression in well-differentiated and non-functional pNETs (n = 6, including three with lymph node extension and two with metastasis) and non-neoplastic pancreatic tissues (n = 5 showed no evidence of chronic pancreatitis or preneoplastic lesions) (29). GSE73338 consists of a large panel of non-functional pNETs (23) (n = 63) from a global cohort that is 42% male, with an average age of 53 years (range 17–78), and an average tumor size of 30 mm. The dataset also included five normal pancreas samples without chronic pancreatitis or preneoplastic lesions (22). The MEN1 mutation status was unknown for GSE43797 and GSE73338. GSE117851, however, consists of 47 well-differentiated pNETs of WHO grade G1/G2, including MEN1 mutations (n = 8) or wild-type mutations (n = 17) (global cohort: 59% male, average age 52 years [range 26–73], average tumor size 36 mm) (24). The data were extracted and annotated. Functional enrichment analysis was conducted using WebGestalt (WEB-based GEne SeT AnaLysis Toolkit) (http://www.webgestalt.org/) (30). Gene set enrichment analysis was carried out with the Kyoto Encyclopedia of Genes and Genomes (KEGG) functional database, and log-fold changes were used to rank DEGs. Each target identified by KEGG and WebGestalt was subsequently studied in the literature to define its functional role.
Metabolites are the final products of cellular regulatory processes and are the closest -omic layer to the tumor phenotype. Their levels could thus represent the ultimate response of biological systems to genetic and environmental changes. As a result, there has been a growing interest in using metabolomics to identify biomarkers of tumor phenotypes (31, 32). As part of this study, we conducted a systematic review of the literature on metabolomic data in NET to identify dysregulated metabolites.
We identified 9,383 DEGs (adjusted p-value < 0.05) in pNETs compared with non-neoplastic pancreas samples using data from GSE43797 (Figure 2A and Table 1). We used the gene set enrichment analysis (GSEA) computational method to identify sets of enriched genes (Figure 2B). Notably, we observed the enrichment of Gene Ontology (GO) terms corresponding to specific functions (Figure 2C and Table 1):
- one-carbon metabolism (glycine, serine, and threonine metabolism) (CBS, GNMT, PHGDH, PSAT1, GCAT, CTH, AMT, SARDH, SHMT1, and AOC3),
- glutathione metabolism and redox balance (GSTA2, GSTA1, ANPEP, GSTA5, GGT6, OPLAH, MGST1, CHAC1, SRM, GST3, IDH2, and GSTP1),
- creatine metabolism (GATM and GAMT),
- polyamine synthesis (SRM),
- fatty acid metabolism and signaling (CPT IC, ELOVL 4-6, HACD1, ACAA2, HACD3, ABHD17B, and ACLY),
- branched-chain amino acid metabolism (valine, leucine, and isoleucine degradation) (BCKDHA), and
- signaling pathways (ATF4, CHAC1, and mTOR).
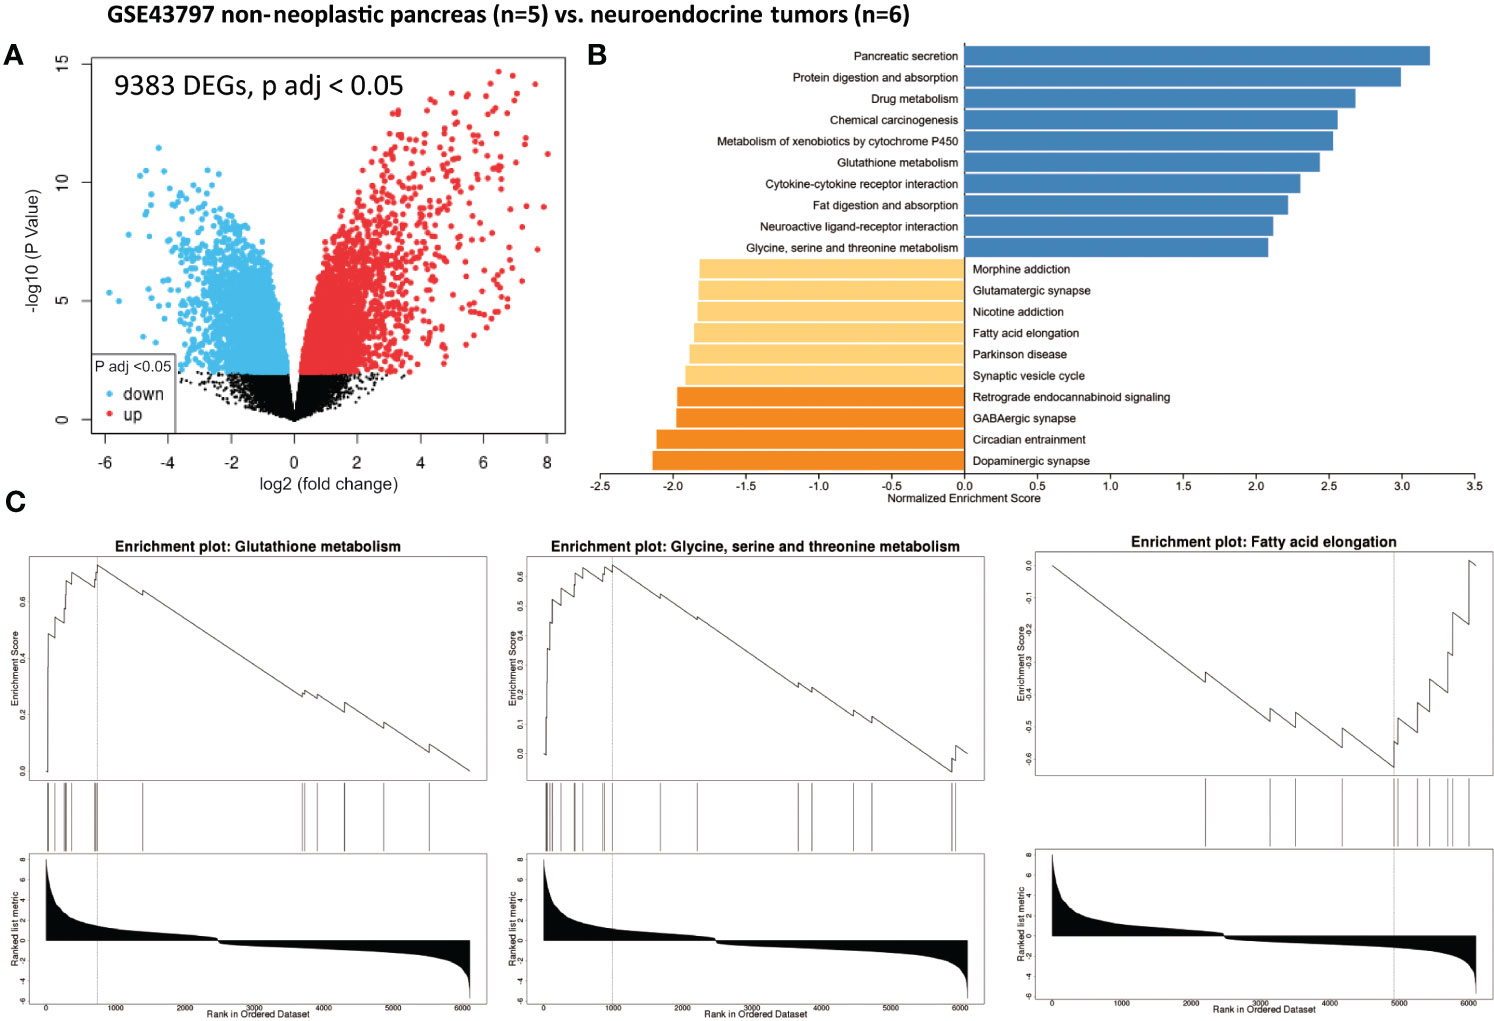
Figure 2 Gene set enrichment analysis (GSEA) from patients with non-neoplastic pancreas vs. well-differentiated and non-functional primitive pancreatic neuroendocrine tumors (GSE43797). (A) Volcano plot of DEGs (log2 fold change). Adjusted p-value < 0.05. (B) GSEA of DEGs using the WebGestalt tool. (C) Major enrichment GO plots corresponding to metabolism-associated KEGG term. GSEA, gene set enrichment analysis; DEGs, differentially expressed genes; GO, Gene Ontology; KEGG, Kyoto Encyclopedia of Genes and Genomes.
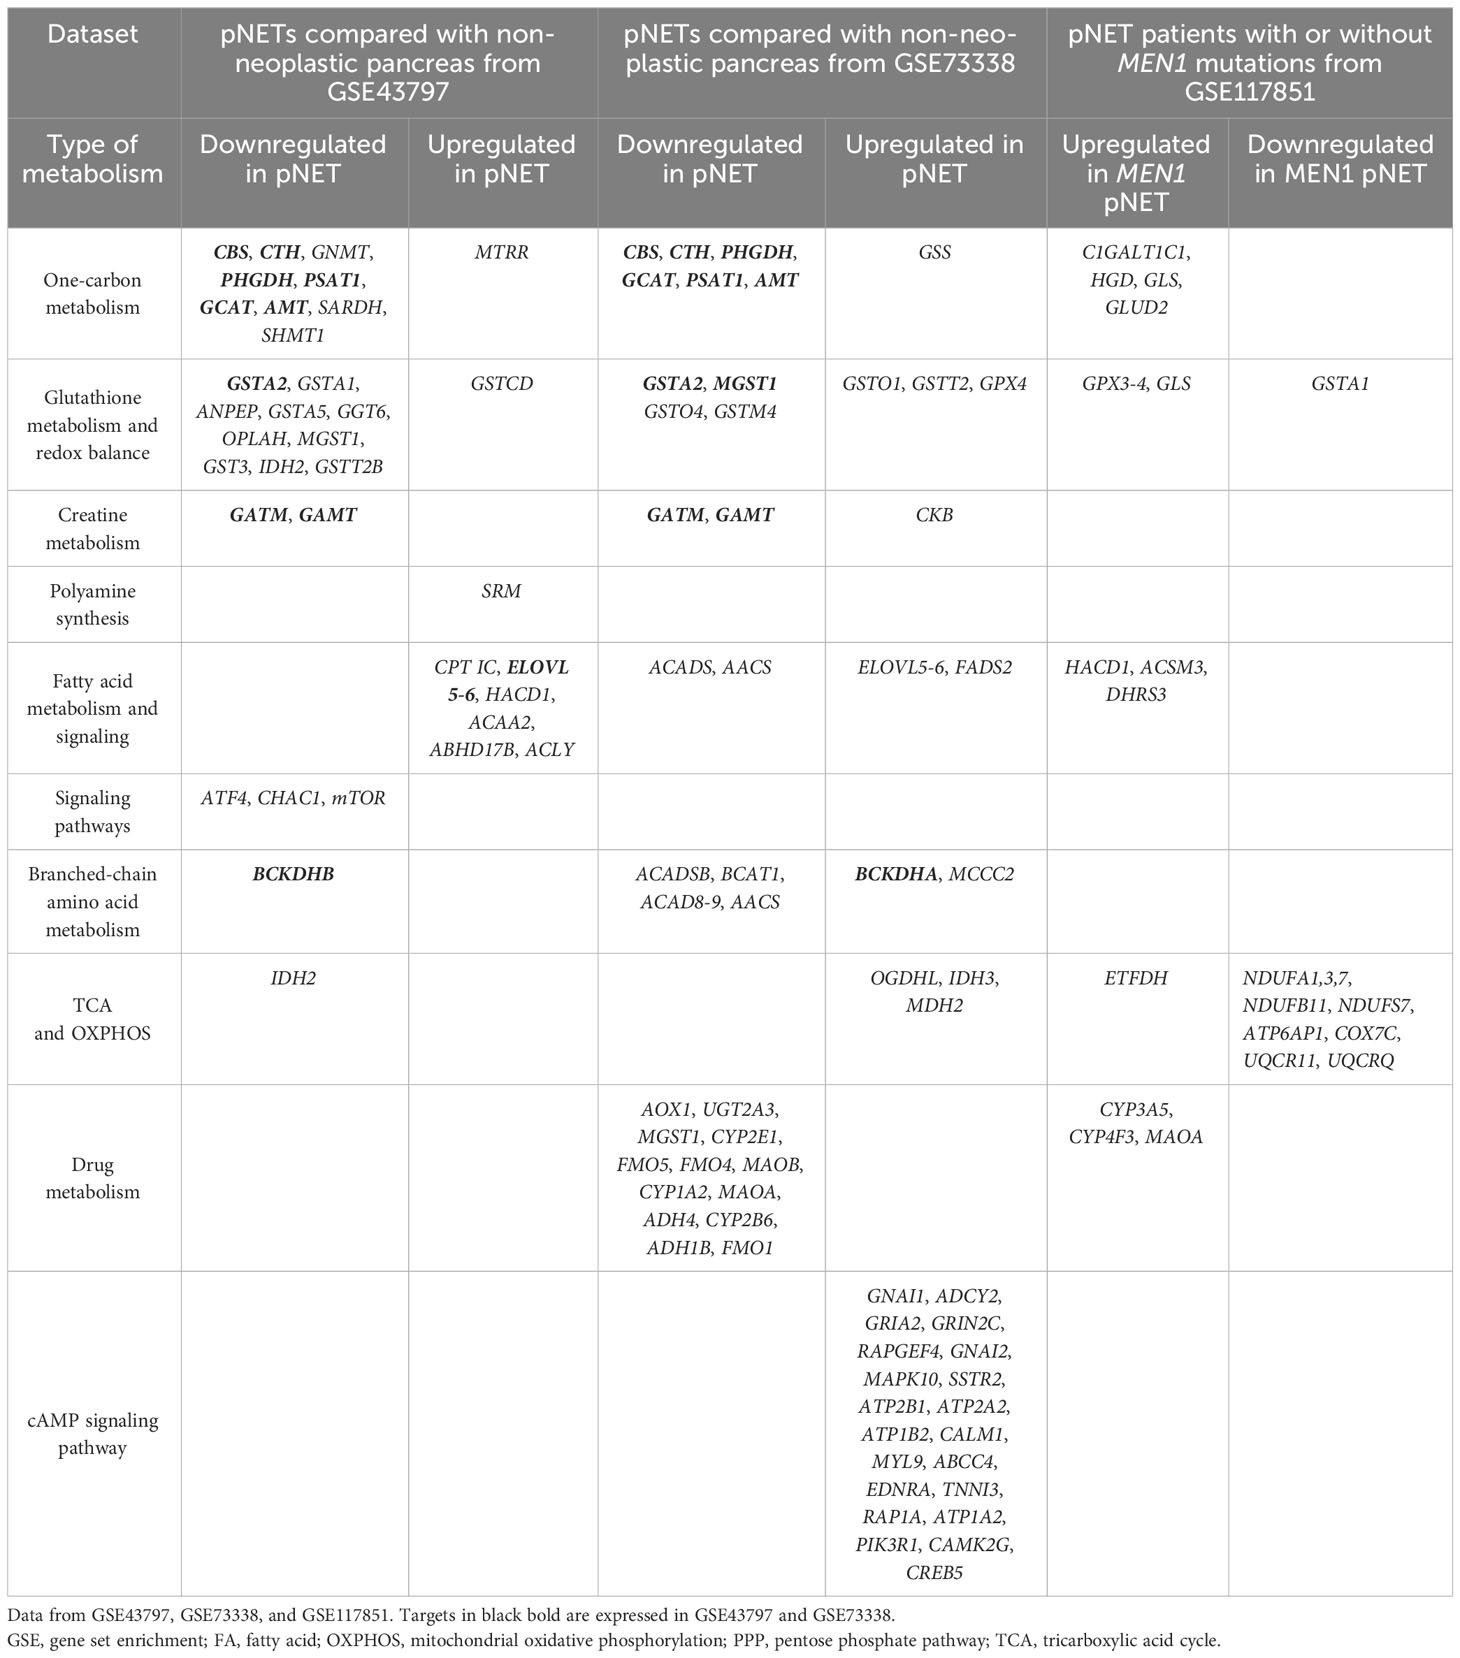
Table 1 Differentially expressed genes in pancreatic neuroendocrine tumors compared with non-neoplastic pancreas tissue.
Additionally, we compared pNETs from either men (n = 4) or women (n = 2) with non-neoplastic pancreatic tissue (gender not documented in GEO2R) from the GSE43797 dataset. In men, 5,801 were found to be dysregulated, while in women, 3,845 genes were dysregulated. Both lists had 3,041 DEGs in common.
We also analyzed 63 non-functional pNET and five normal pancreas samples extracted from GSE73338. In this dataset, we identified 7,663 genes that were significantly dysregulated (adjusted p-value < 0.05) (Figure 3A and Table 1). Utilizing GSEA (Figure 3B and Table 1), we observed an enrichment of metabolism-associated GO terms, including the following (Figure 3C and Table 1):
- one-carbon metabolism (glycine, serine, and threonine metabolism) (GATM, CTH, PHGDH, GCAT, CBS, PSAT1, GAMT, and AMT),
- glutathione metabolism and redox balance (GSTA2, GSTO1, GSTO4, GSTM4, and GPX4),
- creatine metabolism (GATM, GAMT, and CKB),
- fatty acid metabolism (ACADS, AACS, and FADS2),
- branched-chain amino acid metabolism (valine, leucine, and isoleucine degradation) (BCKDHA, ACADSB, BCAT1, AOX1, ACAD8, and MCCC2),
- drug metabolism (AOX1, UGT2A3, CYP2E1, FMO5, FMO4, MAOB, CYP1A2, MAOA, ADH4, GSTM4, CYP2B6, ADH1B, and FMO1),
- cAMP signaling pathway (GNAI1, ADCY2, GRIA2, GRIN2C, RAPGEF4, GNAI2, MAPK10, SSTR2, ATP2B1, ATP2A2, ATP1B2, CALM1, MYL9, ABCC4, EDNRA, TNNI3, RAP1A, ATP1A2, PIK3R1, CAMK2G, and CREB5), and
- TCA cycle (OGDHL, IDH3, and MDH2).
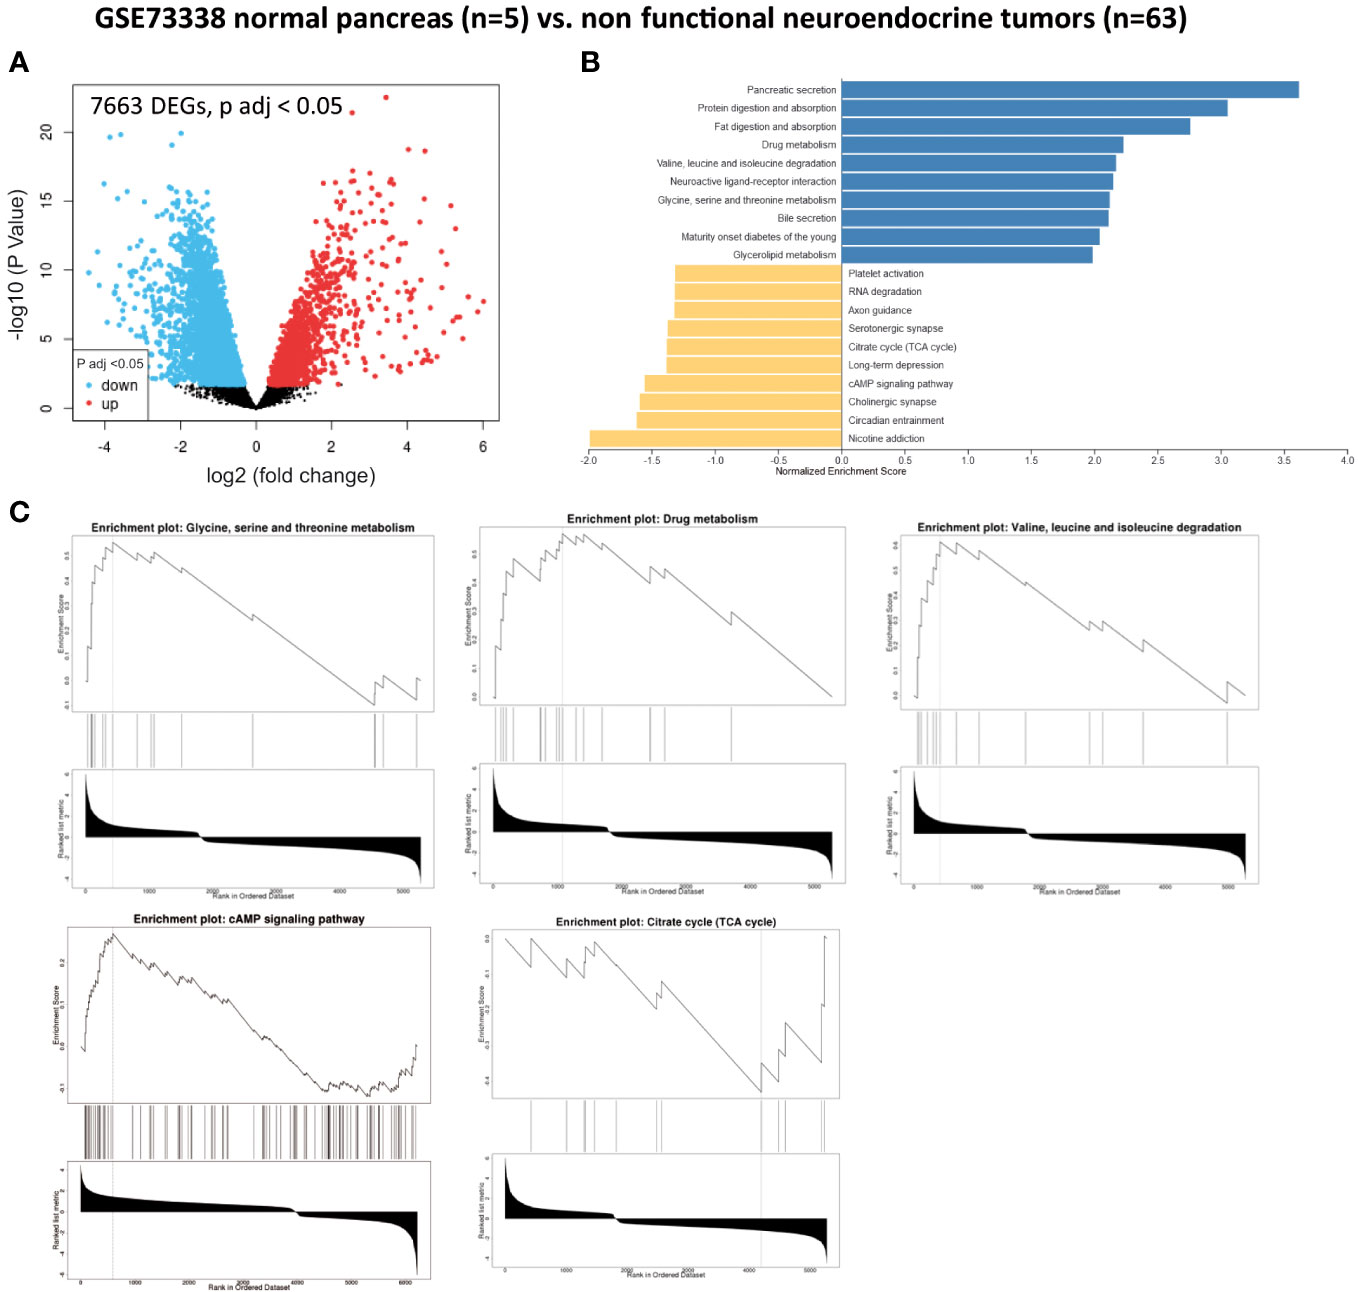
Figure 3 Gene set enrichment analysis (GSEA) from patients without pancreatic lesions compared with patients with well-differentiated and non-functional primitive pancreatic neuroendocrine tumors (GSE73338). (A) Volcano plot of DEGs (log2 fold change). Adjusted p-value < 0.05. (B) GSEA of DEGs using the WebGestalt tool. (C) Major enrichment GO plots corresponding to metabolism-associated KEGG term. GSEA, gene set enrichment analysis; DEGs, differentially expressed genes; GO, Gene Ontology; KEGG, Kyoto Encyclopedia of Genes and Genomes.
In addition, we compared DEGs in pNETs versus normal pancreas samples from GSE43797 and GSE73338 and obtained a common list of 2,193 altered DEGs from both datasets.
Non-functional pNET transcriptomic samples (n = 63) were compared with liver metastasis samples from non-functional pNETs (n = 7) using GSE73338. No differences were found in the previously mentioned major metabolic families (one-carbon metabolism, fatty acid synthesis, creatine biosynthesis, TCA, etc.). Only 69 DEGs were statistically significant (adjusted p-value < 0.05). Among them, a significant variation in targets impacted in metabolism was observed (Figure 4): GYS2, NAT8L, TDO2, RDH16, DAO, and DPYS.
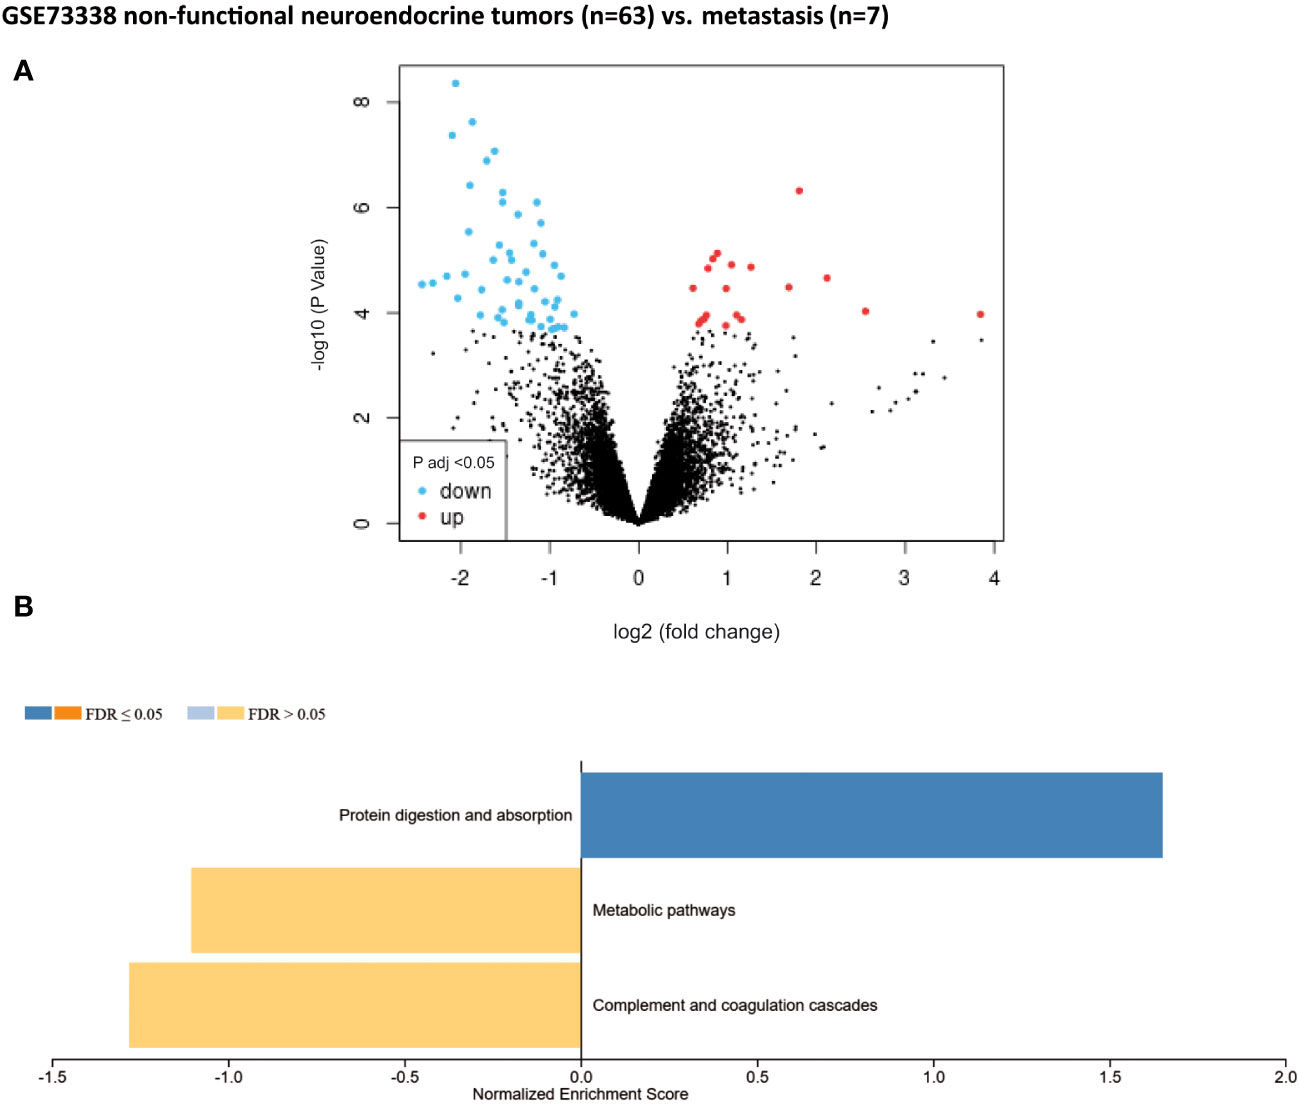
Figure 4 Gene set enrichment analysis (GSEA) from patients without metastasis. Well-differentiated, non-functional pNETs compared with metastatic non-functional pNETs (GSE73338). (A) Volcano plot of DEGs (log2 fold change). Adjusted p-value < 0.05. (B) GSEA of DEGs using the WebGestalt tool. DEGs, differentially expressed genes.
A total of 603 DEGs were extracted from GSE117851 by comparing non-functional pNETs based on whether or not they had MEN1 mutations (Figure 5A). GSEA was subsequently conducted (Figure 5B) and showed an alteration of metabolism-associated KEGG GO terms (Figure 5C). In pNETs with MEN1 mutations, an increased normalized enrichment score was observed (Table 1):
- one-carbon metabolism (glycine, serine, and threonine metabolism) (C1GALT1C1, HGD, GLS, and GLUD2),
- glutathione metabolism and redox balance (GPX3-4 and GLS),
- fatty acid metabolism and signaling (HACD1, ACSMB, and DHRS), and
- other metabolic pathways (in the urea cycle (ASS1), tyrosine and phenylalanine (HGD), serine and threonine (C1GALT1C1), oxalate (HAO1), taurine (CDO1), choline (PEMT) ketogenesis (HMGCS2), glycerol metabolism (GK), amine metabolism (MAOA), biotin (BTD) and nucleotide biosynthesis (PRPS1), and glucose metabolism (PCK2)) (Figure 5C).
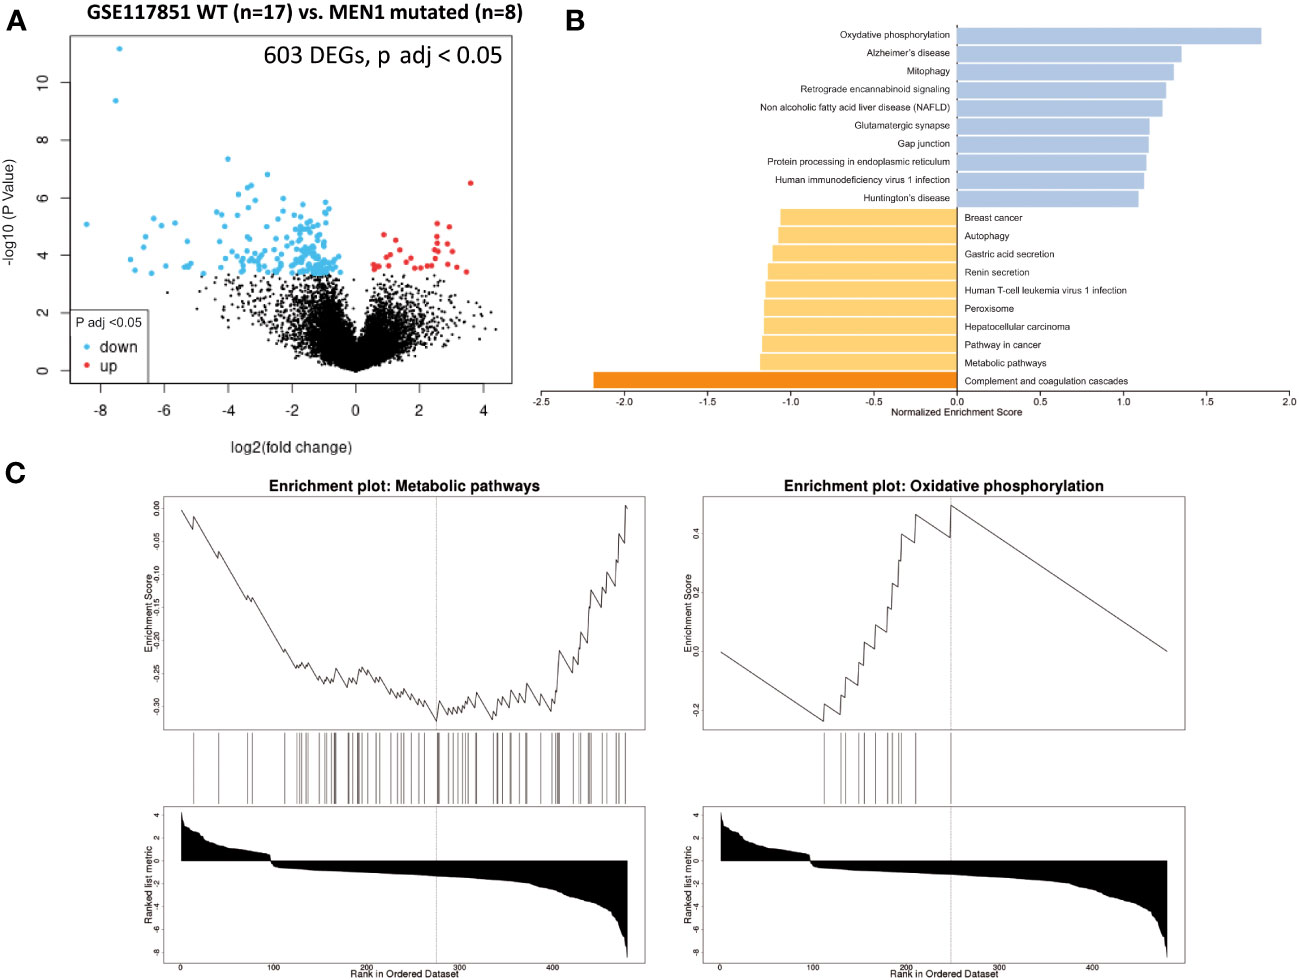
Figure 5 GSEA comparing pNET wild-type patients with NEM1-mutated pNET patients. Gene set enrichment analysis (GSEA) from patients with wild-type, well-differentiated, and non-functional primitive pNETs compared with NEM-mutated patients (GSE117851). (A) Volcano plot of DEGs (log2 fold change). Adjusted p-value < 0.05. (B) GSEA of DEGs using the WebGestalt tool. (C) Major enrichment GO plots corresponding to metabolism-associated KEGG term. GSEA, gene set enrichment analysis; DEGs, differentially expressed genes; GO, Gene Ontology; KEGG, Kyoto Encyclopedia of Genes and Genomes.
A decreased normalized enrichment score was noted in oxidative phosphorylation for NDUFA1, NDUFA3, NDUFA7, NDUFB11, NDUFS7, ATP6AP1, COX7C, UQCR11, and UQCRQ.
The metabolome of gastroenteropancreatic neuroendocrine tumors (GEP-NETs) has been explored by very few researchers (33–35). In 2013, Kinross et al. (Table 2) were the first to apply a 1H nuclear magnetic resonance spectroscopic profiling (1H NMR) technique to analyze urine from a prospective cohort of 28 patients with GEP-NETs (including 8 small intestine NETs (SI-NETs) and 10 pNETs) (33). They observed a decrease in the concentration of creatine, citrate, and hippurate in the urine of patients with GEP-NETs compared with controls. Another study by Imperiale et al. (2019) (Table 2) focused on SI-NETs, related hepatic metastases, and normal SI pathological tissues, using 1H-magic angle spinning (HRMAS) NMR spectroscopy (34). They identified and quantified 27 metabolites and observed that SI-NETs were characterized by higher concentrations of succinate, glutathione, taurine, myoinositol, and glycero-phosphocholine. SI-NET samples with aggressive profiles had lower concentrations of glucose, serine, and glycine and increased levels of choline-containing compounds, taurine, lactate, and alanine. Liver metastases were differentiated from normal hepatic parenchyma based on a higher abundance of acetate, succinate, choline, phosphocholine, taurine, lactate, and aspartate. In comparison, higher levels of alanine, ethanolamine, glycerol-phosphocholine, and glucose were found in hepatic metastases when compared with primary SI-NETs.
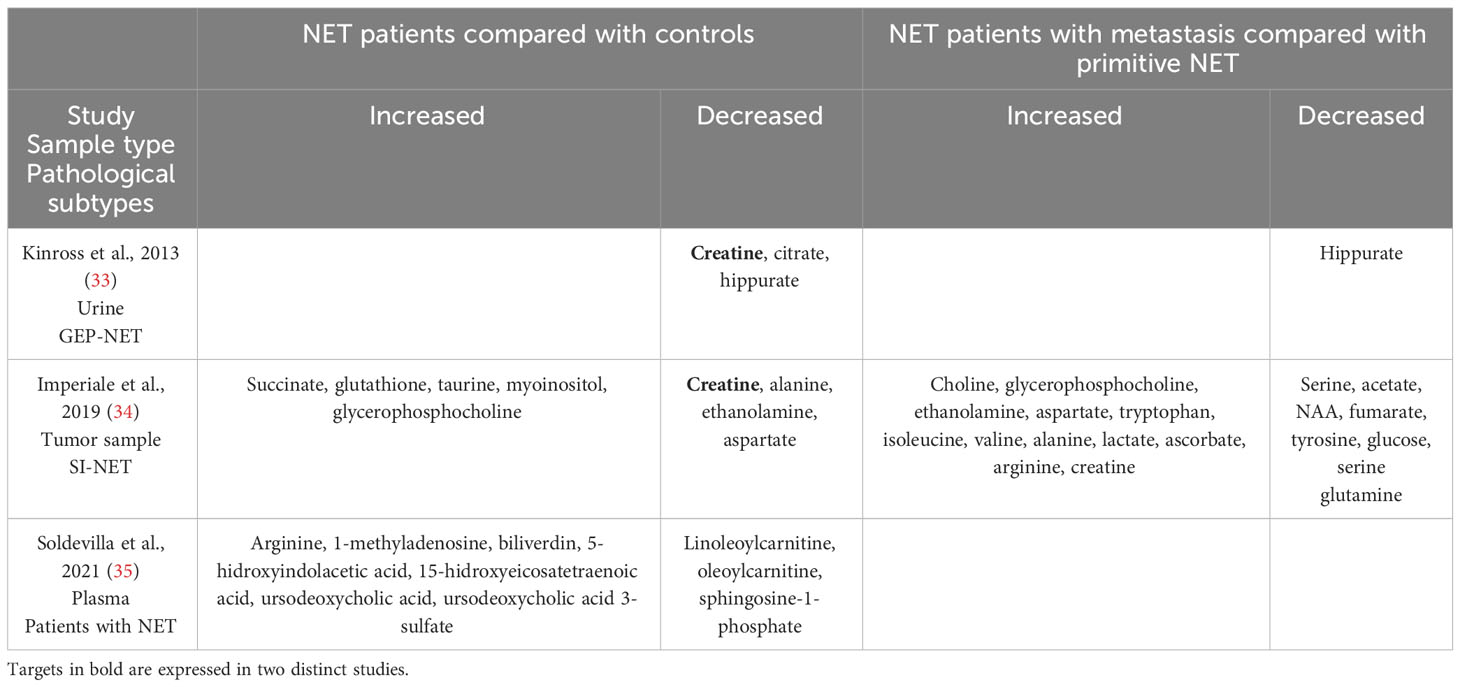
Table 2 Differentially expressed metabolites in neuroendocrine tumors compared with controls.
Finally, in a recent study, Soldevilla et al. (2021) (Table 2) analyzed and profiled plasma samples from 77 NET patients and 68 controls using gas chromatography–mass spectrometry (GC-MS), capillary electrophoresis–mass spectrometry (CE-MS), and liquid chromatography–mass spectrometry (LC-MS) untargeted metabolomics (35). They observed 32 enriched metabolic pathways in NET related to the TCA cycle and amino acid metabolism. Among the 32 significant pathways, the most enriched ones were as follows: arginine biosynthesis, alanine, aspartate, and glutamate metabolism; arginine and proline metabolism; glyoxylate and dicarboxylate metabolism; glutathione metabolism; aminoacyl-tRNA biosynthesis; pyruvate metabolism; and the TCA.
In this study, we analyzed available transcriptomic and metabolomic data to investigate the role of metabolism in pNETs. Given the central role of gene expression in influencing phenotypes, transcriptome analysis provides valuable insights into phenotypic oncological variability. An important advantage over genomic or proteomic approaches is that metabolomic data include contributions from gene–environment interactions, such as drug effects, dietary influences, and microbiota activities. These factors are known to either be responsible for oncogenesis or to significantly influence the efficacy and toxicity of oncological treatments (36–39).
The primary objective of this integrative analysis was to identify the metabolic pathways expressed differently between patients with pNET and those with healthy tissue. As expected, from a transcriptomic perspective, pNETs exhibited a loss of physiological functions, particularly related to pancreatic secretion (Figures 2B and 3B). In addition, a neuronal signature was observed in pNETs, including axon guidance, serotoninergic synapse, and cholinergic synthase, validating our analyses. Furthermore, we observed a significant variation in lipid metabolism. Altered lipid metabolism is an emerging hallmark of tumors, as proliferating cancer cells undergo reprogramming of fatty acid uptake, synthesis, and storage. In addition, cancer cells need lipids for energy production and the biosynthesis of membrane components (40–42) (Figure 6). In the transcriptomic analysis, a significant enrichment in fatty acid synthesis (ELOVL 4-6, HACD1 and 3, ACAA2, ABHD17B, ACLY, and FADS2) in pNET tissues was observed when compared with controls (Figures 2, 3, 6, and Table 1). Our findings are consistent with the observations of Soldevilla et al. (2021), who identified 155 differential metabolites using a multiplatform non-targeted metabolomic approach that provided broad coverage of the metabolome. They observed that fatty acids were the second most abundant biochemical class following amino acid derivatives (35). In addition to a family history of NET, epidemiological evidence from observational studies suggests that a higher body mass index and type 2 diabetes are important risk factors for NET oncogenesis, independent of the NET origin (43–46). However, to the best of our knowledge, no study has focused on the link between obesity, pancreatic fatty acid infiltration, and progression-free survival (PFS) or OS in pNETs. In challenging microenvironment conditions, such as those in oncogenesis, acetyl-CoA upregulates fatty acid synthesis to create favorable conditions for cell survival, proliferation, metastasis, and stress resistance (40, 47). Fatty acid metabolism should therefore be considered a valid target in pNET patients with this profile. For example, targeting FASN (with the FASN inhibitor TVB-2640) or ACLY (with the acyl inhibitor SB-204990) has shown anticancer effects in some preclinical models, and this approach is currently being tested as anticancer therapies in clinical trials (48). Interestingly, Orlistat, a FASN inhibitor, has been shown to inhibit the progression of pNETs by inducing ferroptosis (49).
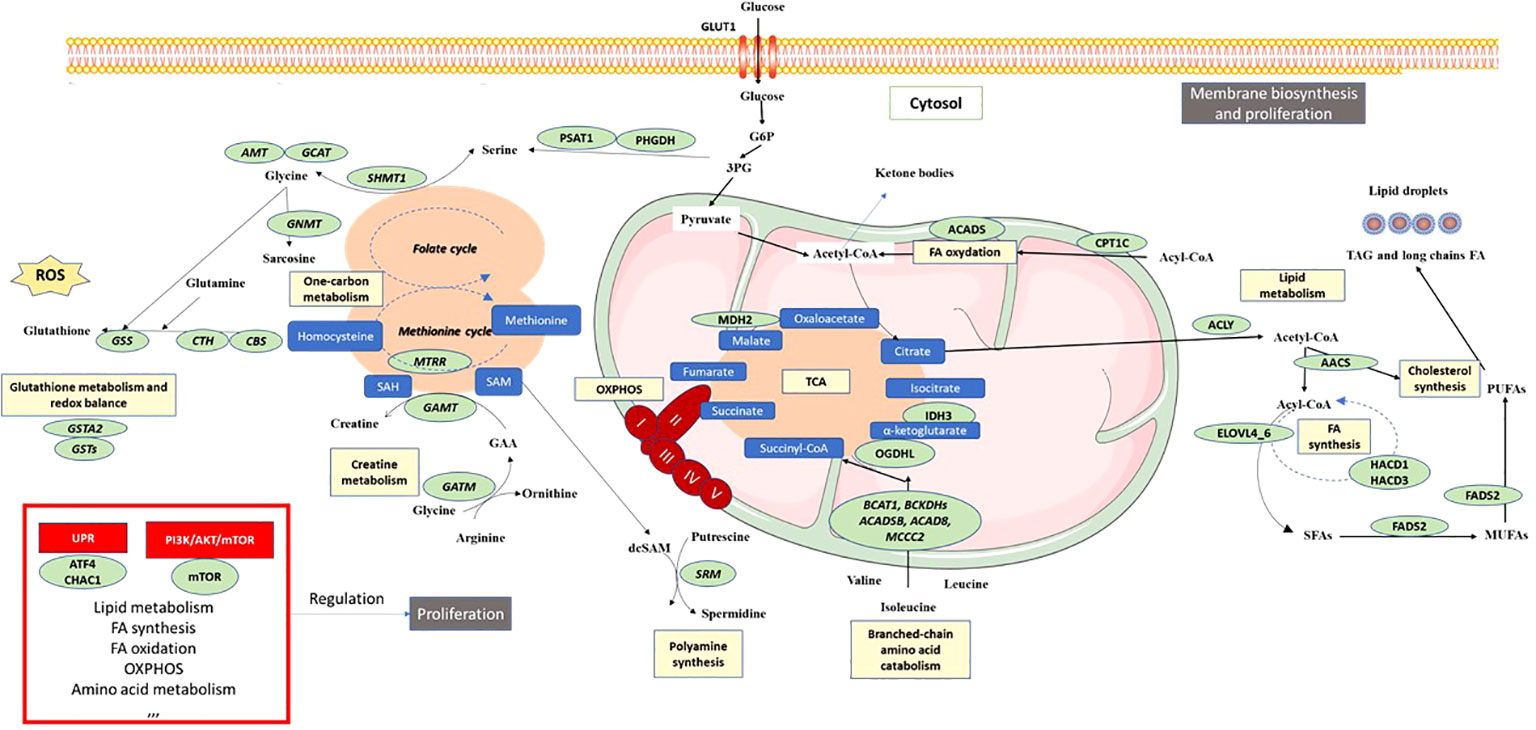
Figure 6 Schematic overview of pNET metabolism after integrative biology analysis. Color codes are defined as follows: green, enzymes or transporters implicated in pNET metabolism; blue, metabolites; yellow, metabolic pathway; red boxes, signaling pathways; black boxes, functional cellular mechanisms. 3PG, 3-phosphoglycerate; AOX1, aldehyde oxidase 1; AMT, aminomethyltransferase; ACLY, ATP citrate lyase; AACS, acetoacetyl-CoA-synthetase; ACADS, acyl-CoA dehydrogenase short chain; ACADSB, acyl-CoA dehydrogenase short/branched chain; ACAD8, acyl-CoA dehydrogenase family member 8; ATF4, activating transcription factor 4; BCAT1, branched chain amino acid transaminase 1; BCKDHs, branched chain keto acid dehydrogenase; CBS, cystathionine beta-synthase; CHAC1, ChaC glutathione specific gamma-glutamylcyclotransferase 1; CTH, cystathionine gamma-lyase; CPT1C, carnitine palmitoyltransferase 1C; ELOVLs, elongation of very long-chain fatty acid proteins; FADS2, fatty acid desaturase 2; GAMT, guanidinoacetate N-methyltransferase; GATM, glycine amidinotransferase; GLUT1, glucose transporter 1; GSS, glutathione synthetase; GSTA1,2, 5, glutathione S-transferase alpha 1,2,5; HACD1, 3-hydroxyacyl-CoA dehydratase 1; IDH3, isocitrate dehydrogenase 3; MCCC2, methylcrotonyl-CoA carboxylase subunit 2; MDH2, malate dehydrogenase 2; MTRR, 5-methyltetrahydrofolate-homocysteine methyltransferase reductase; mTOR, mechanistic target of rapamycin; MUFAs, monounsaturated fatty acids; NADPH, nicotinamide adenine dinucleotide phosphate; OGDHL, oxoglutarate dehydrogenase L; PHGDH, phosphoglycerate dehydrogenase; PUFAs, polyunsaturated fatty acids; ROS, reactive oxygen species; SAM, S-adenosyl methione; dcSAM, decarboxylated SAM; SAH, S-adenosylhomocysteine; SFA, saturated fatty acid; SHMT1, serine hydroxymethyltransferase 1.
Another significant aspect of metabolic cancer cell reprogramming is one-carbon metabolism, which is useful for methylation reactions, the generation of reducing cofactors, and nucleotide and creatine biosynthesis (50–52). In the two GSE datasets comparing normal and pNET samples, enrichment of targets involved in one-carbon metabolism was observed, particularly those involved in serine synthesis (PHGDH and PSAT1), glycine synthesis (GCAT AMT), and glutathione synthesis (CBS and CTH). Interestingly, Soldevilla et al. (2021) showed increased plasma concentrations of leucine, glycine, and serine in patients with NETs compared with controls (Table 2) (35). Excessive activation of serine/glycine biosynthesis drives tumorigenesis and provides a single-carbon unit for one-carbon metabolism and the necessary creatine biosynthesis. Interestingly, both Kinross et al. (2013) and Imperiale et al. (2019) have independently shown, using different methodological analyses, that the level of creatine was lower in NET samples (urine and tumor samples) from patients with NETs (Table 2) (33, 34). Considering the importance of creatine metabolism in cancer cell survival, metastasis (through smad2/3), and immune evasion, it could be a potential target in pNET (53, 54). The activation of one-carbon metabolism also involves the methionine cycle and thus polyamine biosynthesis, wherein one of the key enzymes (SRM) was found to be upregulated in GSE43797 (Table 1 and Figure 6). This finding is consistent with the plasma metabolomic analysis carried out by Soldevilla et al. (2021), where an increase in acetylspermidine polyamine was observed, illustrating the relevance of polyamine metabolism in NETs. Furthermore, glutathione metabolism, which is also influenced by one-carbon metabolism, plays a vital role in providing a stronger antioxidant capacity to survive in a more oxidative environment due to the sharp rise in ROS generation in cancer cells (55). Our analysis of pNET patients compared with controls also showed dysregulation of glutathione metabolism targets (GSTA2, various GSTs, and GPX4) (Figure 6). These enzymes are useful for protecting cancer cells against H2O2-induced cell death and ferroptosis, as they compensate for the elevated ROS stress and confer resistance to a number of chemotherapeutic agents (49, 56–59). Interestingly, glutathione was found to be characteristic and more abundant in SI-NETs compared with normal small intestine tissue in the Imperiale study and in GEP-NET plasma samples in the Soldevilla study (34, 35). This suggests that higher glutathione metabolism may be present in GEP-NETs and therefore appears to be a pathway of interest.
Finally, in our analysis, we observed TCA cycle alterations in pNET and GEP-NET when compared with control patients without NETs whether in transcriptomic analyses (OGDHL, IDH3, and MDH1) or metabolomic approaches (succinate or isocitrate/citrate alterations) (Figures 2, 3, 6, and Table 1). Metabolism fueling the TCA cycle, such as fatty acid oxidation and branched-chain amino acid (alanine, leucine, and isoleucine) metabolism, were also found to be altered. In terms of fatty acid oxidation, we observed an increase in CPT1 and ACADS expression in the two GSE datasets comparing normal pancreas and pNETs, contributing to an increase in acetyl-CoA, which provides an energy supply for the TCA cycle. After transcriptomic analysis, branched-chain amino acid targets were also increased in pNET samples (BCKDHB). These branched-chain amino acids are metabolized in the mitochondria into ketoacids, generating succinyl CoA and acetyl-CoA for oxidation by the TCA cycle (Figure 6) (60). Describing the alterations of the TCA cycle in NETs more precisely is important to better understand the oncogenesis of these tumors and to consider new therapeutic approaches that directly target these metabolites (61).
The second objective was to identify the metabolic pathways expressed differently between primary pNETs and metastasis. Unfortunately, only one GSE dataset, which included a limited number of metastatic patients, was available for this analysis, therefore yielding few results. Despite this limitation, we observed little difference between the primitive pNET tissues and metastatic pNET tissues, which may suggest common metabolic characteristics. We only observed enrichment in targets implicated in amino acid metabolism, notably with regard to tryptophan (TDO2, DAO, and DPYS). This finding was also confirmed in the study by Imperiale et al. (2019), where tryptophan was found to be higher in liver metastasis compared with primitive SI-NETs. It is well-known that tumors use tryptophan and its metabolites to promote their growth and metastasis and evade host defenses. Therefore, studying this pathway in pNETs could be particularly interesting (62, 63). Additionally, fatty acid metabolism (RDH16) was also found to be upregulated in our study. Imperiale et al. (2019) also observed higher levels of acetate, which can be considered an index of fatty acid synthesis following beta-oxidation of acetyl-CoA, in aggressive SI-NETs, thus confirming the significance of fatty acid metabolism in NETs as well as in different cancers (34, 64, 65). Moreover, an enrichment in other metabolomic targets was identified (GYS2 and NAT8L), which are potential targets as in other cancers (66–69).
Our last objective was to identify the metabolic pathways that are differently expressed in pNET patients based on the presence or absence of germinal MEN1 mutation. Interestingly, we observed a differential expression in mRNA implicated in OXPHOS (NDUFA1, NDUFA3, NDUFA7, NDUFB11, NDUFS7, ATP6AP1, COX7C, UQCR11, UQCRQ, and NAMPT). We found an association between MEN1 status and genes involved in OXPHOS. This association was further supported by a recent article demonstrating that MEN1 regulates the expression of genes involved in OXPHOS and glycolysis to coordinate cellular response for energy production (70). To the best of our knowledge, no metabolomic study has addressed this question, but it is an important research point that should be developed further to better understand the differences between pNETs with and without MEN1 mutations. Recently, Fahrmann et al. reported a plasma acetylated polyamine metabolite signature (N-acetylputrescine, acetylspermidine, and diacetylspermidine) associated with MEN1-duodenopancreatic NET disease progression. However, no overexpression of polyamine pathway mRNAs was observed in metastatic MEN1 patients (71, 72).
Using duodenopancreatic NET transcriptomic analysis to focus on prognosis, as was done in the Diedisheim study (25), we observed that the targets associated with TCA were associated with poor (OGDHL) or intermediate (IDH and MDH1) outcomes. Targets implicated in fatty acid metabolism were associated with both poor outcomes (FASN) and better outcomes (ELOVL4, ACLY, and AACS). Targets implicated in amino acid metabolism were associated with poor outcomes (SHMT1), intermediate outcomes (GATM, CBS, GNMT, PHGDH, AMT, GCAT, AOC3, BCAT1, and ACADS), or better outcomes (AOX1 and AACS). Targets implicated in glutathione metabolism were associated with poor outcomes (GSTA1 and MGST1) and intermediate outcomes (GSTA2, ANPEP, OPLAH, SRM, IDH2, GSTP1, GSTO1, and MAOB). Similarly, a recent proteo-transcriptomic classification of pNETs showed that several different metabolic targets were overexpressed in the pNET proliferative subgroup: PHGDH, SDMT1, MGST1, and FASN (73).
Our original analysis suggests that integrating transcriptomics with metabolomics can provide insights into how metabolites are regulated and can elucidate targetable functional mechanisms. However, this study has several limitations. First, RNA sequencing approaches allow comparison of the quantitative expression of the genes of interest and can therefore provide an idea of intratumoral metabolism. However, they do not precisely describe its functioning, as they completely ignore the influence of epigenetics and other mechanisms that can impact the functioning of the studied enzymes. Additionally, these approaches do not take into account the metabolism of non-cancer stromal and immune cells.
Second, metabolites represent the end product of gene expression. Metabolomic analysis is therefore the most precise methodology for defining the metabolic functioning of pNETs. However, the only publications using metabolomic analysis were from studies conducted in all types of NETs and not specifically in pNETs, despite the well-known importance of the primitive organ in defining the metabolic nature of the tumor, which also depends on the tumor grade; these details were not described in these GSE datasets (74). In addition, these metabolomic studies used various sample types, including tumor, urine, and plasma, which provided different sets of information. To comprehensively understand the molecular heterogeneity in pNETs (75, 76), further studies combining single-cell RNA sequencing and metabolomic approaches in tumor samples are necessary, as has been previously suggested (7, 23).
Integrative biology, combining transcriptomic and metabolomic approaches, demonstrates a distinct metabolic profile in pNETs characterized by dysregulation of one-carbon metabolism and glutathione metabolism, and fatty acid biosynthesis, which facilitate cancer cell proliferation as well as fatty acid oxidation and branched-chain amino acid catabolism, which supply the tricarboxylic acid cycle.
These targets are implicated in signaling pathways such as the unfolded protein response and mTOR pathways, which are also associated with pNET cell proliferation and metastasis. The targets highlighted in this study make it possible to differentiate patients with or without pNETs and could also serve as prognostic indicators. However, further studies are now needed to validate these findings and to explore these targets as potential biomarkers or therapeutic options specifically tailored for pNETs.
AJ, A-FD, NJ, and LC wrote and proofread the manuscript and created the figures. CDC, M-CV, BC, and IVS proofread and corrected the manuscript. AJ has full access to all the data in this study and takes responsibility for the integrity of the data and the accuracy of the data analysis. All authors have read and approved the submitted version.
This work was supported by grants from Contrat de Plan Etat-Région CPER Cancer 2015-2020, Alliance Cancer, Cancéropole Nord-Ouest, Association de Recherche en Endocrinologie, Santélys, and CANTHER.
We would like to thank Professor Pascal Pigny and Mrs. Janet Ratziu for proofreading this work. Additionally, we express our appreciation to the ONCOLille Institute.
The authors declare that the research was conducted in the absence of any commercial or financial relationships that could be construed as a potential conflict of interest.
All claims expressed in this article are solely those of the authors and do not necessarily represent those of their affiliated organizations, or those of the publisher, the editors and the reviewers. Any product that may be evaluated in this article, or claim that may be made by its manufacturer, is not guaranteed or endorsed by the publisher.
1. Warburg O. On the origin of cancer cells. Science (1956) 123(3191):309–14. doi: 10.1126/science.123.3191.309
2. Hanahan D, Weinberg RA. Hallmarks of cancer: the next generation. Cell (2011) 144(5):646–74. doi: 10.1016/j.cell.2011.02.013
3. Hanahan D. Hallmarks of cancer: new dimensions. Cancer Discov (2022) 12(1):31–46. doi: 10.1158/2159-8290.CD-21-1059
4. Wettersten HI, Aboud OA, Lara PN, Weiss RH. Metabolic reprogramming in clear cell renal cell carcinoma. Nat Rev Nephrol (2017) 13(7):410–9. doi: 10.1038/nrneph.2017.59
5. Bergers G, Fendt SM. The metabolism of cancer cells during metastasis. Nat Rev Cancer (2021) 21(3):162–80. doi: 10.1038/s41568-020-00320-2
6. Boroughs LK, DeBerardinis RJ. Metabolic pathways promoting cancer cell survival and growth. Nat Cell Biol (2015) 17(4):351–9. doi: 10.1038/ncb3124
7. Stine ZE, Schug ZT, Salvino JM, Dang CV. Targeting cancer metabolism in the era of precision oncology. Nat Rev Drug Discovery (2022) 21(2):141–62. doi: 10.1038/s41573-021-00339-6
8. Martínez-Reyes I, Chandel NS. Cancer metabolism: looking forward. Nat Rev Cancer (2021) 21(10):669–80. doi: 10.1038/s41568-021-00378-6
9. Yao JC, Hassan M, Phan A, Dagohoy C, Leary C, Mares JE, et al. One hundred years after “carcinoid”: epidemiology of and prognostic factors for neuroendocrine tumors in 35,825 cases in the United States. J Clin Oncol (2008) 26(18):3063–72. doi: 10.1200/JCO.2007.15.4377
10. White BE, Rous B, Chandrakumaran K, Wong K, Bouvier C, Van Hemelrijck M, et al. Incidence and survival of neuroendocrine neoplasia in England 1995–2018: A retrospective, population-based study. Lancet Regional Health Europe (2022) 23:100510. doi: 10.1016/j.lanepe.2022.100510
11. Dasari A, Shen C, Halperin D, Zhao B, Zhou S, Xu Y, et al. Trends in the incidence, prevalence, and survival outcomes in patients with neuroendocrine tumors in the United States. JAMA Oncol (2017) 3(10):1335–42. doi: 10.1001/jamaoncol.2017.0589
12. Xu Z, Wang L, Dai S, Chen M, Li F, Sun J, et al. Epidemiologic trends of and factors associated with overall survival for patients with gastroenteropancreatic neuroendocrine tumors in the United States. JAMA Netw Open (2021) 4(9):e2124750. doi: 10.1001/jamanetworkopen.2021.24750
13. Scarpa A, Chang DK, Nones K, Corbo V, Patch A-M, Bailey P, et al. Whole-genome landscape of pancreatic neuroendocrine tumours. Nature (2017) 543(7643):65–71. doi: 10.1038/nature21063
14. Mafficini A, Scarpa A. Genetics and epigenetics of gastroenteropancreatic neuroendocrine neoplasms. Endocr Rev (2019) 40(2):506–36. doi: 10.1210/er.2018-00160
15. Nagtegaal ID, Odze RD, Klimstra D, Paradis V, Rugge M, Schirmacher P, et al. The 2019 WHO classification of tumours of the digestive system. Histopathology (2020) 76(2):182–8. doi: 10.1111/his.13975
16. Puccini A, Poorman K, Salem ME, Soldato D, Seeber A, Goldberg RM, et al. Comprehensive genomic profiling of gastroenteropancreatic neuroendocrine neoplasms (GEP-NENs). Clin Cancer Res (2020) 26(22):5943–51. doi: 10.1158/1078-0432.CCR-20-1804
17. Yao J, Garg A, Chen D, Capdevila J, Engstrom P, Pommier R, et al. Genomic profiling of NETs: a comprehensive analysis of the RADIANT trials. Endocr Relat Cancer (2019) 26(4):391–403. doi: 10.1530/ERC-18-0332
18. Rindi G, Klimstra DS, Abedi-Ardekani B, Asa SL, Bosman FT, Brambilla E, et al. A common classification framework for neuroendocrine neoplasms: an International Agency for Research on Cancer (IARC) and World Health Organization (WHO) expert consensus proposal. Mod Pathol (2018) 31(12):1770–86. doi: 10.1038/s41379-018-0110-y
19. Frizziero M, Kilgour E, Simpson KL, Rothwell DG, Moore DA, Frese KK, et al. Expanding therapeutic opportunities for extra-pulmonary neuroendocrine carcinoma. Clin Cancer Res (2022) 28(10):1999–2019. doi: 10.1158/1078-0432.CCR-21-3058
20. Venizelos A, Elvebakken H, Perren A, Nikolaienko O, Deng W, Lothe IMB, et al. The molecular characteristics of high-grade gastroenteropancreatic neuroendocrine neoplasms. Endocr Relat Cancer (2021) 29(1):1–14. doi: 10.1530/erc-21-0152
21. Cejas P, Drier Y, Dreijerink KMA, Brosens LAA, Deshpande V, Epstein CB, et al. Enhancer signatures stratify and predict outcomes of non-functional pancreatic neuroendocrine tumors. Nat Med (2019) 25(8):1260–5. doi: 10.1038/s41591-019-0493-4
22. Missiaglia E, Dalai I, Barbi S, Beghelli S, Falconi M, della Peruta M, et al. Pancreatic endocrine tumors: expression profiling evidences a role for AKT-mTOR pathway. J Clin Oncol (2010) 28(2):245–55. doi: 10.1200/JCO.2008.21.5988
23. Sadanandam A, Wullschleger S, Lyssiotis CA, Grötzinger C, Barbi S, Bersani S, et al. A cross-species analysis in pancreatic neuroendocrine tumors reveals molecular subtypes with distinctive clinical, metastatic, developmental, and metabolic characteristics. Cancer Discovery (2015) 5(12):1296–313. doi: 10.1158/2159-8290.CD-15-0068
24. Chan CS, Laddha SV, Lewis PW, Koletsky MS, Robzyk K, Da Silva E, et al. ATRX, DAXX or MEN1 mutant pancreatic neuroendocrine tumors are a distinct alpha-cell signature subgroup. Nat Commun (2018) 9(1):4158. doi: 10.1038/s41467-018-06498-2
25. Diedisheim M, Dermine S, Jouinot A, Septier A, Gaujoux S, Dousset B, et al. Prognostic transcriptome classes of duodenopancreatic neuroendocrine tumors. Endocr Relat Cancer (2021) 28(8):563–71. doi: 10.1530/ERC-21-0051
26. Rosario SR, Long MD, Affronti HC, Rowsam AM, Eng KH, Smiraglia DJ. Pan-cancer analysis of transcriptional metabolic dysregulation using The Cancer Genome Atlas. Nat Commun (2018) 9(1):5330. doi: 10.1038/s41467-018-07232-8
27. Gaude E, Frezza C. Tissue-specific and convergent metabolic transformation of cancer correlates with metastatic potential and patient survival. Nat Commun (2016) 7(1):13041. doi: 10.1038/ncomms13041
28. Peng X, Chen Z, Farshidfar F, Xu X, Lorenzi PL, Wang Y, et al. Molecular characterization and clinical relevance of metabolic expression subtypes in human cancers. Cell Rep (2018) 23(1):255–269.e4. doi: 10.1016/j.celrep.2018.03.077
29. Park M, Kim M, Hwang D, Park M, Kim WK, Kim SK, et al. Characterization of gene expression and activated signaling pathways in solid-pseudopapillary neoplasm of pancreas. Mod Pathol (2014) 27(4):580–93. doi: 10.1038/modpathol.2013.154
30. Liao Y, Wang J, Jaehnig EJ, Shi Z, Zhang B. WebGestalt 2019: gene set analysis toolkit with revamped UIs and APIs. Nucleic Acids Res (2019) 47(W1):W199–205. doi: 10.1093/nar/gkz401
31. Larkin JR, Anthony S, Johanssen VA, Yeo T, Sealey M, Yates AG, et al. Metabolomic biomarkers in blood samples identify cancers in a mixed population of patients with nonspecific symptoms. Clin Cancer Res (2022) 28(8):1651–61. doi: 10.1158/1078-0432.CCR-21-2855
32. Schmidt DR, Patel R, Kirsch DG, Lewis CA, Vander Heiden MG, Locasale JW. Metabolomics in cancer research and emerging applications in clinical oncology. CA Cancer J Clin (2021) 71(4):333–58. doi: 10.3322/caac.21670
33. Kinross JM, Drymousis P, Jiménez B, Frilling A. Metabonomic profiling: A novel approach in neuroendocrine neoplasias. Surgery (2013) 154(6):1185–93. doi: 10.1016/j.surg.2013.06.018
34. Imperiale A, Poncet G, Addeo P, Ruhland E, Roche C, Battini S, et al. Metabolomics of small intestine neuroendocrine tumors and related hepatic metastases. Metabolites (2019) 9(12):E300. doi: 10.3390/metabo9120300
35. Soldevilla B, López-López A, Lens-Pardo A, Carretero-Puche C, Lopez-Gonzalvez A, La Salvia A, et al. Comprehensive plasma metabolomic profile of patients with advanced neuroendocrine tumors (NETs). Diagn Biol Relevance Cancers (2021) 13(11):2634. doi: 10.3390/cancers13112634
36. Clayton TA, Lindon JC, Cloarec O, Antti H, Charuel C, Hanton G, et al. Pharmaco-metabonomic phenotyping and personalized drug treatment. Nature (2006) 440(7087):1073–7. doi: 10.1038/nature04648
37. Gebregiworgis T, Bhinderwala F, Purohit V, Chaika NV, Singh PK, Powers R. Insights into gemcitabine resistance and the potential for therapeutic monitoring. Metabolomics (2018) 14(12):156. doi: 10.1007/s11306-018-1452-7
38. Jiang L, Lee SC, Ng TC. Pharmacometabonomics analysis reveals serum formate and acetate potentially associated with varying response to gemcitabine-carboplatin chemotherapy in metastatic breast cancer patients. J Proteome Res (2018) 17(3):1248–57. doi: 10.1021/acs.jproteome.7b00859
39. Sun Y, Kim JH, Vangipuram K, Hayes DF, Lavoie Smith EM, Yeomans L, et al. Pharmacometabolomics reveals a role for histidine, phenylalanine and threonine in the development of paclitaxel-induced peripheral neuropathy. Breast Cancer Res Treat (2018) 171(3):657–66. doi: 10.1007/s10549-018-4862-3
40. Guertin DA, Wellen KE. Acetyl-CoA metabolism in cancer. Nat Rev Cancer (2023). doi: 10.1038/s41568-022-00543-5
41. Koundouros N, Poulogiannis G. Reprogramming of fatty acid metabolism in cancer. Br J Cancer (2020) 122(1):4–22. doi: 10.1038/s41416-019-0650-z
42. Bian X, Liu R, Meng Y, Xing D, Xu D, Lu Z. Lipid metabolism and cancer. J Exp Med (2020) 218(1):e20201606. doi: 10.1084/jem.20201606
43. Halfdanarson TR, Bamlet WR, McWilliams RR, et al. Risk factors for pancreatic neuroendocrine tumors (PNETs): A clinic-based case-control study. Pancreas (2014) 43(8):1219–22. doi: 10.1097/MPA.0000000000000234
44. Santos AP, Santos AC, Castro C, et al. Visceral obesity and metabolic syndrome are associated with well-differentiated gastroenteropancreatic neuroendocrine tumors. Cancers (Basel) (2018) 10(9):293. doi: 10.3390/cancers10090293
45. Leoncini E, Carioli G, La Vecchia C, Boccia S, Rindi G. Risk factors for neuroendocrine neoplasms: a systematic review and meta-analysis. Ann Oncol (2016) 27(1):68–81. doi: 10.1093/annonc/mdv505
46. Hassan MM, Phan A, Li D, Dagohoy CG, Leary C, Yao JC. Risk factors associated with neuroendocrine tumors: A U.S.-based case-control study. Int J Cancer (2008) 123(4):867–73. doi: 10.1002/ijc.23529
47. Corbet C, Feron O. Emerging roles of lipid metabolism in cancer progression. Curr Opin Clin Nutr Metab Care (2017) 20(4):254–60. doi: 10.1097/MCO.0000000000000381
48. Batchuluun B, Pinkosky SL, Steinberg GR. Lipogenesis inhibitors: therapeutic opportunities and challenges. Nat Rev Drug Discovery (2022) 21(4):283–305. doi: 10.1038/s41573-021-00367-2
49. Ye M, Lu F, Chen J, et al. Orlistat induces ferroptosis in pancreatic neuroendocrine tumors by inactivating the MAPK pathway. J Cancer (2023) 14(8):1458–69. doi: 10.7150/jca.83118
50. Rosenzweig A, Blenis J, Gomes AP. Beyond the warburg effect: how do cancer cells regulate one-carbon metabolism? Front Cell Dev Biol (2018) 6:90. doi: 10.3389/fcell.2018.00090
51. Pan S, Fan M, Liu Z, Li X, Wang H. Serine, glycine and one-carbon metabolism in cancer (Review). Int J Oncol (2020) 58(2):158–70. doi: 10.3892/ijo.2020.5158
52. Vettore L, Westbrook RL, Tennant DA. New aspects of amino acid metabolism in cancer. Br J Cancer (2020) 122(2):150–6. doi: 10.1038/s41416-019-0620-5
53. Kazak L, Cohen P. Creatine metabolism: energy homeostasis, immunity and cancer biology. Nat Rev Endocrinol (2020) 16(8):421–36. doi: 10.1038/s41574-020-0365-5
54. Zhang L, Zhu Z, Yan H, et al. Creatine promotes cancer metastasis through activation of Smad2/3. Cell Metab (2021) 33(6):1111–1123.e4. doi: 10.1016/j.cmet.2021.03.009
55. Harris IS, DeNicola GM. The complex interplay between antioxidants and ROS in cancer. Trends Cell Biol (2020) 30(6):440–51. doi: 10.1016/j.tcb.2020.03.002
56. Ng KTP, Yeung OWH, Lam YF, et al. Glutathione S-transferase A2 promotes hepatocellular carcinoma recurrence after liver transplantation through modulating reactive oxygen species metabolism. Cell Death Discovery (2021) 7(1):1–14. doi: 10.1038/s41420-021-00569-y
57. Corti A, Franzini M, Paolicchi A, Pompella A. Gamma-glutamyltransferase of cancer cells at the crossroads of tumor progression, drug resistance and drug targeting. Anticancer Res (2010) 30(4):1169–81.
58. Wang W, Kryczek I, Dostál L, Lin H, Tan L, Zhao L, et al. Effector T cells abrogate stroma-mediated chemoresistance in ovarian cancer. Cell (2016) 165(5):1092–105. doi: 10.1016/j.cell.2016.04.009
59. Lee JY, Han CY, Yang JW, Smith C, Kim SK, Lee EY-HP, et al. Induction of glutathione transferase in insulin-like growth factor type I receptor-overexpressed hepatoma cells. Mol Pharmacol (2007) 72(4):1082–93. doi: 10.1124/mol.107.038174
60. Neinast MD, Jang C, Hui S, Murashige DS, Chu Q, Morscher RJ, et al. Quantitative analysis of the whole-body metabolic fate of branched-chain amino acids. Cell Metab (2019) 29(2):417–429.e4. doi: 10.1016/j.cmet.2018.10.013
61. Eniafe J, Jiang S. The functional roles of TCA cycle metabolites in cancer. Oncogene (2021) 40(19):3351–63. doi: 10.1038/s41388-020-01639-8
62. Badawy AAB. Tryptophan metabolism and disposition in cancer biology and immunotherapy. Biosci Rep (2022) 42(11):BSR20221682. doi: 10.1042/BSR20221682
63. Li F, Zhao Z, Zhang Z, Zhang Y, Guan W. Tryptophan metabolism induced by TDO2 promotes prostatic cancer chemotherapy resistance in a AhR/c-Myc dependent manner. BMC Cancer (2021) 21(1):1112. doi: 10.1186/s12885-021-08855-9
64. Duman C, Yaqubi K, Hoffmann A, Acikgöz AA, Korshunov A, Bendszus M, et al. Acyl-CoA-binding protein drives glioblastoma tumorigenesis by sustaining fatty acid oxidation. Cell Metab (2019) 30(2):274–289.e5. doi: 10.1016/j.cmet.2019.04.004
65. Camarda R, Zhou AY, Kohnz RA, Balakrishnan S, Mahieu C, Anderton B, et al. Inhibition of fatty acid oxidation as a therapy for MYC-overexpressing triple-negative breast cancer. Nat Med (2016) 22(4):427–32. doi: 10.1038/nm.4055
66. Chen SL, Zhang CZ, Liu LL, Lu S-X, Pan Y-H, Wang C-H, et al. A GYS2/p53 negative feedback loop restricts tumor growth in HBV-related hepatocellular carcinoma. Cancer Res (2019) 79(3):534–45. doi: 10.1158/0008-5472.CAN-18-2357
67. A S, Wu H, Wang X, Wang X, Yang J, Xia L, et al. Value of glycogen synthase 2 in intrahepatic cholangiocarcinoma prognosis assessment and its influence on the activity of cancer cells. Bioengineered (2021) 12(2):12167–78. doi: 10.1080/21655979.2021.2005224
68. Falco PD, Lazzarino G, Felice F, Desideri E, Castelli S, Salvatori I, et al. Hindering NAT8L expression in hepatocellular carcinoma increases cytosolic aspartate delivery that fosters pentose phosphate pathway and purine biosynthesis promoting cell proliferation. Redox Biol (2023) 59. doi: 10.1016/j.redox.2022.102585
69. Zand B, Previs RA, Zacharias NM, Rupaimoole R, Mitamura T, Nagaraja AS, et al. Role of increased n-acetylaspartate levels in cancer. J Natl Cancer Inst (2016) 108(6):djv426. doi: 10.1093/jnci/djv426
70. Chou CW, Tan X, Hung CN, Lieberman B, Chen M, Kusi M, et al. Menin and menin-associated proteins coregulate cancer energy metabolism. Cancers (Basel) (2020) 12(9):2715. doi: 10.3390/cancers12092715
71. Fahrmann JF, Wasylishen AR, Pieterman CRC, Irajizad E, Vykoukal J, Murage E, et al. A blood-based polyamine signature associated with MEN1 duodenopancreatic neuroendocrine tumor progression. J Clin Endocrinol Metab (2021) 106(12):e4969–80. doi: 10.1210/clinem/dgab554
72. Fahrmann JF, Wasylishen AR, Pieterman CRC, Irajizad E, Vykoukal J, Wu R, et al. Blood-based proteomic signatures associated with MEN1-related duodenopancreatic neuroendocrine tumor progression. J Clin Endocrinol Metab (2023), dgad315. doi: 10.1210/clinem/dgad315
73. Yang KC, Kalloger SE, Aird JJ, Lee MKC, Rushton C, Mungall KL, et al. Proteotranscriptomic classification and characterization of pancreatic neuroendocrine neoplasms. Cell Rep (2021) 37(2):109817. doi: 10.1016/j.celrep.2021.109817
74. Hu J, Locasale JW, Bielas JH, O’Sullivan J, Sheahan K, Cantley LC, et al. Heterogeneity of tumor-induced gene expression changes in the human metabolic network. Nat Biotechnol (2013) 31(6):522–9. doi: 10.1038/nbt.2530
75. Zhou Y, Liu S, Liu C, Yang J, Lin Q, Zheng S, et al. Single-cell RNA sequencing reveals spatiotemporal heterogeneity and Malignant progression in pancreatic neuroendocrine tumor. Int J Biol Sci (2021) 17(14):3760–75. doi: 10.7150/ijbs.61717
Keywords: pancreatic neuroendocrine tumors, metabolism, metabolomic, transcriptomic, integrative biology, MEN1, metastasis
Citation: Jannin A, Dessein A-F, Do Cao C, Vantyghem M-C, Chevalier B, Van Seuningen I, Jonckheere N and Coppin L (2023) Metabolism of pancreatic neuroendocrine tumors: what can omics tell us? Front. Endocrinol. 14:1248575. doi: 10.3389/fendo.2023.1248575
Received: 27 June 2023; Accepted: 27 September 2023;
Published: 16 October 2023.
Edited by:
Ranjith Kumavath, Pondicherry University, IndiaReviewed by:
Reetobrata Basu, Ohio University, United StatesCopyright © 2023 Jannin, Dessein, Do Cao, Vantyghem, Chevalier, Van Seuningen, Jonckheere and Coppin. This is an open-access article distributed under the terms of the Creative Commons Attribution License (CC BY). The use, distribution or reproduction in other forums is permitted, provided the original author(s) and the copyright owner(s) are credited and that the original publication in this journal is cited, in accordance with accepted academic practice. No use, distribution or reproduction is permitted which does not comply with these terms.
*Correspondence: Isabelle Van Seuningen, aXNhYmVsbGUudmFuc2V1bmluZ2VuQGluc2VybS5mcg==
†The authors have contributed equally to this work
Disclaimer: All claims expressed in this article are solely those of the authors and do not necessarily represent those of their affiliated organizations, or those of the publisher, the editors and the reviewers. Any product that may be evaluated in this article or claim that may be made by its manufacturer is not guaranteed or endorsed by the publisher.
Research integrity at Frontiers
Learn more about the work of our research integrity team to safeguard the quality of each article we publish.