 Di Gong1,2†‡
 Lyujie Fang2‡
 Yixian Cai2‡Ieng Chong3
 Junhong Guo4
 Zhichao Yan4Xiaoli Shen4
 Weihua Yang4*
 Jiantao Wang4*
- 1Shenzhen Eye Hospital, Jinan University, Shenzhen, Guangdong, China
- 2The First Affiliated Hospital of Jinan University, Jinan University, Guangzhou, Guangdong, China
- 3Macau University Hospital, Macao, Macao SAR, China
- 4Shenzhen Eye Hospital, Jinan University, Shenzhen Eye Institute, Shenzhen, Guangdong, China
Objective: This study aims to develop and evaluate a non-imaging clinical data-based nomogram for predicting the risk of vision-threatening diabetic retinopathy (VTDR) in diabetes mellitus type 2 (T2DM) patients.
Methods: Based on the baseline data of the Guangdong Shaoguan Diabetes Cohort Study conducted by the Zhongshan Ophthalmic Center (ZOC) in 2019, 2294 complete data of T2DM patients were randomly divided into a training set (n=1605) and a testing set (n=689). Independent risk factors were selected through univariate and multivariate logistic regression analysis on the training dataset, and a nomogram was constructed for predicting the risk of VTDR in T2DM patients. The model was evaluated using receiver operating characteristic (ROC) curves and area under the curve (AUC) in the training and testing datasets to assess discrimination, and Hosmer-Lemeshow test and calibration curves to assess calibration.
Results: The results of the multivariate logistic regression analysis showed that Age (OR = 0.954, 95% CI: 0.940-0.969, p = 0.000), BMI (OR = 0.942, 95% CI: 0.902-0.984, p = 0.007), systolic blood pressure (SBP) (OR =1.014, 95% CI: 1.007-1.022, p = 0.000), diabetes duration (10-15y: OR =3.126, 95% CI: 2.087-4.682, p = 0.000; >15y: OR =3.750, 95% CI: 2.362-5.954, p = 0.000), and glycated hemoglobin (HbA1C) (OR = 1.325, 95% CI: 1.221-1.438, p = 0.000) were independent risk factors for T2DM patients with VTDR. A nomogram was constructed using these variables. The model discrimination results showed an AUC of 0.7193 for the training set and 0.6897 for the testing set. The Hosmer-Lemeshow test results showed a high consistency between the predicted and observed probabilities for both the training set (Chi-square=2.2029, P=0.9742) and the testing set (Chi-square=7.6628, P=0.4671).
Conclusion: The introduction of Age, BMI, SBP, Duration, and HbA1C as variables helps to stratify the risk of T2DM patients with VTDR.
1 Background
According to research conducted by the International Diabetes Federation (IDF), the global prevalence of diabetes was estimated to be 9.3% (463 million people) in 2019, with a predicted increase to 10.2% (578 million people) by 2030 and 10.9% (700 million people) by 2045 (1). Diabetic retinopathy (DR), a highly tissue-specific neurovascular complication of diabetes, is the leading cause of preventable blindness in the working-age population (2). In addition to vision loss, DR has been shown to be associated with other diabetes-related complications, including kidney disease, peripheral neuropathy, and cardiovascular events (3–5). Therefore, targeted monitoring and management of DR patients are of crucial clinical significance.
The International Clinical Diabetic Retinopathy Disease Severity Scale categorizes DR into five stages based on disease severity, including the first three stages with low risk, as well as the fourth stage, severe non-proliferative diabetic retinopathy (NPDR), and the fifth stage, proliferative diabetic retinopathy (PDR). Diabetic macular edema (DME) is classified as either present or absent (6). Vision-threatening diabetic retinopathy (VTDR) includes severe NPDR, PDR, and/or DME, indicating that the development of DR has seriously affected the patient’s vision, and failure to treat it in a timely manner will result in irreversible vision loss (7). The pathogenesis of DR is still not fully understood, but it may be due to excessive production of reactive oxygen species (ROS) and advanced glycation end-products (AGEs) inducing mitochondrial dysfunction, leading to dysfunction of the vascular endothelial cell barrier, neuronal cell death, and axonal degeneration, ultimately resulting in severe damage to retinal function (8). Studies have found that risk factors for DR and VTDR may include race, place of residence, refractive error, duration of diabetes, blood glucose levels, blood pressure, and kidney function, and optimizing control of these risk factors can reduce the risk of VTDR occurrence and progression (9–12).
The main treatments for VTDR include panretinal photocoagulation, intravitreal injection of anti-vascular endothelial growth factor, and vitreoretinal surgery (2). Primary healthcare providers, optometrists, and nurses who have received training can effectively manage mild to moderate DR, but management and key treatment of VTDR patients require the specialized knowledge and skills of trained ophthalmologists or retinal specialists (13, 14). According to statistics, the prevalence of VTDR in the global diabetic population is 6.17% (285.4 million people), and it is expected to increase to 448.2 million people by 2045 (7). In recent years, artificial intelligence diagnostic systems have demonstrated excellent performance in the identification and referral of VTDR patients (15, 16). However, most autonomous AI systems currently require imaging data provided by advanced ophthalmic examination equipment, such as fundus photography and OCT, and advanced ophthalmic medical resources are still scarce for physicians and patients in underdeveloped areas (14).
Logistic regression, as a commonly used statistical method, can be applied in various clinical medical scenarios, including but not limited to the following aspects: 1)Disease Prediction: Logistic regression can predict whether patients have a certain disease based on their clinical data. 2)Risk Assessment: Logistic regression can be utilized to assess the risk of patients developing a specific disease. 3)Diagnostic Assistance: Logistic regression can assist physicians in disease diagnosis. 4)Drug Development: In the drug development process, logistic regression can predict the efficacy and safety of new drugs. By establishing models, researchers can evaluate the therapeutic effects of different drugs on diseases and identify the most promising candidates. 4)Survival Analysis: In clinical observations and epidemiological studies, logistic regression can be used to analyze patients’ survival data, predict their survival rates, and identify factors that affect survival. Overall, logistic regression plays a crucial role in clinical medicine, providing an effective predictive and decision-making tool for physicians and researchers to improve patient health outcomes and the quality of medical services.
In clinical prediction models, logistic regression analysis is commonly used for predicting the onset and diagnosis of diseases by analyzing the probability of an individual developing a certain outcome event at different values of the predictive indicator. Through logistic regression analysis of multiple factors, independent influencing factors for the outcome event are identified as predictive indicators in the prediction model. Then, multiple predictive indicators are integrated and analyzed using regression analysis to generate a risk nomogram based on a certain proportion (17).
Currently, there are few clinical prediction model studies on DR and VTDR based on non-imaging data. Ke et al. constructed a risk nomogram for predicting the development of VTDR in mild NPDR patients by introducing three variables, including 2-hour C-peptide, UACR, and sural nerve conduction impairment (SNCI). The model achieved a sensitivity, specificity, and AUC of 66.7%, 89.5%, and 0.75, respectively, in the testing set (18).
In most areas of China, there are standard management and regular physical examination protocols for diabetic patients. However, the screening and management system for diabetic retinopathy (DR) remains incomplete. Therefore, the purpose of this study is to develop and validate a VTDR risk prediction scoring model based on systemic parameters and non-ophthalmic imaging data, using the T2DM cohort study data. The goal is to provide a simple scoring system for regions with limited medical resources and primary healthcare institutions. This system can be used to identify high-risk individuals for VTDR, addressing the gaps in existing medical facilities and enhancing healthcare accessibility for at-risk populations.
2 Materials and methods
2.1 The main workflow of this study
The main workflow of this study summarized in Figure 1.
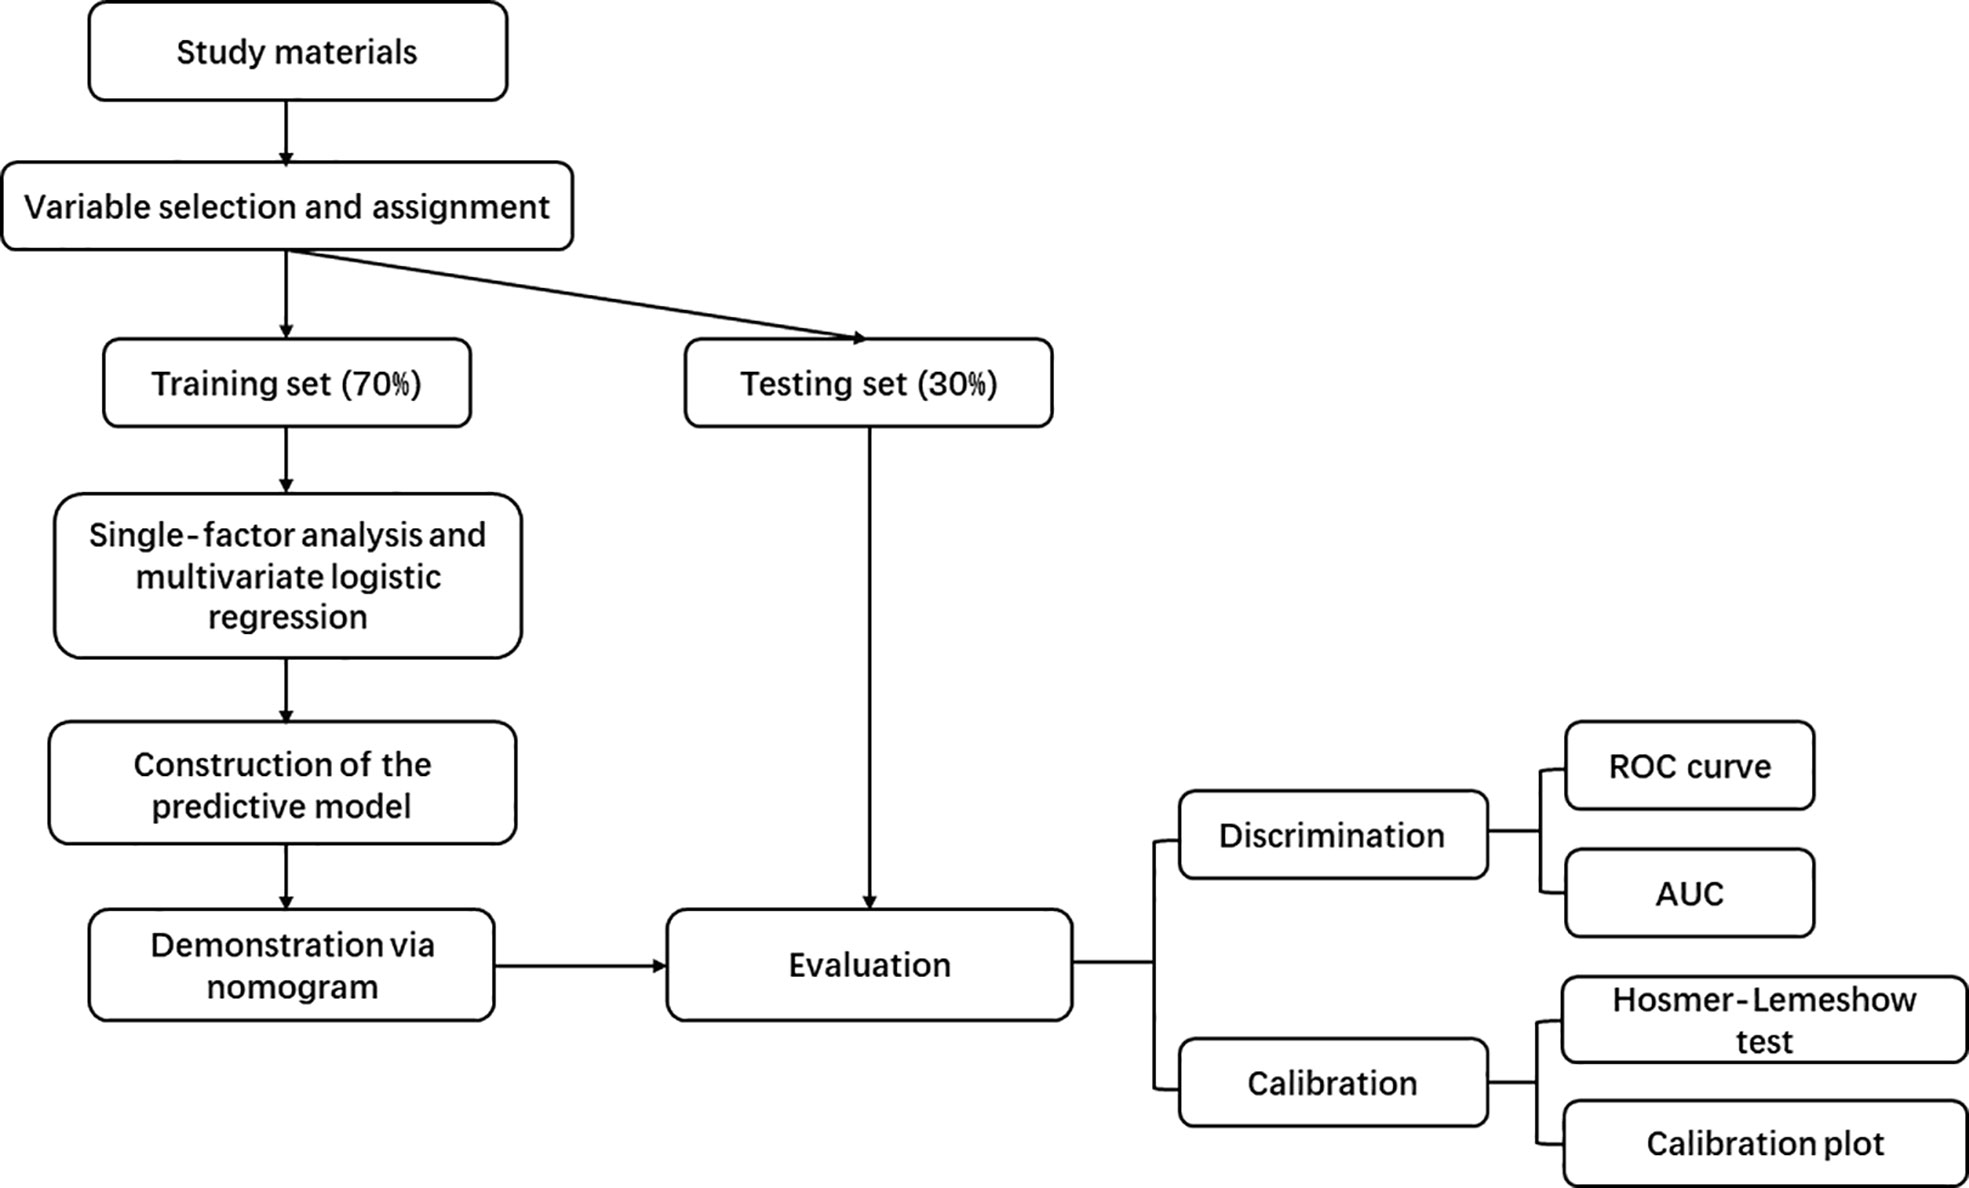
Figure 1 Workflow Diagram.
2.2 Study materials
a) The baseline data of 2677 patients were collected from the Guangdong Shaoguan Diabetes Cohort Study conducted by Zhongshan Ophthalmic Center (ZOC), Sun Yat-sen University in Guangzhou, China in 2019.
b) All patients were diagnosed with T2DM.
c) All patients underwent fundus photography and OCT examinations, and experienced ophthalmologists diagnosed and verified DR and DME. Patients with severe NPDR, PDR, and/or DME were defined as having VTDR.
2.3 Variable selection
PubMed, EMBASE, and other websites were searched using keywords such as “T2DM” and “VTDR” to identify relevant literature and determine the variables to be included in the study. The following patient data were extracted: ID number, Age, Gender, body mass index (BMI), systolic blood pressure (SBP), diastolic blood pressure (DBP), duration of diabetes(Duration), smoking status(Smoking), alcohol consumption(Alcohol), alanine aminotransferase (ALT), aspartate aminotransferase (AST), blood urea nitrogen (BUN), serum creatinine (SCr), uric acid (UA), total cholesterol (TC), triglycerides (TG), high-density lipoprotein (HDL), low-density lipoprotein cholesterol (LDL-C), blood glucose (GLU), glycated hemoglobin (HbA1C), and whether VTDR occurred. The extracted data were organized and merged into one file based on the patient ID number.
2.4 Variable assignment explanation
All categorical variables, including gender, duration of diabetes, smoking, alcohol consumption, residence, and whether VTDR occurred, were assigned values. The assigned values are shown in Table 1.
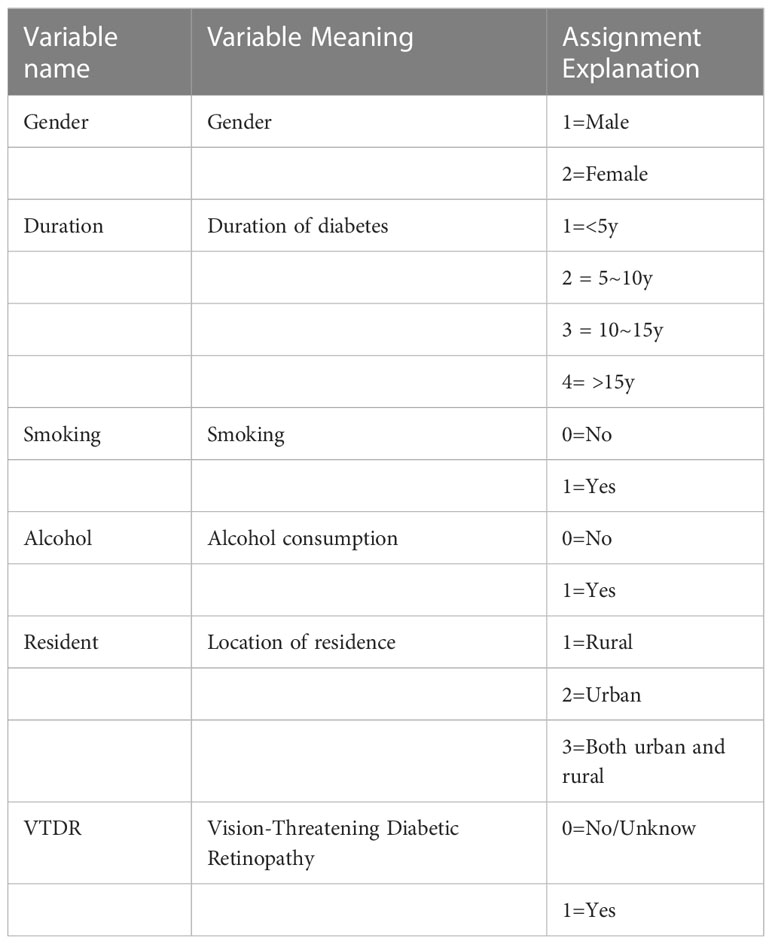
Table 1 Variable Assignment Explanation.
2.5 Construction and presentation of the predictive model
Logistic regression analysis is a statistical technique used to analyze the relationships between multiple variables, where the outcome variable is a categorical variable, including binary, unordered categorical, and ordered categorical variables. The number and types of independent variables are not limited. In this study, the well-organized data was randomly divided into training and testing sets in a 7:3 ratio. Single-factor analysis was conducted on all variables in the training set, and variables with a p-value< 0.05 were included in the multivariable logistic regression to identify independent influencing factors. The multivariable logistic regression is based on the logistic regression model, which establishes a linear equation to describe the relationship between independent variables and log odds. The log odds are then converted to probabilities for predicting and interpreting the outcome categories. The logistic regression model can be represented by the following equation:
logit(p) represents the log odds, p is the probability of the event occurring, X1, X2,…, Xn are the independent variables, and β0, β1, β2,…, βn are the model parameters (coefficients). By estimating the parameter values, the best-fitting model can be obtained to predict the probability of the outcome variable.
We establish a predictive model to identify independent influencing factors of VTDR in patients with T2DM and present it in the form of a Nomogram.
2.6 Evaluation of the predictive model
The ROC curve and AUC was used to evaluate the discrimination of the predictive model, with an AUC range of 0-1, where 1 indicates complete consistency and 0.5 indicates poor consistency. The Hosmer-Lemeshow test and calibration plot were used to calibrate the predictive model and judge the consistency between the predicted probability and the observed probability. When P>0.05 for the Hosmer-Lemeshow test, it can be considered that the predictive model has good calibration.
The calibration plot is a commonly used visual tool for assessing the consistency between model-predicted probabilities and actual observed outcomes. In the calibration plot, the x-axis represents the predicted probabilities from the model, while the y-axis represents the frequency or probabilities of the observed outcomes. The predicted results refer to the model’s outputs obtained by predicting new, unseen samples based on input features and learned parameters. On the other hand, the observed outcomes represent the known class labels of the actual observed samples, which are used to compare the accuracy and effectiveness of the model’s predictions.
3 Statistical methods
Continuous variables that conform to normal distribution are expressed as mean and SD values, while other continuous variables are expressed as median (25-75 percentile). Categorical variables are expressed as percentages. Single-factor analysis and multivariate logistic regression were used to eliminate variables with limited predictive ability. Logistic regression was used to establish a predictive model, and a Nomogram was used to predict the incidence rate. All data were analyzed using SPSS version 27.0 and R version 4.2.2 software, and P<0.05 was considered statistically significant.
4 Results
4.1 Detection of VTDR in patients with T2DM
A total of 2677 patients with T2DM were collected and summarized. Individuals with missing variables were excluded, resulting in a final sample of 2294 patients with T2DM. Among them, 370 patients were diagnosed with VTDR, with a prevalence of 16.13%.
4.2 The statistical description of the training set and testing set
The original dataset consists of 2294 cases, which were randomly divided into a training set and a testing set. The training set includes 1605 cases (70%), and the testing set includes 689 cases (30%). The distribution differences of the 21 variables between the two groups were not statistically significant (P>0.05), as shown in Table 2.
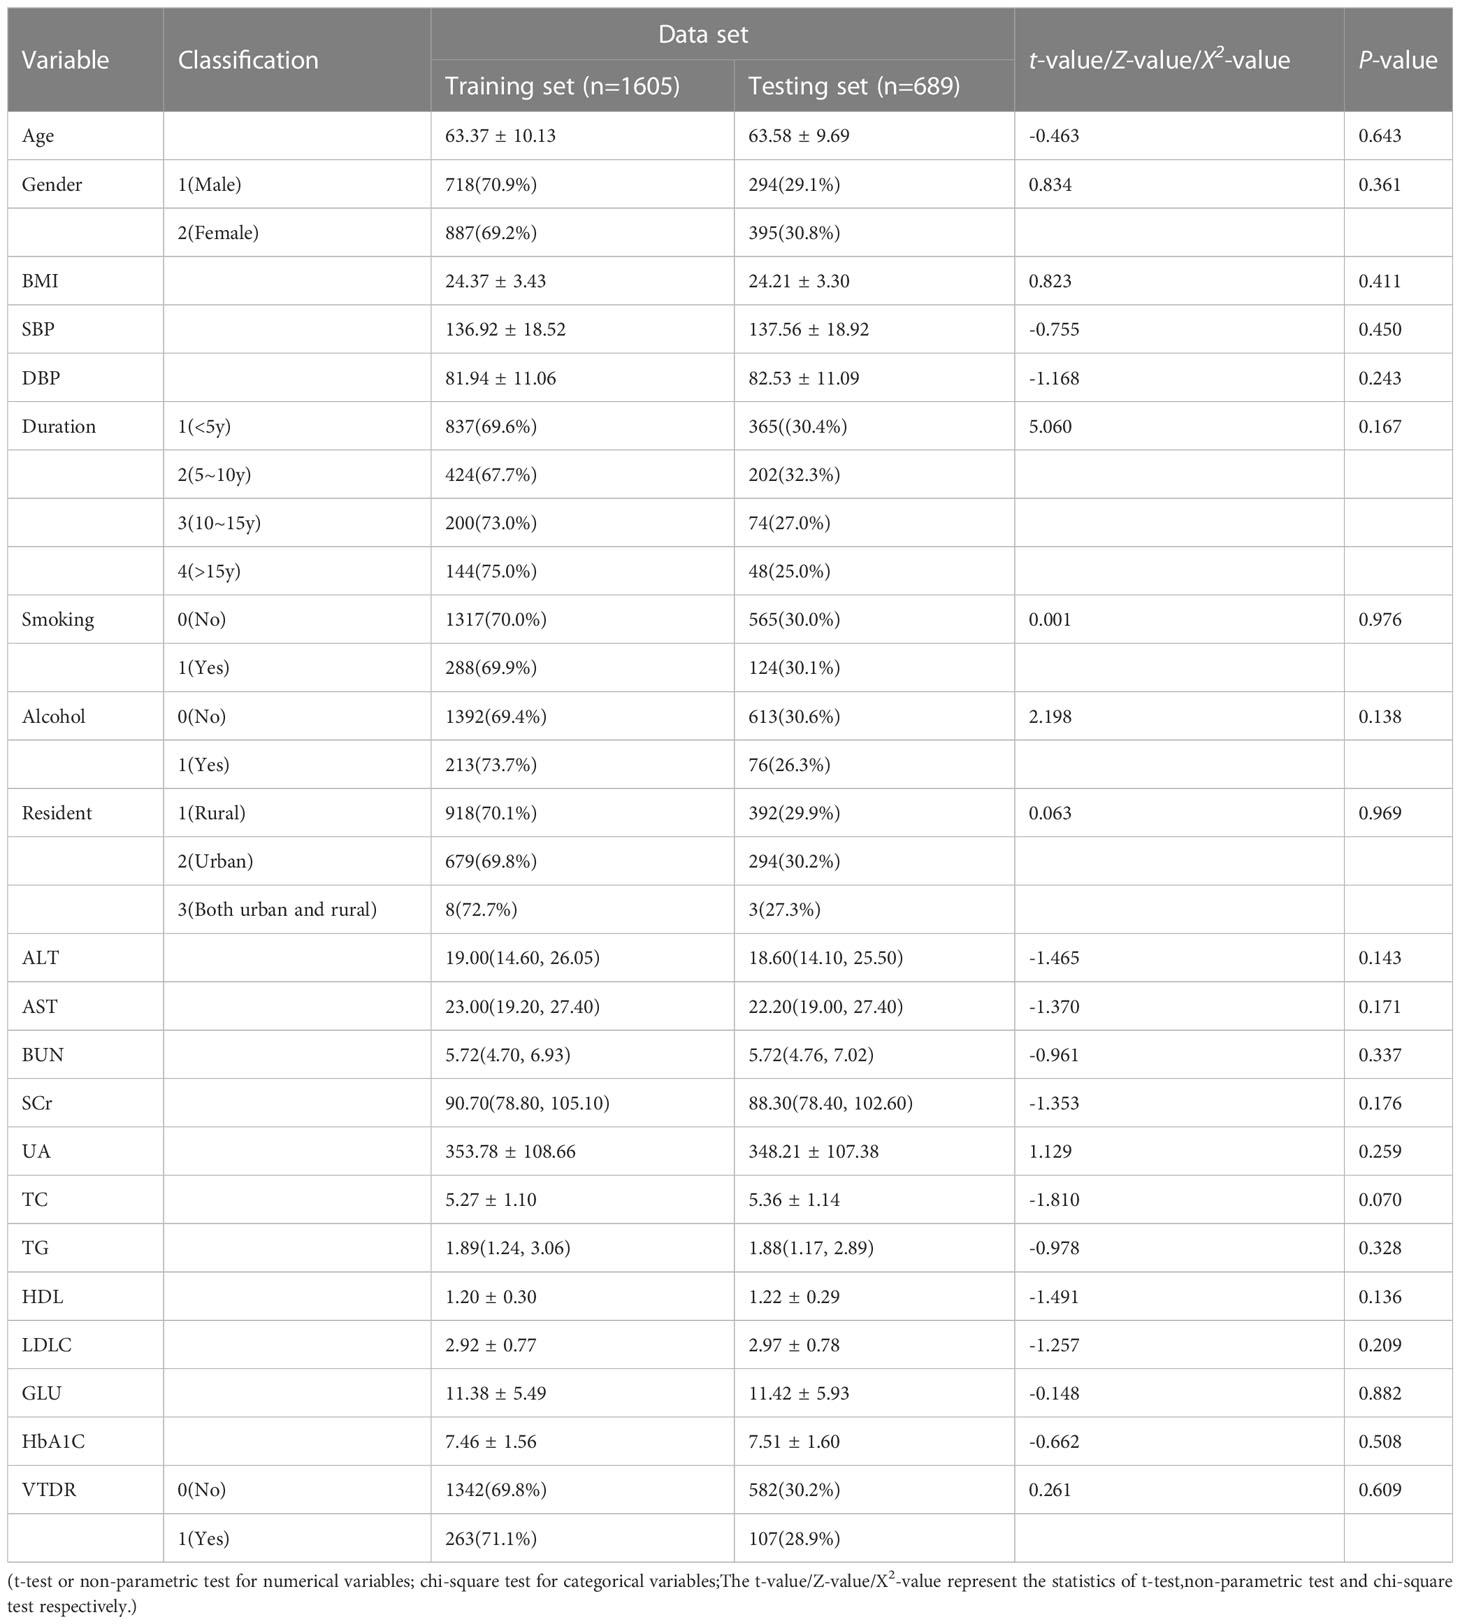
Table 2 Statistical description of the training and testing sets.
4.3 Model variable selection:
4.3.1 Univariate analysis
SPSS was used to perform statistical description on the relevant variables in the training set (1605 cases). The results showed that there were statistically significant differences (P<0.05) in 11 variables, including Age, BMI, SBP, DBP, Duration, ALT, AST, BUN, SCr, GLU, and HbA1C, between the two groups, as shown in Table 3.
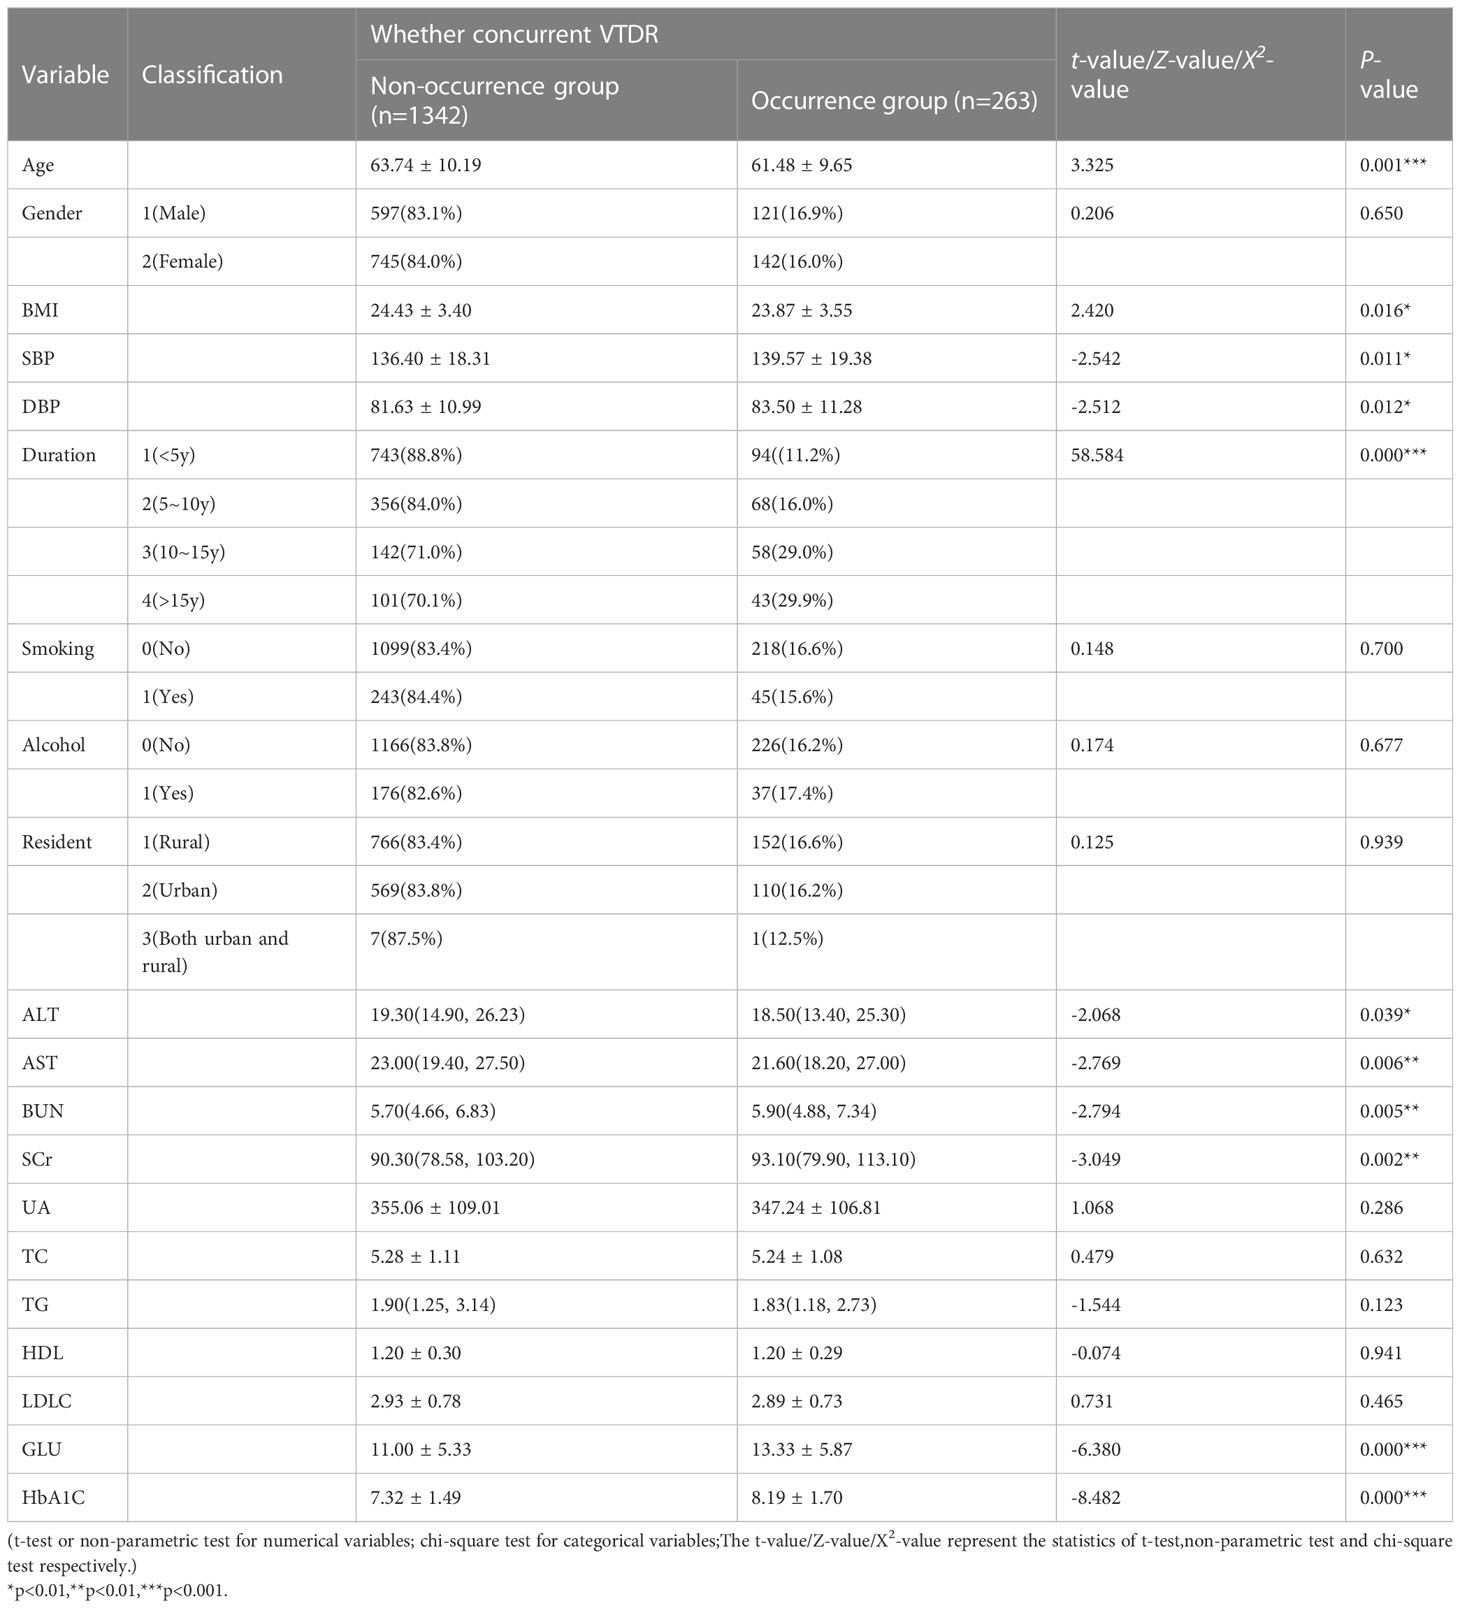
Table 3 Results of Univariate analysis of the training set.
4.3.2 Multivariable logistic regression analysis
The 11 variables identified through univariate analysis, including Age, BMI, SBP, DBP, Duration, ALT, AST, BUN, SCr, GLU, and HbA1C, were included in the binary logistic regression analysis using SPSS. The results showed that Age, BMI, SBP, Duration, and HbA1C (5 variables) were independent risk factors for VTDR in patients with T2DM (P<0.05), as shown in Table 4.
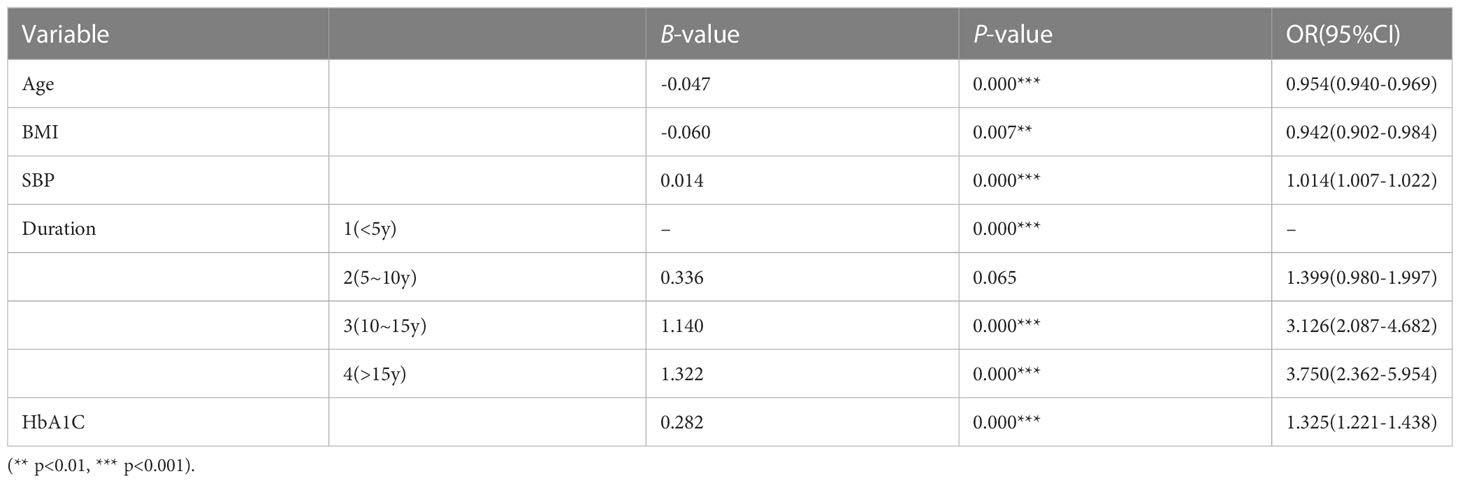
Table 4 Results of multivariate logistic regression analysis.
4.4 Construction of a predictive model for nomogram
This study used the multi-factor binary logistic regression method to select the predictive factors and built a nomogram model to predict the incidence of VTDR in T2DM patients using the “rms” package in Rstudio, based on the predictive factors selected from the multiple factor analysis (Figure 2). Each predictive variable corresponds to a set of numerical values, and the score is obtained by aligning the numerical values on the scale with the point scale at the top. The sum of all the scores corresponds to the total score, which is then aligned with the total point scale at the bottom to obtain the probability of VTDR in T2DM patients.
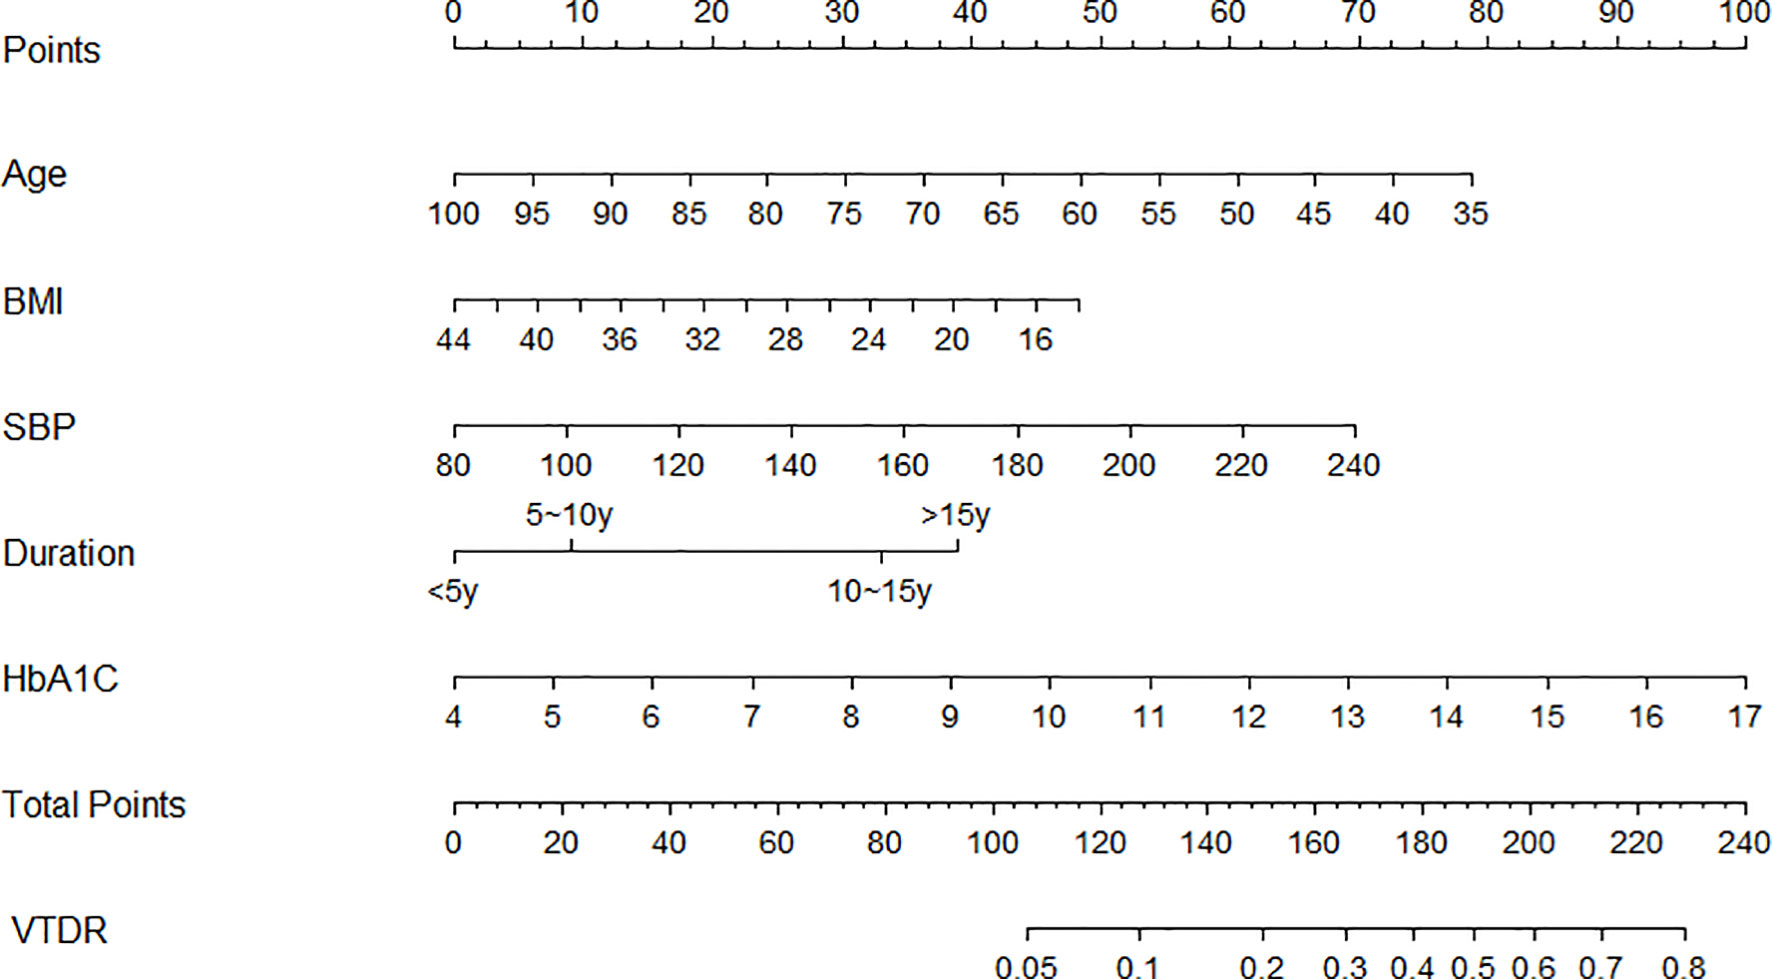
Figure 2 Nomogram prediction model for VTDR complications in T2DM patients.
An example application is as follows: assuming that a 55-year-old (55 points) patient who has been diagnosed with type 2 diabetes mellitus for 10 years (32 points) has a BMI of 20 (40 points), a systolic blood pressure of 160 mmHg (34 points), and an HbA1C of 10% (45 points), his total score would be approximately 206, and the corresponding score would predict that the patient would have a probability of developing VTDR of about 65%.
4.5 Evaluation of the nomogram prediction model
4.5.1 Discrimination
The discrimination results show that the training set AUC is 0.7139 (Figure 3A), and the testing set AUC is 0.6897 (Figure 3B), indicating that the model has the ability to distinguish between the occurrence and non-occurrence of VTDR, which is helpful for risk stratification.
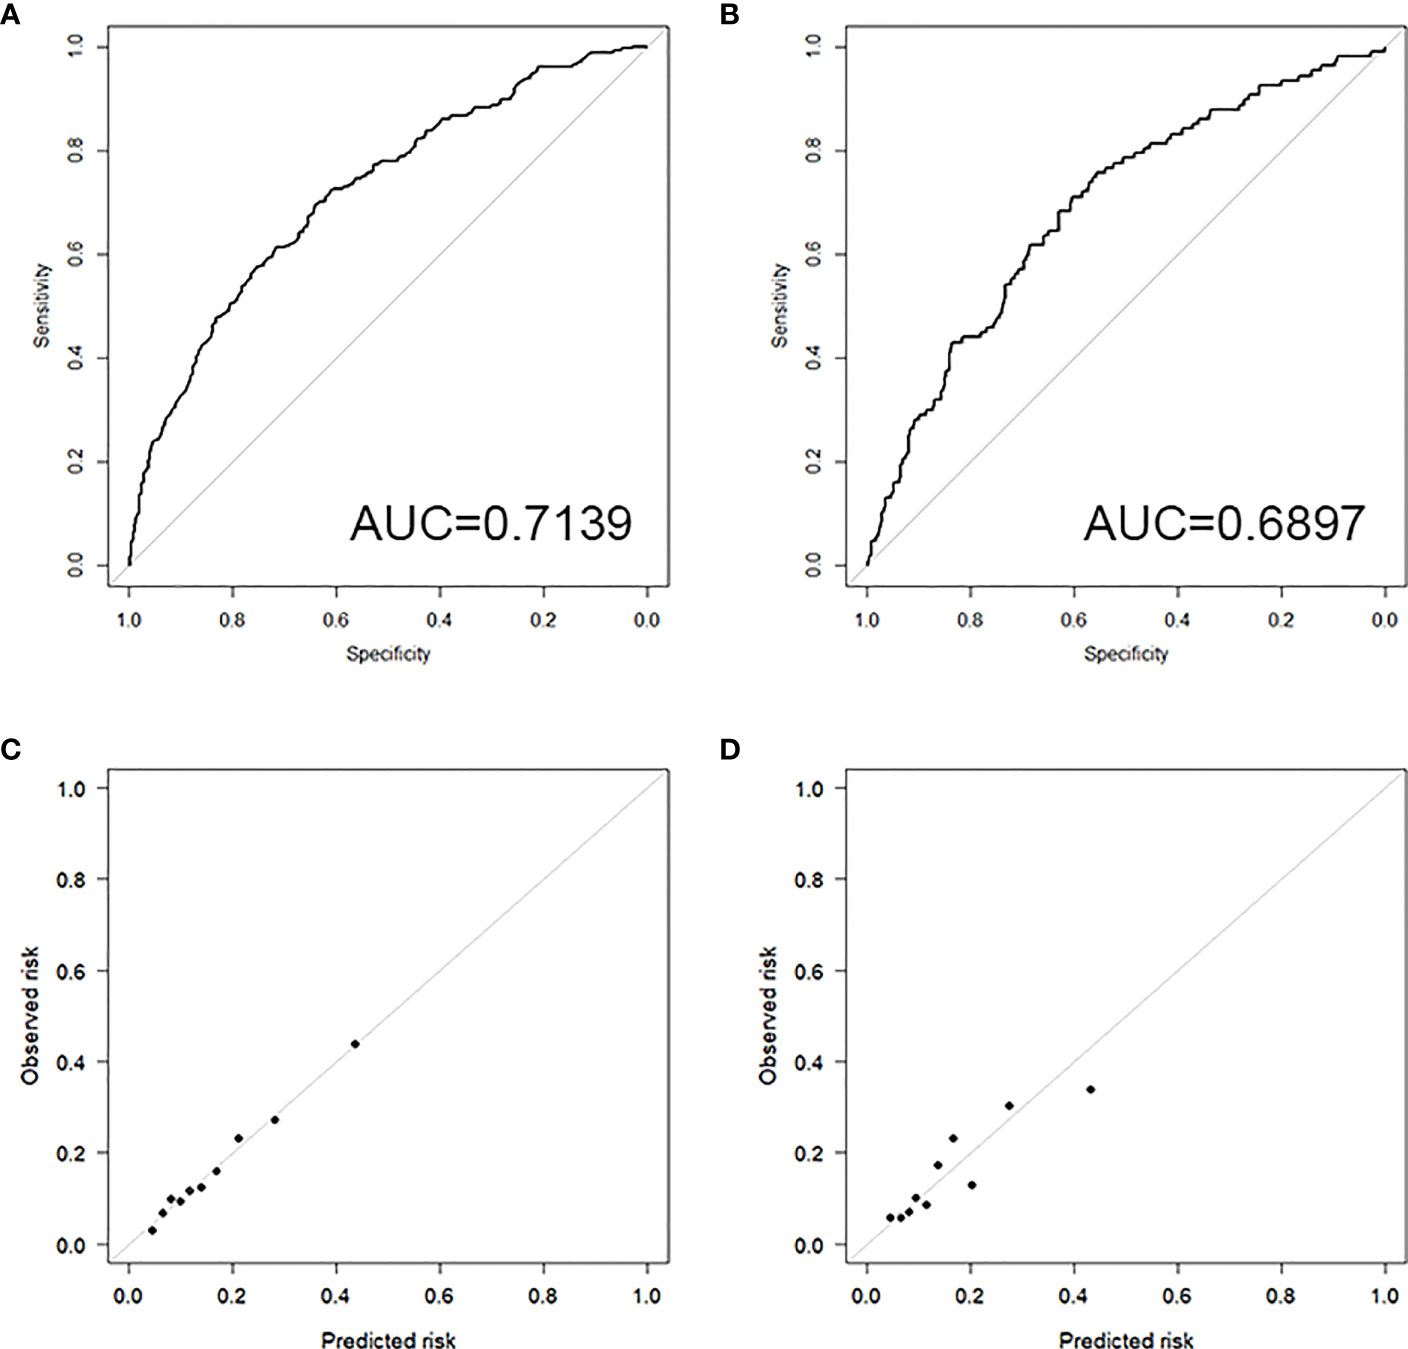
Figure 3 (A) ROC curve of the training set; (B) ROC curve of the testing set; (C) Calibration plot of the training set; (D) Calibration plot of the testing set.
4.5.2 Calibration
4.5.2.1 Hosmer-Lemeshow test
The results of the Hosmer-Lemeshow test show a high level of consistency between the predicted probabilities and the observed probabilities in both the training set (Chi-square=2.2029, P=0.9742) and the testing set (Chi-square=7.6628, P=0.4671).
4.5.2.2 Calibration plot
The calibration plots for both the training set (Figure 3C) and the testing set (Figure 3D) demonstrate good consistency between the predicted and observed outcomes, indicating that the model has good calibration.
5 Discuss
The statistical results of this study showed that Age, BMI, SBP, Duration, and HbA1C were independent influencing factors for VTDR in T2DM patients. Among them, the increase of SBP, Duration, and HbA1C was positively correlated with the onset of VTDR. It is worth noting that the increase of Age and BMI was negatively correlated with the onset of VTDR.
Regression analysis in this study showed an OR for Age of 0.954 (95% CI: 0.940-0.969, p = 0.000), i.e., for every 1-year increase in the age of an individual with T2DM, there was a 4.6% decrease in the risk of concurrent VTDR. This finding indicates that younger patients are at a higher risk of developing the disease compared to older patients. Contrasting with some earlier statistical studies which did not suggest age as a risk factor for DR, our results align with recent epidemiological studies (9, 10). Age, as well as the age of diabetes diagnosis, has been independently associated with macrovascular complications, including mortality, rather than microvascular complications (19, 20). For instance, Peng and Yu’s epidemiological study in Shenzhen, demonstrated a significant increase in the incidence of DR in patients over 60 years of age (21). Additionally, a cohort study on type 1 diabetes patients confirmed a correlation between the age of onset of type 1 diabetes and the occurrence and progression of DR, suggesting that older age at type 1 diabetes onset is associated with faster DR development (22). However, emerging evidence has shown that the diagnosis of type 2 diabetes in young people is linked to worse vascular risk features, higher incidence of complications, and a poorer prognosis (23, 24). Our statistical analysis supports this observation, indicating a higher risk of developing VTDR in younger patients, possibly due to poorer blood sugar control and more severe microvascular damage in this age group. Notably, evidence reveals that young patients exhibit worse blood sugar control compared to elderly patients, potentially owing to distinct phenotypes. Young patients mainly suffer from beta cell loss, whereas elderly patients experience a combination of insulin resistance and beta cell loss (20). In light of these findings, it is essential to conduct further research to clarify the complex relationship between age and DR/VTDR. Understanding the age-related factors influencing the risk of DR can contribute to improved preventive strategies and targeted treatment options.
The results of this study showed an OR for BMI of 0.942 (95% CI: 0.902-0.984, p = 0.007), i.e., for every 1-unit increase in BMI in individuals with T2DM, there was a 5.8% decrease in the risk of concurrent VTDR. Previous studies have found a possible neutral association between BMI and DR, indicating the existence of both protective and adverse effects (25). Han and X’s study showed that a higher BMI increased the risk of developing diabetes but was not related to VTDR (26). However, a large-scale epidemiological study conducted in India in 2022 demonstrated no relationship between BMI and DR, but it did reveal a negative correlation between BMI and VTDR (11). Remarkably, our study’s findings are consistent with the latter study, indicating that an increase in BMI is a protective factor for T2DM patients developing VTDR. Several reasons might account for this. Firstly, previous research has shown that individuals with T2DM and higher BMI tend to have elevated levels of C-peptide, which has been associated with a lower risk of DR (27, 28). Additionally, a higher BMI may reflect better blood sugar control and more aggressive treatment, contributing to the deceleration of DR development (25).
The logistic regression results showed an OR for SBP of 1.014 (95% CI: 1.007-1.022, p = 0.000), suggesting that for every 1-unit increase in SBP in individuals with T2DM, there was a 1.4% increase in the risk of concurrent VTDR. We found a positive correlation between the increase in SBP and the occurrence of VTDR, which is consistent with previous research (10, 29, 30). Specifically, studies have indicated that in Asian patients with well-controlled blood sugar, SBP variability is strongly linked to moderate DR (31). Additionally, a T2DM adult DR screening study in Chinese communities revealed that individuals with lower SBP (<140mmHg) had a significantly reduced risk of developing DR (32). Moreover, a large prospective cohort study of T2DM patients found that both systolic and diastolic blood pressure were associated with an increased risk of transitioning from the asymptomatic phase to mild DR and from mild DR to observable DR, suggesting that blood pressure may play a role in the early development of DR (33). The exact mechanism by which high blood pressure causes DR damage remains unclear. However, it is believed that sustained hypertension may lead to microvascular system structural damage, affecting retinal blood vessel endothelial cells, blood vessels, and surrounding tissues, resulting in retinal perfusion disorders. As a result, eyes with DR become more susceptible to excessive perfusion injury caused by hypertension, thereby accelerating the development of DR (34). Notably, current evidence supports that good blood pressure control is a controllable factor that not only reduces the probability of DR but also slows the comprehensive progression of already occurring DR (2, 33, 35). Additionally, studies have indicated that antihypertensive drugs may have a protective association with VTDR, possibly due to their protective effect on diabetes complications, in addition to their blood pressure-lowering effects (36).
As an indicator of cumulative microvascular system damage, the duration of diabetes has been shown to be positively correlated with the occurrence and development of DR and VTDR (10, 29, 30, 37). In patients with type 2 diabetes, it has been demonstrated that the duration of diabetes is independently associated with both macrovascular events and deaths and microvascular events. For every additional 5 years of diabetes, the adjusted risk of multiple microvascular events increases by 28% (20). However, as an uncontrollable factor, the duration of diabetes can only serve as a predictor and cannot be clinically intervened. Therefore, in high-risk populations, we can only reduce the risk of VTDR by controlling other controllable risk factors.
The study found an OR for HbA1C of 1.325 (95% CI: 1.221-1.438, p = 0.000), i.e., for every 1 percentage point increase in HbA1C in individuals with T2DM, there was a 32.5% increase in the risk of concurrent VTDR. Research has found that the optimal cutoff point for distinguishing HbA1C variables between patients with and without DR is 8.15% (38). However, there is currently no evidence to suggest clinical reference values for the critical point of HbA1C in relation to VTDR. Therefore, this study still considers HbA1C as a continuous variable for research. HbA1C reflects a patient’s blood glucose levels over the past 2-3 months, and its impact on the occurrence and progression of DR and VTDR has been thoroughly studied in previous research (9, 10, 29, 36, 37). The role of hyperglycemia in the occurrence and development of DR may be related to “metabolic memory,” which refers to the lasting adverse effects that high blood glucose has on the occurrence and progression of systemic complications. This mechanism may be due to the rapid changes in blood glucose control, which may not allow the retina enough time to recover from the damaging effects of previously high HbA1C levels (39). Studies have shown that when HbA1C is reduced from 8% to 7%, the risk of retinopathy will decrease by 30%-40% (40). Therefore, lowering HbA1C levels through medication or insulin therapy may be a reliable method for prevention and treatment.
After integrating all independent factors, this study included five variables, Age, BMI, SBP, Duration, and HbA1C, in the construction of a column chart model. Discrimination analysis showed that the training set AUC was 0.7193 and the testing set AUC was 0.6897, which was lower than Ke, J.’s prediction model (18). However, it should be noted that the variables used in Ke, J.’s model, including 2-hour C-peptide, UASCR, and SNCI, are not commonly used clinical observation indicators, indicating that their model may not be widely applicable in the real world (18). In contrast, this study included five clinical data that are relatively easy to obtain (Age, BMI, SBP, Duration, and HbA1C) as predictive factors in the model. Additionally, the Hosmer-Lemeshow test and calibration plot results of the model showed high consistency between the predicted and observed probabilities. Therefore, the comprehensive evaluation of this model is considered relatively ideal.
However, this study still has limitations. Although this study developed a new nomogram for T2DM complicated with VTDR, the modeling and validation data were both from epidemiological data in the same region and did not conduct application experiments in the real world. Therefore, this model still needs further improvement and validation.
6 Conclusion
Age, BMI, SBP, Duration, and HbA1C are independent factors that influence the development of VTDR in T2DM patients. Among them, the increase in SBP, Duration, and HbA1C is positively correlated with the incidence of VTDR, while the increase in age and BMI is negatively correlated with the incidence of VTDR. By introducing these 5 variables, the nomogram can help stratify the risk of VTDR in T2DM patients. However, further validation and improvement are still needed to enhance the reliability and generalizability of this model in real-world settings.
Data availability statement
The original contributions presented in the study are included in the article/supplementary material, further inquiries can be directed to the corresponding author/s.
Ethics statement
The studies involving humans were approved by Zhongshan Ophthalmic Centre Ethics Review Committee. The studies were conducted in accordance with the local legislation and institutional requirements. Written informed consent for participation in this study was provided by the participants’ legal guardians/next of kin.
Author contributions
DG, LF, and YC: methodology, formal analysis, and writing – original draft. IC, JG, ZY, and XS: methodology and writing – review & editing. WY and JW: conceptualization, resources, writing – review & editing, and funding acquisition. All authors contributed to the article and approved the submitted version.
Funding
This work was supported by National Nature Science Foundation of China (82070961), Supported by Shenzhen Fund for Guangdong Provincial High-level Clinical Key Specialties (No.SZGSP014), Supported by Shenzhen Key Medical Discipline Construction Fund (No.SZXK037), Supported by Shenzhen Science and Technology Program (No.JCYJ20220818103207015), Supported by the Medical Science and Technology Research Fund Project of Guangdong Province (No.A2022403), Supported by Science and Technology Projects in Guangzhou (No.202201020089).
Conflict of interest
The authors declare that the research was conducted in the absence of any commercial or financial relationships that could be construed as a potential conflict of interest.
Publisher’s note
All claims expressed in this article are solely those of the authors and do not necessarily represent those of their affiliated organizations, or those of the publisher, the editors and the reviewers. Any product that may be evaluated in this article, or claim that may be made by its manufacturer, is not guaranteed or endorsed by the publisher.
References
1. Saeedi P, Petersohn I, Salpea P, Malanda B, Karuranga S, Unwin N, et al. Global and regional diabetes prevalence estimates for 2019 and projections for 2030 and 2045: Results from the International Diabetes Federation Diabetes Atlas, 9(th) edition. Diabetes Res Clin Pract (2019) 157:107843. doi: 10.1016/j.diabres.2019.107843
2. Cheung N, Mitchell P, Wong TY. Diabetic retinopathy. Lancet (2010) 376(9735):124–36. doi: 10.1016/S0140-6736(09)62124-3
3. Sabanayagam C, Chee ML, Banu R, Cheng CY, Lim SC, Tai ES, et al. Association of Diabetic Retinopathy and Diabetic Kidney Disease With All-Cause and Cardiovascular Mortality in a Multiethnic Asian Population. JAMA Netw Open (2019) 2(3):e191540. doi: 10.1001/jamanetworkopen.2019.1540
4. Hsu CY, Lee CM, Chou KY, Lee CY, Chen HC, Chiou JY, et al. The Association of Diabetic Retinopathy and Cardiovascular Disease: A 13-Year Nationwide Population-Based Cohort Study. Int J Environ Res Public Health (2021) 18(15). doi: 10.3390/ijerph18158106. Cited in: Pubmed
5. Simo R, Baneras J, Hernandez C, Rodriguez-Palomares J, Valente F, Gutierrez L, et al. Diabetic retinopathy as an independent predictor of subclinical cardiovascular disease: baseline results of the PRECISED study. BMJ Open Diabetes Res Care (2019) 7(1):e000845. doi: 10.1136/bmjdrc-2019-000845
6. Wilkinson CP, Ferris FL 3rd, Klein RE, Lee PP, Agardh CD, Davis M, et al. Proposed international clinical diabetic retinopathy and diabetic macular edema disease severity scales. Ophthalmology (2003) 110(9):1677–82. doi: 10.1016/S0161-6420(03)00475-5
7. Teo ZL, Tham YC, Yu M, Chee ML, Rim TH, Cheung N, et al. Global Prevalence of c'c and Projection of Burden through 2045: Systematic Review and Meta-analysis. Ophthalmology (2021) 128(11):1580–91. doi: 10.1016/j.ophtha.2021.04.027
8. Oshitari T. The Pathogenesis and Therapeutic Approaches of Diabetic Neuropathy in the Retina. Int J Mol Sci (2021) 22(16). doi: 10.3390/ijms22169050
9. Yau JW, Rogers SL, Kawasaki R, Lamoureux EL, Kowalski JW, Bek T, et al. Global prevalence and major risk factors of diabetic retinopathy. Diabetes Care (2012) 35(3):556–64. doi: 10.2337/dc11-1909
10. Tan GS, Gan A, Sabanayagam C, Tham YC, Neelam K, Mitchell P, et al. Ethnic Differences in the Prevalence and Risk Factors of Diabetic Retinopathy: The Singapore Epidemiology of Eye Diseases Study. Ophthalmology (2018) 125(4):529–36. doi: 10.1016/j.ophtha.2017.10.026
11. Raman R, Vasconcelos JC, Rajalakshmi R, Prevost AT, Ramasamy K, Mohan V, et al. Prevalence of diabetic retinopathy in India stratified by known and undiagnosed diabetes, urban-rural locations, and socioeconomic indices: results from the SMART India population-based cross-sectional screening study. Lancet Glob Health (2022) 10(12):e1764–73. doi: 10.1016/S2214-109X(22)00411-9
12. Wang L, Jin L, Wang W, Gong X, Li Y, Li W, et al. Association of renal function with diabetic retinopathy and macular oedema among Chinese patients with type 2 diabetes mellitus. Eye (Lond) (2022). doi: 10.1038/s41433-022-02173-5
13. Bhargava M, Cheung CY, Sabanayagam C, Kawasaki R, Harper CA, Lamoureux EL, et al. Accuracy of diabetic retinopathy screening by trained non-physician graders using non-mydriatic fundus camera. Singapore Med J (2012) 53(11):715–9.
14. Teo ZL, Tham YC, Yu M, Cheng CY, Wong TY, Sabanayagam C. Do we have enough ophthalmologists to manage vision-threatening diabetic retinopathy? A global perspective. Eye (Lond) (2020) 34(7):1255–61. doi: 10.1038/s41433-020-0776-5
15. Ipp E, Liljenquist D, Bode B, Shah VN, Silverstein S, Regillo CD, et al. Pivotal Evaluation of an Artificial Intelligence System for Autonomous Detection of Referrable and Vision-Threatening Diabetic Retinopathy. JAMA Netw Open (2021) 4(11):e2134254. doi: 10.1001/jamanetworkopen.2021.34254
16. Bellemo V, Lim ZW, Lim G, Nguyen QD, Xie Y, Yip MYT, et al. Artificial intelligence using deep learning to screen for referable and vision-threatening diabetic retinopathy in Africa: a clinical validation study. Lancet Digit Health (2019) 1(1):e35–44. doi: 10.1016/S2589-7500(19)30004-4
17. van Smeden M, Reitsma JB, Riley RD, Collins GS, Moons KG. Clinical prediction models: diagnosis versus prognosis. J Clin Epidemiol (2021) 132:142–5. doi: 10.1016/j.jclinepi.2021.01.009
18. Ke J, Li K, Cao B. A Nomogram for Predicting Vision-Threatening Diabetic Retinopathy Among Mild Diabetic Retinopathy Patients: A Case-Control and Prospective Study of Type 2 Diabetes. Diabetes Metab Syndr Obes (2023) 16:275–83. doi: 10.2147/DMSO.S394607
19. Nanayakkara N, Ranasinha S, Gadowski A, Heritier S, Flack JR, Wischer N, et al. Age, age at diagnosis and diabetes duration are all associated with vascular complications in type 2 diabetes. J Diabetes Complications (2018) 32(3):279–90. doi: 10.1016/j.jdiacomp.2017.11.009
20. Zoungas S, Woodward M, Li Q, Cooper ME, Hamet P, Harrap S, et al. Impact of age, age at diagnosis and duration of diabetes on the risk of macrovascular and microvascular complications and death in type 2 diabetes. Diabetologia (2014) 57(12):2465–74. doi: 10.1007/s00125-014-3369-7
21. Peng Y, Guo X, Liu J, Yao Y, Guo H, Wang Y, et al. Incidence and risk factors for diabetic retinopathy in the communities of Shenzhen. Ann Palliat Med (2021) 10(1):615–24. doi: 10.21037/apm-20-2526
22. Schreur V, van Asten F, Ng H, Weeda J, Groenewoud JMM, Tack CJ, et al. Risk factors for development and progression of diabetic retinopathy in Dutch patients with type 1 diabetes mellitus. Acta Ophthalmol (2018) 96(5):459–64. doi: 10.1111/aos.13815
23. Narasimhan S, Weinstock RS. Youth-onset type 2 diabetes mellitus: lessons learned from the TODAY study. Mayo Clin Proc (2014) 89(6):806–16. doi: 10.1016/j.mayocp.2014.01.009
24. Group TS. Rapid rise in hypertension and nephropathy in youth with type 2 diabetes: the TODAY clinical trial. Diabetes Care (2013) 36(6):1735–41. doi: 10.2337/dc12-2420
25. Zhou Y, Zhang Y, Shi K, Wang C. Body mass index and risk of diabetic retinopathy: A meta-analysis and systematic review. Med (Baltimore). (2017) 96(22):e6754. doi: 10.1097/MD.0000000000006754
26. Han X, Jiang Y, Niu Y, Zhu Y, Huang W, He M. Differential associations between body mass index with diabetes and vision-threatening diabetic retinopathy in an adult Chinese population. Br J Ophthalmol (2022) 106(6):852–6. doi: 10.1136/bjophthalmol-2020-318252
27. Wang Y, Wan H, Chen Y, Xia F, Zhang W, Wang C, et al. Association of C-peptide with diabetic vascular complications in type 2 diabetes. Diabetes Metab (2020) 46(1):33–40. doi: 10.1016/j.diabet.2019.04.004
28. Huang Y, Wang Y, Liu C, Zhou Y, Wang X, Cheng B, et al. C-peptide, glycaemic control, and diabetic complications in type 2 diabetes mellitus: A real-world study. Diabetes Metab Res Rev (2022) 38(4):e3514. doi: 10.1002/dmrr.3514
29. Cui Y, Zhang M, Zhang L, Zhang L, Kuang J, Zhang G, et al. Prevalence and risk factors for diabetic retinopathy in a cross-sectional population-based study from rural southern China: Dongguan Eye Study. BMJ Open (2019) 9(9):e023586. doi: 10.1136/bmjopen-2018-023586
30. Sun Q, Jing Y, Zhang B, Gu T, Meng R, Sun J, et al. The Risk Factors for Diabetic Retinopathy in a Chinese Population: A Cross-Sectional Study. J Diabetes Res (2021) 2021:5340453. doi: 10.1155/2021/5340453
31. Foo V, Quah J, Cheung G, Tan NC, Ma Zar KL, Chan CM, et al. HbA1c, systolic blood pressure variability and diabetic retinopathy in Asian type 2 diabetics. J Diabetes (2017) 9(2):200–7. doi: 10.1111/1753-0407.12403
32. Pan CW, Wang S, Xu CL, Song E. Combined effect of glycemic and blood pressure control on diabetic retinopathy among Chinese with type-2 diabetes mellitus. Diabetol Metab Syndr (2018) 10:73. doi: 10.1186/s13098-018-0377-7
33. Liu Y, Wang M, Morris AD, Doney AS, Leese GP, Pearson ER, et al. Glycemic exposure and blood pressure influencing progression and remission of diabetic retinopathy: a longitudinal cohort study in GoDARTS. Diabetes Care (2013) 36(12):3979–84. doi: 10.2337/dc12-2392
34. Wong TY, Mitchell P. The eye in hypertension. Lancet (2007) 369(9559):425–35. doi: 10.1016/S0140-6736(07)60198-6
35. Do DV, Wang X, Vedula SS, Marrone M, Sleilati G, Hawkins BS, et al. Blood pressure control for diabetic retinopathy. Cochrane Database Syst Rev 1:CD006127. doi: 10.1002/14651858.CD006127.pub2
36. Stram DA, Jiang X, Varma R, Torres M, Burkemper BS, Choudhury F, et al. Factors Associated with Prevalent Diabetic Retinopathy in Chinese Americans: The Chinese American Eye Study. Ophthalmol Retina (2018) 2(2):96–105. doi: 10.1016/j.oret.2017.05.014
37. Jin G, Xiao W, Ding X, Xu X, An L, Congdon N, et al. Prevalence of and Risk Factors for Diabetic Retinopathy in a Rural Chinese Population: The Yangxi Eye Study. Invest Ophthalmol Vis Sci (2018) 59(12):5067–73. doi: 10.1167/iovs.18-24280
38. Setareh J, Hoseinzade G, Khoundabi B, Kamali M, Ebrahimi A, Fazlollahpour-Naghibi A, et al. Can the level of HbA(1)C predict diabetic retinopathy among type II diabetic patients? BMC Ophthalmol (2022) 22(1):415. doi: 10.1186/s12886-022-02608-3
39. Zhang L, Chen B, Tang L. Metabolic memory: mechanisms and implications for diabetic retinopathy. Diabetes Res Clin Pract (2012) 96(3):286–93. doi: 10.1016/j.diabres.2011.12.006
Keywords: diabetes mellitus type 2, diabetic retinopathy, vision-threatening diabetic retinopathy, risk factors, prediction model
Citation: Gong D, Fang L, Cai Y, Chong I, Guo J, Yan Z, Shen X, Yang W and Wang J (2023) Development and evaluation of a risk prediction model for diabetes mellitus type 2 patients with vision-threatening diabetic retinopathy. Front. Endocrinol. 14:1244601. doi: 10.3389/fendo.2023.1244601
Received: 22 June 2023; Accepted: 02 August 2023;
Published: 24 August 2023.
Edited by:
Chunjie Jiang, University of Pennsylvania, United StatesReviewed by:
Mengmeng Zhai, Alliance Pharma, United StatesZhiying Xie, University of Washington, United States
Copyright © 2023 Gong, Fang, Cai, Chong, Guo, Yan, Shen, Yang and Wang. This is an open-access article distributed under the terms of the Creative Commons Attribution License (CC BY). The use, distribution or reproduction in other forums is permitted, provided the original author(s) and the copyright owner(s) are credited and that the original publication in this journal is cited, in accordance with accepted academic practice. No use, distribution or reproduction is permitted which does not comply with these terms.
*Correspondence: Weihua Yang, YmVuYmVuMDYwNkAxMzkuY29t; Jiantao Wang, d2FuZ2ppYW50YW82NUAxMjYuY29t
†Present address: Di Gong, The First Affiliated Hospital of Jinan University, Jinan University, Guangzhou, Guangdong, China
‡These authors have contributed equally to this work and share first authorship