
94% of researchers rate our articles as excellent or good
Learn more about the work of our research integrity team to safeguard the quality of each article we publish.
Find out more
ORIGINAL RESEARCH article
Front. Endocrinol., 04 August 2023
Sec. Adrenal Endocrinology
Volume 14 - 2023 | https://doi.org/10.3389/fendo.2023.1235243
 Helena Hanschell1
 Salvador Diaz-Cano2†Alfredo Blanes3Nadia Talat1Gabriele Galatá1Simon Aylwin4†
 Klaus Martin Schulte1,5*†
Aim: We seek a simple and reliable tool to predict malignant behavior of pheochromocytoma and paraganglioma (PPGL).
Methods: This single-center prospective cohort study assessed size of primary PPGLs on preoperative cross-sectional imaging and prospectively scored specimens using the Pheochromocytoma of the Adrenal Gland Scaled Score (PASS). Multiplication of PASS points with maximum lesion diameter (in mm) yielded the SIZEPASS criterion. Local recurrence, metastasis or death from disease were surrogates defining malignancy.
Results: 76 consecutive PPGL patients, whereof 58 with pheochromocytoma and 51 female, were diagnosed at a mean age of 52.0 ± 15.2 years. 11 lesions (14.5%) exhibited malignant features at a median follow-up (FU) of 49 months (range 4-172 mo). Median FU of the remaining cohort was 139 months (range 120-226 mo). SIZEPASS classified malignancy with an area under the curve (AUC) of 0.97 (95%CI 0.93-1.01; p<0.0001). Across PPGL, SIZEPASS >1000 outperformed all known predictors of malignancy, with sensitivity 91%, specificity 94%, and accuracy 93%, and an odds ratio of 72 fold (95%CI 9-571; P<0.001). It retained an accuracy >90% in cohorts defined by location (adrenal, extra-adrenal) or mutation status.
Conclusions: The SIZEPASS>1000 criterion is a lesion-based, clinically available, simple and effective tool to predict malignant behavior of PPGLs independently of age, sex, location or mutation status.
Chromaffin and neural progenitor cells share many features (1) and cross-differentiate from the same progenitors (2). Tumors derived from chromaffin progenitor cells in the adrenal medulla (3), or from autonomic paraganglia of the sympathetic or parasympathetic nervous system, define the group of non-epithelial neuroendocrine tumors (4). However, nestin-positive progenitor cells or Sox-10 deplete-initiated chromaffin cells may escape physiological controls to form tumors (5). These neoplasms are commonly referred to as paragangliomas (PGL), the special and more prevalent case of adrenal tumors identified as adrenal paraganglioma or pheochromocytoma (PCC), whilst all other lesions are identified as extra-adrenal paragangliomas (6). The joint cohort of adrenal and extra-adrenal lesions is identified as pheochromocytoma paraganglioma (PPGL).
PPGL cause significant harm and necessitate surgical resection. Major adverse events are driven by excessive catecholamine secretion. They include cardiovascular events such as arterial hypertension with hypertensive crisis, arrhythmia or cardiomyopathy to the point of cardiac failure (7), stroke, kidney damage, and derailed glucose homeostasis. Space-occupying effects of primary lesions are uncommon, but malignant invasion of major organs or vessels, local recurrence following surgical removal, distant metastasis or ongoing catecholamine excess, may eventually result in death.
Little is known how to select at-risk patients for more stringent FU or adjuvant therapy. An upfront diagnosis of malignancy would be of paramount importance. However, in absence of clear-cut histopathological features, the WHO abandoned classification of PGLs as benign and malignant. Instead, any PPGL is considered to have malignant potential (6). This approach is academically justified, yet it fails to satisfy core demands of clinical care. Clinicians need to provide the patient with a reasonably confident outlook on their prognosis and the expected life impact of their condition, whilst reliable risk assessment would help steer follow-up and eventual pre-emptive treatment interventions.
There is a quest for clinical, histopathological or genetic markers predicting malignant behavior (8). Critical insight can be gleaned from a large, retrospective multicenter study comprising 1127 patients with PPGLs, genotyping, and long-term follow-up (9). Whilst 70% of recurrences occurs within the first decade, 17.7% of lesions occur only after 15 years (9). The nature of driver mutations, or their absence, defines three clusters with varying degrees of probability of being malignant (9). Sporadic PPGLs recur at a rate of 14.7%, similar to 14.9% with mutations in kinase pathways, whilst 47.5% of lesion with mutations in hypoxia pathways recurred (9). In sporadic PPGLs, critical features associated with malignancy are a noradrenergic pattern of hormone secretion, tumor size greater than 5cm, and extra-adrenal location, whilst age and sex had no importance (9).
Many former studies are limited by follow-up. Some scores are exclusively based on clinical criteria, e.g. ASES (10), or histopathological criteria, e.g. PASS (11, 12), whilst others combine features from both categories, e.g. GAPP (13, 14), mGAPP, COPPS (15), or SGAP (16–18). Of these, the Composite Pheochromocytoma/paraganglioma Prognostic Score (COPPS), including tumor size, necrosis, and vascular invasion as well as loss of immunohistochemical staining for PS100 and SDHB, stands out with a sensitivity of 100% and a specificity of 94.7%, whilst the PASS score performed with a sensitivity of merely 66.7% in the same cohort (15). The bulk of work support histopathological criteria identifiable from routinely stained samples and the age-old established malignancy predictor lesion size as key independent predictors of malignant behavior.
Promoting health equity and practice relevance of academic progress supports extending exploration beyond high-end biomarkers from advanced sequencing or subspecialist immunohistochemistry to more accessible information from common clinical-diagnostic pathways such as imaging or histopathology with conventional staining. Mathematical modelling supposes that scores derived from adding score points or dependent on the upfront categorical classification of individual variables are vulnerable to bias at threshold definitions. We therefore investigate the predictive value of a score derived from multiplication, rather than addition, of histopathological scoring and lesion size.
We refer to definitions as per the World Health Organization. Chromaffin tumors of the second sympathetic of parasympathetic neurons are termed paraganglioma (PGL). Those tumors located in the adrenal are identified as “adrenal PGL” or pheochromocytoma (PCC), whilst all other PGLs are identified as “extra-adrenal PGL”; together, adrenal and extra-adrenal PPGLs are identified as PPGLs.
A series of consecutive patients with PPGL (n=78) were treated in a single tertiary adrenal referral center between 2004 and 2013. We excluded two patients with an initial diagnosis of multifocal PPGLs, because the origin of any recurrence could not have been ascertained from any specific lesion and hence its size or PASS. Patients underwent pre- and post-operative scrutiny in King’s Adrenal Multidisciplinary Team Meeting (MDT) with complete retention and discussion of data on clinical and biochemical presentation, treatment modality, histology and outcomes. The MDT comprises specialist input from endocrinology, endocrine surgery, radiology, nuclear medicine, histopathology, clinical chemistry and, where appropriate, clinical oncology and genetics. Comprehensive MDT reports and King’s online Electronic Patients Record (EPR) record relevant data and follow-up. For this study, all data were retained in a deanonymized state only, and no data enabling patient recognition are presented in this study. The study was assessed by the United Kingdom’s Integrated Research Application System (IRAS), IRAS Project ID 329934.
We observed significant differences between the gross size dimensions of the histopathological specimens and the size of PPGLs on preoperative cross-sectional imaging (unpublished data), most likely due to volume losses, when arteries are clamped first, and volume gains, when lesion veins are clamped first. We therefore assessed lesion size on preoperative computed tomograms (CT) or magnetic resonance tomograms (MRI), at least one of which was available in all cases. Two independent examiners (HH, KMS) assessed maximal lesion diameter on transverse, coronal, and transverse reconstructions. The statistical analysis included only the largest diameter for each lesion.
Specimens were generously sampled. Tumors less than 5cm were wholly embedded. We embedded 2-3 blocks per cm length of maximum dimension for lesions larger than 5cm. All hematoxylin and eosin-stained (H&E) slides from every patient were reviewed for morphologic assessment. The Pheochromocytoma of the Adrenal gland Scaled Score (PASS) was evaluated as described and applied using the criteria initially proposed (11). All cases were independently reviewed by two pathologists (SDC, AB) commanding expertise in the histopathology of endocrine tumors and who were blinded to clinical outcomes (recurrence, metastasis). In case of disagreement in risk stratification, lesions were discussed during simultaneous inspection before final categorization. Inter-observer agreement was assessed using κ statistics; the strength of the former was evaluated with criteria previously described by Landis and Koch (19). Mutation testing was performed according to guidelines. Panels varied over time.
All patients were followed up for at least 120 months (10 years) after diagnosis or until death from PGL or other causes. Lesion behavior was defined as “malignant” if either of the following criteria was met: a) at the time of diagnosis: imaging evidence of locoregional (lymph nodal metastasis) or distant metastasis or histological evidence of tumor cells at sites where chromaffin tissue is not usually present (e.g. lymph nodes, liver, or bone) (20) b) locoregional recurrence during follow-up (i.e. imaging or histologic proof of PGL tissue at the site of prior resection or in neighboring lymph nodes) after initial complete tumor eradication (documented by negative biochemical and imaging tests) (21) or c) metastasis during follow-up. Of note, the definition of recurrence or metastasis excluded the occurrence of new PPGLs affecting the contralateral adrenal or ectopic chromaffin tissue in patients with known familial PCCs. Time to recurrence in months was counted between initial surgery and documentation of recurrence. Outcome analysis for recurrence-free survival (RFS) was defined as either death due to disease and/or recurrence/persistence of disease at any time.
Means between groups were compared using Student’s t test. Univariate survival analysis was performed using Kaplan-Meier analysis. Performance of the classification model at all classification thresholds was analyzed using receiver operating characteristic curves (ROC curves). Areas under the curve (AUC) values of 0.8-0.9 were defined as excellent; AUC values of 0.9-1.0 were defined as outstanding (22). For all tests, results with two-sided analysis meeting a threshold of p<0.05 were considered statistically significant. Statistical analyses were performed using SPPS statistics software version 27.0 (IBM). Evaluation of criteria for their performance as diagnostic test was performed using the MedCalc Software Ltd. Diagnostic test evaluation calculator (Version 22.009; accessed July 5, 2023), https://www.medcalc.org/calc/diagnostic_test.php. Data are corrected for prevalence of malignant behavior in the analyzed cohort, i.e. 11/76 or 14.5% for the PPGL cohort or prevalence in specific sub-cohorts analyzed.
The cohort of n= 76 individuals, mean age 52.0 ± 15.2 years, comprised 51 female patients (67.1%). During the observation period, a malignant phenotype was identified in 11 patients, 6 in female patients, with no sex correlation (Pearson 2.73 and Fisher exact test at p=0.1). It manifested as locoregional recurrence or metastasis at a median follow-up of 49 months (range 4-172 mo). The remaining cohort was followed for a median of 141 months (mean 152 ± 30 mo; range 120-226 mo) or until death.
Genetic testing was performed in 35/76 patients (46.1%). It identified driver mutations in the hypoxia pathway in 15/35 (42.9%) and kinase pathways in 4/35(11.4%). Follow-up for patients with sporadic PPGLS was a median of 132 months (mean 136 ± 42; range 30-226), with a median of 90 months (mean 100 ± 68; range 10-210) in the group of hereditary PPGLs.
Lesion size, defined as largest diameter on cross-sectional imaging in mm, did not significantly vary with age or sex (female 67 ± 41 vs 71 ± 40; p=0.7). Malignant lesions were larger than benign lesions, 127 ± 40mm vs 59 ± 31mm (ANOVA F=44.2; p<0.001) (Figure 1A). Used as continuous parameter, lesion size was a powerful classifier with an AUC of 0.92 (95%CI 0.86-0.98; p<0.0001). PASS points did not significantly vary with age or sex (female 5.2 ± 4.4 vs male 7.6 ± 5.0; p=0.053). Average PASS was significantly higher in malignancy (12.8 ± 3.3 vs 4.8 ± 3.8; F=42 p<0.001) (Figure 1B). Used as continuous variable, PASS showed excellent performance with an AUC of 0.94 (95%CI 0.87-1.00; p<0.0001) with an overall model quality of 0.87. However, PASS failed to exhibit a clear bimodal distribution when plotted for malignancy status (Figure 2A).
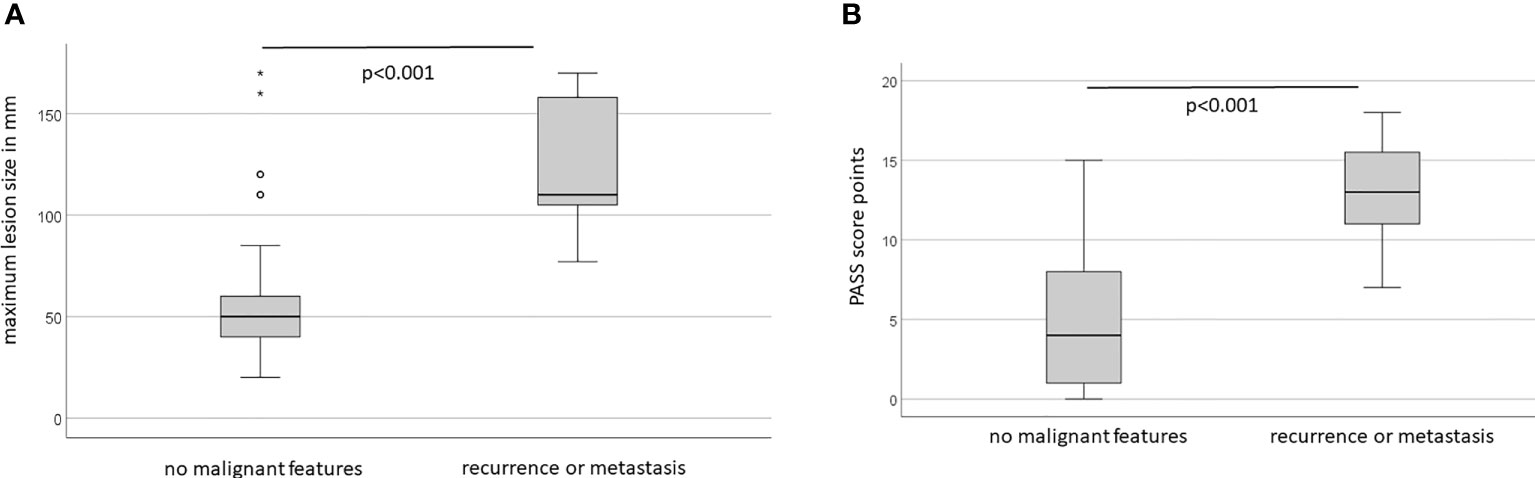
Figure 1 (A) Lesion size varies with long-term clinical behaviour. (B) PASS score points vary with long-term clinical behaviour.
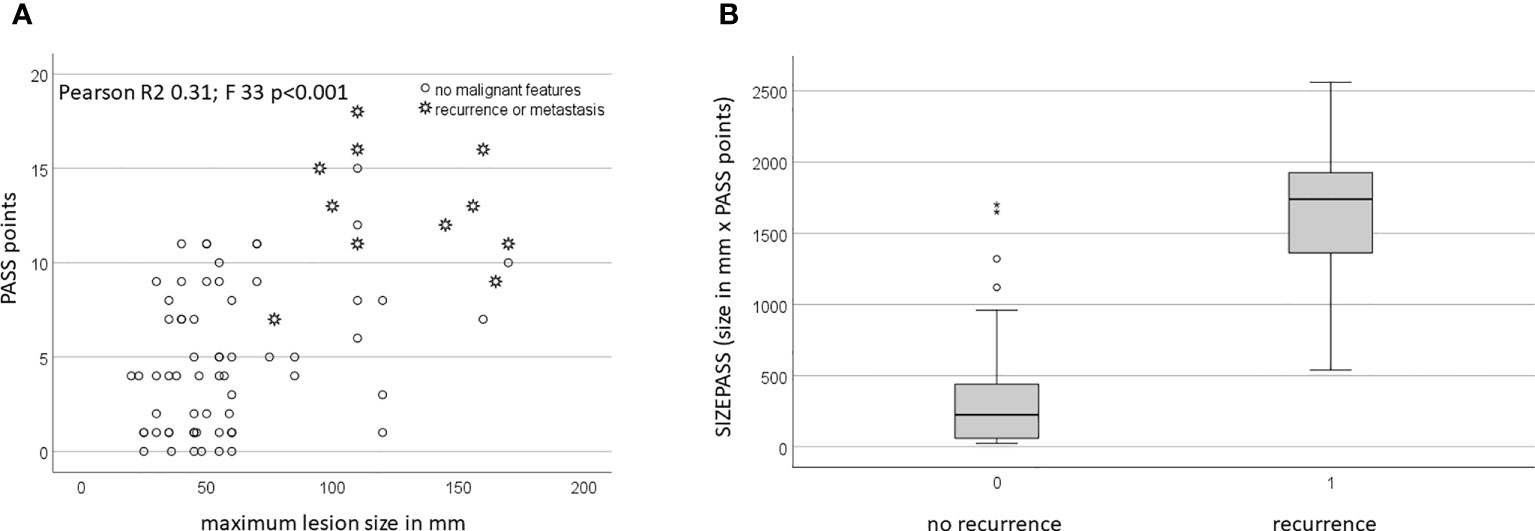
Figure 2 (A) PASS scores vary with size. (B) SIZEPASS varies with long-term biological behaviour.
Jointly, PASS and size identified two fairly distinct cohorts of small tumors with low PASS and large tumors with high PASS (Figure 2A). Size and PASS showed a moderate, but significant correlation (Pearson coefficient R 0.56; p<0.01), yet in an overall weak model (R2 0.31 with adjusted R2 of 0.30), with similar outcomes in the benign cohort (Pearson coefficient 0.34 with p<0.005), but not the malignant cohort (Pearson coefficient 0.02 with p=0.95). Accordingly, linear regression analysis showed no dependence of PASS on size. Whilst the addition of PASS points and size did not add value to models (data not shown), the product resulting from multiplication of PASS points with size (in mm), defined as SIZEPASS, strongly discriminated malignant from benign lesions (328 ± 373 vs 1627 ± 526; p<0.001) (Figure 2B).
As a continuous parameter, SIZEPASS showed excellent performance in univariate binomial logistic regression analysis with ExpB 1.50 (95%CI 1.22-1.83; p<0.001) and correctly classified 93.4% correct classification of tumours as benign or malignant. This was confirmed by ROC analysis showing an AUC of 0.97 (95%CI 0.93-1.01; p<0.0001) (Figure 3) and an overall model quality of 0.93. To render this a clinically useful tool, we incrementally checked thresholds for a binary SIZEPASS criterion and observed optimal performance at 1000 points yielding an AUC of 0.92 (95%CI 0.82-1.03; p<0.0001), which showed excellent performance in Kaplan-Meier analysis (Figure 4).
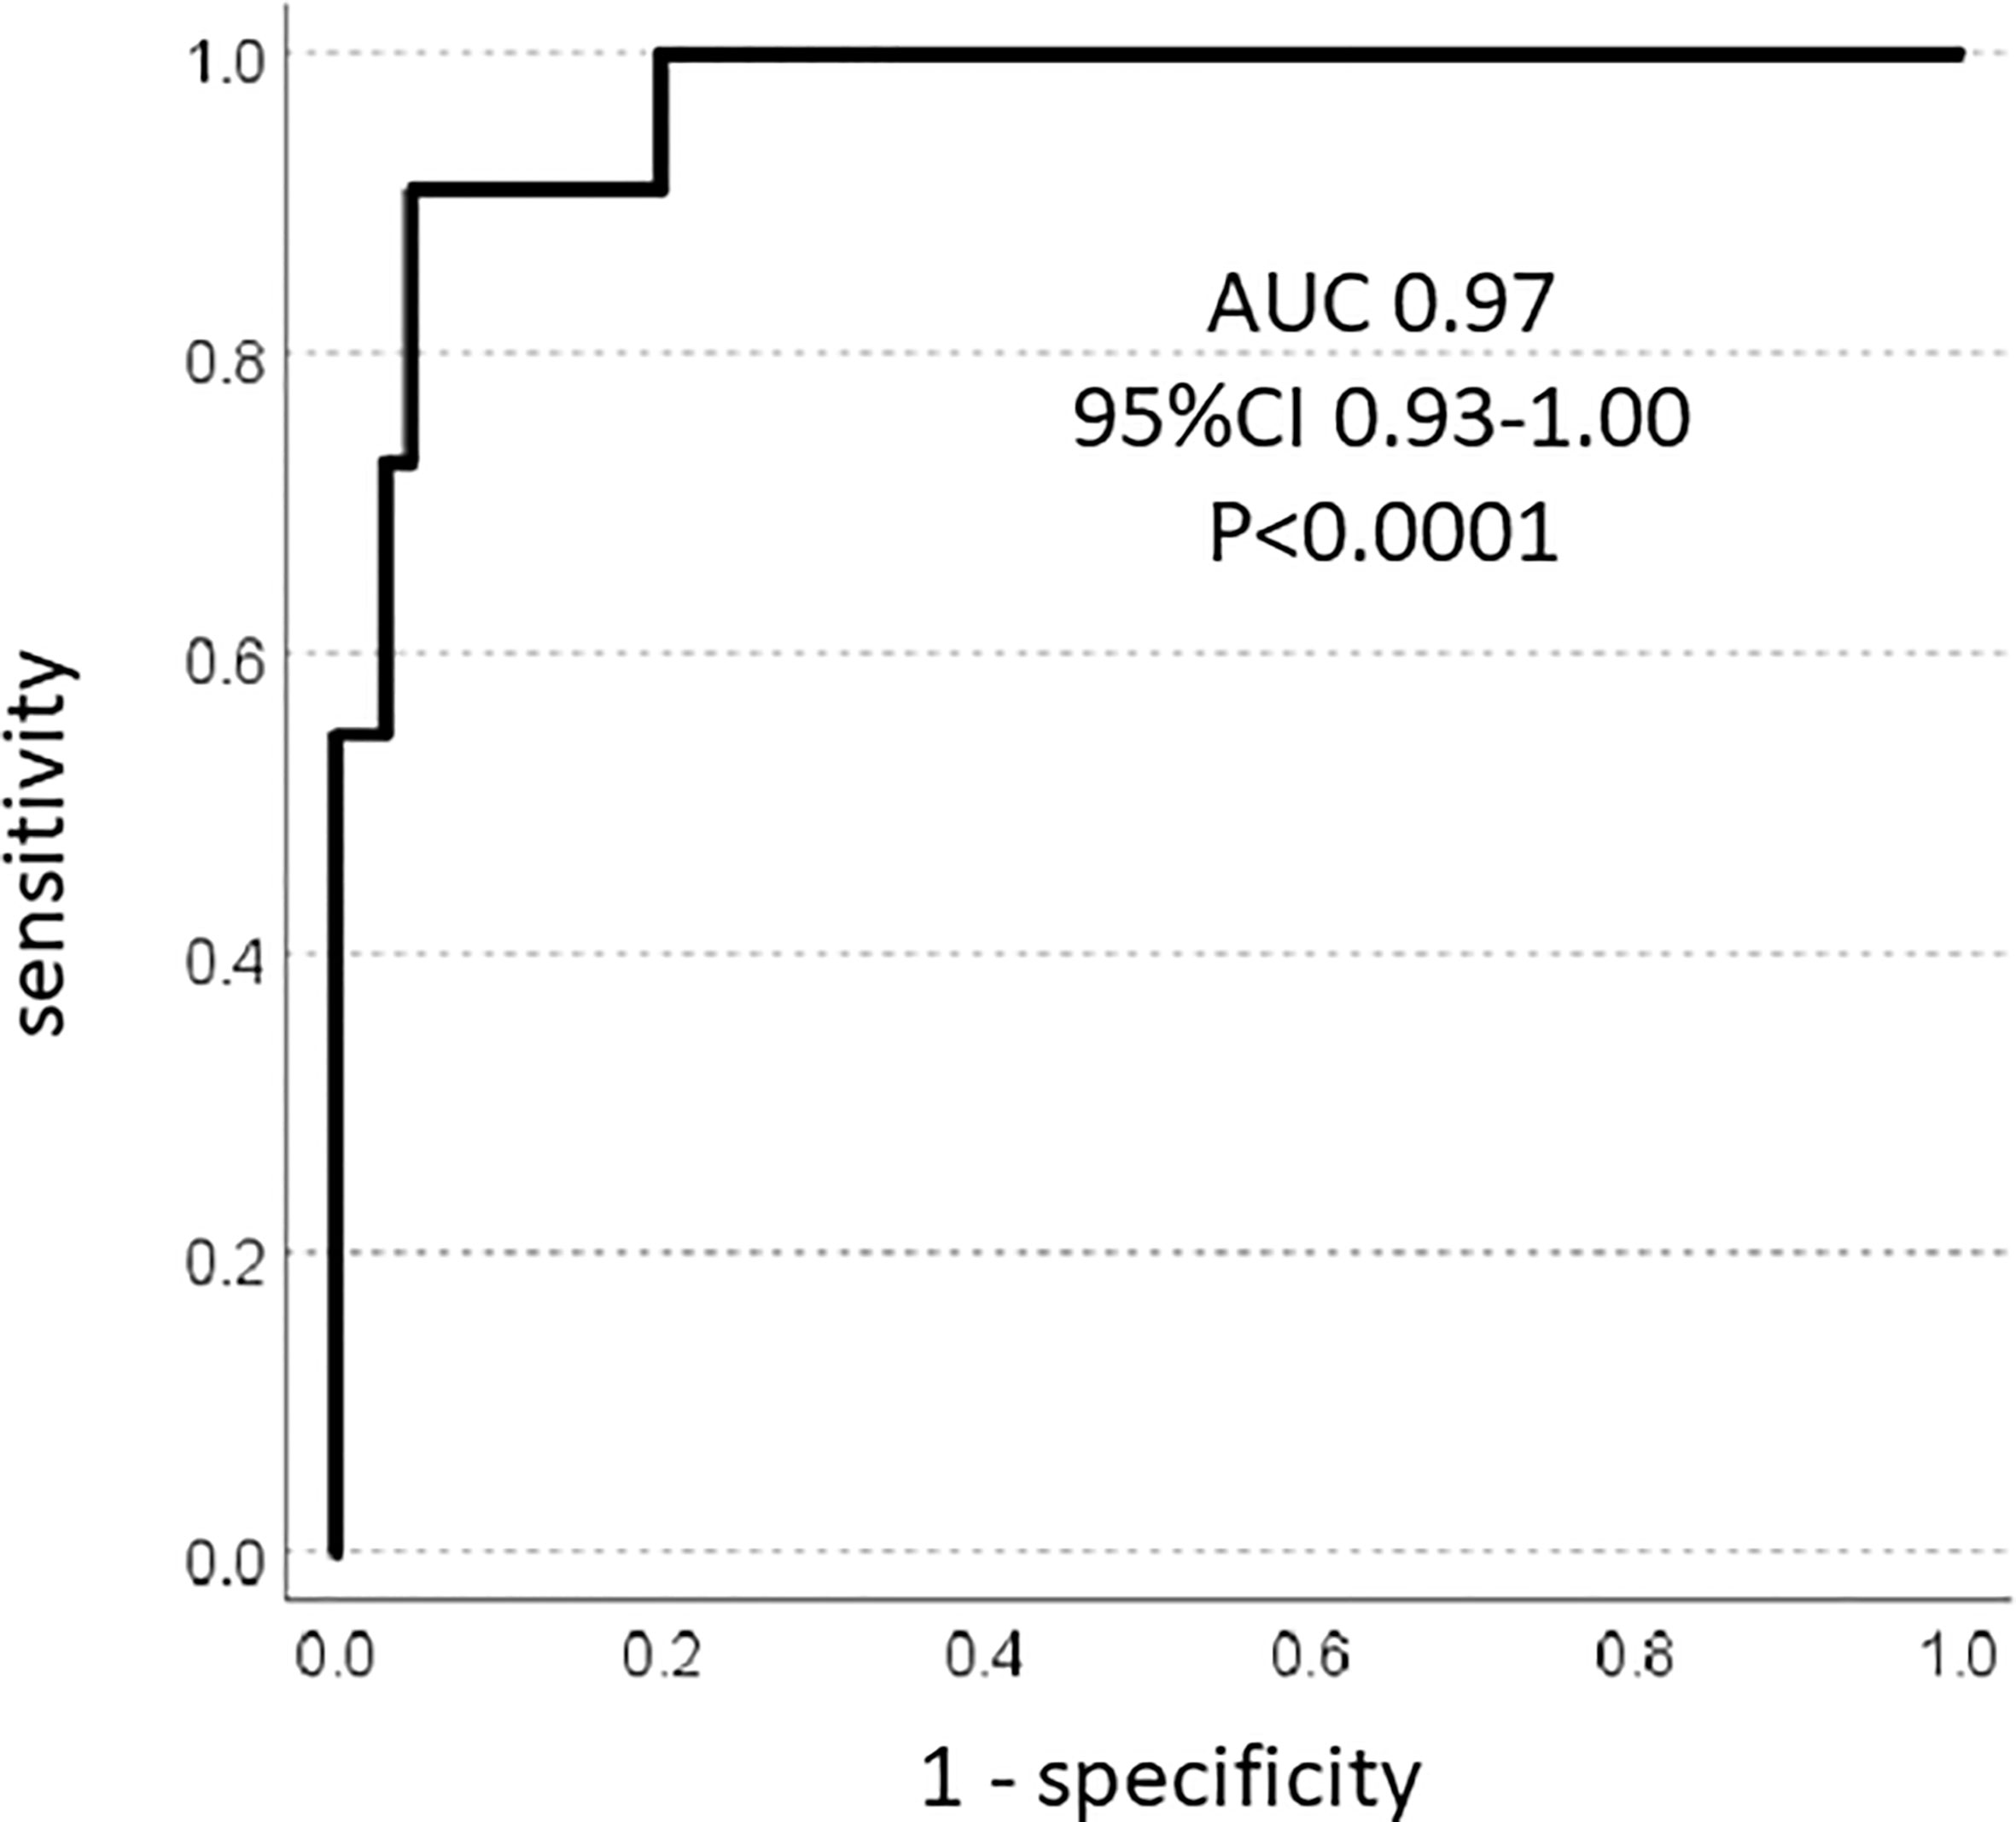
Figure 3 ROC analysis: SIZEPASS classifies malignancy.
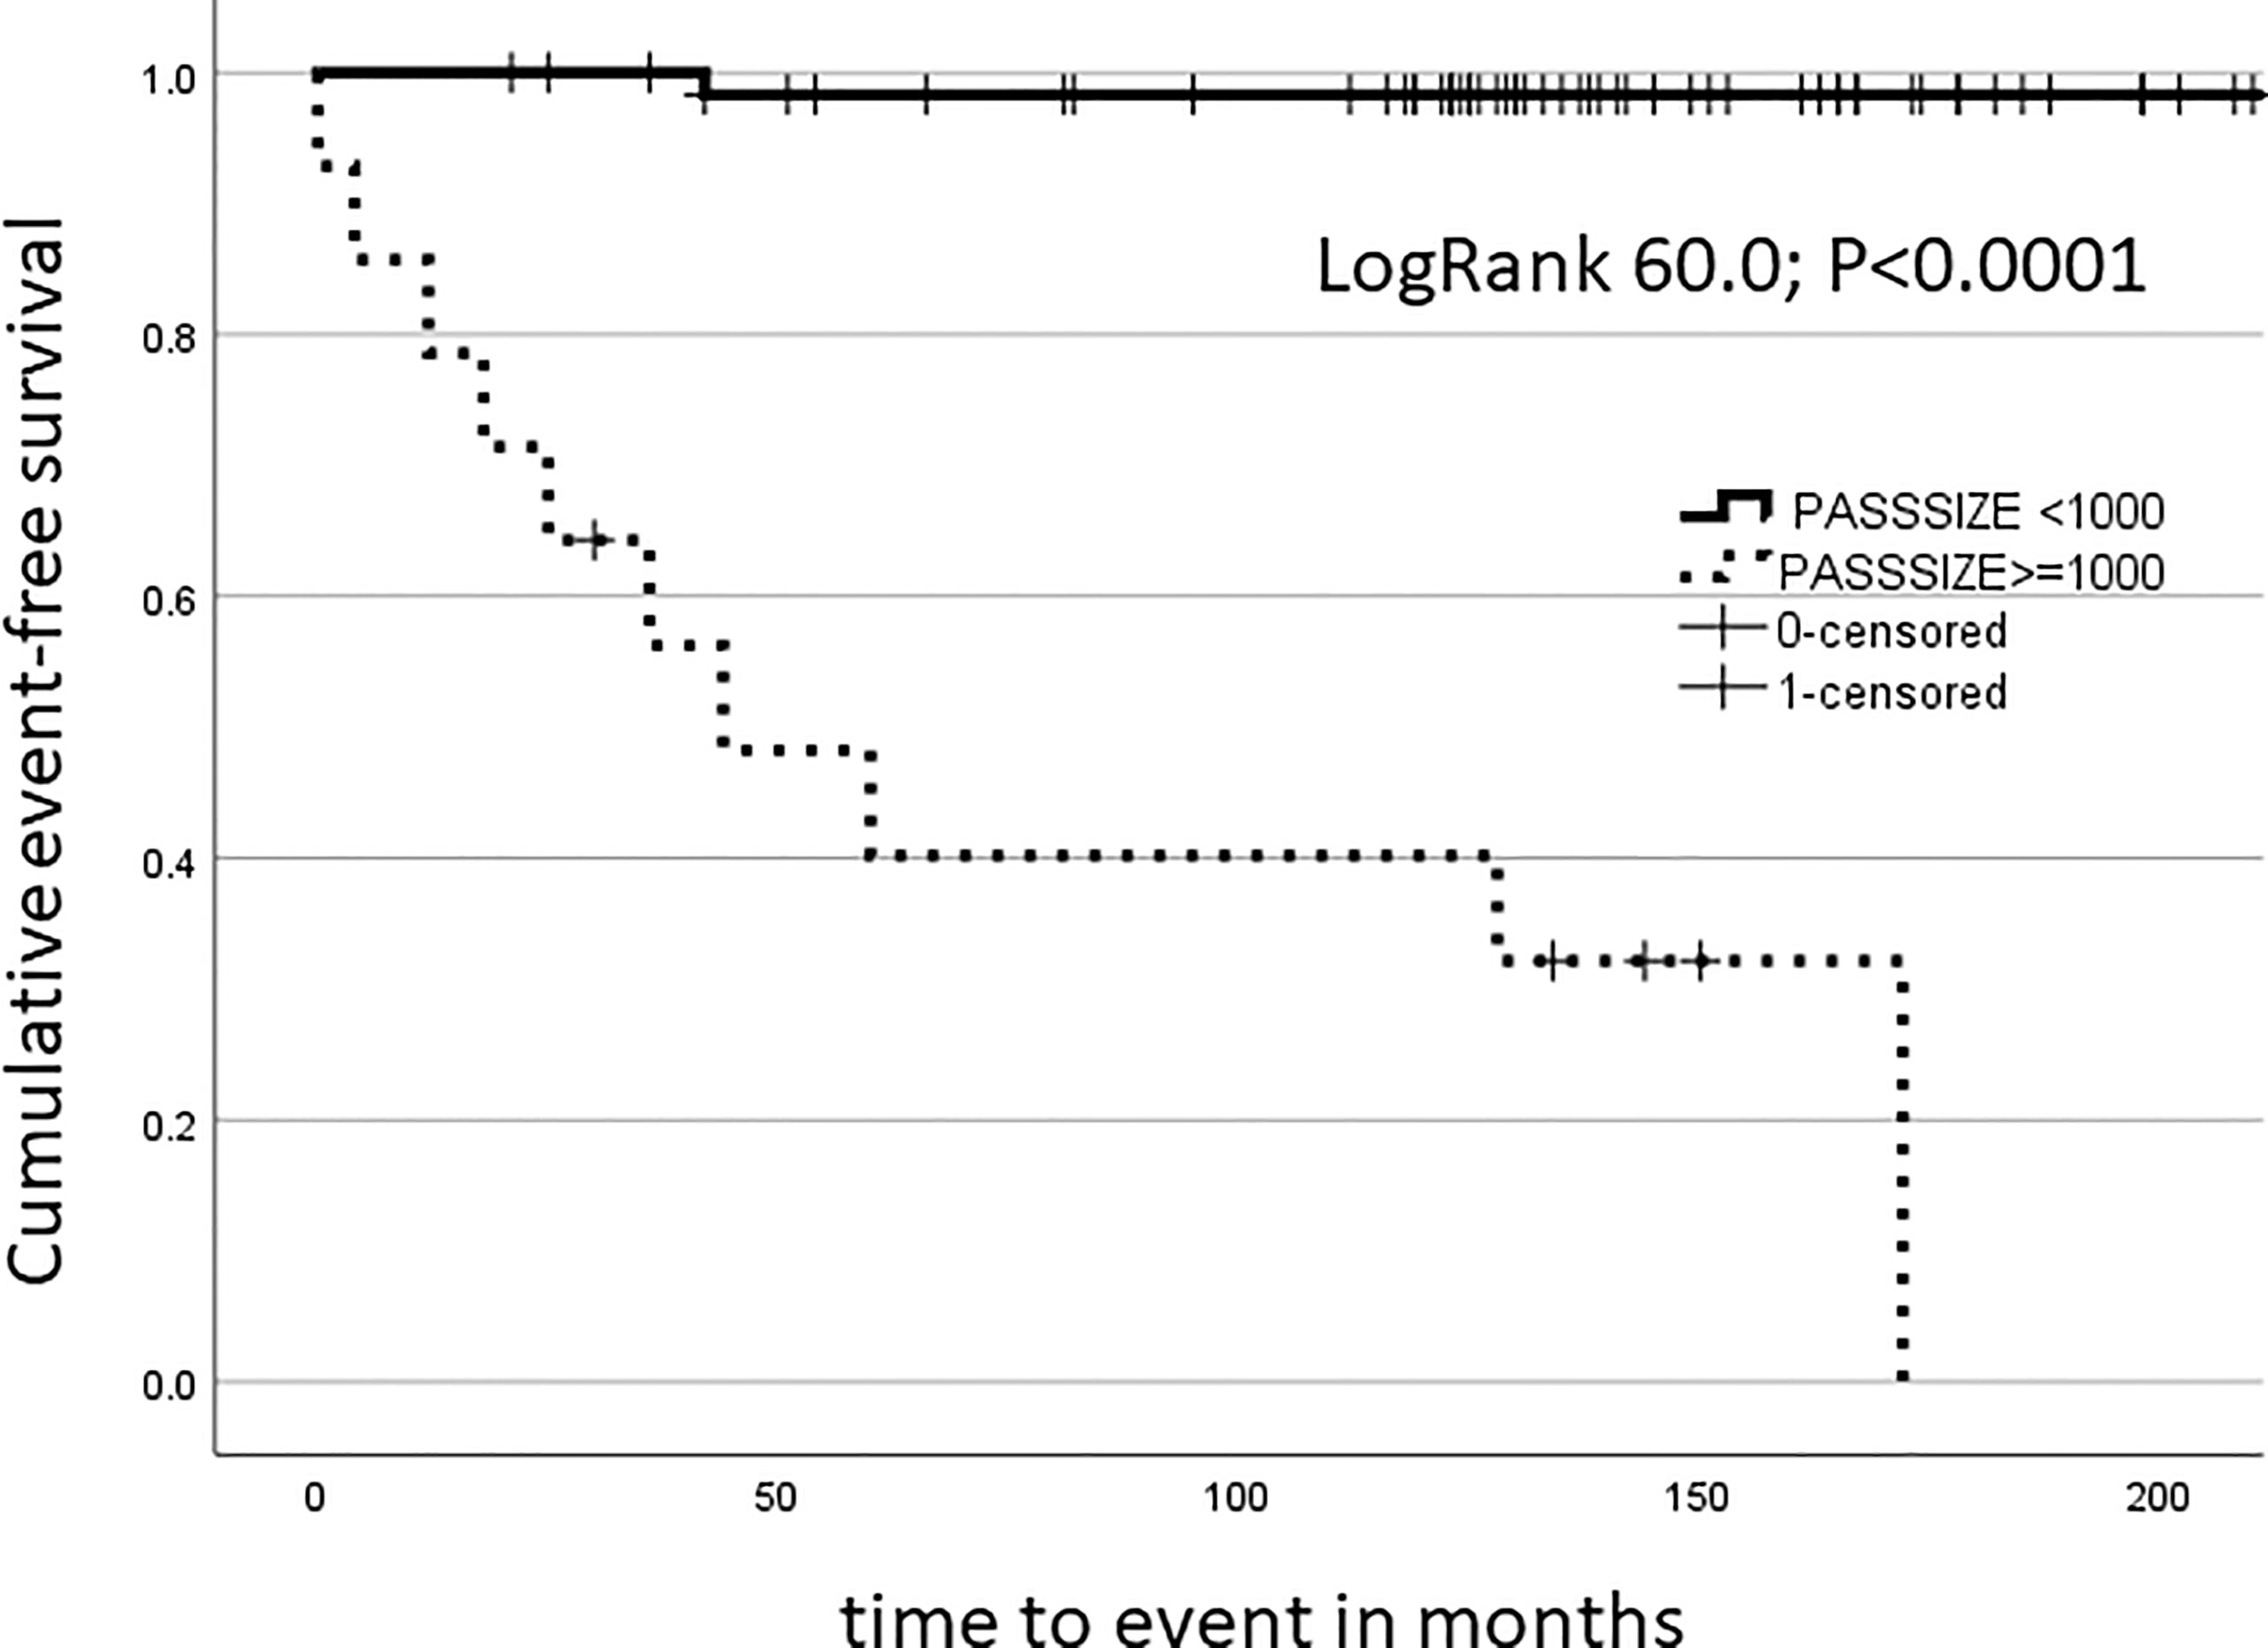
Figure 4 Kaplan-Meier analysis: SIZEPASS1000 discriminates cohorts for long-term malignancy outcomes.
At the threshold of 1000, the goodness of fit analysis by Pearson’s χ2 test showed a value of 45.0 (1 degree of freedom (df), p<0.001) with a likelihood ratio of 35.9 (1df; p<0.001) and Fisher’s exact test at 44.4 (p<0.001). Calculation of predictive power of size and PASS points at various thresholds and comparison with the SIZEPASS1000 criterion showed superior performance for the combined criterion over various size criteria (Table 1).
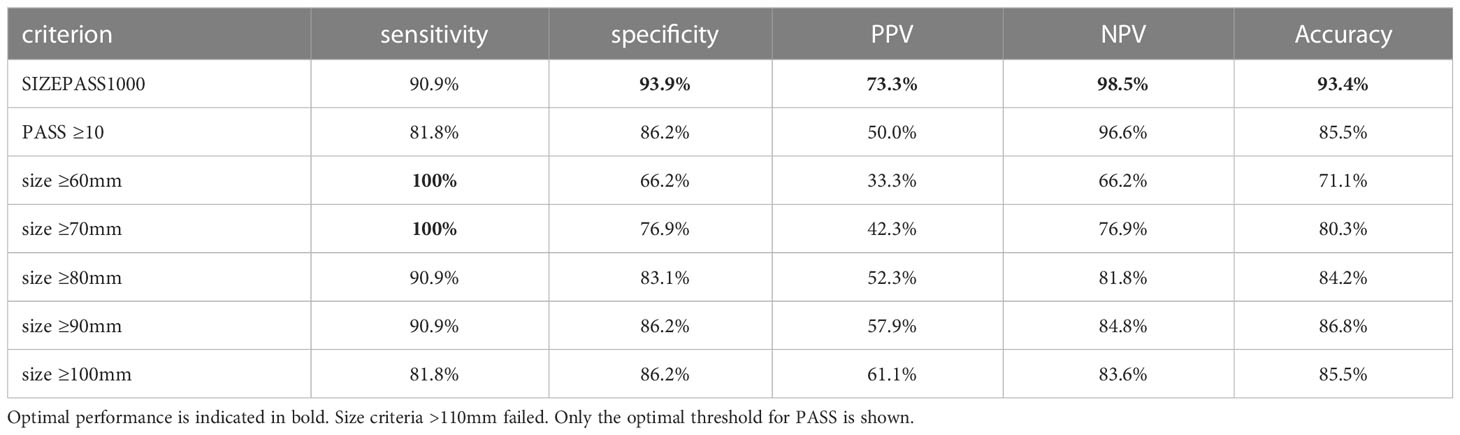
Table 1 A binary SIZEPASS1000 criterion outperforms size and PASS for the classification of malignancy of PPGLs.
The classification power of the SIZEPASS1000 criterion significantly exceeded that of established score systems such as PASS and size criteria which we tested at the upper published dichotomy thresholds (Table 2). PASS and size criteria performed worse when used at commonly employed threshold of PASS ≥4 and size ≥5cm (data not shown).
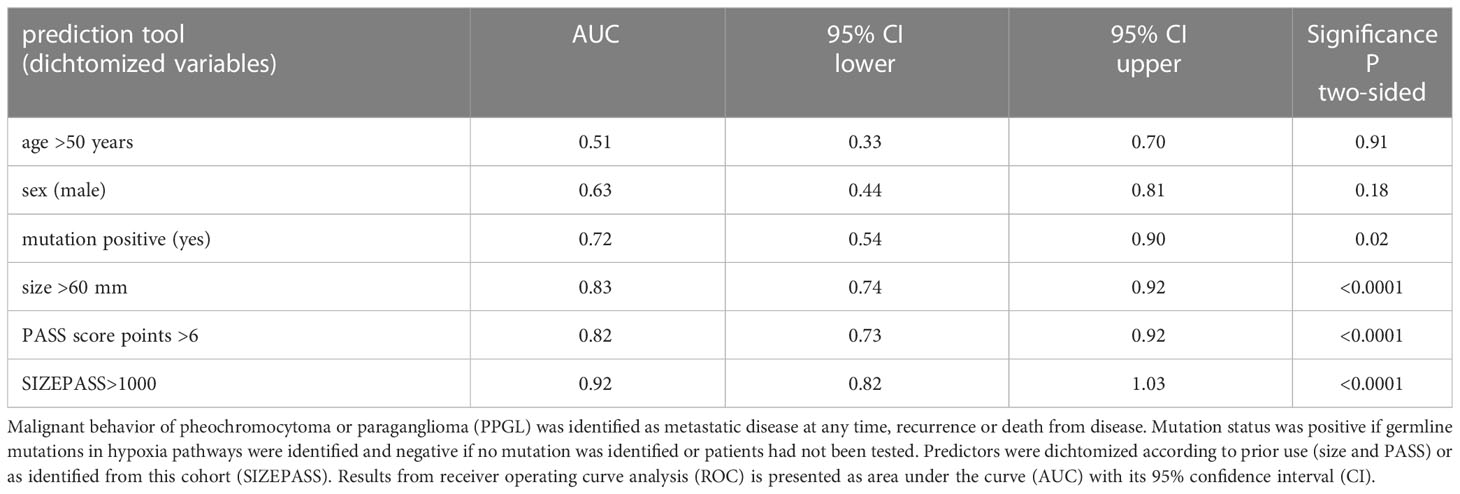
Table 2 Classification power of tools predicting malignant behavior in 76 patients with PPGL. ROC Analysis.
In Cox regression survival analysis, SIZEPASS outperformed size, PASS, sex or mutation status in uni-variate analysis and persisted in multivariate analysis. The excellent performance observed when using continuous variables, size (odds 1.030 95%CI 1.017-1.044; p<0.001) and PASS (odds 1.7 95%CI 1.4-2.2; p<0.001) (for full data see Supplementary Table 1), disappeared after dichotomization even at the upper end of widely used thresholds, i.e. size >60mm and >6 PASS score points. In multivariate analysis, only mutation and SIZEPASS1000 criterion persisted (Table 3).
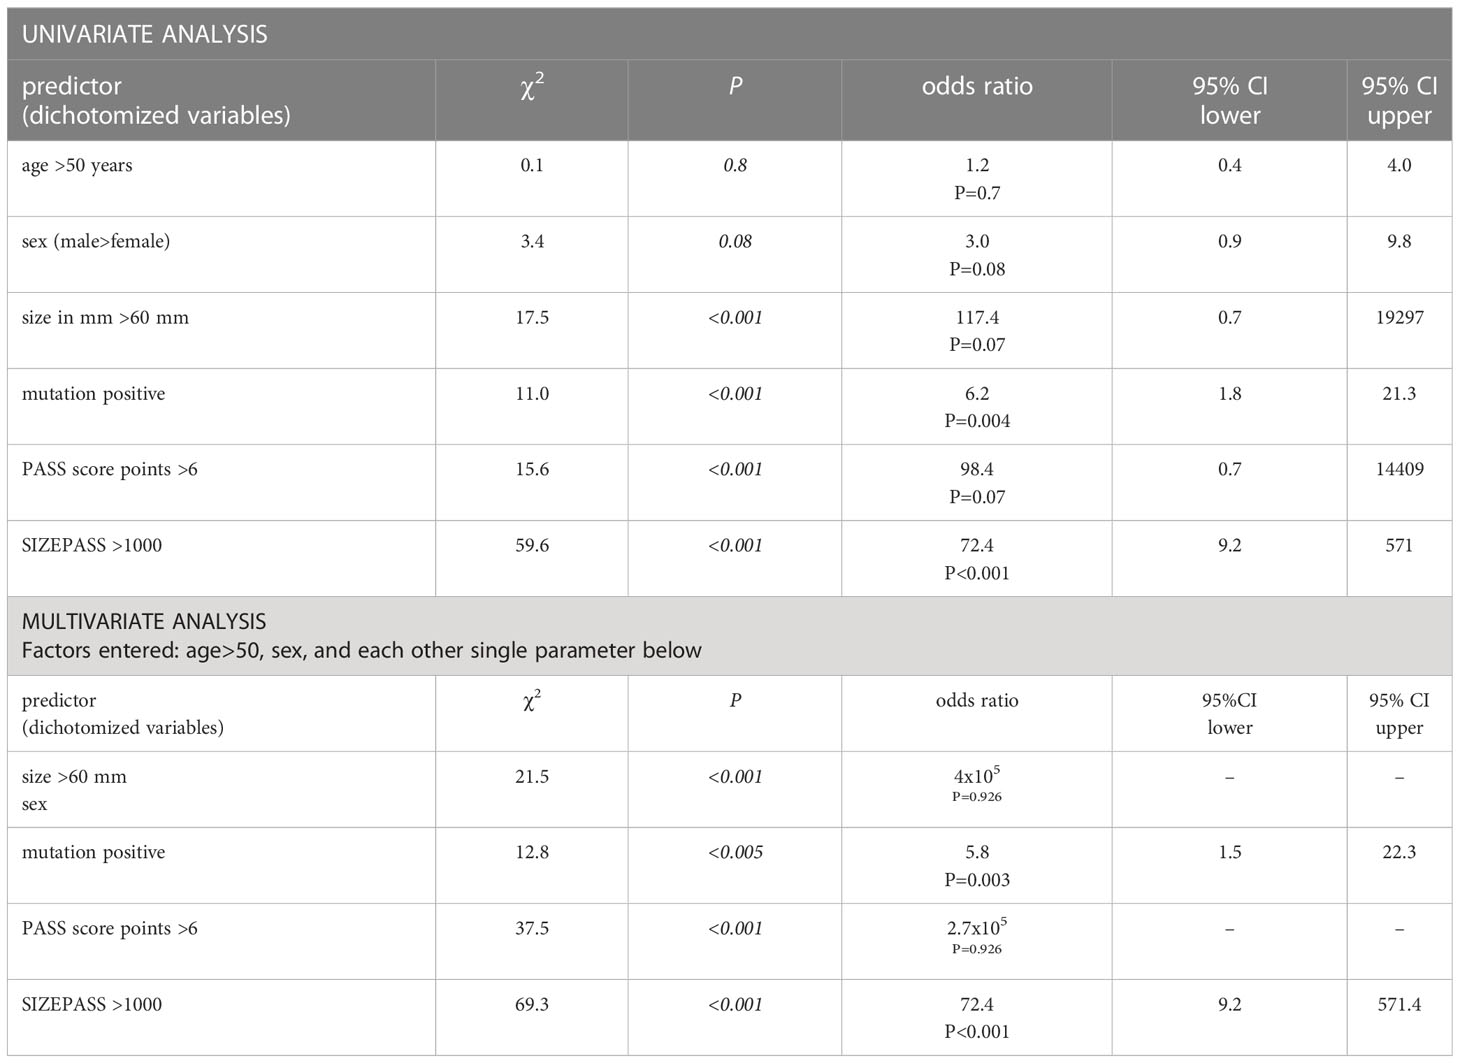
Table 3 Cox survival regression Outcome: metastasis at any time or recurrent disease or death from disease.
When mutations status (yes/no) and SIZEPASS>1000 criterion were co-entered into multivariate COX-regression analysis, only SIZEPASS1000 survived (odds ratio 54.7; 95%CI: 6.7-449.7; P<0.001). Equally, when PASS score points >6 and SIZEPASS>1000 criterion were co-entered into multivariate COX-regression analysis, only SIZEPASS1000 survived (odds ratio 23.8; 95%CI: 3.0-188.1; P=0.003).
The SIZEPASS1000 criterion exhibited excellent performance when evaluated as diagnostic test. An accuracy ≥90%, was observed across cohorts with different mutation status (Table 4). This included a mutation-agnostic approach (all PPGL) or cohorts of PPGL, where either no mutation had been identified on testing (n=14) or where the Adrenal MDT had not identified a clinical indication for testing (n=42).
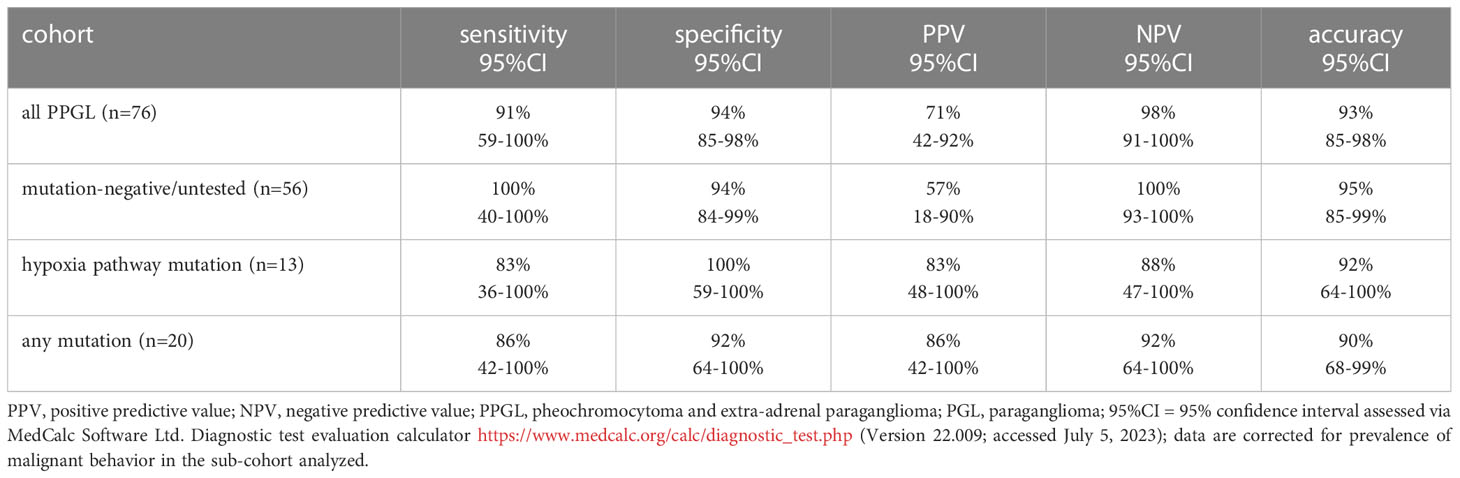
Table 4 The binary SIZEPASS1000 criterion performs across mutation status.
Comparison of size, PASS and SIZEPASS criteria in cross table analysis confirmed the superiority of the SIZEPASS1000 criterion, particularly with regard to higher specificity and positive prediction (Table 5).
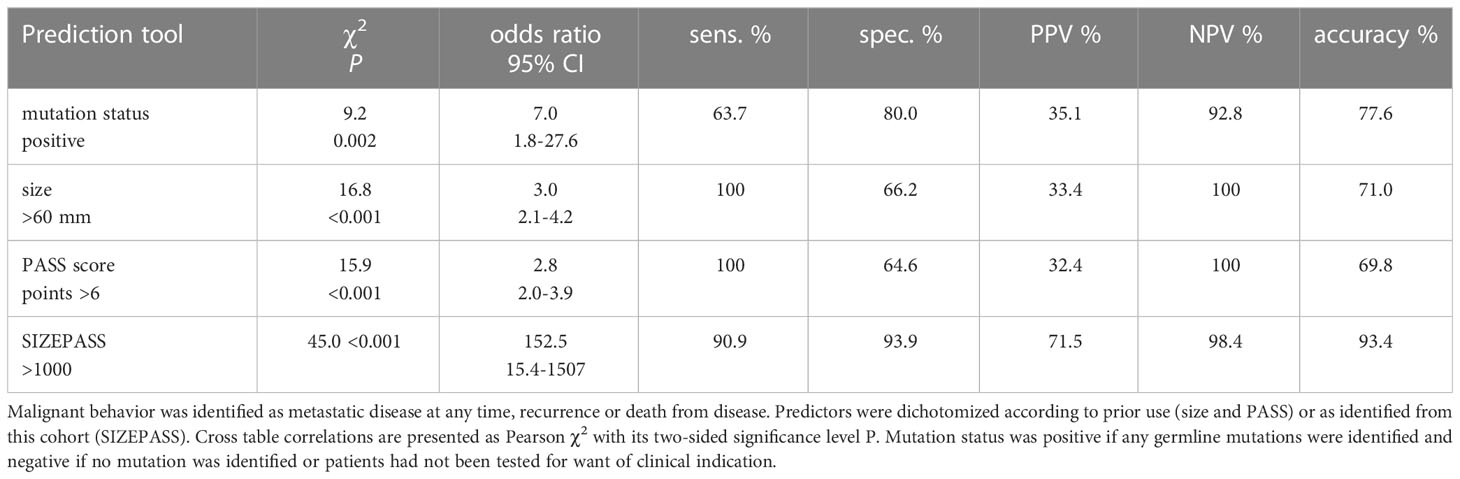
Table 5 Comparative evaluation of prediction tools for malignant behavior in 76 patients with PPGL.
This study identifies the excellent performance of the SIZEPASS1000 criterion to distinguish benign from malignant clinical behavior of PPGL. The criterion is derived by multiplying PASS points with the maximum lesion diameter taken from preoperative cross-sectional radiological studies. The approach employs criteria previously recognized to predict malignant behavior of PPGLs, i.e. size (9, 23) and PASS score (11, 24).
Common opinion has long held a PPGL size of 5-6 cm or above as a clinical indicator of malignancy (25). This is confirmed in the largest to-date dataset of PPGLs, where size >5 cm predicted malignancy (HR 1.67; CI, 1.040-2.668; P=0.034) and persisted as independent predictor of recurrent disease in multivariable Cox regression (9). However, numerous authors identified that lesions of “intermediate size”, defined as a maximum diameter of 4-10 cm, are not necessarily malignant (23, 26). Size estimates of pathological specimens suffer from inconsistencies in defining the largest diameter of the specimen, and perhaps more importantly from the impact of operation technique on the volume of the commonly heavily vascularized lesion. Vein first approaches engorge the sample, whilst early arterial clamping may permit effective size reduction of such tumors (HH and KMS, unpublished data). We have therefore employed pre-operative cross-sectional imaging, which was available in all cases, and have ensured exact measurement by two independent observers (HH and KMS).
A multitude of studies have validated the PASS. Early investigations identified high classification power of a PASS: when used as continuous parameter it achieved an AUC of 0.90 (24). A critical problem of PASS, which employs a panel of distinct criteria, is significant inter-observer and intra-observer variation (27). Variation is not just reduced to the apparent problem of intra-tumoral heterogeneity, but also to varying interpretation of findings in any given sample (27). All PASS scores in the current presentation were produced by two pathologists (SDC, AB) before patients entered long-term follow-up (2013-2023), thereby limiting inter-observer variation and granting a truly prospective assessment of specimens. It should also be said, that the consistently good performance of PASS across a multitude of cohorts identified in a meta-analysis including more than 900 patients (28), argues against the claim that observer bias would acutely detract from the predictive value of the PASS score.
Problems arise, however, when defining any specific threshold value above which the PASS would identify malignancy. Most authors have proposed cut-off values of ≥4 (11, 23, 26, 29–33) or ≥6 points (25, 34), whilst other authors found that neither cut-off point was valid (35, 36). Notwithstanding prior criticism of intra- and inter-observer variation, an excellent meta-analysis from the Karolinska Institute including 28 studies has confirmed the classification power of PASS ≥4 in a cohort of 848 adrenal PGL and 56 extra-adrenal PGL (28).
The key problem with cut-off values is the requirement of decision-making about the relative impact of a particular expression of any variable early in the analytical process. An analogous problem occurs when values are added, favoring parameters with inherently higher numerical values. Both problems can be circumvented by multiplication (or division). We have here used the product of two well-established lesion-based predictors of malignancy, namely size and PASS, which we confirm to be highly different between benign and malignant lesions (Figure 1). However, the degree of scatter makes the selection of any particular cut-off point for either variable problematic (Figure 2A), whilst the product of these two criteria shows better discrimination (Figure 2B). These benefits consistently extend into classification analysis employing receiver operating curves, where the individual criteria perform highly before, but not after, dichotomization. In contrast, the size x PASS product loses little traction and exhibits excellent performance with an AUC above 0.8 (Figure 3). This again translates into higher predictive power and accuracy compared to the individual criteria (Tables 1, 2, 4, 5). These observations compare large-volume meta-analytical data (Table 6), where the SIZEPASS1000 criterion outperforms both PASS and GAPP scores (28). We note that the GAPP score (13, 14) underperforms in meta-analysis, an observation confirmed in later publications (9, 32, 37).
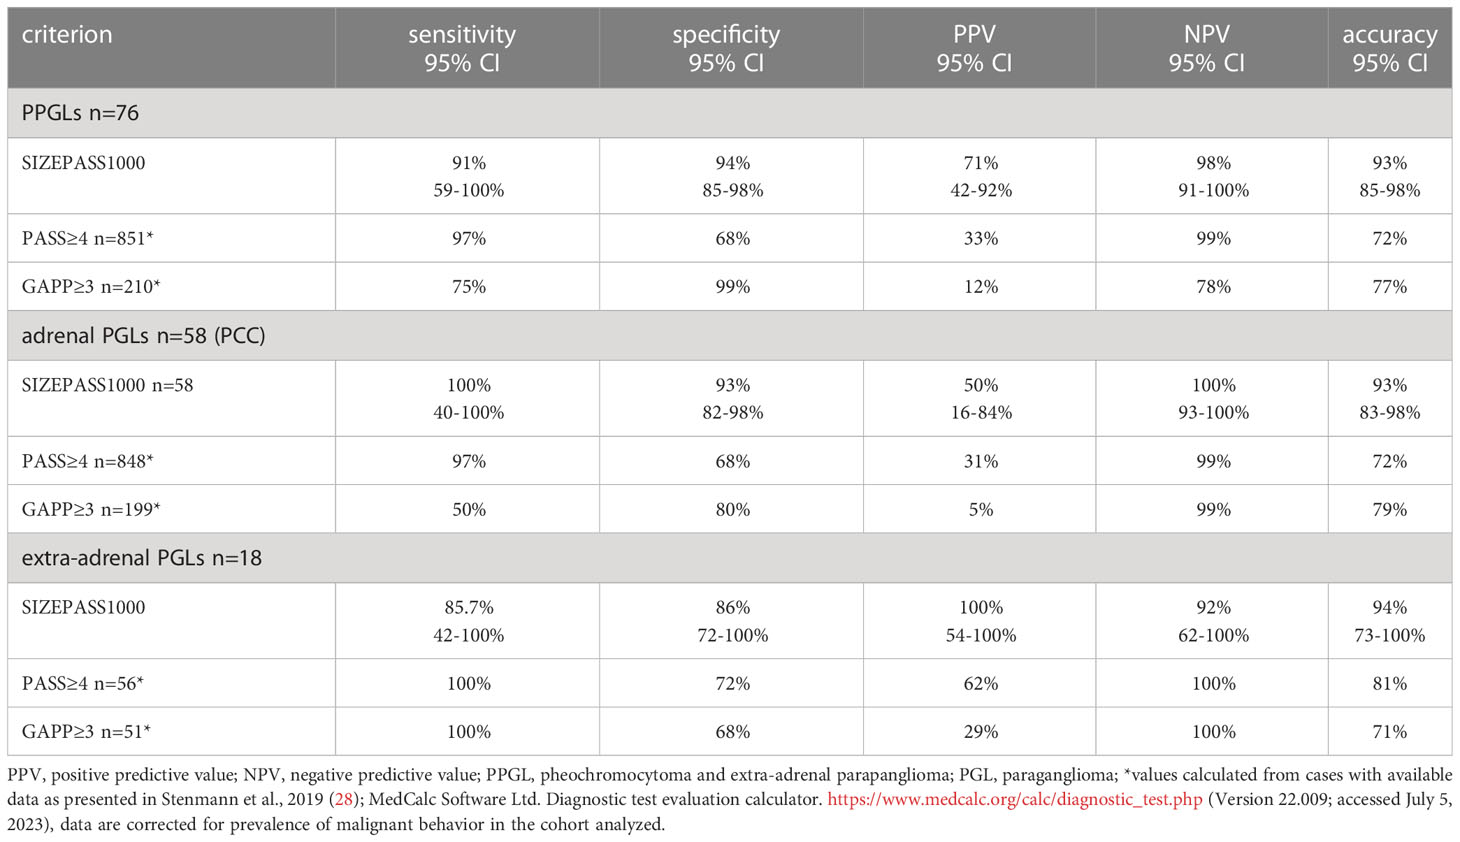
Table 6 The binary SIZEPASS1000 criterion outperforms PASS≥4cm and GAPP≥3 for the prediction of malignancy across PPGLs, as well as in adrenal and extra-adrenal PGL cohorts.
Our data also demonstrate the SIZEPASS1000 criterion to outperform mutation status as risk predictor (Table 3). It keeps its predictive power regardless of mutation status (Table 4). SIZEPASS1000 and mutation analysis occupy complementary functions: a SIZEPASS >1000 indicates a very high risk of malignant behavior, prompting dedicated diagnostic interventions. It may help with complex considerations regarding adjuvant therapy choices. A positive mutation status informs the need to monitor for formation of secondary PPGLs and eventual care needs for relatives.
In PPGL, the evaluation of outcomes predictors is limited by the extreme delay of locoregional recurrence or metastases. The to-date largest collection of data comprises 298 patients with sporadic PGL: 63% of locoregional recurrences and 69% of metastases were observed within the first decade of follow-up, with saturation reaching 81% and ~100% at 15 years of follow-up (9). Except for those dying of other causes, all of our patients were followed up for at least 10 years, with a median length of follow-up of 11.7 years. The observation supposes that at least 70% of all expected local recurrence and nearly all metastatic events would have occurred within the observation period in our cohort. Whilst still an imperfect scenario, our data offer sufficient follow-up to inform a robust analysis.
Our data do not afford comparison with alternative scoring approaches, such as the ASES score based on mere clinical observations, yet its performance is limited with an AUC of only 0.74 (10, 38–40). On the other hand, the COPPS score appears to offer excellent performance, yet it is mitigated by the need for specialized immunohistochemistry (15).
No score based will ever substitute for a clear-cut definition of malignancy such as histopathology delivers for most, though not all, solid tumors. We agree that a definition of malignancy based on “absolute” criteria would be preferable, yet those are elusive. A comprehensive discussion of individual criteria and select scores has been provided in the 2022 overview of the classification of paragangliomas and pheochromocytomas (6). Mete and colleagues agree that the PASS is the best performing system so far, yet commend caution regarding its use, as indeed for any other scoring system: “Therefore, the 2022 WHO classification of PPGLs does not endorse any of these systems, but at the same time does not discourage their use in individual practices. It is stressed that scoring systems may be used optimally in relation to the results of molecular analyses [86, 87], as well as other clinical and biochemical (e.g., mature or immature secretory phenotype) risk factors.”(6).
Our proposed novel criterion for PASS, the SIZEPASS1000 criterion, benefits patients and care providers alike. The SIZEPASS1000 criterion is solely based on two objectively assessable lesion-related criteria, i.e. size and histopathological appearance which can be recognized in basic H&E stains. This prevents problems arising from consideration of ever new immunohistochemical markers, and obviates the need for assumptions about genetic versus allegedly sporadic manifestations. The latter is particularly problematic as a growing number of novel genetic lesions are identified to drive or at least interact with the biological behavior of PGLs. During the three decades since the mapping of the MEN2 locus to chromosome 10 (41), multi-omics definition of principal driver lesions (42), recognition of key aberrations in DNA repair altering lesion evolution (43), and a growing approach including alterations in mitochondrial genes (44, 45), have created an increasingly complex and complete, yet imperfect, picture of genetic causation. When the majority of PPGLs was considered sporadic in 1990, this group has shrunk to merely 30-50% at present (9, 46); and it may shrink further. Assessment of a majority of currently available genetic targets has considerable complexity, and the ever-novel immuno-histochemical tests are by no means cheap. Affluence or eligibility criteria defined by the territorial commissioning systems could hence become significant factors in the recognition of potential malignancy in PGL, as in any other genetically driven conditions. This is not helped by the observation that genetic variation is unequally represented across ancestry groups (47, 48). The growing genetic knowledge base in PGL is undoubtedly highly meritorious, yet does it drive complexity and cost to contribute to health inequity in underrepresented populations (49). Our data (Tables 3, 5, results section) identify that the SIZEPASS1000 criterion outperforms mutation status in our cohort, when entered as competitive co-factor into multifactorial Cox survival regression. This finding further corroborates our claim that the SIZEPASS1000 criterion may be used in any cohort, and without prior knowledge of mutations status.
From a practical point of view, patients are keen to learn about the real-life impact of their newly diagnosed PGL. The SIZEPASS1000 criterion offers a simple, lesion- based and outstandingly performing tool to answer their questions. It can be determined without access to complex, expensive or cumbersome genetic or immune-histochemical tests. It offers answers in all such scenarios where family history is elusive, and genetic tests unavailable, culturally unacceptable, ambiguous, or not sufficiently explored for impact because they are rare, with insufficient long-term studies or knowledge of cooperating genetic factors. In addition, the growing variety of PGL driver genes often lacks sizable long-term studies robustly connecting them to their clinical phenotype, particularly for any late sequel such as recurrence.
We hope that the universally accessible nature of SIZEPASS score compounds, namely PASS and lesions size from cross-sectional imaging, will enable validation of our findings in other cohorts. Once that is eventually achieved, SIZEPASS1000 can improve cohort stratification in much needed randomized future trials and may help to select patients for adjuvant therapies such as endoradiotherapy.
The SIZEPASS1000 criterion outperforms current histology-based or size-based approaches, adding to the armamentarium of prognostication of a rare, but important, endocrine tumor. It does not replace current efforts aimed at better understanding the nosology of PGLs, but may have value as a complement to current and future clinical practice.
The raw data supporting the conclusions of this article will be made available by the authors, without undue reservation.
The studies involving human participants were reviewed and approved by United Kingdom’s Integrated Research Application System (IRAS), IRAS Project ID 329934. Written informed consent for participation was not required for this study in accordance with the national legislation and the institutional requirements.
HH: Investigation, Writing-review and editing. SD-C: Conceptualization, Investigation, Writing-original draft, Writing-review and editing. AB: Investigation, Writing-review and editing. NT: Investigation, Writing-review and editing, Supervision. GG: Investigation, Writing-review and editing, Supervision. SA: Writing-review and editing, Supervision. K-MS: Conceptualization, Investigation, Writing-original draft, Writing-review and editing.
The authors declare that the research was conducted in the absence of any commercial or financial relationships that could be construed as a potential conflict of interest.
All claims expressed in this article are solely those of the authors and do not necessarily represent those of their affiliated organizations, or those of the publisher, the editors and the reviewers. Any product that may be evaluated in this article, or claim that may be made by its manufacturer, is not guaranteed or endorsed by the publisher.
The Supplementary Material for this article can be found online at: https://www.frontiersin.org/articles/10.3389/fendo.2023.1235243/full#supplementary-material
1. Androutsellis-Theotokis A, Rubin De Celis MF, Ehrhart-Bornstein M, Bornstein SR. Common features between chromaffin and neural progenitor cells. Mol Psychiatry (2012) 17:351. doi: 10.1038/mp.2012.18
2. Vukicevic V, Schmid J, Hermann A, Lange S, Qin N, Gebauer L, et al. Differentiation of chromaffin progenitor cells to dopaminergic neurons. Cell Transplant (2012) 21:2471–86. doi: 10.3727/096368912X638874
3. Santana MM, Chung KF, Vukicevic V, Rosmaninho-Salgado J, Kanczkowski W, Cortez V, et al. Isolation, characterization, and differentiation of progenitor cells from human adult adrenal medulla. Stem Cells Transl Med (2012) 1:783–91. doi: 10.5966/sctm.2012-0022
4. Gheorghișan-Gălățeanu AA, Ilieșiu A, Lambrescu IM, Țăpoi DA. The complex histopathological and immunohistochemical spectrum of neuroendocrine tumors-an overview of the latest classifications. Int J Mol Sci (2023) 24(2):1418. doi: 10.3390/ijms24021418
5. Scriba LD, Bornstein SR, Santambrogio A, Mueller G, Huebner A, Hauer J, et al. Cancer stem cells in pheochromocytoma and paraganglioma. Front Endocrinol (Lausanne) (2020) 11:79. doi: 10.3389/fendo.2020.00079
6. Mete O, Asa SL, Gill AJ, Kimura N, De Krijger RR, Tischler A. Overview of the 2022 WHO classification of paragangliomas and pheochromocytomas. Endocr Pathol (2022) 33:90–114. doi: 10.1007/s12022-022-09704-6
7. Whitelaw BC, Prague JK, Mustafa OG, Schulte KM, Hopkins PA, Gilbert JA, et al. Phaeochromocytoma [corrected] crisis. Clin Endocrinol (Oxf) (2014) 80:13–22. doi: 10.1111/cen.12324
8. Bima C, Bioletto F, Lopez C, Bollati M, Arata S, Procopio M, et al. Clinical and pathological tools for predicting recurrence and/or metastasis in patients with pheochromocytoma and paraganglioma. Biomedicines (2022) 10(8):1813. doi: 10.3390/biomedicines10081813
9. Li M, Prodanov T, Meuter L, Kerstens MN, Bechmann N, Prejbisz A, et al. Recurrent disease in patients with sporadic pheochromocytoma and paraganglioma. J Clin Endocrinol Metab (2023) 108:397–404. doi: 10.1210/clinem/dgac563
10. Cho YY, Kwak MK, Lee SE, Ahn SH, Kim H, Suh S, et al. A clinical prediction model to estimate the metastatic potential of pheochromocytoma/paraganglioma: ASES score. Surg (United States) (2018) 164:511–7. doi: 10.1016/j.surg.2018.05.001
11. Thompson LD. Pheochromocytoma of the Adrenal gland Scaled Score (PASS) to separate benign from malignant neoplasms: a clinicopathologic and immunophenotypic study of 100 cases. Am J Surg Pathol (2002) 26:551–66. doi: 10.1097/00000478-200205000-00002
12. Tischler AS, Dekrijger RR. 15 YEARS OF PARAGANGLIOMA: Pathology of pheochromocytoma and paraganglioma. Endocr Relat Cancer (2015) 22:T123–133. doi: 10.1530/ERC-15-0261
13. Eisenhofer G, Tischler AS. Neuroendocrine cancer. Closing the GAPP on predicting metastases. Nat Rev Endocrinol (2014) 10:315–6. doi: 10.1038/nrendo.2014.41
14. Kimura N, Takayanagi R, Takizawa N, Itagaki E, Katabami T, Kakoi N, et al. Pathological grading for predicting metastasis in phaeochromocytoma and paraganglioma. Endocr Relat Cancer (2014) 21:405–14. doi: 10.1530/ERC-13-0494
15. Pierre C, Agopiantz M, Brunaud L, Battaglia-Hsu SF, Max A, Pouget C, et al. COPPS, a composite score integrating pathological features, PS100 and SDHB losses, predicts the risk of metastasis and progression-free survival in pheochromocytomas/paragangliomas. Virchows Arch (2019) 474:721–34. doi: 10.1007/s00428-019-02553-5
16. Parasiliti-Caprino M, Lucatello B, Lopez C, Burrello J, Maletta F, Mistrangelo M, et al. Predictors of recurrence of pheochromocytoma and paraganglioma: a multicenter study in Piedmont, Italy. Hypertens Res (2020) 43:500–10. doi: 10.1038/s41440-019-0339-y
17. Parasiliti-Caprino M, Bioletto F, Lopez C, Bollati M, Maletta F, Caputo M, et al. From SGAP-model to SGAP-score: A simplified predictive tool for post-surgical recurrence of pheochromocytoma. Biomedicines (2022) 10(6):1310. doi: 10.3390/biomedicines10061310
18. Parasiliti-Caprino M, Bioletto F, Lopez C, Maletta F, Caputo M, Gasco V, et al. Development and internal validation of a predictive model for the estimation of pheochromocytoma recurrence risk after radical surgery. Eur J Endocrinol (2022) 186:399–406. doi: 10.1530/EJE-21-0370
19. Landis JR, Koch GG. The measurement of observer agreement for categorical data. Biometrics (1977) 33:159–74. doi: 10.2307/2529310
20. Shapiro B, Sisson JC, Lloyd R, Nakajo M, Satterlee W, Beierwaltes WH. Malignant phaeochromocytoma: clinical, biochemical and scintigraphic characterization. Clin Endocrinol (Oxf) (1984) 20:189–203. doi: 10.1111/j.1365-2265.1984.tb00074.x
21. Miller AB, Hoogstraten B, Staquet M, Winkler A. Reporting results of cancer treatment. Cancer (1981) 47:207–14. doi: 10.1002/1097-0142(19810101)47:1<207::AID-CNCR2820470134>3.0.CO;2-6
22. Hosmer DW Jr, Lemeshow S, Sturdivant RX. Applied Logistic Regression. 3rd Edition. Wiley Hoboken, New Jersey, U.S.: John Wiley and Sons, Inc) (2013). 528.
23. De Wailly P, Oragano L, Radé F, Beaulieu A, Arnault V, Levillain P, et al. Malignant pheochromocytoma: new malignancy criteria. Langenbecks Arch Surg (2012) 397:239–46. doi: 10.1007/s00423-011-0850-3
24. Gao B, Meng F, Bian W, Chen J, Zhao H, Ma G, et al. Development and validation of pheochromocytoma of the adrenal gland scaled score for predicting malignant pheochromocytomas. Urology (2006) 68:282–6. doi: 10.1016/j.urology.2006.02.019
25. Angelousi A, Kassi E, Zografos G, Kaltsas G. Metastatic pheochromocytoma and paraganglioma. Eur J Clin Invest (2015) 45:986–97. doi: 10.1111/eci.12495
26. Kim KY, Kim JH, Hong AR, Seong MW, Lee KE, Kim SJ, et al. Disentangling of malignancy from benign pheochromocytomas/paragangliomas. PloS One (2016) 11:e0168413. doi: 10.1371/journal.pone.0168413
27. Wu D, Tischler AS, Lloyd RV, Delellis RA, De Krijger R, Van Nederveen F, et al. Observer variation in the application of the Pheochromocytoma of the Adrenal Gland Scaled Score. Am J Surg Pathol (2009) 33:599–608. doi: 10.1097/PAS.0b013e318190d12e
28. Stenman A, Zedenius J, Juhlin CC. The value of histological algorithms to predict the malignancy potential of pheochromocytomas and abdominal paragangliomas-A meta-analysis and systematic review of the literature. Cancers (Basel) (2019) 11(2):225. doi: 10.3390/cancers11020225
29. Szalat A, Fraenkel M, Doviner V, Salmon A, Gross DJ. Malignant pheochromocytoma: predictive factors of malignancy and clinical course in 16 patients at a single tertiary medical center. Endocrine (2011) 39:160–6. doi: 10.1007/s12020-010-9422-5
30. Mlika M, Kourda N, Zorgati MM, Bahri S, Ben Ammar S, Zermani R. Prognostic value of Pheochromocytoma of the Adrenal Gland Scaled Score (Pass score) tests to separate benign from malignant neoplasms. Tunis Med (2013) 91:209–15.
31. Kulkarni MM, Khandeparkar SG, Deshmukh SD, Karekar RR, Gaopande VL, Joshi AR, et al. Risk stratification in paragangliomas with PASS (Pheochromocytoma of the adrenal gland scaled score) and immunohistochemical markers. J Clin Diagn Res (2016) 10:Ec01–ec04. doi: 10.7860/JCDR/2016/20565.8419
32. Koh JM, Ahn SH, Kim H, Kim BJ, Sung TY, Kim YH, et al. Validation of pathological grading systems for predicting metastatic potential in pheochromocytoma and paraganglioma. PloS One (2017) 12:e0187398. doi: 10.1371/journal.pone.0187398
33. Stenman A, Svahn F, Hojjat-Farsangi M, Zedenius J, Söderkvist P, Gimm O, et al. Molecular profiling of pheochromocytoma and abdominal paraganglioma stratified by the PASS algorithm reveals chromogranin B as associated with histologic prediction of malignant behavior. Am J Surg Pathol (2019) 43:409–21. doi: 10.1097/PAS.0000000000001190
34. Strong VE, Kennedy T, Al-Ahmadie H, Tang L, Coleman J, Fong Y, et al. Prognostic indicators of malignancy in adrenal pheochromocytomas: clinical, histopathologic, and cell cycle/apoptosis gene expression analysis. Surgery (2008) 143:759–68. doi: 10.1016/j.surg.2008.02.007
35. Agarwal A, Mehrotra PK, Jain M, Gupta SK, Mishra A, Chand G, et al. Size of the tumor and pheochromocytoma of the adrenal gland scaled score (PASS): can they predict malignancy? World J Surg (2010) 34:3022–8. doi: 10.1007/s00268-010-0744-5
36. Wachtel H, Hutchens T, Baraban E, Schwartz LE, Montone K, Baloch Z, et al. Predicting metastatic potential in pheochromocytoma and paraganglioma: A comparison of PASS and GAPP scoring systems. J Clin Endocrinol Metab (2020) 105:e4661–4670. doi: 10.1210/clinem/dgaa608
37. Koopman K, Gaal J, De Krijger RR. Pheochromocytomas and paragangliomas: new developments with regard to classification, genetics, and cell of origin. Cancers (Basel) (2019) 11(8):1070. doi: 10.3390/cancers11081070
38. Cho YY, Kwak MK, Lee SE, Kim JH, Lee SH. Reply to letter to editor regarding: “A clinical prediction model to estimate the metastatic potential of Pheochromocytoma/paraganglioma: ASES score”. Surg (United States) (2019) 165:853–8. doi: 10.1016/j.surg.2018.11.016
39. Mattoo S, Agarwal A, Mayilvaganan S, Agarwal G, Mishra A, Mishra SK, et al. Regarding: A clinical prediction model to estimate the metastatic potential of pheochromocytoma/paraganglioma: ASES score. Surg (United States) (2019) 165:853–8. doi: 10.1016/j.surg.2018.10.004
40. Ku EJ, Kim KJ, Kim JH, Kim MK, Ahn CH, Lee KA, et al. Diagnosis for pheochromocytoma and paraganglioma: A joint position statement of the Korean pheochromocytoma and paraganglioma task force. Endocrinol Metab (2021) 36:322–38. doi: 10.3803/EnM.2020.908
41. Lairmore TC, Howe JR, Korte JA, Dilley WG, Aine L, Aine E, et al. Familial medullary-thyroid carcinoma and multiple endocrine neoplasia type-2b map to the same region of chromosome-10 as multiple endocrine Neoplasia type-2a. Genomics (1991) 9:181–92. doi: 10.1016/0888-7543(91)90237-9
42. Castro-Vega LJ, Letouze E, Burnichon N, Buffet A, Disderot P-H, Khalifa E, et al. Multi-omics analysis defines core genomic alterations in pheochromocytomas and paragangliomas. Nat Commun (2015) 6(1):6044. doi: 10.1038/ncomms7044
43. Sulkowski PL, Sundaram RK, Oeck S, Corso CD, Liu Y, Noorbakhsh S, et al. Krebs-cycle-deficient hereditary cancer syndromes are defined by defects in homologous-recombination DNA repair. Nat Genet (2018) 50:1086–92. doi: 10.1038/s41588-018-0170-4
44. Tabebi M, Łysiak M, Dutta RK, Lomazzi S, Turkina MV, Brunaud L, et al. Genetic alterations in mitochondrial DNA are complementary to nuclear DNA mutations in pheochromocytomas. Cancers (Basel) (2022) 14(2):269. doi: 10.3390/cancers14020269
45. Tabebi M, Söderkvist P, Gimm O. Nuclear and mitochondrial DNA alterations in pheochromocytomas and paragangliomas, and their potential treatment. Endocr Relat Cancer (2023) 30(1):e220217. doi: 10.1530/ERC-22-0217
46. Cascón A, Calsina B, Monteagudo M, Mellid S, Díaz-Talavera A, Currás-Freixes M, et al. Genetic bases of pheochromocytoma and paraganglioma. J Mol Endocrinol (2023) 70(3):e220167. doi: 10.1530/JME-22-016
47. Petrovski S, Goldstein DB. Unequal representation of genetic variation across ancestry groups creates healthcare inequality in the application of precision medicine. Genome Biol (2016) 17:157. doi: 10.1186/s13059-016-1016-y
48. Arora K, Tran TN, Kemel Y, Mehine M, Liu YL, Nandakumar S, et al. Genetic ancestry correlates with somatic differences in a real-world clinical cancer sequencing cohort. Cancer Discov (2022) 12:2552–65. doi: 10.1158/2159-8290.CD-22-0312
Keywords: adrenal, extra-adrenal, paraganglioma, pheochromocytoma, PPGL, adrenal medulla, prediction PASS score, biomarker
Citation: Hanschell H, Diaz-Cano S, Blanes A, Talat N, Galatá G, Aylwin S and Schulte KM (2023) Lesion-based indicators predict long-term outcomes of pheochromocytoma and paraganglioma– SIZEPASS. Front. Endocrinol. 14:1235243. doi: 10.3389/fendo.2023.1235243
Received: 06 June 2023; Accepted: 12 July 2023;
Published: 04 August 2023.
Edited by:
Amir Hekmat Hamrahian, The Johns Hopkins Hospital, United StatesReviewed by:
Ezra Baraban, Yale University, United StatesCopyright © 2023 Hanschell, Diaz-Cano, Blanes, Talat, Galatá, Aylwin and Schulte. This is an open-access article distributed under the terms of the Creative Commons Attribution License (CC BY). The use, distribution or reproduction in other forums is permitted, provided the original author(s) and the copyright owner(s) are credited and that the original publication in this journal is cited, in accordance with accepted academic practice. No use, distribution or reproduction is permitted which does not comply with these terms.
*Correspondence: Klaus Martin Schulte, a20uc2NodWx0ZUBhbnUuZWR1LmF1
†ORCID: Salvador Diaz-Cano, orcid.org/0000-0003-1245-2859
Simon Aylwin, orcid.org/0000-0001-9411-9456
Klaus-Martin Schulte, orcid.org/0000-0002-9091-0512
Disclaimer: All claims expressed in this article are solely those of the authors and do not necessarily represent those of their affiliated organizations, or those of the publisher, the editors and the reviewers. Any product that may be evaluated in this article or claim that may be made by its manufacturer is not guaranteed or endorsed by the publisher.
Research integrity at Frontiers
Learn more about the work of our research integrity team to safeguard the quality of each article we publish.