 Heng Wang
 Jia-Li Fan
95% of researchers rate our articles as excellent or good
Learn more about the work of our research integrity team to safeguard the quality of each article we publish.
Find out more
ORIGINAL RESEARCH article
Front. Endocrinol. , 09 October 2023
Sec. Clinical Diabetes
Volume 14 - 2023 | https://doi.org/10.3389/fendo.2023.1234140
This article is part of the Research Topic Women in Clinical Diabetes View all 15 articles
Background: Lipoprotein(a) [Lp(a)] is a well-established risk factor for cardiovascular diseases. However, the relationship between Lp(a) and insulin resistance (IR) remains controversial. The aim of the current study was to investigate the association between Lp(a) concentrations and IR in Chinese adults.
Methods: Cross-sectional study of 1908 cases and 5725 controls was performed for identifying the association of Lp(a) with IR. IR was assessed using the triglyceride glucose (TyG) index, and patients with a TyG index greater than the third quartile were defined as having IR.
Results: The distribution of Lp(a) in Chinese adults was skewed, with a median of 7.90mg/dL. Lp(a) concentrations were significantly and progressively lower with increasing TyG index values in Chinese adult males, but not in females. Multiple regression analysis adjusted for a wide range of risk factors showed that Lp(a) concentrations were inversely and independently associated with IR in Chinese adult males, but not in females. The suggested Lp (a) cutoff for discriminating IR from non-IR was 4.7 mg/dL in Chinese adult males. Lp(a) interacts with gender in IR on both additive and multiplicative scale in Chinese adults.
Conclusion: Lp(a) concentrations inversely associated with IR in Chinses adult males, but the association in women needs further study. In Chinese adults, Lp(a) interacts with gender in IR.
Insulin resistance (IR) is a physiological condition characterized by reduced responsiveness of insulin-targeting tissues to high physiological insulin levels and is considered the pathogenic driver of many modern diseases, including metabolic syndrome, nonalcoholic fatty liver disease, atherosclerosis, and type 2 diabetes mellitus (T2DM) (1). Hyperinsulinemia euglycemic clamp (HIEC) was first introduced by De Fronzo in 1979 and till date, remains the “gold standard” to assess IR (2). Due to its invasive nature and technical complexity, the utilization of this technique is infrequent in clinical settings (2). The triglyceride glucose (TyG) index is a simple, reliable, and reproducible index which is capable of measuring IR (3). Previous studies showed that the TyG index was superior to the HOMA-IR, which was widely used as a means for detecting IR at present, in assessing IR in individuals with and without diabetes (4).
Lipoprotein(a) [Lp(a)] is a well-established risk factor for cardiovascular diseases (5–7). Since strong evidence demonstrated a causal relationship between Lp(a) and cardiovascular disease, novel drugs that specifically lower Lp(a) levels were developed (8). However, the relationship between Lp(a) and IR as well as T2DM remains contentious, as previous studies have produced conflicting results (7, 9–17). A study of middle-aged and elderly Chinese population showed that there was an inverse association between Lp(a) and IR (11). The inverse association between Lp(a) and IR was also observed in hypertensive patients and in dyslipidemic subjects (12, 13). However, another study showed that IR in pregnancy was not affected by Lp(a) (14).
There is not enough evidence to clarify the relationship between Lp(a) and IR in Chinese adults. Therefore, this study enrolled participants from the China Health and Nutrition Survey (CHNS) cohort to investigate the association between Lp(a) concentrations and IR measured by the TyG index in Chinese adults, and to investigate the potential interaction between Lp(a) concentrations and gender on IR.
All study data were obtained from the CHNS cohort. The CHNS was designed as a prospective household-based study that includes cohorts across nine diverse provinces between 1989 and 2009 (18). The CHNS is a collaborative project between the Carolina Population Center (CPC), University of North Carolina at Chapel Hill, and the National Institute of Nutrition and Food Safety, CCDC. Each CHNS participant has given written informed consent, and the study received approval from the institutional review boards at the University of North Carolina at Chapel Hill and the National Institute of Nutrition and Food Safety (18). Data available at https://www.cpc.unc.edu/projects/china.
Patients with blood assay results, abstracted from the CHNS dataset, were included for potential analysis. Exclusion criteria: 1) younger than 18 years old; 2) diagnosed with diabetes; 3) unknown diagnosis of diabetes; 4) HbA1c level ≥ 6.5%; 5) blood glucose level ≥ 126.0mg/dL.
The main dependent variable in the current study was the TyG index, which is a simple and useful indicator of IR (4). The TyG index was calculated using the formula: ln [triglyceride (mg/dL) × fasting blood glucose (mg/dL)]/2 (3, 19). We define the individuals with the highest TyG index quartile (>4.8184) as IR.
The main independent variable in the current study was Lp(a). Lp(a) concentrations were measured by immunoturbidimetry using reagents from Denka Seiken Ltd., Japan. To avoid the influence of extreme values, Lp(a) concentrations that exceeded the 99th percentile were substituted with the Lp(a) value corresponding to the 99th percentile.
Control variables that can act as potential confounding variables include demographic factors, lifestyles, personal histories of cardiovascular and cerebrovascular diseases, and biochemical examination.
In this study, demographic factors included age, gender, province, body mass index, and educational level. Lifestyles included smoking, alcohol consumption, and total calorie intake. Personal histories of cardiovascular and cerebrovascular diseases included myocardial infarction, stroke, hypertension. Biochemical examinations included low-density lipoprotein cholesterol, hemoglobin A1c (HbA1c), and insulin.
Continuous variables were tested for normality using Shapiro-Wilk test. All of the continuous variables in the current study, failing to conform to normality, were expressed as median (inter quartile range, IQR) and compared using Kruskal-Wallis rank test. Categorical variables were expressed as frequency(percentage) and compared using Pearson’s chi square test or Fisher’s exact test as appropriate. Missing values were imputed using multiple imputation.
The correlations between Lp(a) concentrations and other factors were evaluated according to Pearson correlation coefficients. Unconditional logistic regression was performed to assess the independent association between IR and the TyG index: model 1 (crude model), model 2 (partially adjusted model) adjusted for age, gender, and province, and model 3 (fully adjusted model) adjusted for demographic factors, lifestyles, personal histories of cardiovascular and cerebrovascular diseases, biochemical examinations. Categorization of the Lp (a) concentrations was based on the non-IR controls. The Lp (a) was categorized into quintiles and incorporated into regression models as dummy variable. The 1st quintile of Lp(a) was chosen as the reference category. Odds ratios (ORs) were calculated for the 2nd, 3rd, 4th, and 5th quintiles relative to the reference category. Receiving operating characteristic (ROC) analysis was employed to define the Lp (a) cutoff for discriminating between IR and non-IR. We assessed the interactions with the measures of effect modification on both additive and multiplicative scale. By considering the presence (A and B) and absence (A and B) of two risk factors, and using the terms R for risk and RR for relative risk, we defined RERI as follows (20):
RERI= {R(AB)- {R(AB)- R(AB)}- {R(AB)- R(AB)}- R(AB)}/R(AB)
=RR(AB)- RR(AB)- RR(AB)+ 1
All statistical analyses were completed using STATA 15.1. Two-tailed P <0.05 was considered to be statistically significant.
A total of 9549 respondents were enrolled for potential analysis, among whom, 848 were excluded because of younger than 18 years old; 1068, because of diagnosed with diabetes, unknown diagnosis of diabetes, taking antidiabetic drugs, high HbA1c level or high fasting blood glucose level. As a result, a total of 7633 participants were enrolled in the final analysis, among whom, 1908 with IR, and 5725 with non-IR. Details were seen in flow chart in Figure 1.
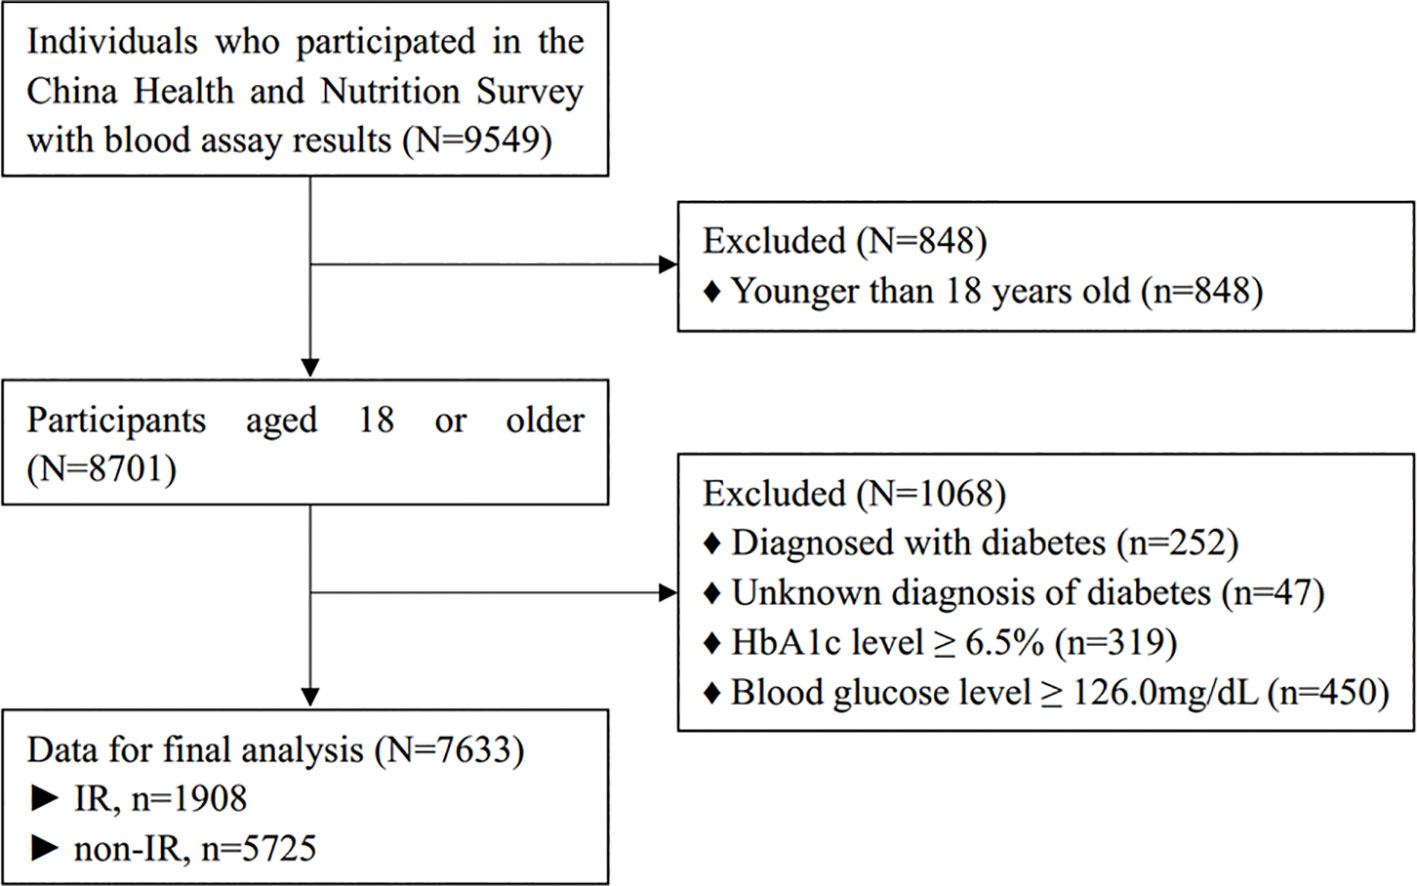
Figure 1 Flow chart of participants selection.
Frequency distribution diagrams showed that Lp(a) concentrations and the TyG index fail to conform to normal distribution. On average, the Lp (a) concentrations were 7.90 (12.70) [median (IQR, inter quartile range)] mg/dL, and the TyG index values were 4.59 (0.43) [median (IQR)] in all participants. See Figure 2.
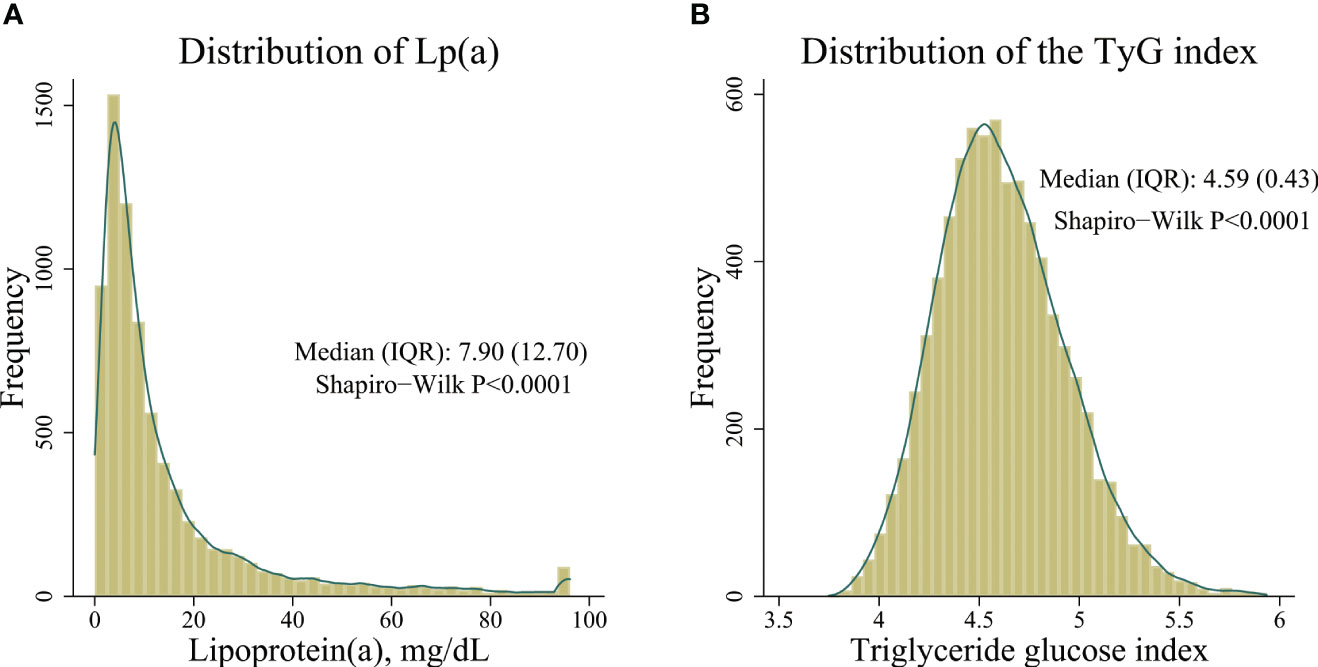
Figure 2 Distribution of Lp(a) concentrations and the triglyceride glucose index. (A) distribution of Lp(a) concentrations, (B) distribution of the triglyceride glucose index.
A total of 7633 participants were enrolled in the current study, of which 1908 were classified as IR. Individuals with IR were characterized by older age, a higher proportion of males, higher rates of current smoking and alcohol consumption. They also exhibited a greater prevalence of hypertension and stroke, higher BMI, and elevated TyG index values. Details in Table 1.
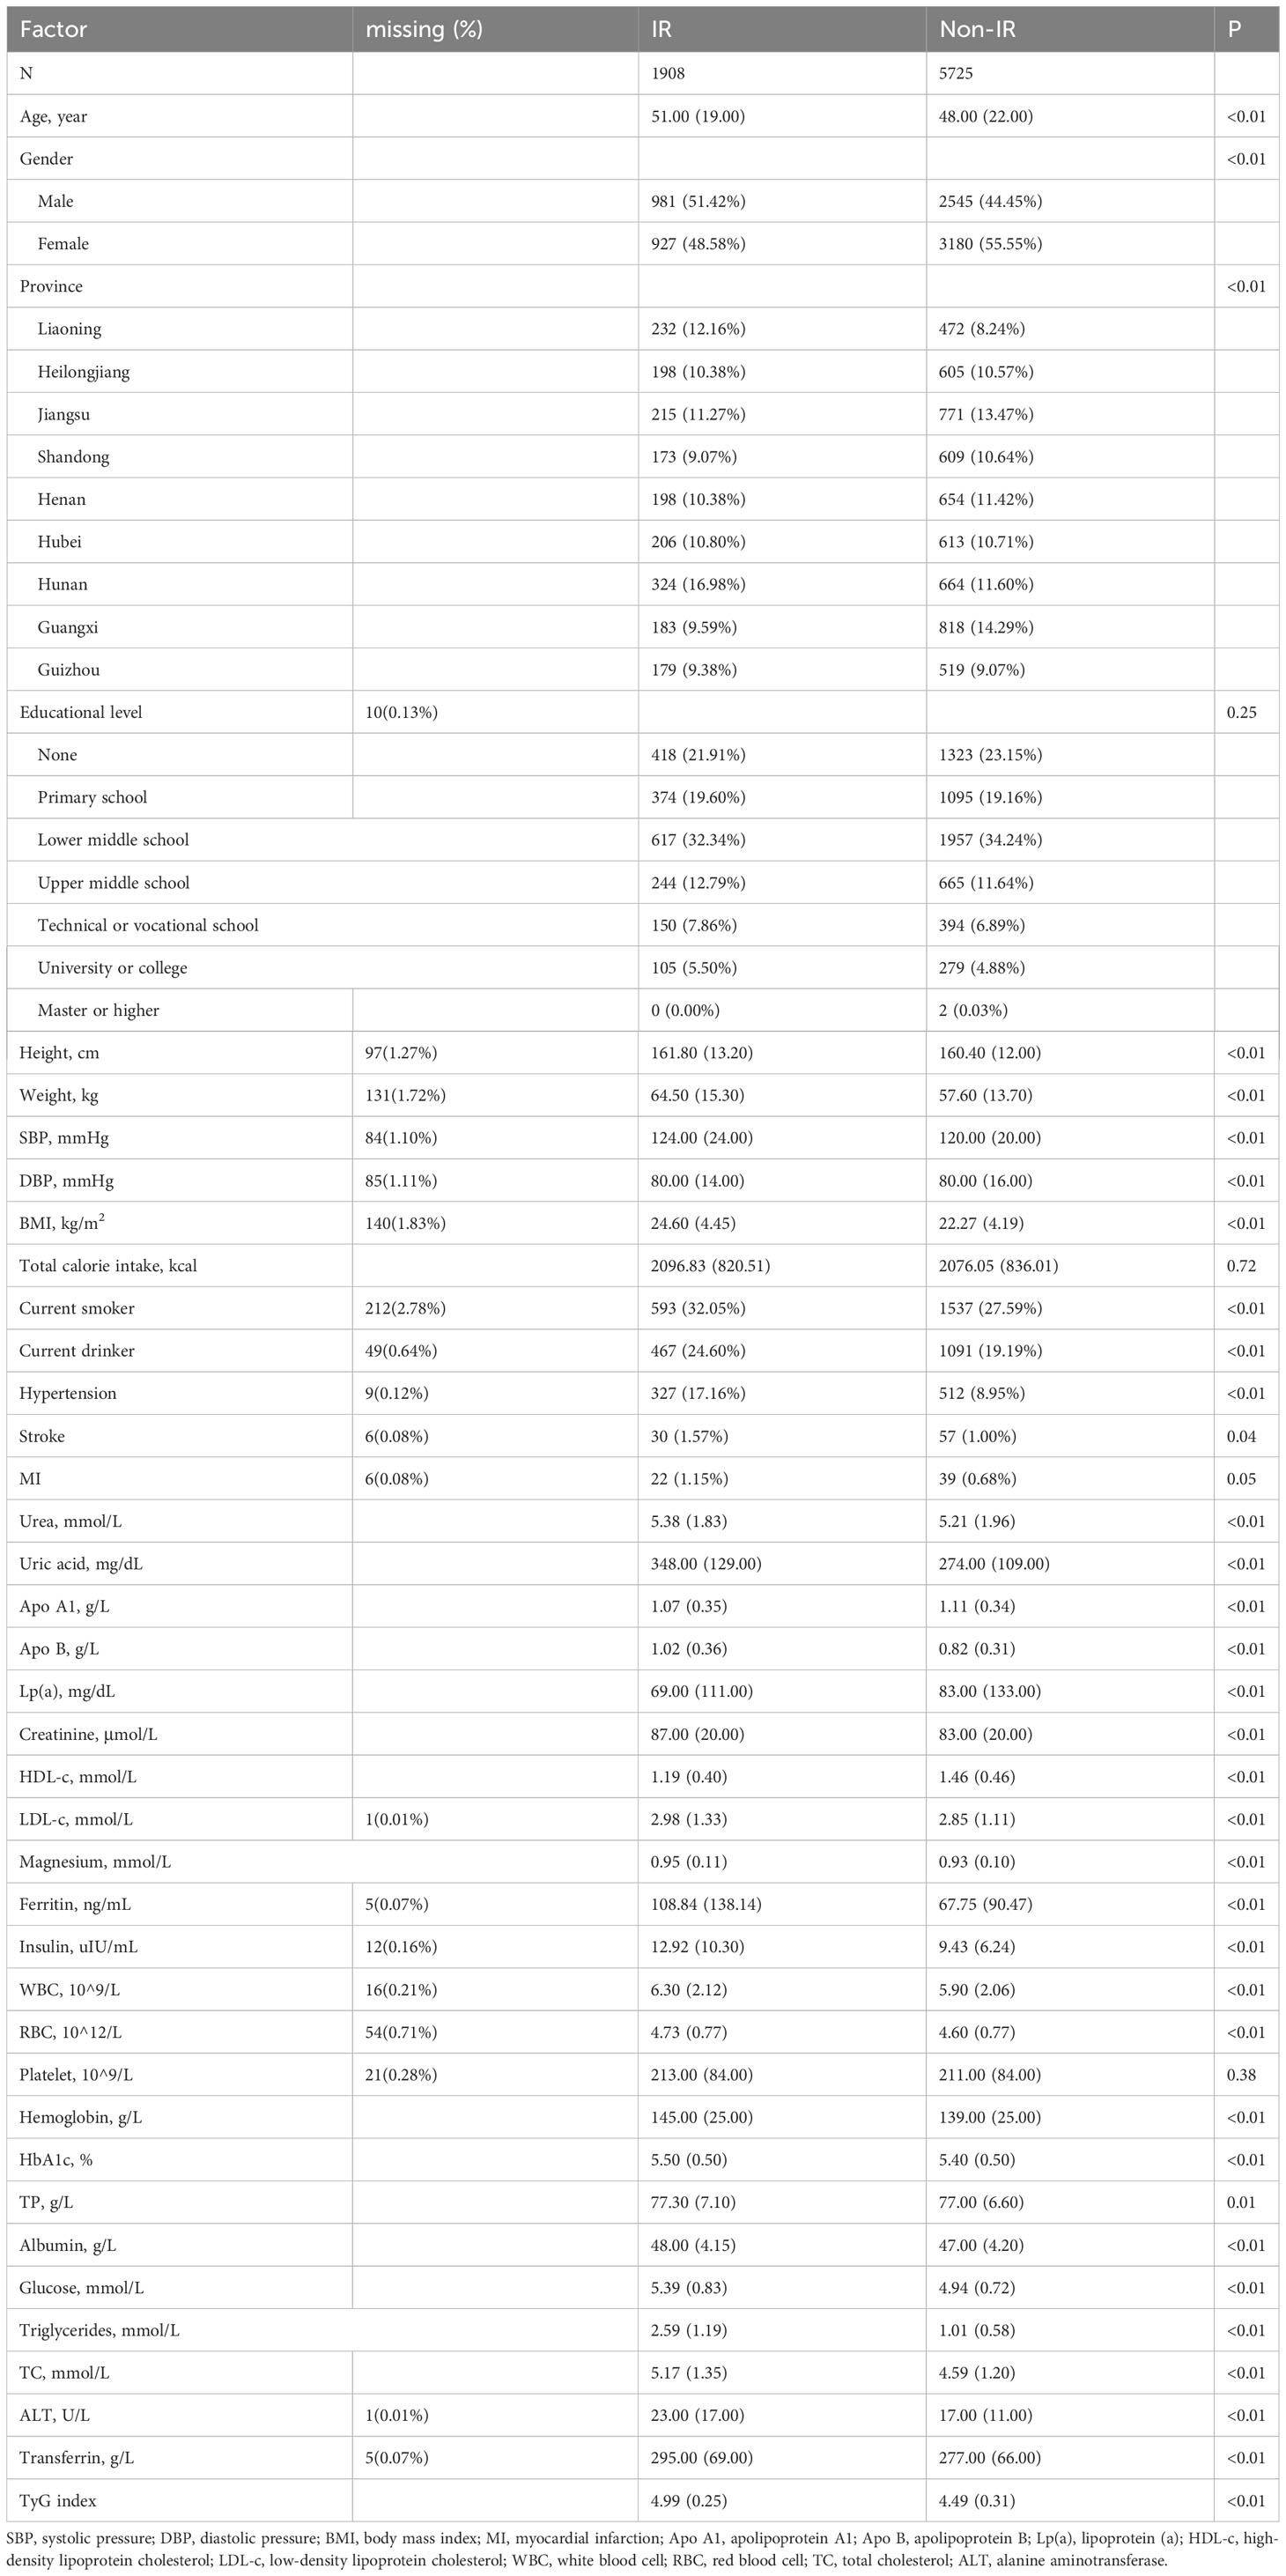
Table 1 Baseline characteristics of the study population grouped by IR.
There was a negative correlation between Lp(a) concentrations and the TyG index in the overall population (r = -0.045, 95%CI: -0.068 to -0.023, P< 0.001) as well as in men (r = -0.086, 95%CI: -0.119 to -0.053, P< 0.001). However, no significant correlation was found between Lp(a) concentrations and the TyG index in women (r = -0.005, 95%CI: -0.036 to 0.025, P= 0.734). See Figure 3.
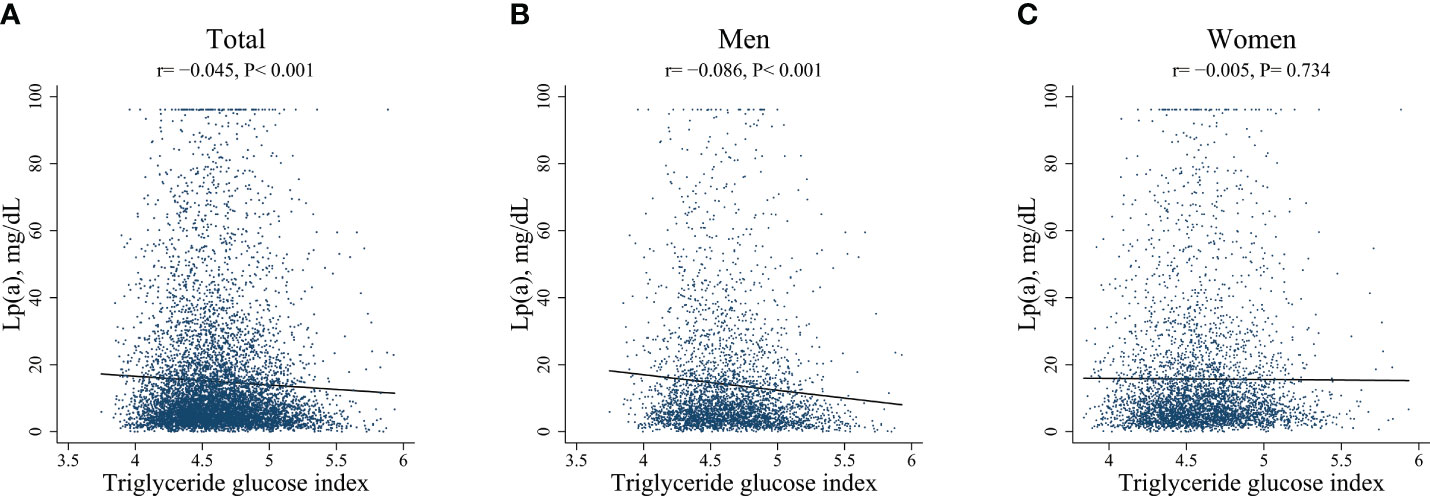
Figure 3 Scatter plots of Lp(a) with TyG index, respectively in total, in men, and in women.
Overall, the Lp(a) concentrations were weakly, although significantly, correlated with gender (r= 0.045, 95%CI: 0.022 to 0.067, P<0.001), BMI (r=-0.048, 95%CI: -0.070 to -0.025, P<0.001), age (r= 0.078, 95%CI: 0.056 to 0.101, P< 0.001), and LDL-c (r= 0.195, 95%CI: 0.173 to 0.216, P<0.001).
Table 2 showed risk ratios for IR per 10mg/dL higher Lp(a) concentrations. In crude model, risk ratios for Lp(a) were significant in the total population and in men, while not in women. In both partially adjusted and fully adjusted models, the risk ratios for Lp(a) remained significant in the total population and in men, but not in women.
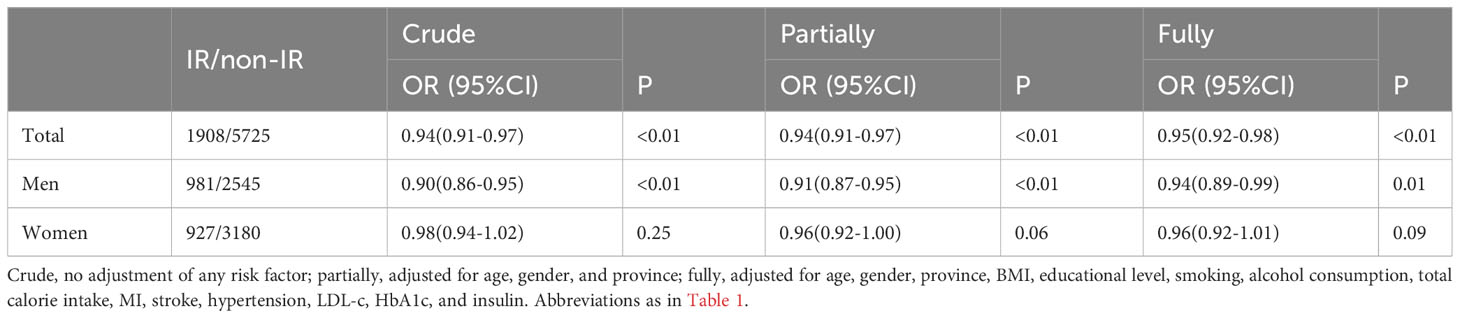
Table 2 Risk ratios of per 10 mg/dL higher Lp (a) levels for IR on a continuous scale.
Compared with those with the lowest quintile of Lp(a) concentrations, participants with higher Lp(a) quintiles had decreased risk of IR in men (P <0.01 for trend). See Table 3.
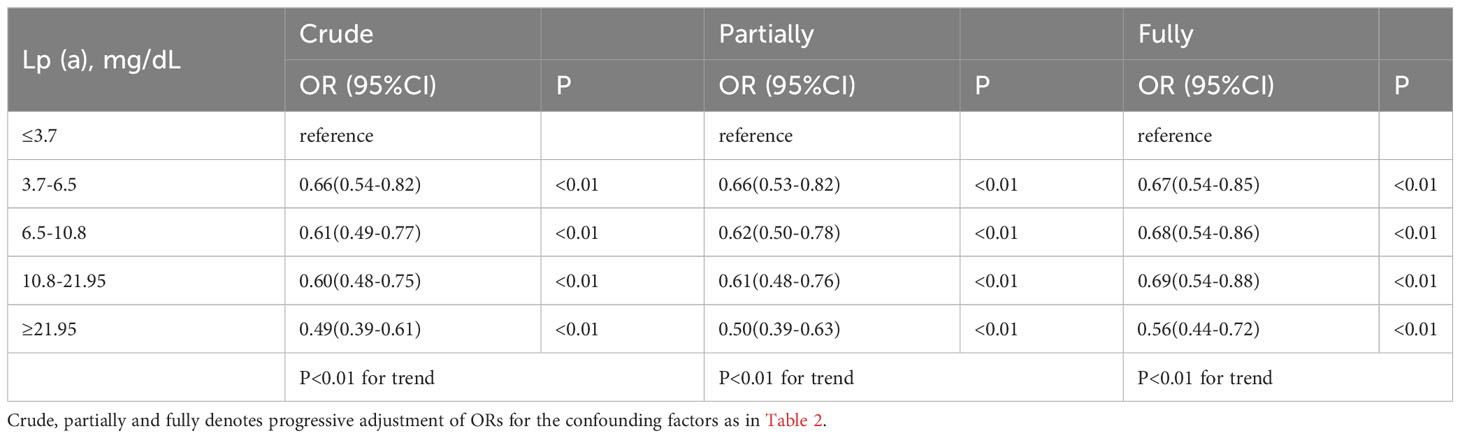
Table 3 Risk ratios of per 10 mg/dL higher Lp (a) levels for IR on a categorical scale in men.
Lp(a) cutoff for discriminating between IR and non-IR in Chinses adult males was 4.7 mg/dL according to ROC analysis. Correspondingly, the AUC (area of the ROC curve) was 0.58, 95% CI (0.56-0.60); sensitivity and specificity, 70% and 43%, respectively.
Sensitivity analysis by excluding individuals with missing values stepwisely was performed, and the association of Lp (a) with IR in men didn’t alter materially (see Supplementary Table 1).
Compared with reference group (women and in the 5th quintile of Lp(a)), multivariable adjusted analysis revealed that ORs(95%CI) of IR for men were 1.20 (0.83-1.74), 1.24 (0.87-1.77), 1.31 (0.93-1.85), 1.29 (0.91-1.84), and 2.08 (1.50-2.87), respectively (see Supplementary Table 2). According to the high (Q5) and the lower levels (Q4-Q1) of Lp (a), and to the gender classifications for women and men, 4 RERIs (95%CI) at Q4-Q1 were calculated: 0.19(-0.19~0.58), 0.13(-0.28~0.53), 0.04(-0.39~0.48) and 0.81(0.33~1.28), among which, the RERI at Q1 did not cover zero, indicating significant interaction between Lp(a) and gender. The P value of multiplicative at Q1 were 0.01. see Table 4.

Table 4 Interaction of Lp(a) with gender on IR on additive and multiplicative scale.
The main findings in the current study were as follows: (a) Lp(a) concentrations independently associated with IR in men, but not in women; (b) The association between Lp(a) and IR in men stepwisely intensified as Lp(a) concentrations or quintiles increased; (c) the Lp(a) cutoff for IR was 4.7 mg/dL in Chinese adult males; (d) In Chinese adults, Lp(a) interacts with gender in IR.
In the current study, Lp(a) concentrations showed a skewed distribution with a median of 7.9mg/dL. This observation aligned with a previous study conducted on the Chinese Han ethnic population, which similarly reported a skewed distribution of Lp(a) with a median of 7.4 mg/dL (21). Interestingly, the Copenhagen City Heart Study reported a considerably higher median Lp(a) concentrations of up to 18 mg/dL (22). Additionally, a study conducted using data from the UK Biobank revealed that individuals of white, South Asian, and black ethnicities exhibited significantly higher Lp(a) concentrations compared to the Chinese population (23). Lp(a) is composed of an LDL-like particle in which Apo B is covalently bound by a single disulfide bond to Apo A, the pathognomonic component of Lp(a) (24). There was an inverse relationship between Apo A size and the plasma concentration of Lp(a), and isoform size may explain up to 70% of plasma levels (9). Low Lp(a) concentrations in Chinese could be explained by a high frequency of the S4 allele and a low frequency of the S3, S2, S1 and B alleles (25).
The application of the corrected formula for the TyG index in the present study resulted in a median value of 4.59, which was found to be lower than the medians reported in studies conducted on the Korean National Health and Nutrition Examination Survey (KNHANES) and the China Health and Retirement Longitudinal Study (CHARLS) (26, 27). The TyG index has been established as a reliable and easily accessible indicator for assessing IR, as demonstrated by previous studies (4). However, the cut-off of the TyG index for discriminating between IR and non-IR is still controversial, because the cut-offs varied between the existing studies (28). According to the results in clamp studies, IR individuals could be defined as the 25% of the population with the highest IR, providing the population under study could be thought to be representative of the nondiabetic population (29). In the current study, individuals diagnosed with diabetes were intentionally excluded. Consequently, we established the threshold for IR by defining the highest quartile of the TyG index (>4.8184) as the cut-off value.
Our study showed that Lp(a) concentrations were inversely associated with IR, in agreement with the results reported in previous studies (11–13). A large cross-sectional Chinese study also showed that low Lp(a) associated with increased risk of pre-diabetes, IR, and hyperinsulinaemia (11). As Lp(a) is a well-established independent risk factor for cardiovascular diseases (CVD), one possible explanation is that mortality may be increased at younger ages in those with high Lp(a) and T2DM, as well as IR (8, 11). However, Ding et al. showed that the inverse association between Lp(a) and T2DM remained robust after the exclusion of patients with CVD (11). In the current study, patients with IR were slightly older than those without IR after the exclusion of patients with diabetes, which also does not support a survival bias explanation.
The mechanisms underlying the association of Lp(a) concentrations with T2DM and IR have not been well explained. Although Lp(a) concentrations are mainly influenced by genetics (>90%), non-genetic factors may also modulate Lp(a) concentrations (8). Neele et al. showed that high concentrations of insulin inhibited apolipoprotein (a) synthesis in monkey hepatocytes at the (post) transcriptional level (30). This theory could partly explain the low concentrations of Lp(a) in patients with T2DM and IR. Meanwhile, Apo A isoforms were significantly larger in individuals with elevated insulin or glucose levels, and the size of Apo A was inversely related to the plasma concentrations of Lp(a) (9, 17).
Interestingly, our study demonstrated little evidence for an association between Lp(a) and IR in women. Previous studies showed that Lp(a) concentrations were approximately 5% to 10% higher in women than in men in both black and white individuals (8). The level of Lp(a) in women tends to increase during menopause, whereas Lp(a) in men remains constant (31). Derby et al. suggested that follicle-stimulating hormone, but not estradiol, associated with elevated Lp(a) in women at menopause (31). Similarly, gender correlated with Lp(a) concentrations in the current study. We hypothesized that elevated Lp(a) levels in women, especially in menopausal women, may affect the association between Lp(a) and IR.
To the best of our knowledge, this is the first study to assess the interaction of Lp(a) with gender on IR. Rothman et al. proposed that the interaction should be classified as either a statistical or a biologic interaction and that the biologic interaction should be measured using an additive model (32). In the current study, the risk of IR within Q1 of Lp(a) and men was 2.08 times the risk of IR within Q5 of Lp(a) and women, and RERI (95% CI) was 0.81(0.33~1.28) at Q5 of Lp(a). As for the positive additive interaction in our study, there was synergetic effect between Lp(a) and gender on IR. Estrogen has been implicated in sex differences in IR (33). Clinical studies showed that postmenopausal women are more likely to have dyslipidemia and impaired glucose tolerance than premenopausal women, which was consistent with the findings in animal models (33, 34). The mechanism of the interaction between low Lp(a) concentration and gender on IR needs further investigation.
There are several limitations to the current study. First, this study is a large, household-based cross-sectional study, enabling us to gain insights into the distribution pattern and overall levels of Lp(a), as well as its correlation with IR in Chinese adults. However, the cross-sectional study design inherently introduced confounding factors, which have the potential to either exaggerate or weaken the association of exposure with the main outcome. Second, Lp(a) concentrations were reported in the form of total mass (i.e., mg/dL) in the current study. Currently, there is an increasing trend for Lp(a) concentrations to be reported as particle number (i.e., nmol/L) (35). Because of the heterogeneity of Lp(a) particle size, a direct conversion between total mass and particle number is not feasible, which may have implications for the findings (24). Third, it should be noted that the TyG index, while not considered the gold standard for detecting IR, offers distinct advantages in terms of accessibility and cost-effectiveness compared to the gold standard methods. As a result, the TyG index is suitable for the screening of IR in clinical practice (2).
Lp(a) concentrations inversely associated with IR in Chinses adult males, but the association in women needs further study. In Chinese adults, Lp(a) interacts with gender in IR.
The datasets presented in this study can be found in online repositories. The names of the repository/repositories and accession number(s) can be found below: https://www.cpc.unc.edu/projects/china.
The studies involving humans were approved by the institutional review boards at the University of North Carolina at Chapel Hill and the National Institute of Nutrition and Food Safety. The studies were conducted in accordance with the local legislation and institutional requirements. The human samples used in this study were acquired from the CHNS cohort. The CHNS is a collaborative project between the Carolina Population Center (CPC), University of North Carolina at Chapel Hill, and the National Institute of Nutrition and Food Safety, CCDC. Written informed consent for participation was not required from the participants or the participants’ legal guardians/next of kin in accordance with the national legislation and institutional requirements.
All authors participated in the design and coordination of the study. HW performed the statistical analysis and wrote the manuscript. JF was involved in the study design and critically revised the manuscript. All authors contributed to the article and approved the submitted version.
We would like to thank the CHNS administration for providing publicly available data that enabled us to prepare this paper.
The authors declare that the research was conducted in the absence of any commercial or financial relationships that could be construed as a potential conflict of interest.
All claims expressed in this article are solely those of the authors and do not necessarily represent those of their affiliated organizations, or those of the publisher, the editors and the reviewers. Any product that may be evaluated in this article, or claim that may be made by its manufacturer, is not guaranteed or endorsed by the publisher.
The Supplementary Material for this article can be found online at: https://www.frontiersin.org/articles/10.3389/fendo.2023.1234140/full#supplementary-material
1. Lee SH, Park SY, Choi CS. Insulin resistance: from mechanisms to therapeutic strategies. Diabetes Metab J (2022) 46(1):15–37. doi: 10.4093/dmj.2021.0280
2. Minh HV, Tien HA, Sinh CT, Thang DC, Chen CH, Tay JC, et al. Assessment of preferred methods to measure insulin resistance in Asian patients with hypertension. J Clin hypertens (Greenwich Conn). (2021) 23(3):529–37. doi: 10.1111/jch.14155
3. Simental-Mendía LE, Rodríguez-Morán M, Guerrero-Romero F. The product of fasting glucose and triglycerides as surrogate for identifying insulin resistance in apparently healthy subjects. Metab syndrome related Disord (2008) 6(4):299–304. doi: 10.1089/met.2008.0034
4. Tao LC, Xu JN, Wang TT, Hua F, Li JJ. Triglyceride-glucose index as a marker in cardiovascular diseases: landscape and limitations. Cardiovasc Diabetol (2022) 21(1):68. doi: 10.1186/s12933-022-01511-x
5. Erqou S, Kaptoge S, Perry PL, Di Angelantonio E, Thompson A, White IR, et al. Lipoprotein(a) concentration and the risk of coronary heart disease, stroke, and nonvascular mortality. Jama (2009) 302(4):412–23. doi: 10.1001/jama.2009.1063
6. Craig WY, Neveux LM, Palomaki GE, Cleveland MM, Haddow JE. Lipoprotein(a) as a risk factor for ischemic heart disease: metaanalysis of prospective studies. Clin Chem (1998) 44(11):2301–6. doi: 10.1093/clinchem/44.11.2301
7. Gudbjartsson DF, Thorgeirsson G, Sulem P, Helgadottir A, Gylfason A, Saemundsdottir J, et al. Lipoprotein(a) concentration and risks of cardiovascular disease and diabetes. J Am Coll Cardiol (2019) 74(24):2982–94. doi: 10.1016/j.jacc.2019.10.019
8. Kronenberg F, Mora S, Stroes ESG, Ference BA, Arsenault BJ, Berglund L, et al. Lipoprotein(a) in atherosclerotic cardiovascular disease and aortic stenosis: a European Atherosclerosis Society consensus statement. Eur Heart J (2022) 43(39):3925–46. doi: 10.1093/eurheartj/ehac361
9. Ruscica M, Sirtori CR, Corsini A, Watts GF, Sahebkar A. Lipoprotein(a): Knowns, unknowns and uncertainties. Pharmacol Res (2021) 173:105812. doi: 10.1016/j.phrs.2021.105812
10. Lamina C, Ward NC. Lipoprotein (a) and diabetes mellitus. Atherosclerosis (2022) 349:63–71. doi: 10.1016/j.atherosclerosis.2022.04.016
11. Ding L, Song A, Dai M, Xu M, Sun W, Xu B, et al. Serum lipoprotein (a) concentrations are inversely associated with T2D, prediabetes, and insulin resistance in a middle-aged and elderly Chinese population. J Lipid Res (2015) 56(4):920–6. doi: 10.1194/jlr.P049015
12. Marzano L, Colussi G, Del Torre M, Sechi LA, Catena C. Relationships of plasma lipoprotein(a) levels with insulin resistance in hypertensive patients. Metab: Clin experimental. (2014) 63(11):1439–46. doi: 10.1016/j.metabol.2014.08.007
13. Vaverková H, Karásek D, Halenka M, Cibíčková L, Kubíčková V. Inverse association of lipoprotein (a) with markers of insulin resistance in dyslipidemic subjects. Physiol Res (2017) 66(Suppl 1):S113–s120. doi: 10.33549/physiolres.933583
14. Todoric J, Handisurya A, Leitner K, Harreiter J, Hoermann G, Kautzky-Willer A. Lipoprotein(a) is not related to markers of insulin resistance in pregnancy. Cardiovasc Diabetol (2013) 12:138. doi: 10.1186/1475-2840-12-138
15. Habib SS, Aslam M. Lipids and lipoprotein(a) concentrations in Pakistani patients with type 2 diabetes mellitus. Diabet Obes Metab (2004) 6(5):338–43. doi: 10.1111/j.1462-8902.2004.00352.x
16. Habib SS, Aslam M, Shah SF, Naveed AK. Lipoprotein (a) is associated with basal insulin levels in patients with type 2 Diabetes Mellitus. Arquivos brasileiros cardiologia. (2009) 93(1):28–33. doi: 10.1590/s0066-782x2009000700006
17. Rainwater DL, Haffner SM. Insulin and 2-hour glucose levels are inversely related to Lp(a) concentrations controlled for LPA genotype. Arteriosclerosis thrombosis Vasc Biol (1998) 18(8):1335–41. doi: 10.1161/01.ATV.18.8.1335
18. Zhang B, Zhai FY, Du SF, Popkin BM. The China health and nutrition survey, 1989-2011. Obes reviews: an Off J Int Assoc Study Obes (2014) 15 Suppl 1(0 1):2–7. doi: 10.1111/obr.12119
19. Simental-Mendía LE, Guerrero-Romero F. The correct formula for the triglycerides and glucose index. Eur J pediatrics. (2020) 179(7):1171. doi: 10.1007/s00431-020-03644-1
20. Hu Y, Tao JY, Cai DP, He YM. Interaction of lipoprotein(a) with low-density lipoprotein cholesterol on first incident acute myocardial infarction. Clinica chimica acta; Int J Clin Chem (2020) 501:1–5. doi: 10.1016/j.cca.2019.10.044
21. Cai DP, He YM, Yang XJ, Zhao X, Xu HF. Lipoprotein (a) is a risk factor for coronary artery disease in Chinese Han ethnic population modified by some traditional risk factors: A cross-sectional study of 3462 cases and 6125 controls. Clinica chimica acta; Int J Clin Chem (2015) 451(Pt B):278–86. doi: 10.1016/j.cca.2015.10.009
22. Kamstrup PR, Benn M, Tybjaerg-Hansen A, Nordestgaard BG. Extreme lipoprotein(a) levels and risk of myocardial infarction in the general population: the Copenhagen City Heart Study. Circulation (2008) 117(2):176–84. doi: 10.1161/CIRCULATIONAHA.107.715698
23. Patel AP, Wang M, Pirruccello JP, Ellinor PT, Ng K, Kathiresan S, et al. Lp(a) (Lipoprotein[a]) concentrations and incident atherosclerotic cardiovascular disease: new insights from a large national biobank. Arteriosclerosis thrombosis Vasc Biol (2021) 41(1):465–74. doi: 10.1161/atvbaha.120.315291
24. Tsimikas S. A test in context: lipoprotein(a): diagnosis, prognosis, controversies, and emerging therapies. J Am Coll Cardiol (2017) 69(6):692–711. doi: 10.1016/j.jacc.2016.11.042
25. Sandholzer C, Hallman DM, Saha N, Sigurdsson G, Lackner C, Császár A, et al. Effects of the apolipoprotein(a) size polymorphism on the lipoprotein(a) concentration in 7 ethnic groups. Hum Genet (1991) 86(6):607–14. doi: 10.1007/BF00201550
26. Jeong SH, Joo HJ, Kwon J, Park EC. Association between smoking behavior and insulin resistance using triglyceride-glucose index among South Korean adults. J Clin Endocrinol Metab (2021) 106(11):e4531–41. doi: 10.1210/clinem/dgab399
27. Liu T, Xuan H, Yin J, Wang L, Wang C, Xu X, et al. Triglyceride glucose index increases significantly risk of hypertension development in chinese individuals aged ≥45 years old: analysis from the China health and retirement longitudinal study. J Multidiscip healthcare. (2023) 16:63–73. doi: 10.2147/JMDH.S391905
28. Tahapary DL, Pratisthita LB, Fitri NA, Marcella C, Wafa S, Kurniawan F, et al. Challenges in the diagnosis of insulin resistance: Focusing on the role of HOMA-IR and Tryglyceride/glucose index. Diabetes Metab syndrome. (2022) 16(8):102581. doi: 10.1016/j.dsx.2022.102581
29. Balkau B, Charles MA. Comment on the provisional report from the WHO consultation. Eur Group Study Insulin Res (EGIR). Diabetic Med: J Br Diabetic Assoc (1999) 16(5):442–3. doi: 10.1046/j.1464-5491.1999.00059.x
30. Neele DM, de Wit EC, Princen HM. Insulin suppresses apolipoprotein(a) synthesis by primary cultures of cynomolgus monkey hepatocytes. Diabetologia (1999) 42(1):41–4. doi: 10.1007/s001250051110
31. Derby CA, Crawford SL, Pasternak RC, Sowers M, Sternfeld B, Matthews KA. Lipid changes during the menopause transition in relation to age and weight: the Study of Women’s Health Across the Nation. Am J Epidemiol (2009) 169(11):1352–61. doi: 10.1093/aje/kwp043
32. Rothman KJ, Greenland S, Lash TL. Modern epidemiology Vol. 3. Two Commerce Square, 2001 Market Street, Philadelphia: Wolters Kluwer Health/Lippincott Williams & Wilkins Philadelphia (2008).
33. De Paoli M, Zakharia A, Werstuck GH. The role of estrogen in insulin resistance: A review of clinical and preclinical data. Am J Pathol (2021) 191(9):1490–8. doi: 10.1016/j.ajpath.2021.05.011
34. Pu D, Tan R, Yu Q, Wu J. Metabolic syndrome in menopause and associated factors: a meta-analysis. Climact: J Int Menopause Soc (2017) 20(6):583–91. doi: 10.1080/13697137.2017.1386649
Keywords: lipoprotein(a), the triglyceride glucose index, gender, Chinese adults, interaction
Citation: Wang H and Fan J-L (2023) Association between lipoprotein(a) and insulin resistance in Chinese adults: results from the China health and nutrition survey. Front. Endocrinol. 14:1234140. doi: 10.3389/fendo.2023.1234140
Received: 03 June 2023; Accepted: 26 September 2023;
Published: 09 October 2023.
Edited by:
Åke Sjöholm, Gävle Hospital, SwedenReviewed by:
Neftali Eduardo Antonio-Villa, National Institute of Cardiology Ignacio Chavez, MexicoCopyright © 2023 Wang and Fan. This is an open-access article distributed under the terms of the Creative Commons Attribution License (CC BY). The use, distribution or reproduction in other forums is permitted, provided the original author(s) and the copyright owner(s) are credited and that the original publication in this journal is cited, in accordance with accepted academic practice. No use, distribution or reproduction is permitted which does not comply with these terms.
*Correspondence: Jia-Li Fan, ZmFuamlhbGkzQDE2My5jb20=
Disclaimer: All claims expressed in this article are solely those of the authors and do not necessarily represent those of their affiliated organizations, or those of the publisher, the editors and the reviewers. Any product that may be evaluated in this article or claim that may be made by its manufacturer is not guaranteed or endorsed by the publisher.
Research integrity at Frontiers
Learn more about the work of our research integrity team to safeguard the quality of each article we publish.