
94% of researchers rate our articles as excellent or good
Learn more about the work of our research integrity team to safeguard the quality of each article we publish.
Find out more
ORIGINAL RESEARCH article
Front. Endocrinol., 28 July 2023
Sec. Diabetes: Molecular Mechanisms
Volume 14 - 2023 | https://doi.org/10.3389/fendo.2023.1219293
 Anna Casu1*†
 Yury O. Nunez Lopez1†
 Gongxin Yu1
 Christopher Clifford1
 Anika Bilal1
 Alejandra M. Petrilli1
 Heather Cornnell1
 Elvis Alvarez Carnero1
 Ananya Bhatheja1
 Karen D. Corbin1
 Anton Iliuk2David M. Maahs3
 Richard E. Pratley1*
Introduction: There are no validated clinical or laboratory biomarkers to identify and differentiate endotypes of type 1 diabetes (T1D) or the risk of progression to chronic complications. Extracellular vesicles (EVs) have been studied as biomarkers in several different disease states but have not been well studied in T1D.
Methods: As the initial step towards circulating biomarker identification in T1D, this pilot study aimed to provide an initial characterization of the proteomic and phosphoproteomic landscape of circulating EV-enriched preparations in participants with established T1D (N=10) and healthy normal volunteers (Controls) (N=7) (NCT03379792) carefully matched by age, race/ethnicity, sex, and BMI. EV-enriched preparations were obtained using EVtrap® technology. Proteins were identified and quantified by LC-MS analysis. Differential abundance and coexpression network (WGCNA), and pathway enrichment analyses were implemented.
Results: The detected proteins and phosphoproteins were enriched (75%) in exosomal proteins cataloged in the ExoCarta database. A total of 181 proteins and 8 phosphoproteins were differentially abundant in participants with T1D compared to controls, including some well-known EVproteins (i.e., CD63, RAB14, BSG, LAMP2, and EZR). Enrichment analyses of differentially abundant proteins and phosphoproteins of EV-enriched preparations identified associations with neutrophil, platelet, and immune response functions, as well as prion protein aggregation. Downregulated proteins were involved in MHC class II signaling and the regulation of monocyte differentiation. Potential key roles in T1D for C1q, plasminogen, IL6ST, CD40, HLA-DQB1, HLA-DRB1, CD74, NUCB1, and SAP, are highlighted. Remarkably, WGCNA uncovered two protein modules significantly associated with pancreas size, which may be implicated in the pathogenesis of T1D. Similarly, these modules showed significant enrichment for membrane compartments, processes associated with inflammation and the immune response, and regulation of viral processes, among others.
Discussion: This study demonstrates the potential of proteomic and phosphoproteomic signatures of EV-enriched preparations to provide insight into the pathobiology of T1D. The WGCNA analysis could be a powerful tool to discriminate signatures associated with different pathobiological components of the disease.
Type 1 diabetes (T1D) is a chronic disease characterized by hyperglycemia due to the loss of β cells and the consequent lack of endogenous insulin secretion. The loss of β-cell function and mass is due to a targeted autoimmune process directed against these cells, but the precise causes are still largely unknown. Although classically described as a disease of childhood, more than half of all incident cases of T1D now occur in adults, who tend to have a slower evolution of the disease. At present, there are no validated clinical or laboratory biomarkers able to predict the progression rate from antibody positivity to clinically manifest disease and to discriminate the different endotypes. Predictors of the rate of insulin secretion decline either before or after the clinical onset of the disease are also lacking (1–4). In addition to the loss of β-cell function, T1D also affects the exocrine pancreas. Pancreas size is 20–50% smaller in patients with T1D, and it is also smaller among individuals with multiple islet-related autoantibodies and first-degree relatives of patients with T1D (5). The mechanisms for this are not known, but these findings suggest that pancreas volume/mass could be a biomarker of T1D pathobiology (1). The recent approval of the first T1D disease-modifying therapy able to delay the onset of clinical diabetes in those at high risk highlights the need for additional novel biomarkers that could discriminate those who would most benefit from this therapy and those who would not (6) as well as provide therapeutic monitoring capacity (4).
Once established, T1D is treated with subcutaneous insulin administration to achieve blood and tissue glucose levels sufficiently close to the normal range to prevent or limit the development of micro and macrovascular chronic complications of the disease (7). However, there is a heterogeneity in the progression to chronic complications that is not completely explained by glycemic control. This is particularly true for cardiovascular disease (8) which is responsible for approximately two-thirds of deaths among adults with T1D. Additional biomarkers are therefore needed to improve the diagnostic capacity, predict progression and risk of chronic complications, and evaluate treatment efficacy.
Recent studies have highlighted the potential utility of circulating extracellular vesicles (EVs) as biomarkers in various disease states, including cancer, cardiovascular disease and diabetes (9, 10). EVs in their different forms (i.e., exosomes and microvesicles) originate from virtually all tissues, are secreted into the interstitial space, and can be found in circulation as well as in most bodily fluids. They play a key role in intercellular signaling as well as organ cross-talk. In diabetes, EVs may reflect the activation and regulation of physiologic and pathologic responses to β-cell stress or the autoimmune process. Consequently, they have been explored as biomarkers of metabolic derangement, insulin resistance, and chronic complications (11, 12). EV isolation could also increase the plasma proteome depth and could facilitate the discovery of relevant circulating plasma proteins as proposed in NOD mice (13).
Biomarker development requires a complex process that includes discovery, validation, clinical assay development and qualification as diagnostic tools (14). The discovery starts with the analysis of a small number of samples in well-phenotyped individuals, like the work described here. The use of EVs as biomarkers in T1D requires a proper understanding of the effect of different clinical components of the disease on the characteristics of circulating putative biomarkers. The EV proteome and phosphoproteome are of particular interest because of the possibility of identifying disease-specific signatures that, even if not directly pathogenetic, may be used as predictors of specific endotypes or of disease progression. However, there is a need to disentangle the modifications of circulating EV phenotype due to the metabolic derangement of the disease from those due to the pathogenic mechanisms per se. This pilot study explores the feasibility of using circulating EV-enriched preparations for this purpose in T1D.
In this cross-sectional exploratory analysis, we compared the proteome and phosphoproteome of EV-enriched preparations obtained from the serum of individuals with T1D and matched healthy controls who were deeply metabolically phenotyped. In addition, to discriminate proteomic signatures associated with either pathogenesis-specific or hyperglycemia-related clinical characteristics, we implemented an approach based on weighted gene coexpression network analysis (WGCNA) of the EV proteome and an extensive list of clinical metabolic features.
The study (NCT03379792) was conducted according to the principles of the Declaration of Helsinki and followed GCP guidelines. All procedures were approved by the AdventHealth Institutional Review Board. Informed consent was obtained from all volunteers before initiation of the study. The goal of this pilot study was to characterize EV-enriched preparations in subjects with established T1D and carefully matched healthy controls. EVs were measured in archived serum samples from 17 subjects (N=10 with T1D and N=7 healthy volunteers without diabetes) and correlated with the clinical characteristics of the participants. The groups were specifically selected to be well balanced for most clinical characteristics and based on the availability of sufficient sample volume. This selection was automated using a custom script based on the MatchIt package (15) in the R programming environment.
Anthropometric measures were performed according to standardized protocols. Blood samples were obtained in the morning after at least 10-hours of fasting. HbA1c levels were measured using a Cobas Integra 800 Analyzer (Roche, Basel, Switzerland). Body composition was measured using a GE Lunar iDEXA whole-body scanner (GE, Madison, WI). Whole body magnetic resonance imaging (MRI) was implemented using a Philips 3T Achieva MRI instrument (Philips Medical Systems MR Inc., Latham, NY). Briefly, participants were placed supine on the scanner and T1 and T2 weighted anatomical images were taken from their head through their toes. Participants were repositioned with a TorsoXL coil on their abdomen, to obtain higher resolution T1 and T2 images, and proton density fat fraction images. Images were analyzed on the Philips console and by manual and semiautomated segmentation using Analyze Pro (AnalyzeDirect Inc. Overland Park, KS, USA). Measurement of 24-hour energy expenditure and substrate oxidation rates was performed in whole room calorimeters at the AdventHealth Translational Research Institute according to standard methodology (16). Continuous glucose monitoring (CGM) (Dexcom G4, Dexcom Inc., San Diego, CA, USA) was used to monitor glucose dynamics over 10 days (17). A list of 155 clinical and EV related variables included in the study is presented in Table 1 and Supplementary Table ST1.
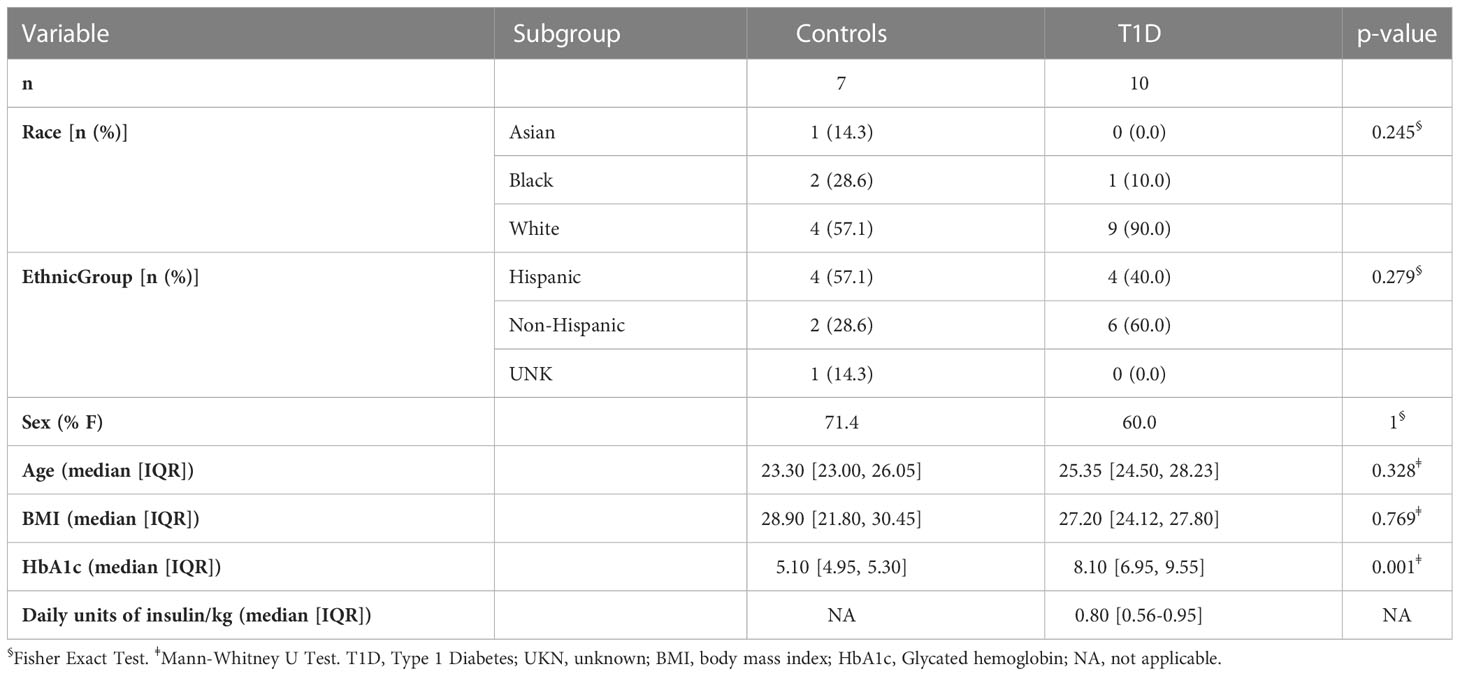
Table 1 Relevant clinical characteristics of the study cohort.
Blood samples were allowed to coagulate at room temperature for 30 minutes after collection, then centrifuged at 1500 ×g for 15 min at 4°C to produce serum. Serum was stored at -80 °C until use. Frozen serum samples were thawed, then spun at 2,500 × g for 10 minutes. The pre-cleared samples were then diluted 20-fold in EVtrap dilution buffer and incubated with EVtrap beads for 30 min (18). After supernatant removal using a magnetic separator rack, the beads were washed with PBS, and the bonded fractions were eluted by a 10 min incubation with 200 mM triethylamine (TEA, Millipore-Sigma) and the resulting EV-enriched samples fully dried in a vacuum centrifuge.
The size distribution and concentration of particles in EV-enriched preparations were analyzed using dynamic light-scattering technology with a NanoSight NS300 instrument and NTA-3.4 software (Malvern Panalytical, Malvern). The instrument was equipped with a 488 nm blue laser module, flow-cell top plate, integrated temperature control, and a single-syringe pump module. Samples were diluted using cell culture grade water (Corning cat# 25-005-CI) to produce an optimal particle concentration for final measurement in the range of 107 to 109 particles/ml. Final quantification included 5 standard measurements of 1 minute of duration each, taken at a controlled temperature of 25°C and under constant automatic flow. Camera level for video capture was set to 12 and detection threshold to 5 for all sample measurements.
The isolated and dried EV-enriched samples were processed as described previously (18). Briefly, EV-enriched samples were lysed to extract proteins using the phase-transfer surfactant (PTS) aided procedure, normalized based on protein concentration using BCA assay, and the proteins digested with Lys-C (Fujifilm Wako Chemicals, Richmond, VA, USA) at 1:100 (wt/wt) enzyme-to-protein ratio for 3 h at 37°C. Trypsin was added to a final 1:50 (wt/wt) enzyme-to-protein ratio for overnight digestion at 37°C. After surfactant removal, the resulting peptides were desalted using Top-Tip C18 tips (Glygen Corp., Columbia, MD, USA) according to manufacturer’s instructions. Each sample was split into 99% and 1% aliquots for phosphoproteomic and proteomic experiments respectively. The samples were dried completely in a vacuum centrifuge and stored at -80°C. For phosphoproteome analysis, the larger portion of each sample was subjected to phosphopeptide enrichment using the PolyMAC Phosphopeptide Enrichment kit (Tymora Analytical, West Lafayette, IN, USA) according to manufacturer’s instructions, and the eluted phosphopeptides dried completely in a vacuum centrifuge. For phosphoproteomic analysis the whole enriched sample was used, while for proteomics only 50% of the sample was loaded onto the LC-MS.
Each dried peptide or phosphopeptide sample was dissolved at 0.1 μg/μL in 0.05% trifluoroacetic acid with 3% (vol/vol) acetonitrile. 10 μL of each sample was injected into an Ultimate 3000 nano UHPLC system (Thermo Fisher Scientific, Waltham, MA). Peptides were captured on a 2-cm Acclaim PepMap trap column (Thermo Fisher Scientific) and separated on a heated 50-cm column packed with ReproSil Saphir 1.9 μm C18 beads (Dr. Maisch GmbH, Ammerbuch-Entringen, Germany). The mobile phase buffer consisted of 0.1% formic acid in ultrapure water (buffer A) with an eluting buffer of 0.1% formic acid in 80% (vol/vol) acetonitrile (buffer B) run with a linear 60-min gradient of 6–30% buffer B at flow rate of 300 nL/min. The UHPLC was coupled online with a Q-Exactive HF-X mass spectrometer (Thermo Fisher Scientific). The mass spectrometer was operated in the data-dependent mode, in which a full-scan MS (from m/z 375 to 1,500 with the resolution of 60,000) was followed by MS/MS of the 15 most intense ions (30,000 resolution; normalized collision energy - 28%; automatic gain control target (AGC) - 2E4, maximum injection time - 200 ms; 60sec exclusion).
The raw files were searched directly against the human Uniprot database with no redundant entries, using Byonic (Protein Metrics, Cupertino, CA) and Sequest search engines loaded into Proteome Discoverer 2.3 software (Thermo Fisher Scientific). MS1 precursor mass tolerance was set at 10 ppm, and MS2 tolerance was set at 20ppm. Search criteria included a static carbamidomethylation of cysteines (+57.0214 Da), and variable modifications of oxidation (+15.9949 Da) on methionine residues, acetylation (+42.011 Da) at N terminus of proteins, and phosphorylation of S, T and Y residues (+79.996 Da) for the phosphoproteomics data. Search was performed with full trypsin/P digestion and allowed a maximum of two missed cleavages on the peptides analyzed from the sequence database. The false-discovery rates of proteins and peptides were set at 0.01. All protein and peptide identifications were grouped and any redundant entries were removed. Only unique peptides and unique master proteins were reported.
All data were quantified using the label-free quantitation node of Precursor Ions Quantifier through the Proteome Discoverer v2.3 (Thermo Fisher Scientific). For the quantification of proteomic or phosphoproteomic data, the intensities of peptides/phosphopeptides were extracted with initial precursor mass tolerance set at 10 ppm, minimum number of isotope peaks as 2, maximum ΔRT of isotope pattern multiplets – 0.2 min, PSM confidence FDR of 0.01, with hypothesis test of ANOVA, maximum RT shift of 5 min, pairwise ratio-based ratio calculation, and 100 as the maximum allowed fold change. The abundance levels of all peptides and proteins were normalized using the total peptide amount normalization node in the Proteome Discoverer. For calculations of fold-change between the groups of proteins, total protein abundance values were added together and the ratios of these sums were used to compare proteins within different samples.
The proteomic and phosphoproteomic expression profiles of EV-enriched preparations were analyzed with a user-defined bioinformatic procedure that included raw data preprocessing, differential abundance analysis, weighted-gene correlation network analysis (WGCNA) (19), and enriched functional analyses. A Pearson correlation matrix of the proteins is used to form a hierarchical dendrogram that is then cut into branches corresponding to modules. Each module includes genes with similar expression pattern and most likely specific biological functions. The module eigengenes are also correlated with clinical traits and EV characteristics, generating a denser mechanistic overview of co-regulated proteins associated with the underlying T1D biology.
Briefly, missing values in the expression profiles were imputed, and the data were then log2-transformed, and scale-standardized. The imputation was performed with randomforest, an advanced machine-learning algorithm (20, 21). The normalized data were then analyzed using pvca (22) and limma (23), two R/Bioconductor software packages for biomarker discovery. Specifically, pvca, a package for principal variance component analysis, was first applied to identify significant covariates by fitting all “sources” as random effects, then linear models were created incorporating sex as covariate. Once established, the linear models were fitted using weighted least squares for each protein, moderated t-statistics, moderated F-statistics, log-fold changes and p-values of differential expression were calculated by empirical Bayes moderation of the standard errors.
The network module analysis was performed with WGCNA, an R package for weighted gene correlation network analysis (19). In short, it first performs a weighted protein co-expression network analysis to find clusters of highly correlated proteins (modules), and then relates modules to the clinical measurements and also with EV characteristics. Subsequent module membership, protein-trait significance and intra-module connectivity analysis was applied to identify the key driver proteins in modules of interest. KEGG pathway and Gene Ontology enrichment analyses were performed on the sets of differentially abundant proteins and phosphoproteins with clusterProfiler, an R package for enriched function analysis (24). Given a set of highly significant proteins identified, clusterProfiler suggests KEGG pathways and Gene Ontology (GO) functional groups significantly affected.
Differences in baseline clinical characteristics were assessed using the Mann–Whitney U test (for continuous variables) or the Fisher exact test (for categorical variables). For assessment of differential abundance of proteins and phosphoproteins of EV-enriched fractions, linear models using the limma package were implemented. Phosphoproteins that were also identified at the protein level, were subjected to differential abundance analysis of the phosphoprotein to protein ratios. Linear models included sex as covariate. Given the exploratory nature of our analysis, calculated effects and correlations with two-tailed P ≤ 0.01 and FDR<0.1 were considered significant. False discovery rates (FDR) correcting for multiple testing were calculated using the Benjamini-Hochberg correction as implemented for the p.adjust function in the stats package.
Being exploratory in nature, the study was not a priori powered to a specific objective. However, a posteriori, we calculated the statistical power to detect significantly differentially abundant proteins and phosphoproteins. For this, we determined the minimal, mean, and maximal standardize effect size that reached statistical significance with P<0.05 and FDR<0.1 (nominal P=0.0085 for proteomics and nominal P = 0.0009 for phosphoproteomics) and calculated the respective powers for linear models including a main effect variable (disease group) with 2 levels (NGT and T1D) and a cofactor variable (sex) also with 2 levels (Female and Male), using the pwr R package and the function pwr.f2.test. The nominal P values were defined a posteriori of the differential abundance analyses for proteins and phosphoproteins and represent the largest P values among the significantly (P<0.01 and FDR<0.1) differentially abundant features.
The average age of the participants was 25.7 years (range 20.1-34.5), 11/17 were female, and the average BMI was 26.8 kg/m2 (range 19.5-38.6) for the whole population. The subset was not confounded by differences in variables known to affect metabolic function (e.g., age, BMI) as shown in Table 1. The comparison of all 155 demographic, anthropometric, metabolic, clinical, and EV-related characteristics for the study cohort are presented in Supplementary Table ST1. None of the participants with T1D had a history of chronic complications at the time of enrollment. Compared to healthy participants, participants with T1D had higher plasma glucose, HbA1c, time above 180 mg/dl and glucose variability obtained with CGM, larger kidneys and spleen when the volume was adjusted for weight, BMI or fat free mass compared to controls. In addition, participants with T1D had lower percentage of time between 69 and 54 mg/dl and time in range 70-180 mg/dl on CGM, calculated insulin sensitivity index according to the CACTI study, and smaller pancreas size compared to healthy participants, as expected.
Circulating particles with a distribution of sizes compatible with small EVs/exosomes (Figure 1A) were isolated. The corresponding average and modal particle size was comparable between the groups (mean size 201.95 nm and modal size 143.8 nm in T1D and mean size 212.1 nm and modal size 145 nm in controls, p > 0.05, Supplementary Table ST1). Similarly, the total particle concentration did not differ between the two groups (0.82x10¹¹ particles/ml in T1D and 1.25x10¹¹ particles/mL in controls, p = 0.2, Supplementary Table ST1, Figure 1A). LC-MS/MS of EV-enriched preparations identified 1950 proteins, which included 1467 (75.2%) proteins reported in ExoCarta [a database which reports proteins, RNA, and lipids detected in exosomal preparations (25)], and more specifically, 91 of the top 100 proteins reported in this database (Figure 1B). Similarly, LC-MS/MS identified 561 phosphoproteins in circulating EV-enriched preparations, which included 421 (75%) of ExoCarta proteins (Figure 1B). These results support the conclusion that the isolated proteome and phosphoproteome are enriched for small EVs (exosomes).
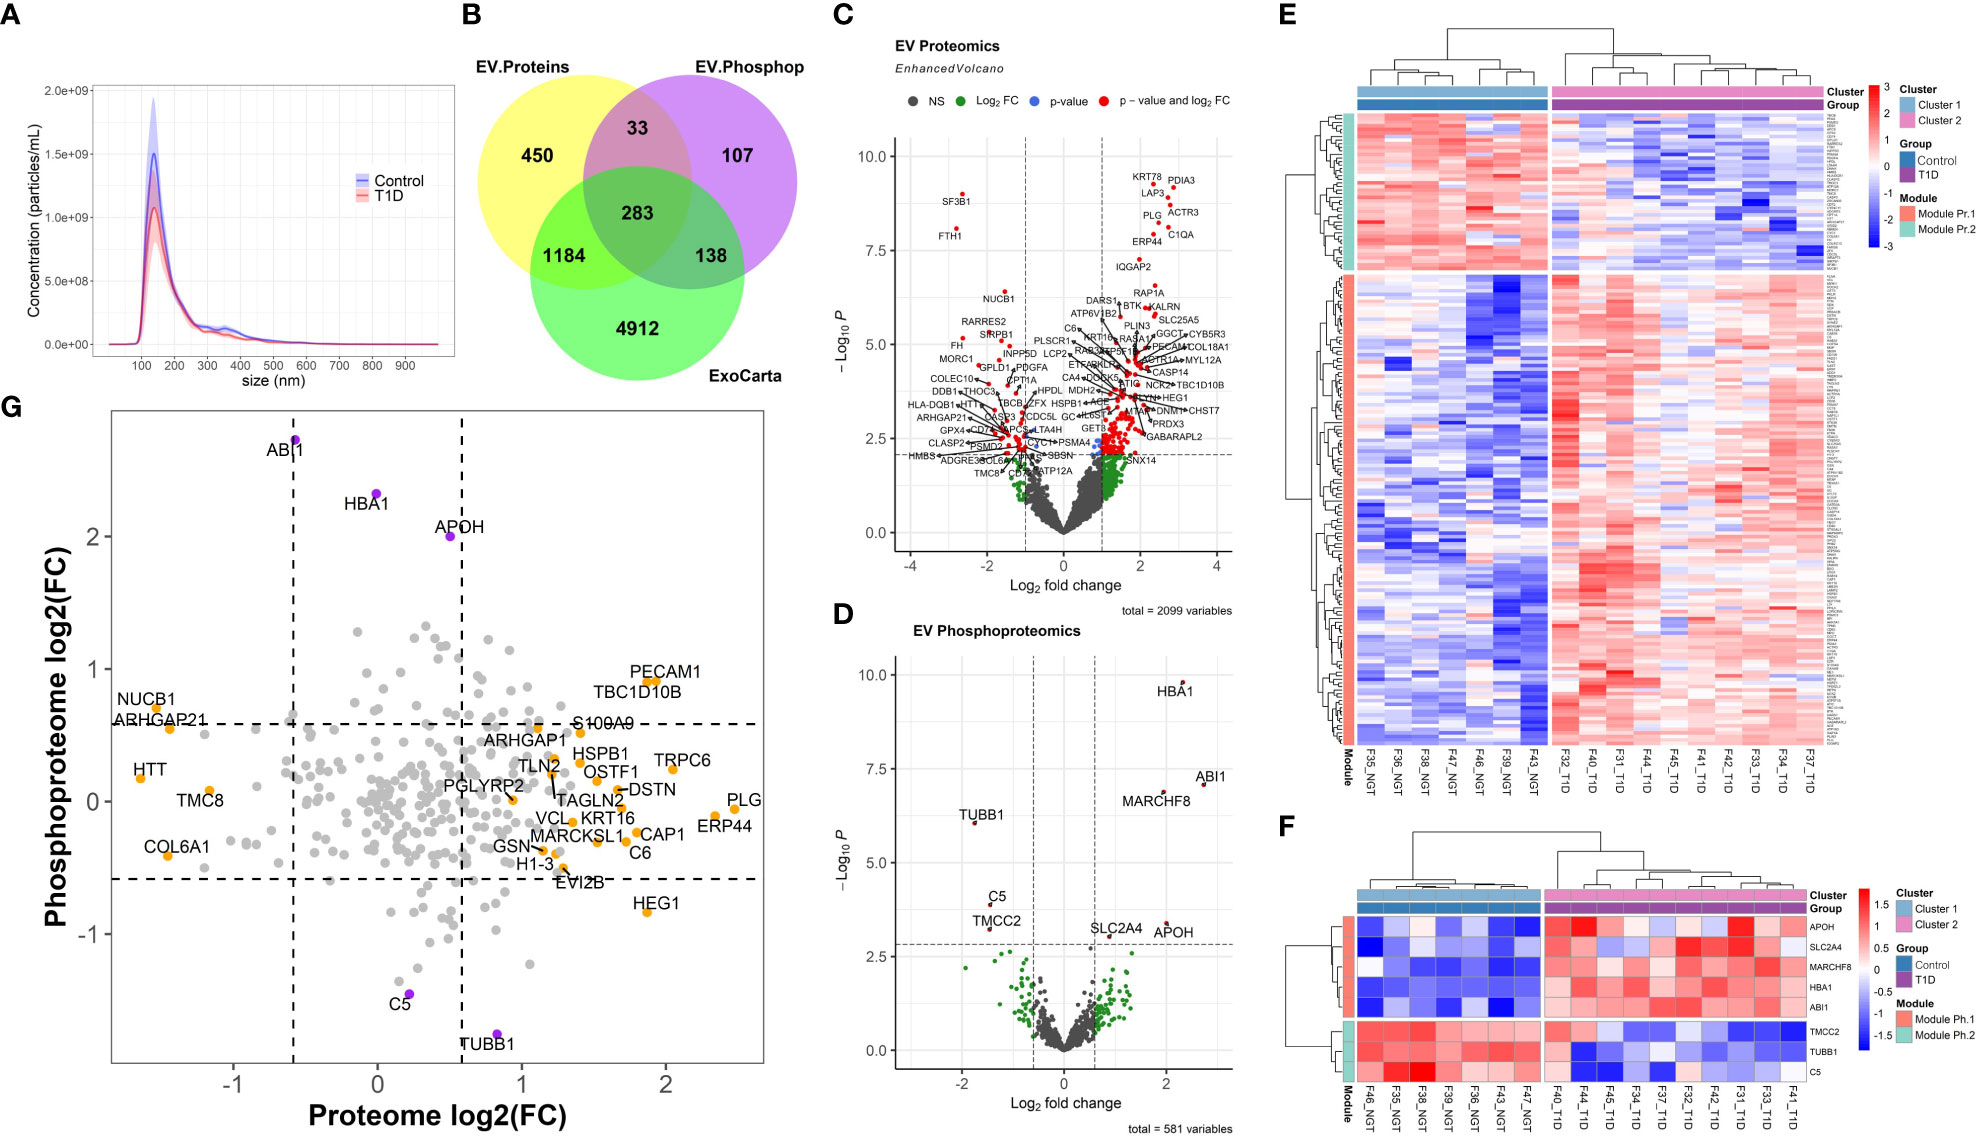
Figure 1 Extracellular Vesicle Characterization. (A) Nanoparticle Tracking Analysis (NTA) of extracellular vesicles (EVs) isolated from participants with type 1 diabetes (T1D) and Healthy normal volunteers (Controls). (B) Overlap between the exosomal proteins reported in Exocarta and all the EV proteins and phosphoproteins identified in the present work. (C, D) Volcano plots of the EV proteome and phosphoproteome. (E, F) Unsupervised clustering of the differentially abundant proteome and phosphoproteome, respectively. (G) Correlation plot of EV proteome versus phosphoproteome (grey circles: non-significant change, orange circles: differentially abundant only in proteomic analysis, purple circles: differentially abundant only in phosphoproteomic analysis; dark red circle: differentially abundant in both proteomic and phosphoproteomic analyses).
To characterize the circulating EV-enriched cargos in our study population, we conducted additional bioinformatic analyses including differential abundance analysis and unsupervised clustering analysis.
A total of 181 differentially abundant EV proteins were identified with p-value < 0.05 and FDR<0.1 between people with T1D and controls without diabetes. The range of absolute fold changes at this significance level was 1.64 to 7.29. Of these differentially abundant proteins, 135 were upregulated and 46 were downregulated in T1D, as compared to controls (Table 2 and Supplementary Table (ST)2, Figures 1C, E). Eight EV-enriched phosphoproteins were different between the groups at the same level of significance (p-value ≤ 0.01 and FDR<0.1). The range of absolute fold changes was 1.84 to 6.63. Five of the differentially abundant phosphoproteins were upregulated and 3 were downregulated (Table 3, Figures 1D, F, phosphopeptides are reported in ST3). Notably, of the top 100 exosomal proteins reported by ExoCarta (25), 8 (CD63, RAB14, VCP, BSG (a.k.a. CD147), FLNA, GNAI2, LAMP2, EZR) were significantly upregulated at the protein level in the T1D group. These 8 top EV proteins correlated with clinical measures of glycemic control, insulin sensitivity, and four of them (i.e., RAB14, BSG, LAMP2, and EZR), also correlated with pancreas size (Figure 2). Pancreatic β-cell specific proteins were not among the differentially abundant proteins and phosphoproteins obtained from serum EV-enriched preparations probably because of the low abundance in circulation.
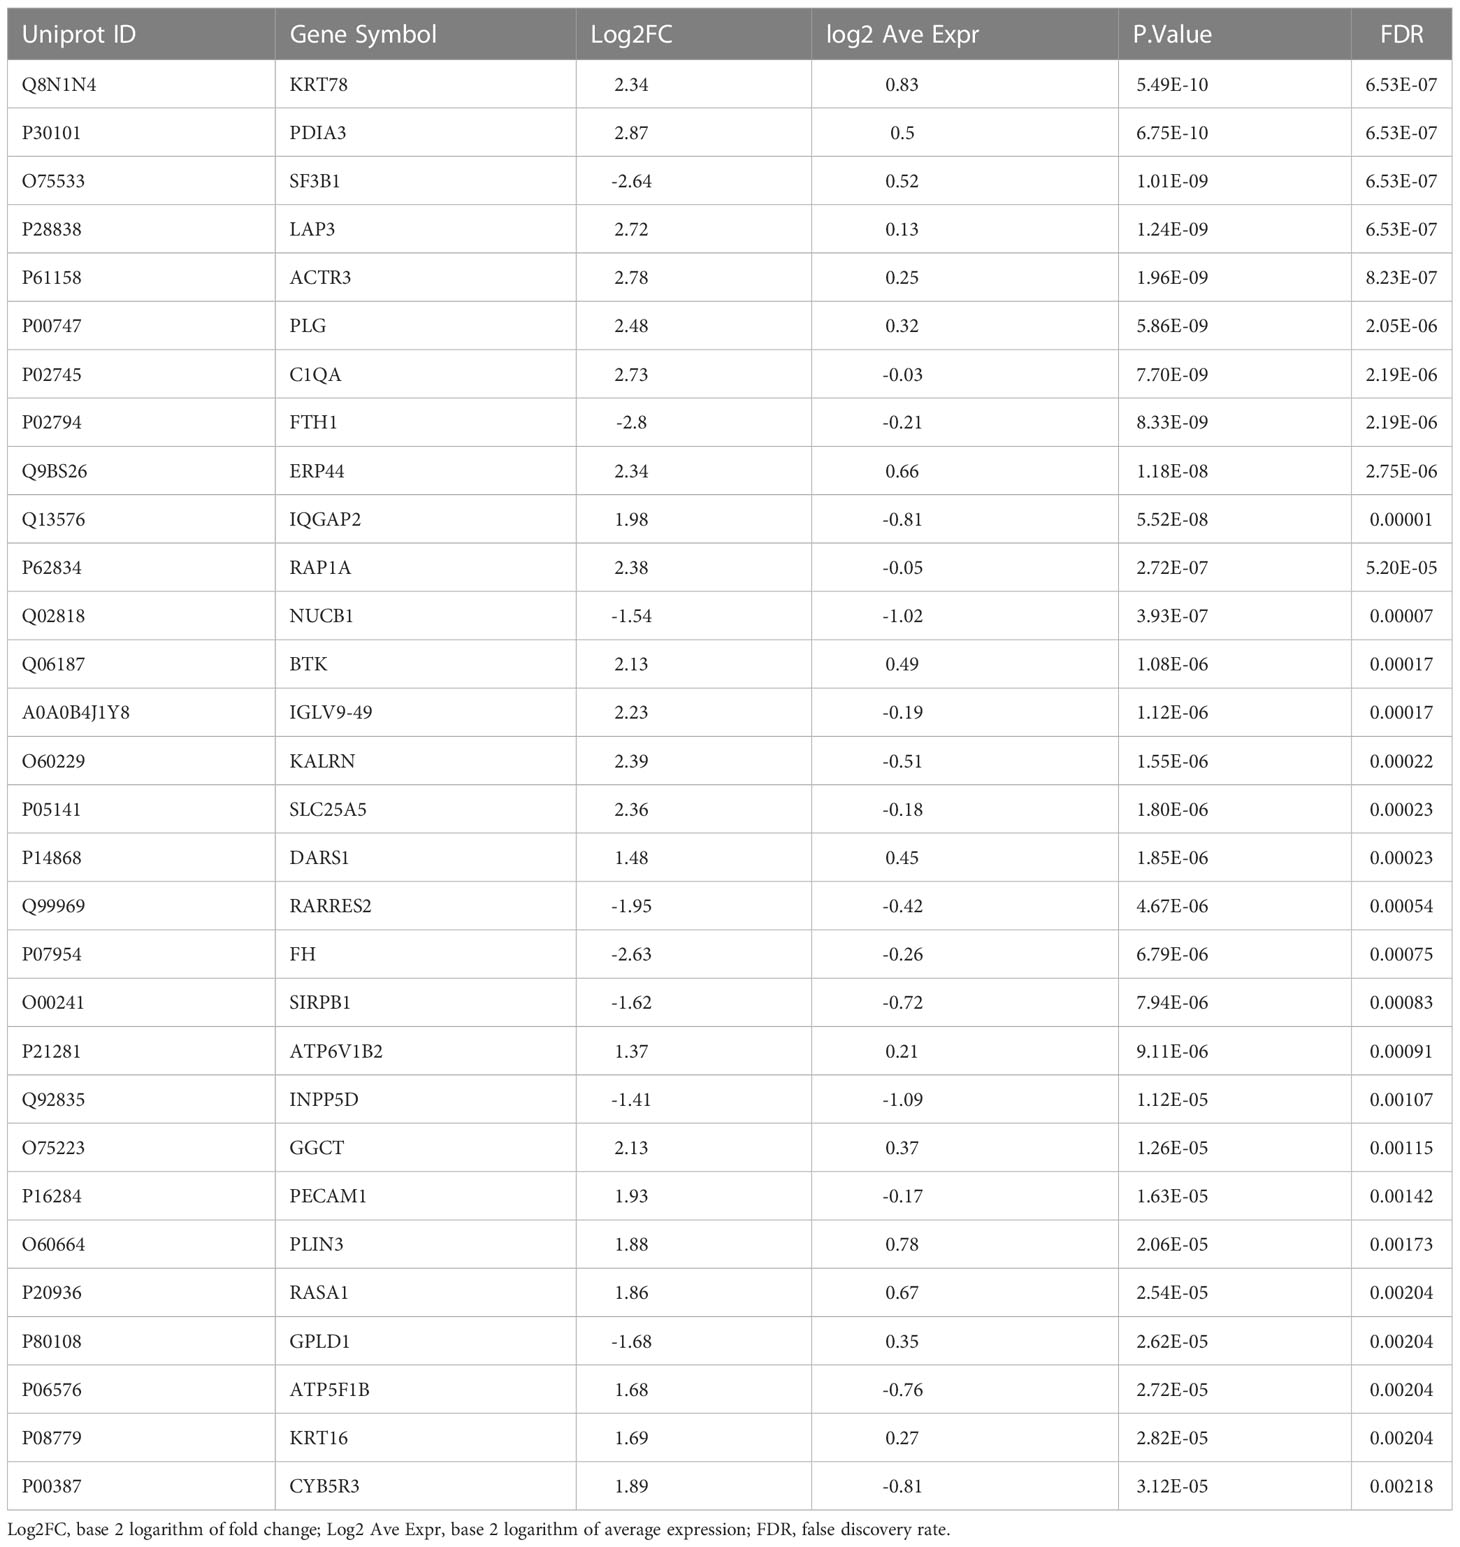
Table 2 Top 30 differentially abundant proteins in circulating EV-enriched preparations (T1D versus Controls).
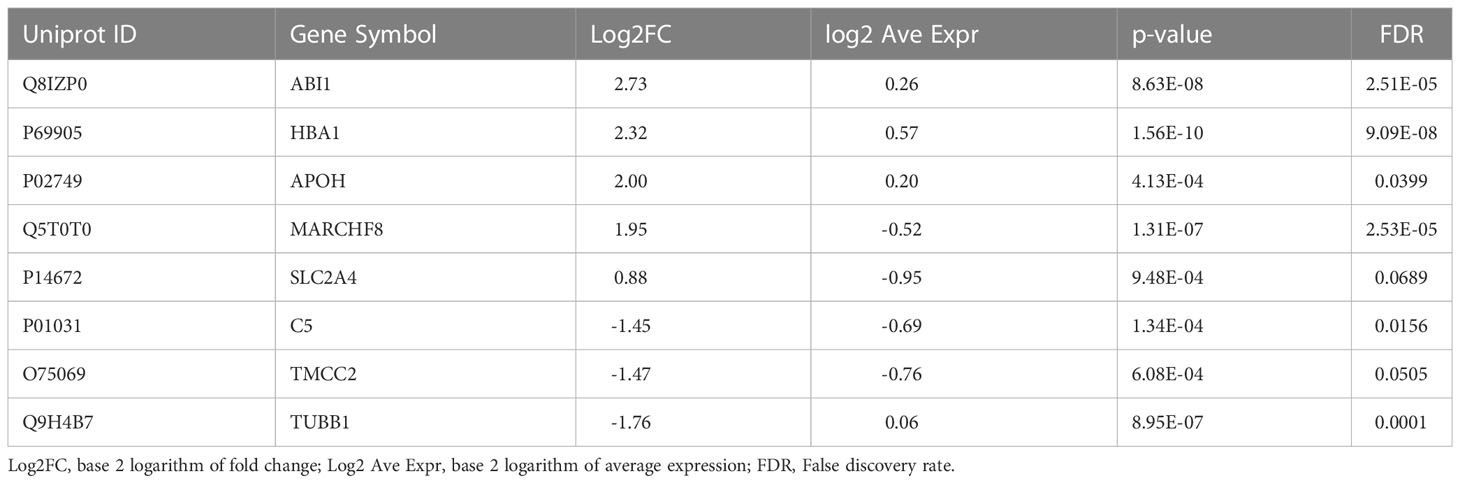
Table 3 Differentially abundant phosphoproteins in circulating EV-enriched preparations (T1D versus Controls).
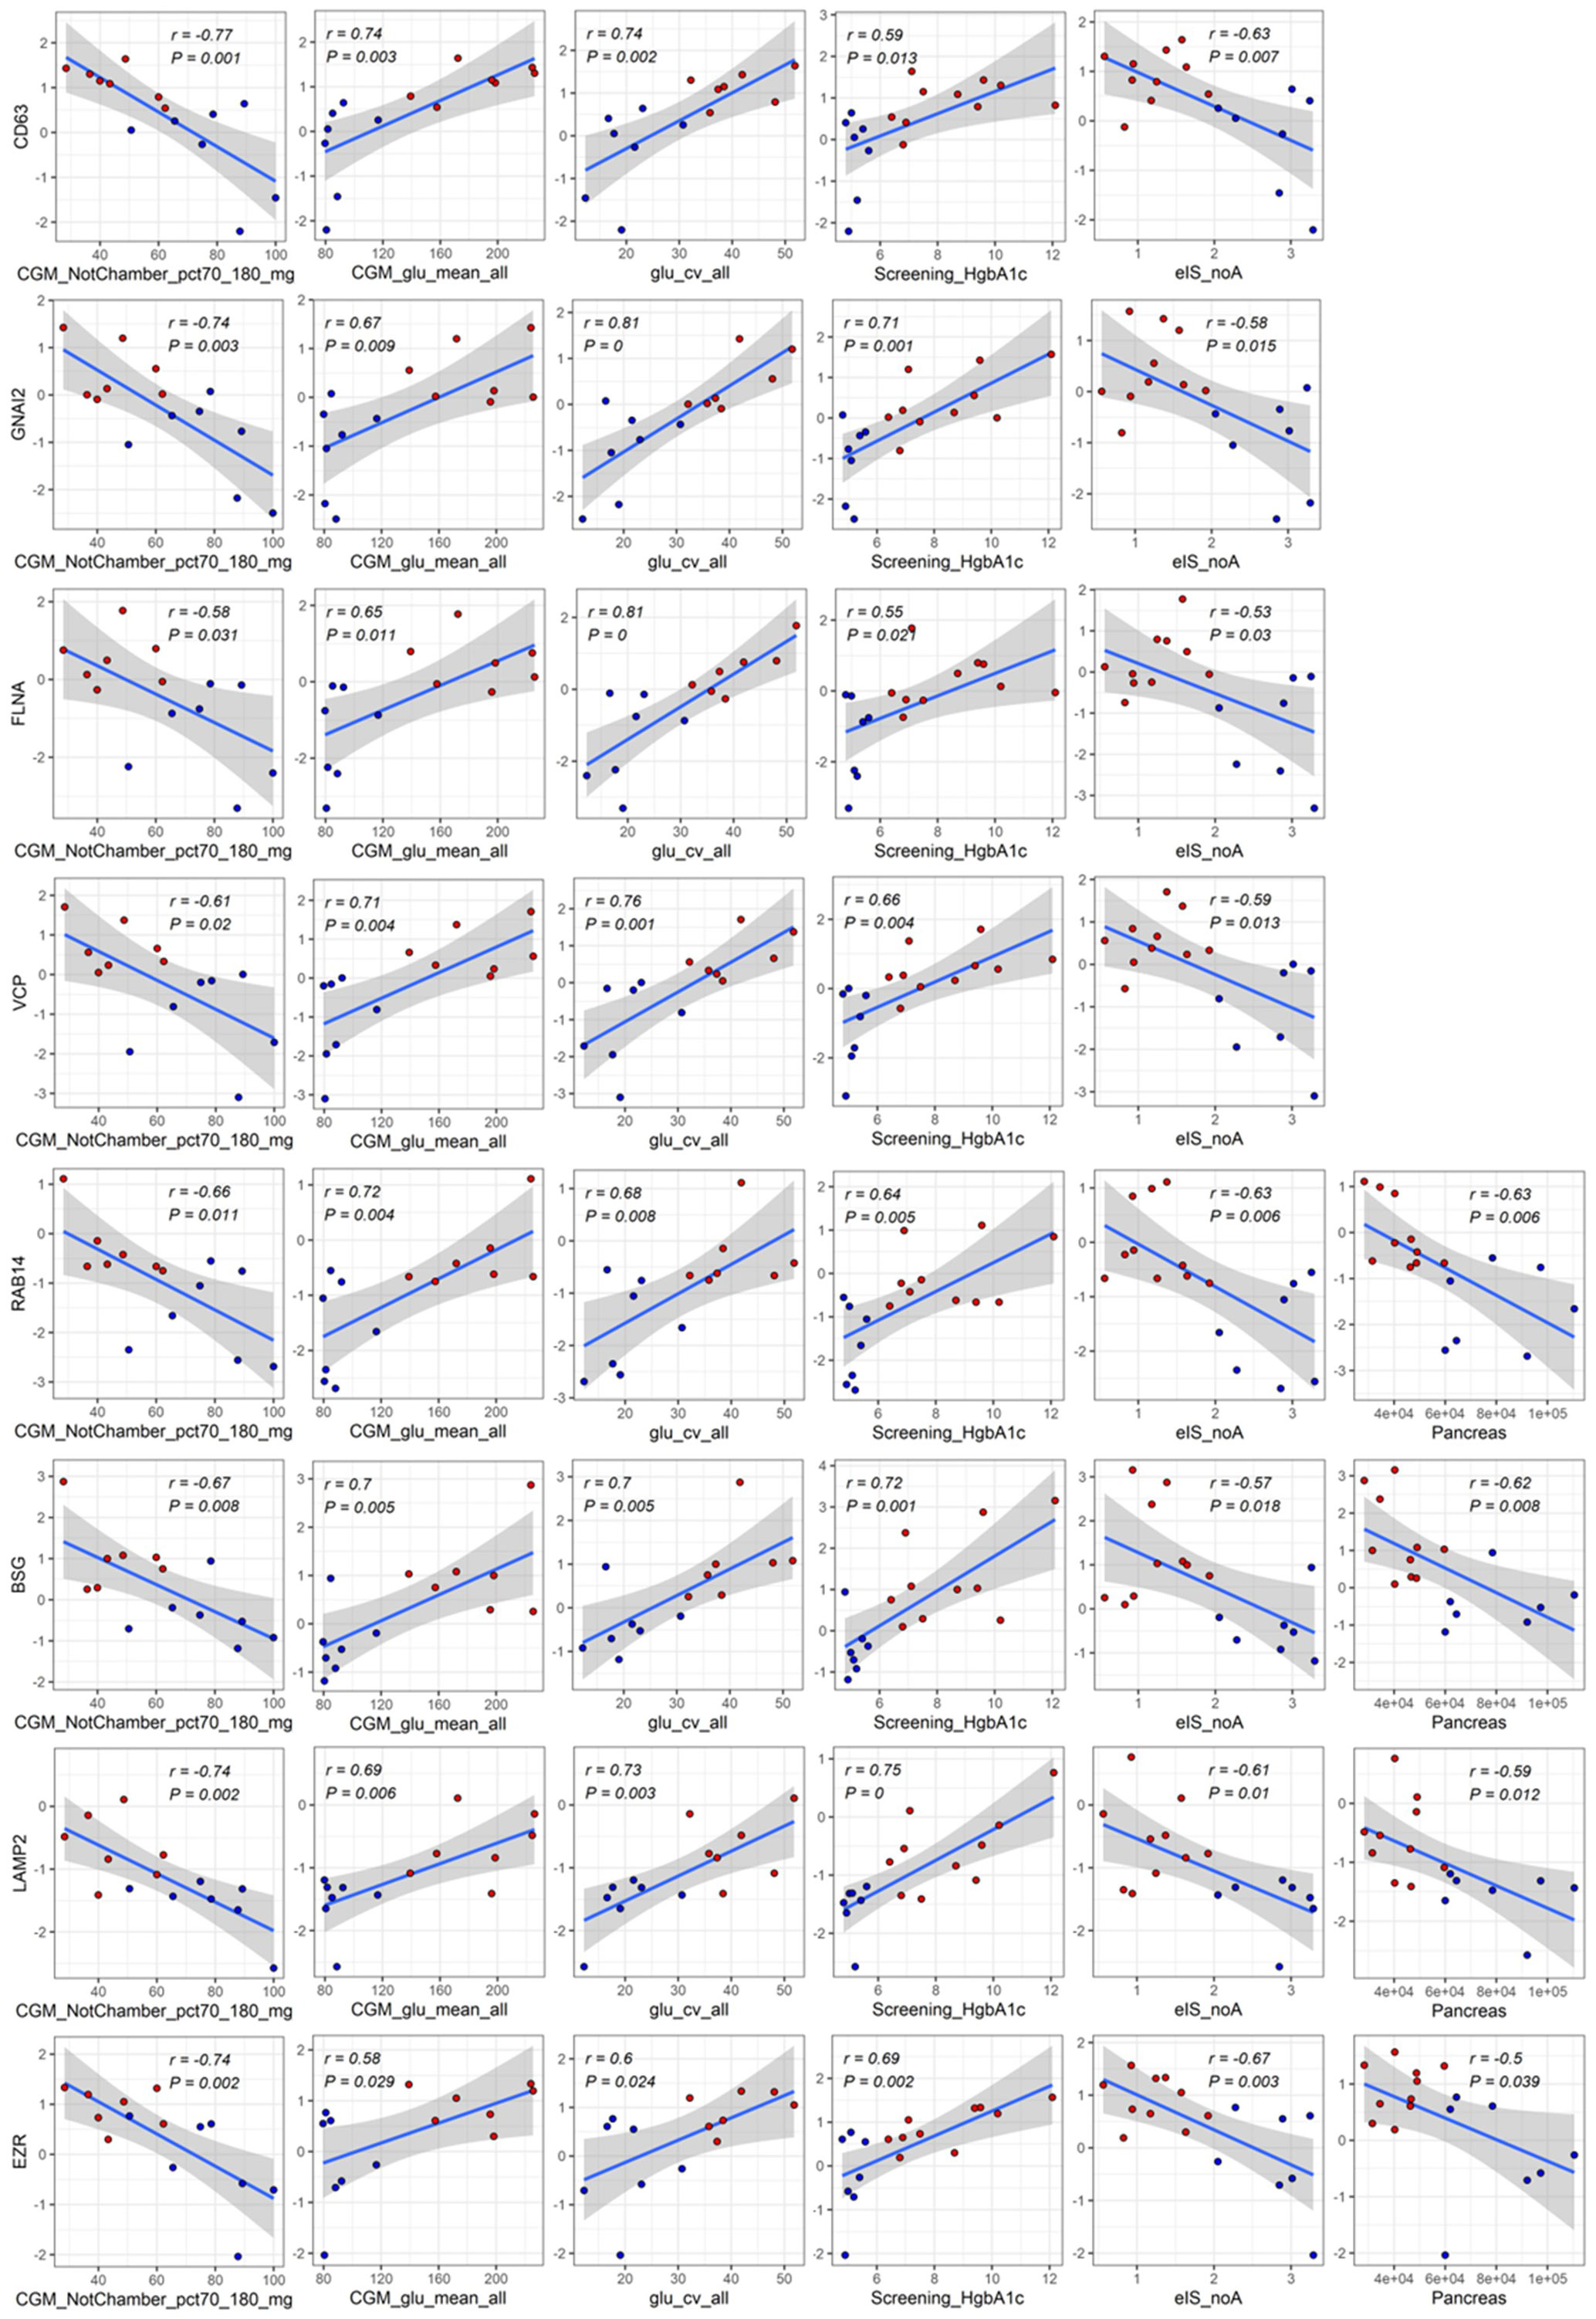
Figure 2 Significant correlations among differentially abundant top proteins in EV-enriched preparations and measures of glucose control, insulin, sensitivity, and pancreas size. Red: participants with type 1 diabetes (T1D). Blue: participants without diabetes (Controls). Abbreviations: CGM_NotChamber_pct70_180_mg: percentage of CGM reading between 70 and 180 mg/dl before admission to the metabolic chamber; CGM_glu_mean_all: average glucose obtained from CGM before and while in the metabolic chamber; glu_cv_all: coefficient of variation of all glucose measurements obtained with CGM; Screening_HgbA1c: glycated hemoglobin at screening visit; eIS_noA: estimated insulin sensitivity with a score not including adiponectin; Pancreas: pancreas size.
Our aim with this pilot study was to measure the degree of variability in circulating EV-enriched protein abundance and to assess our ability to identify associations to clinical characteristics and potentially expression of causative mechanisms (for example immune activation). The study was not a priori sized for a specific statistical power level. As shown in Table 4, the a posteriori power calculation demonstrated that we detected proteins with a mean standardize effect size (f2 = 1.507) with over 96% power, while proteins with a minimal significant differential abundance (minimal significant standardized effect size f2 = 0.712) were detected with approximately 67% power. Similarly, phosphoproteins with a mean standardize effect size (f2 = 1.721) were confidently detected with over 86% power, while phosphoproteins with a minimal significant differential abundance (minimal significant standardized effect size f2 = 0.88) were detected with approximately 45% power. These results will allow to estimate effective sample sizes for future validation studies using independent cohorts.
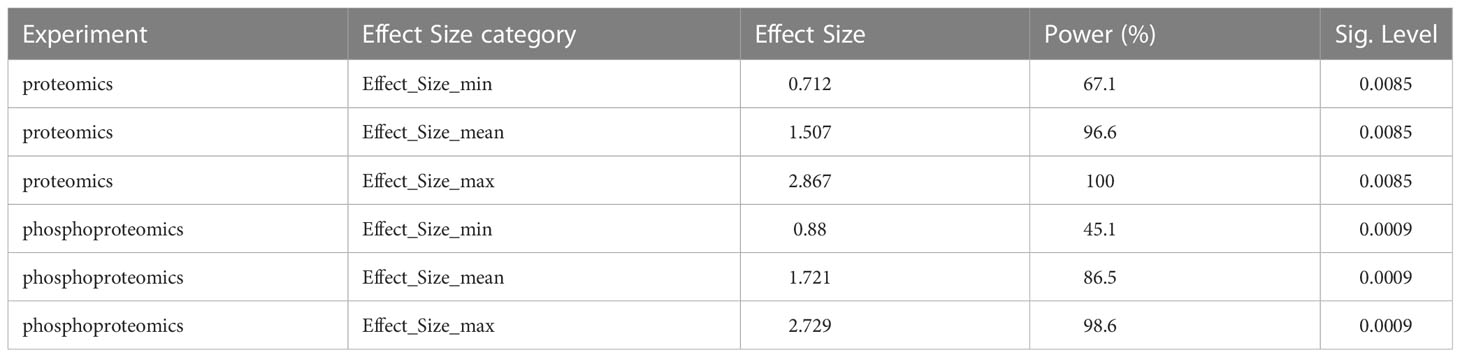
Table 4 Power calculation for 3 reference levels of significant differential abundance in proteins and phosphoproteins in circulating EV-enriched preparations (T1D versus Controls) (n=17).
Since protein phosphorylation could provide information on cellular pathway regulation as described in cancer, we further dissected the changes in EV protein phosphorylation and assessed the relationship (correlation and comparison of phosphoprotein/protein ratios) between phosphoprotein and respective total protein levels, for those phosphoproteins that were also detected in the proteomic profiling experiment (a total of 288 phosphoproteins). As shown in Figure 1G, there was no significant correlation between the detected EV protein and EV phosphoprotein levels (r=-0.02, p=0.68). The differentially abundant features significantly changed in either the proteomic or the phosphoproteomic state, but not in both. In contrast, the comparison of phosphoprotein/protein ratios among the study groups identified nucleobindin-1 (NUCB1) with a highly significantly reduced ratio (logFC = -5.22, p = 2.84E-06, FDR = 0.00079).
As pathway analysis techniques can help in interpreting proteomics results, we applied various enrichment analysis tools to obtain functional information on the differentially abundant proteins. The Gene Ontology (GO) cellular compartment enrichment analysis confirmed that the differentially abundant proteins primarily belong to pathways associated with vesicles and granules: secretory granule lumen, cytoplasmic vesicle lumen, vesicle lumen, membrane raft, membrane microdomain, membrane region indirectly confirming the vesicular origin of the proteins (Figure 3A). GO biological process enrichment analysis on the differentially abundant proteins showed that the differentially upregulated proteins are involved in neutrophil degranulation and their activation in immune response, platelet degranulation, blood coagulation, and hemostasis, among others (Figure 3B, Module Pr.1). Downregulated EV proteins were enriched in proteins involved in the regulation of monocyte differentiation (Figure 3B, Module Pr.2). The Kyoto Encyclopedia of Genes and Genomes (KEGG) pathway analysis also identified platelet activation as one of the most represented pathways together with leukocyte transendothelial migration, and prion-related pathology among others (Figure 3C). Interestingly, KEGG pathway analysis of the differentially abundant phosphoproteins also identified a significant enrichment for prion-related pathology (Figure 3D).
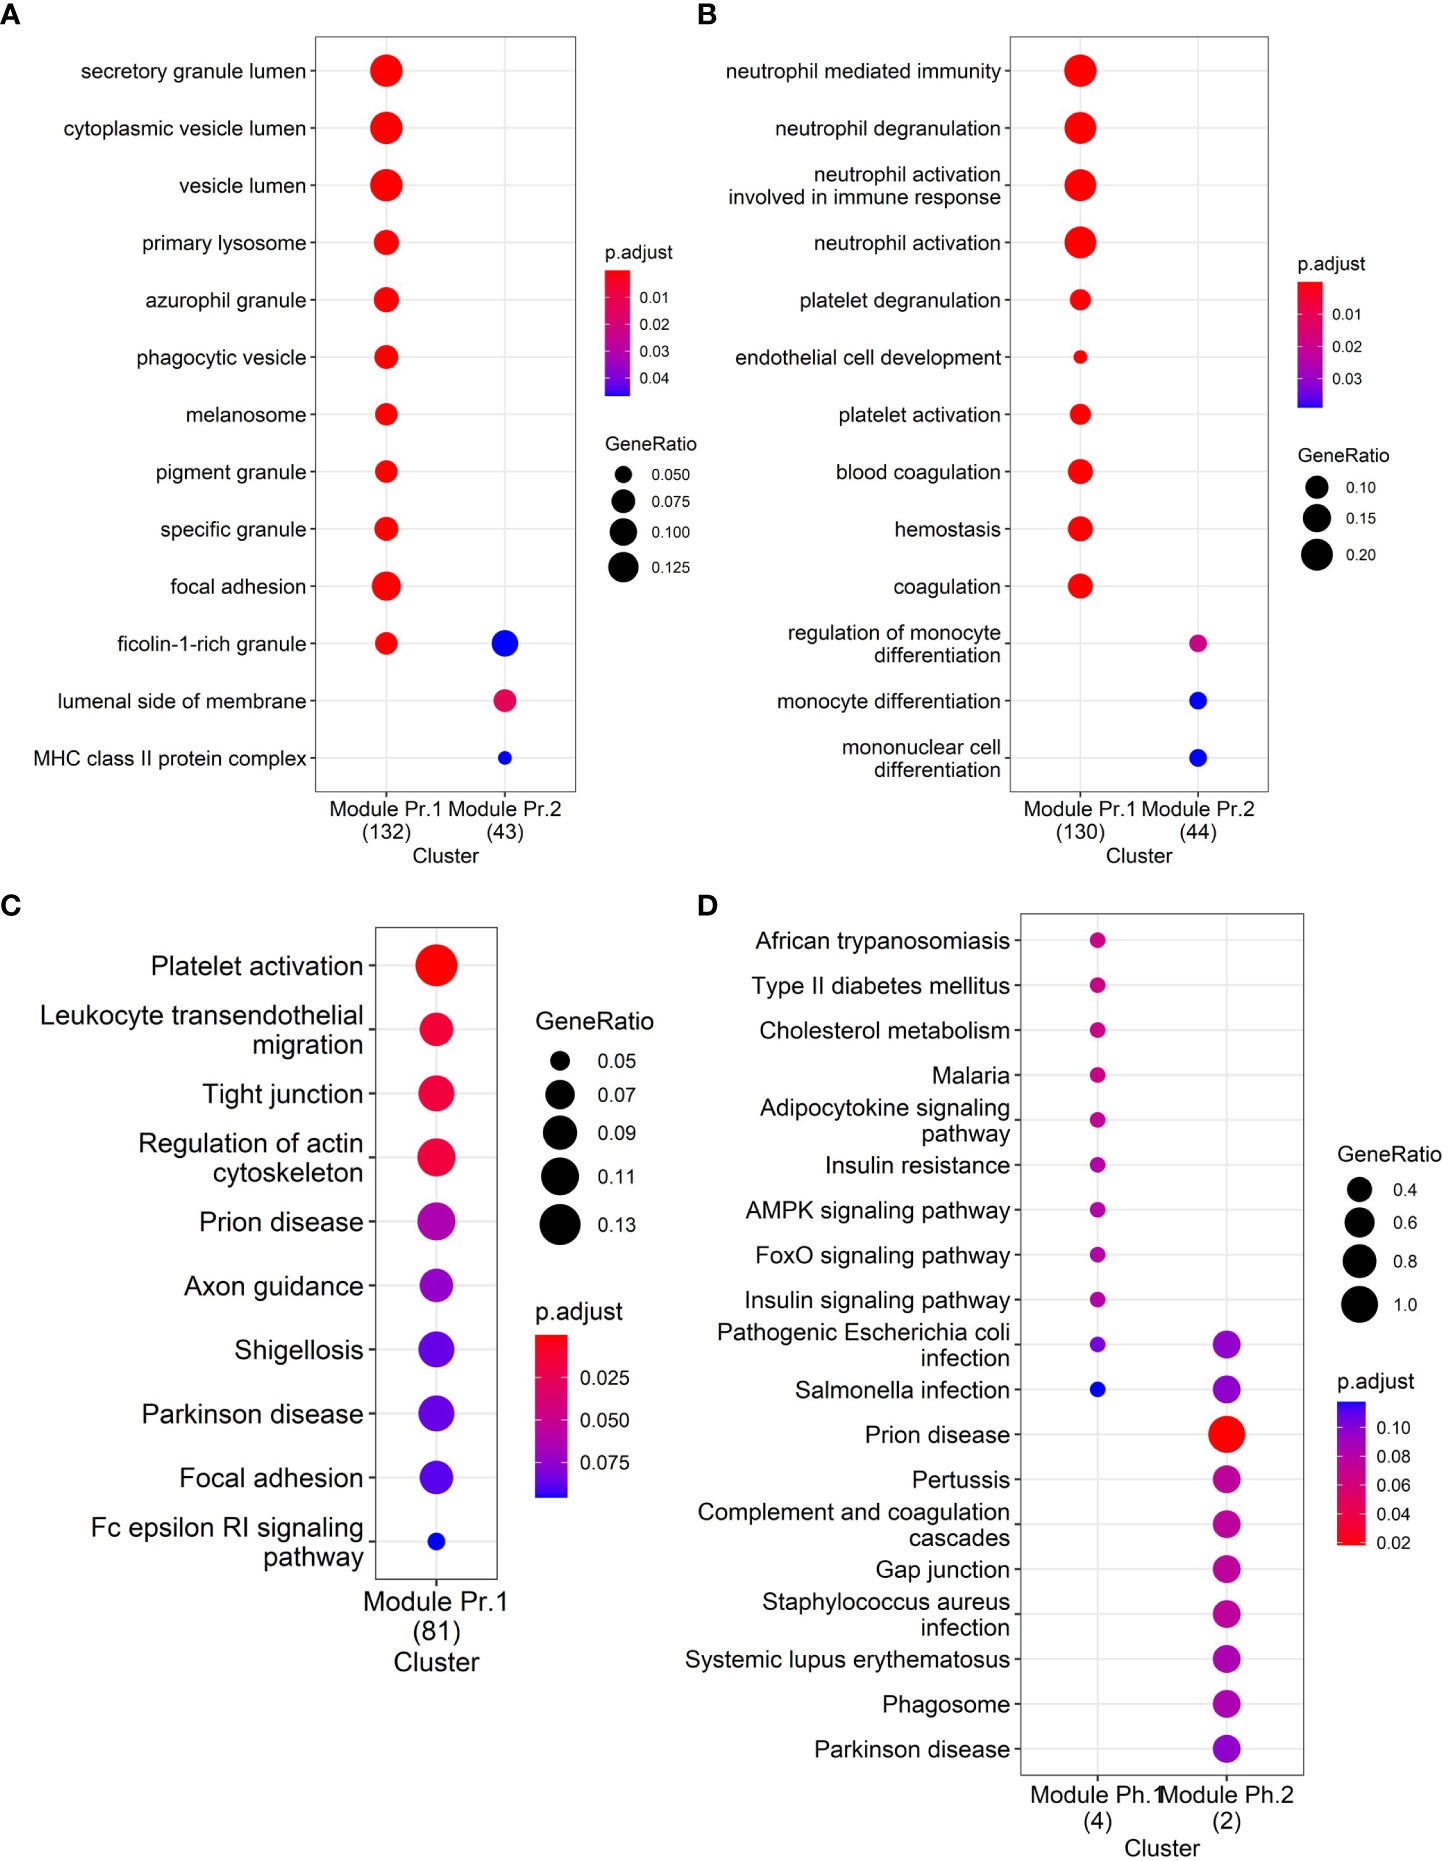
Figure 3 Functional enrichment analyses: (A) GO Cellular Compartment enrichment in differentially abundant proteins, (B) GO Biological Process enrichment in differentially abundant proteins, (C) KEGG pathway enrichment in differentially abundant proteins, and (D) KEGG pathway enrichment in differentially abundant phosphoproteins.
To further improve our understanding of the role of circulating EVs in T1D at the system level, we applied the weighted gene co-expression network analysis (WGCNA) methodology for the analysis of all proteins identified in circulating EV-enriched preparations. This method focuses on the identification of modules that include features (i.e., EV-enriched proteins in our case) with correlated expression patterns as opposed to the identification of individual proteins based on group average comparisons (as is the case of differential abundance analysis), therefore alleviating the multiple statistical testing problem. The WGCNA methodology has been previously used for proteomic analysis (26, 27).
Figure 4A presents the co-expression dendrograms for all proteins of EV-enriched preparations and how they were grouped in 14 color-coded modules. Figure 4B presents the number of proteins included in each module. Individual proteins of each module can be found in ST 4. The analysis identified significant associations of specific protein modules with 9 of the 155 clinical characteristics evaluated in this study. Primarily, the associations were with mean glucose from CGM, percentage of time with glucose >180 mg/dl, HbA1c, blood glucose level estimated from HbA1c, as indicators of glycemic levels, but other interesting traits were identified including an index of insulin sensitivity (eIS-nf), pancreas size and basal metabolic rate. The strongest correlations were seen with clinical traits associated with blood glucose levels (metrics obtained from the CGM, HbA1c) but also with other clinical characteristics indicative of T1D (pancreas size) (Figure 4C).
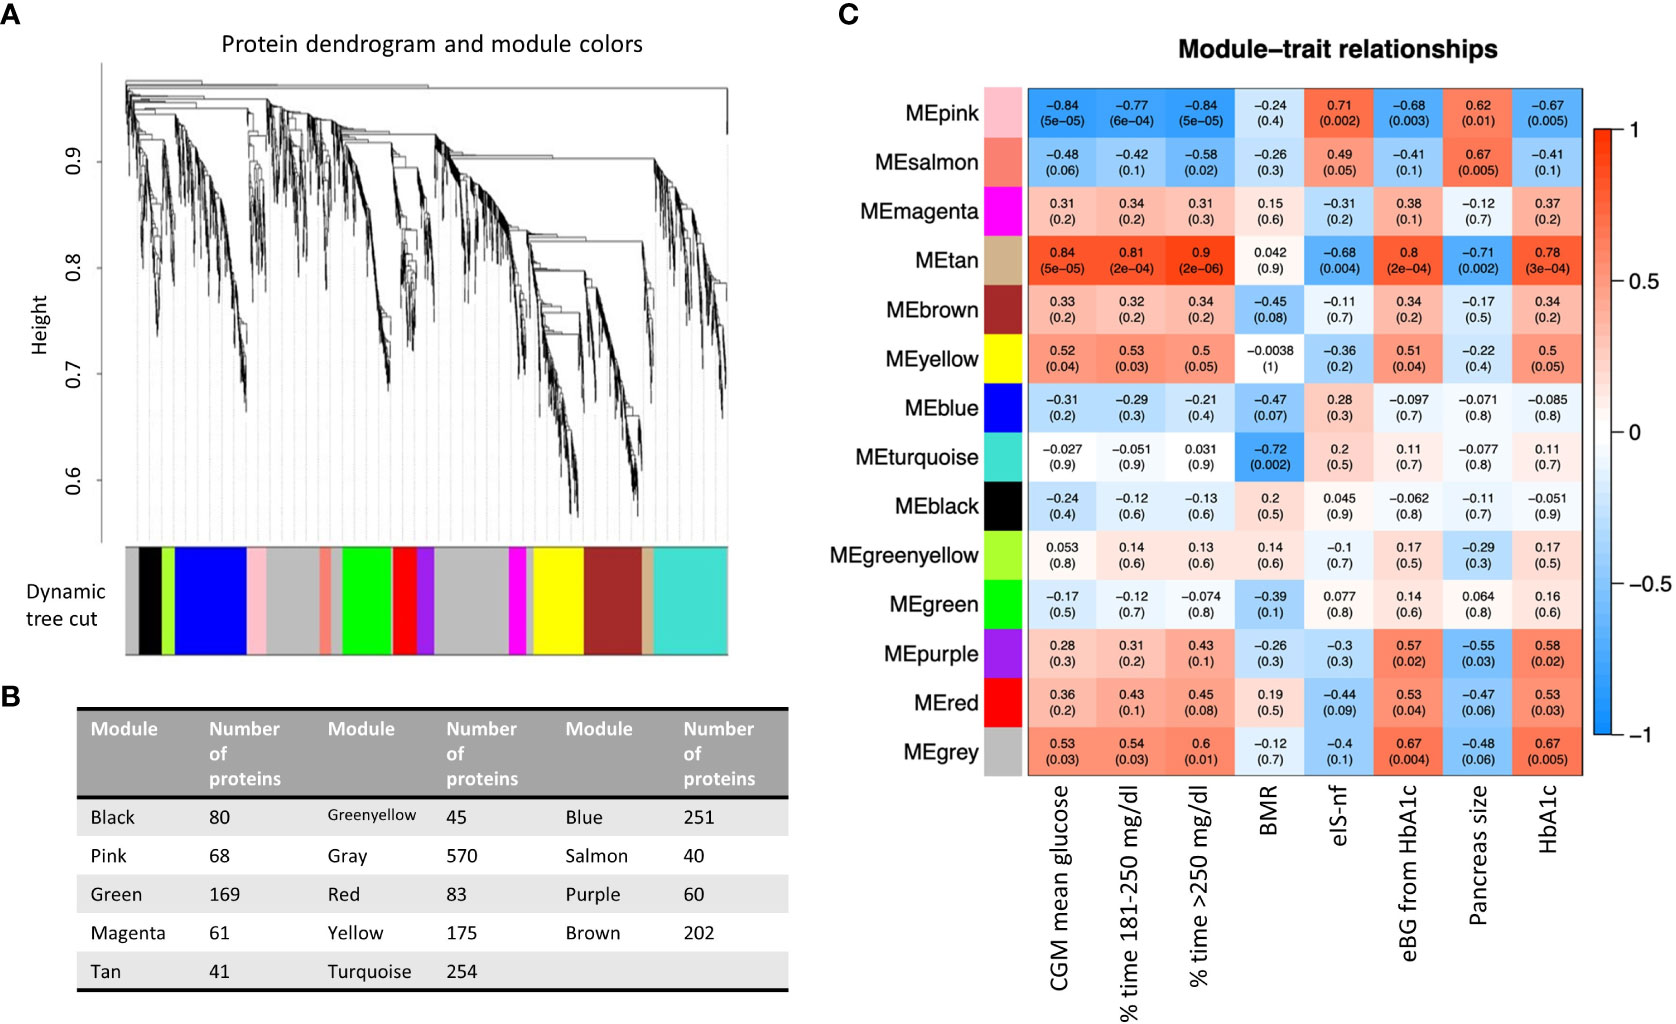
Figure 4 (A) Protein dendrogram and module colors. (B) Module size. (C) Relationships among modules and clinical traits (14 modules 155 clinical traits). Row corresponds to a consensus module. Columns correspond to a trait. Numbers in the table report the correlations of the corresponding module eigengenes and traits, with the p-value below in parenthesis. BMR, basal metabolic rate; eIS-nf, estimated insulin sensitivity with a score including variables not requiring a fasting state; eBG, estimated blood glucose; HbA1c, glycated hemoglobin.
Three co-expression modules (i.e., Pink, Tan, and Yellow modules) were significantly associated with elevated blood glucose levels, expressed as either percentage of CGM values above 250 mg/dl or between 180 and 250 mg/dl, average glucose level during CGM or HbA1 (Figure 4C). The list of the 41 proteins selected by connectivity and gene significance of the Tan module is presented in ST5. Supplementary Figure (SF)2 shows the Gene Ontology Biological Processes (GO BP) analysis (panel A) and the heatmap of proteins belonging to relevant pathways identified by the GO BP analysis (panel B) in the Tan module. The Tan module was of particular interest because, in addition to its association with blood glucose levels (correlation 0.9 with % CGM reading >250 mg/dl, p =2E-08), it was associated with pancreas size (correlation -0.71, p=0.002) and estimated insulin sensitivity calculated with parameters not requiring fasting state according to the Coronary Artery Calcification in Type 1 Diabetes (CACTI) study approach (eIS-nf). The eIS calculated using another formula from CACTI that did not include adiponectin levels was not significantly associated with the module.
Four modules (i.e., Tan, Salmon, Pink, Purple, Figures 4C, 5A, B, D) showed significant association with pancreas size that may be a pathogenic clinical feature of T1D (5, 28, 29). Heatmaps of select module proteins (36 of 41 in the Tan module and 19 of 40 in the Salmon module, presented in the Figures 5C, F; ST6 and ST7) that displays strong correlations between module membership and protein significance demonstrate the specificity of the EV-enriched protein-pancreas size associations with T1D (Figures 4C, SF4, SF5), particularly for the Tan module proteins. The Pink module also showed a significant correlation between module membership and protein significance (The list of proteins is presented in ST8). However, the association was not significant for the Purple module (Figure 5A). The GO cellular component enrichment analysis for the Tan module showed a significant enrichment for membrane raft, membrane microdomain, and membrane region compartments as the highest positively correlated components. Among the enriched GO biological processes, several processes associated with inflammation and the immune response were identified (Figure 5E). The EV proteins belonging to the Salmon module and associated with pancreas size were enriched for humoral immune response, neutrophil degranulation, regulation of viral entry into host cells, modulation by symbiont of entry into host, regulation of viral life cycle, movement in host environment, interaction with host, regulation of viral processes (Figures 5F, SF4) that might be relevant in T1D pathogenesis or response to the environment.
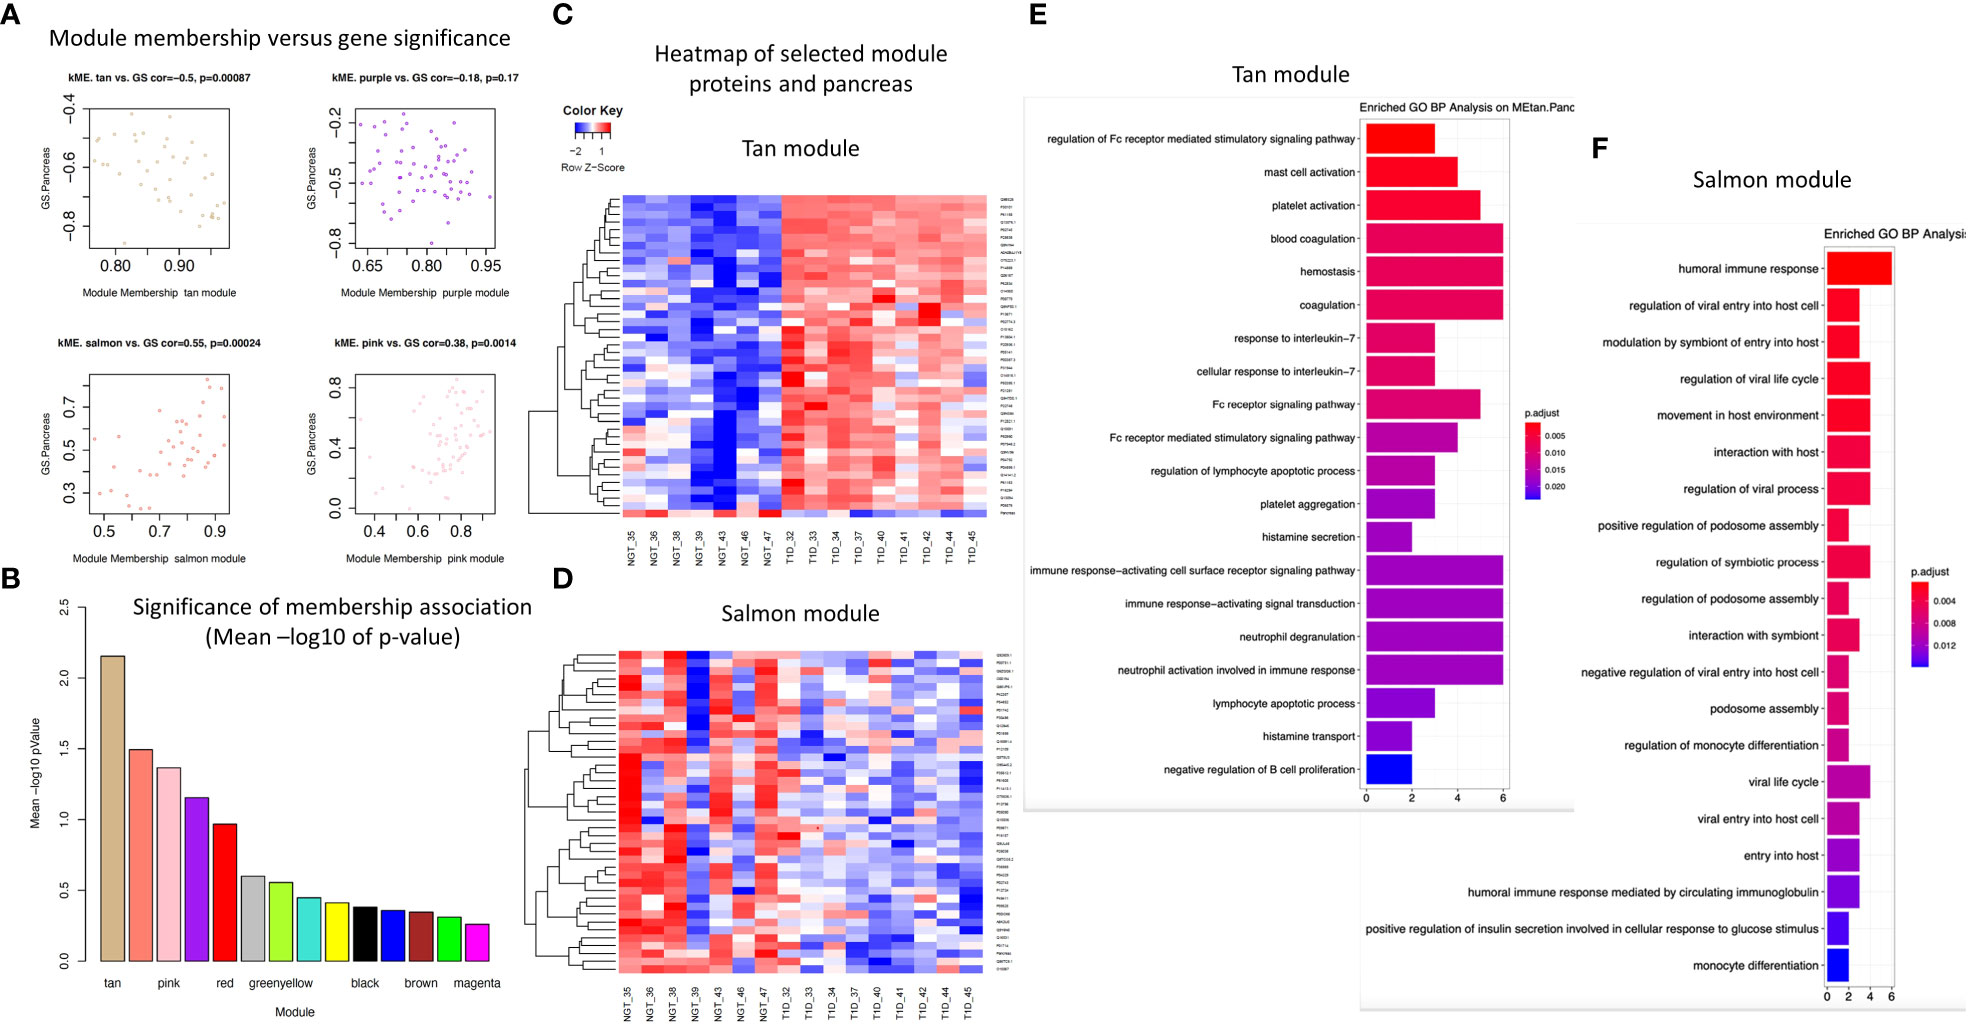
Figure 5 Module connectivity with pancreas size. (A) Distribution of module membership versus gene significance. (B) Significance of membership association with the trait of interest (pancreas size). (C) Heatmap of the EV proteins correlation with pancreas size in the Tan module. (D) Heatmap of the EV proteins correlation with pancreas size in the Salmon module. (E, F) Enriched GO BP analysis of selected proteins associated with pancreas size in the Tan module (E) and in the Salmon module (F).
Considering the proteins with the strongest correlation with pancreas size, they seemed to be continuously distributed rather than separated in two groups corresponding to T1D and controls (Figure 6). This could indicate that the correlation is with the organ size rather than being mediated by a confounder that would discriminate people with diabetes such as glycemic control as possible true markers of disease pathobiology. The Salmon module identified proteins strongly correlated with the clinical trait of interest (i.e., pancreas size) but not appearing among the significantly differentially abundant proteins. One of these, CD74 is an MHC class II chaperon that stabilizes the MHC Class II antigen processing and prevents loading antigen peptides into the MHC Class II complex. CD74 is also involved in the regulation of T-cell and B-cell development, dendritic cell motility, thymic selection, and macrophage inflammation (30). Of note, HLA Class II proteins HLA-DRB1 and HLA-DQB1 are positively associated with pancreas size and are significantly downregulated in the circulating EV-enriched preparations in T1D compared to controls. This supports the concept that more sophisticated analyses such as WGCNA are needed to understand the complex picture of circulating EV-enriched proteins.

Figure 6 Proteins with a significant correlation with pancreas size in Tan module and in Salmon module. Red: participants with type 1 diabetes (T1D). Blue: participants without diabetes (controls).
Some of the modules (Green, Brown, Turquoise, Yellow) correlated with the mode of particle size of EV-enriched preparations (Green corr=0.6, p=6.7e-18, Brown cor=0.22, p=0.0017, turquoise cor=0.37, p1.2e-09, yellow cor=0.34, p=4.2e-06). This is expected as different types of EVs have different sizes and cargos. Significant correlations were revealed between member proteins in these modules and particle size mode but not associated with disease status. The network module association with key diabetes indicators like HbA1c, glucose measurements, and pancreas size was clearly different than the association with EV/particle size.
This pilot study showed that the proteome of circulating EV-enriched preparations of patients with T1D differs from the one of healthy volunteers and significantly correlates with key features of T1D. Our proteomic and phosphoproteomic analyses demonstrated significant enrichment in annotated exosomal proteins and phosphoproteins. This suggests that our study preparations were enriched in exosomes. The EV cargo is reported to mirror, to some extent, the specific cellular phenotypes from their cells of origin (31). Therefore, it could provide information on mechanisms that are active in the disease of interest. To our knowledge, this is the first characterization of the proteome of circulating EV-enriched preparations in patients with T1D compared to controls. The plasma or serum proteome includes a heterogenous pool of proteins from vesicles derived by multiple cell types, with production driven by multiple mechanisms (32, 33). We were not surprised to find that the proteome and phosphoproteome of EV-enriched preparations were associated with hyperglycemia, insulin treatment and glucose variability as these are key drivers of T1D pathophysiology, but also with T1D pathogenic mechanisms. The objective of this work was to verify that potential pathogenic mechanisms were not entirely masked by glucose driven signatures. The results of the present investigation will guide future studies as these relationships may be important for discriminating T1D endotypes that may respond differently to the now available preventive therapies for T1D. On the other hand, EV-enriched preparations could indicate pathways that could eventually identify mechanisms leading to progression to chronic complications of the disease which will require a more aggressive monitoring and treatment.
Supporting the information richness and biomarker potential of circulating EV-enriched preparations, our bioinformatic approaches were able to discriminate the two study populations, namely people with T1D and controls, and to identify key proteins that represent known and novel aspects of T1D biology. By analyzing cellular compartment annotations for the differentially abundant proteins and phosphoproteins, we demonstrated enrichment in vesicle and secretory granule associated proteins likely involved in insulin, platelet, and neutrophil function. This leads us to the hypothesis that T1D could indeed modulate EV biogenesis and secretion. As expected, biological process and pathway analysis identified enrichment for pathways (e.g., neutrophil degranulation and activation) that may be associated not only with the pathogenesis of the disease but also with the development of chronic complications, both at the macro and microvascular level. Pathways connected to platelet function and coagulation suggest the possible utility of EV proteomics in the prediction of disease complications. Specifically, C1q and plasminogen (PLG) were two of the key complement proteins strongly increased in our T1D EV-enriched preparations. Notably, deposition of complement proteins like C1q in the EVs has been reported to be needed for complement activation and, when deregulated, to contribute to pathological states (34). These particles loaded with complement regulators are suggested to contribute to the stimulation and inhibition of T-cell responses and the interaction among immune cells (35). Furthermore, C1q has been recognized as an important pattern recognition receptor that diverts autoantigen containing extracellular vesicles from immune recognition (36). PLG, on the other hand, is reported to be more efficiently activated by PLG activators when associated with cell surfaces, as compared to the reaction in solution (37). By the same token, PLG on vesicle surfaces may be more efficiently converted into plasmin, consequently promoting fibrinolysis and immune cell modulation with systemic effects.
Additionally, 8 of the top 100 ExoCarta proteins were found to be significantly upregulated in the T1D circulating EVs (CD63, RAB14, VCP, BSG (a.k.a. CD147), FLNA, GNAI2, LAMP2, EZR) and to significantly correlate with clinical measures of glycemic control, insulin sensitivity, and pancreas size. Because the ExoCarta database is a heterogenous aggregator of published proteins presumably enriched in exosomal preparations but still includes contaminants that copurify with EVs isolated by standard methods, we focused on the subset of 100 proteins most often identified in exosome studies and catalogued in the database [http://exocarta.org/exosome_markers_new (25)]. A number of publications indicated that CD63, RAB14, BSG, LAMP2, EZR are transmembrane proteins confirmed to be present in EV preparations obtained with different methods of isolation which should reduce the effect of contamination (38–41). The WGCNA revealed significant correlations between member proteins in some of the modules and particle size mode but they were not associated with disease status. Further studies with larger sample sizes are necessary to clarify if T1D modulates EV biogenesis and secretion and/or that dysregulation of EV-mediated processes may contribute to T1D development and/or progression.
Among other proteins involved in the inflammatory response and immune-activation we found upregulated IL6ST/Gp130 (the founding member of the cytokine receptor family, which is involved in the regulation of adipocyte development and function and has a key role at the intersection of inflammation, autoimmunity and cancer) (42, 43) and CD40, and the downregulated MHC class II proteins HLA-DQB1 and HLA-DRB1. Of note, all these proteins are involved in IL-6 signaling (42–48). Importantly, and supporting our T1D-related findings, it is known that macrophages from T1D patients with high-risk HLA-DQB1 alleles are sensitized to secrete IL-6 in response to nonantigenic stimulation (46). Interestingly, phosphorylated MARCH8 (gene symbol: MARCHF8), an E3 ubiquitin-protein ligase that regulates the expression and trafficking of critical immunoreceptors such as the MHC class II proteins (49, 50), specifically in non-hematopoietic cells (i.e., thymic and alveolar epithelial cells) (51), was also significantly downregulated in the circulating EV-enriched preparations.
In addition to the neutrophil, platelet, and immune cell activation related pathways, the differentially abundant proteins and phosphoproteins were enriched for other biological processes and KEGG pathways related to prion disease. In this context, it is of interest to highlight that Wasserfall’s group (52) recently showed an increased frequency of cellular prion proteins in pancreas specimens from people with T1D and that, earlier, Strom and collaborators (53) demonstrated in two rodent models that altered metabolism of cellular prion protein in β cells associated with glucose dysregulation. Interestingly, we detected a significantly elevated phosphoprotein/total protein ratio for nucleobindin-1 (NUCB1) in the circulating EV-enriched preparations from the T1D participants. NUCB1 is a calcium-binding protein of the Golgi with a hypothetical role in calcium homeostasis (54). Some of its described functions may be relevant for T1D pathogenesis. NUCB1 is an ER stress-inducible gene (55) expressed in numerous tissues. It is expressed in the pancreatic islets but not in acinar cells (56), and in its soluble form it inhibits amyloid fibril deposition including hIAPP (57). It is overexpressed in Lupus and is a B-cell differentiation and growth factor. The significantly elevated NUCB1 phosphoprotein/protein ratio in the preparations is due to a significant downregulation at the protein level while the phosphorylation status of the protein was not significantly elevated. We reason that the reduction of nucleobindin-1 protein in EVs, which additionally appear to be present in an altered phosphorylation status, may indicate that nucleobindin-1 function (possibly in both the cell and the released EVs) is impaired (reduced) in the pancreas of T1D patients. This impairment in NUCB1 protein function may contribute to the accumulation of amyloid fibrils in pancreatic islets. We further identified, using the WGCNA methodology, that Salmon module protein serum amyloid P-component (SAP/APCS, an acute phase inflammation protein found in the circulation) correlated with pancreas size. Similar to NUCB1, SAP was also found to be significantly downregulated in our T1D participants. Interestingly, SAP and hs-CRP (another acute phase inflammation protein) were recently reported to show opposite and synergic associations with all-cause mortality in patients with type 2 diabetes (58), however, the protective role of SAP on the risk of mortality is not well understood. Amyloid deposition has been described in pancreata of T1D patients (59, 60).
Taking advantage of the deep metabolic phenotyping of our participants, we attempted at more precisely characterize the proteome of EV-enriched preparations and its association with clinical features (beyond the analysis of differential expression based on group averages comparisons) by applying a WGCNA methodology. Coexpression networks and WGCNA identify clusters of genes based on their correlated expression patterns (19). This approach can find potential novel candidates based on co-expression similarities, rather than protein-protein interaction that may have limitations (61). The literature on the adaptation of the WGCNA methodology on proteomic data is relatively limited and only applied to urinary EV (62).
WGCNA applied to proteomics of EV enriched preparations in our study identified 14 distinct modules significantly associated with nine clinical features. As expected, the association is primarily with blood glucose measures indicative of T1D, but also with other features like pancreas size, resting energy expenditure, and the CACTI index of insulin sensitivity. The enrichment analysis of gene ontologies pointed to the biological meaning of the modules, identifying neutrophil activation and degranulation, activation of immune response and blood coagulation as some of the pathways associated with hyperglycemia, which were also identified by the differential abundance analysis. Importantly, the humoral immune response, regulation of viral entry and life cycle regulation of viral processes were associated with pancreas size in the Salmon module together with mast cell activation, platelet activation, blood coagulation, hemostasis, and response to IL-7 in the Tan module. As hyperglycemia is the characteristic feature of diabetes it is impossible to discriminate in this cross-sectional study whether the proteins included in these modules are differentially abundant as a cause or a consequence of hyperglycemia. However, features possibly linked to pathogenic mechanisms, are also identified.
The WGCNA methodology has been applied to peripheral blood gene expression in T1D and controls (63, 64) and identified significantly disrupted co-expression modules in T1D compared to healthy control PBMCs (63). The module associated with T1D in the work of Lu et al. (63) was enriched for genes belonging to the “regulation of immune response” pathway. Our study took a broader approach considering proteomics of circulating EV-enriched preparations. Circulating EVs originate from different cells, therefore, the modules that we identified are likely a composite of coregulated proteins expressed from a number of different cellular sources, including PBMCs. In line with what was seen in PBMC transcriptomics (63), we also identified enrichment in proteins classified under the broad biological process ontology denominated “regulation of immune response” (that includes 1019 genes) and associated with hyperglycemia as an indicator of diabetes (regulation of Fc receptor mediated stimulatory signaling pathway). In our approach, we include proteomic profiles obtained from patients with T1D and healthy controls to identify clinically relevant protein clusters (modules) that correlate with clinical variables of interest, independently of the disease. Therefore, the proteins included in the modules of interest could be used as markers of that clinical variable rather than of the disease. The analysis focused then on the association with pancreas size, as a trait that might be associated with disease pathogenesis opening the avenue for confirmatory studies in new onset diabetes or precious islet autoantibody positive samples.
Among the proteins of interest identified by our traditional (differential expression) approach and by WGCNA, HLA-DRB1 and DQB1 were significantly downregulated and correlated with pancreas size. MHC-Class II molecules are present in exosomes originating from APC, B-cells and T-cells (65–67). Consistent with our findings, MHC Class II-loaded EVs are also detected in plasma (68). The MHC Class II in EVs is the predominant form of MHC proteins detected in serum and plasma, even though a soluble form has also been described. Both the soluble MHC-Class II and the exosome-associated MHC-Class II are immunomodulatory (69). Immunosuppressive EVs derived from APCs occur naturally, for example, soon after eating or inoculation of specific antigens (70). The experiments by Kim and collaborators (68) suggested that the immune response to a foreign antigen is regulated by exosomes in plasma produced by monocytes/macrophages that have the ability to suppress the immune response in an antigen-specific manner. Therefore, we could hypothesize that lower levels of MHC in EV-enriched preparations in T1D compared to healthy individuals could be a specific sign of the loss of tolerance in T1D. Our study was not able to demonstrate that this mechanism is active in T1D pathogenesis, however, it highlighted the power of WGCNA in analyzing complex diseases and in formulating hypotheses. Paired with the in-depth phenotyping of the participants of this pilot study, WGCNA allowed us to identify and confirm the potential role of selected proteins that would have been excluded by simple differential expression analysis.
The primary limitation of our study is the small sample size, therefore the conclusions cannot be generalizable and might have missed important pathways. The power of the applied methodology is that it produces meaningful results even with a small sample size as in our case. The gene connectivity analysis smooths the variability and alleviates the need for multiple sampling. The cross-sectional design needs to be considered hypothesis generating and the findings should be confirmed in larger and independent cohort(s), and ultimately in dedicated functional studies including early stages of T1D development.
Proteomics of circulating EV-enriched preparations appear to be a powerful tool to highlight potential disease biomarkers that could be the object of validation studies. WGCNA adds the opportunity to identify specific clinical phenotypes that could be investigated in future mechanistic studies.
The original contributions presented in the study are publicly available. This data can be found here: ProteomeXchange Consortium via the PRIDE partner repository with the dataset identifier PXD041899 (71).
The studies involving human participants were reviewed and approved by AdventHealth Institutional Review Board. The patients/participants provided their written informed consent to participate in this study.
AC designed and supervised experiments, researched data, and wrote the manuscript; YNL conducted experiments, researched and analyzed data, and wrote the manuscript; GY researched and analyzed data and contributed to manuscript writing; CC and ABh researched data and contributed to manuscript editing; ABi, contributed to clinical study execution and researched data and contributed to manuscript editing, AP, HC, and KC conducted experiments and contributed to manuscript editing; AI conducted experiments, researched data, and contributed to manuscript editing; DM designed the larger clinical study, acquired funding, and reviewed the manuscript, RP designed the study, acquired funding, provided the study samples, supervised the work, and reviewed/edited the manuscript. All authors contributed to the article and approved the submitted version.
This study was funded by program funds granted to RP by the AdventHealth Translational Research Institute. The ACT1ON Study was funded by the National Institute of Diabetes and Digestive and Kidney Diseases of the National Institutes of Health under Award Number 1DP3DK113358; MPIs Mayer-Davis, Maahs, Pratley. DM is supported by P30DK116074.
The authors thank all participants and AdventHealth Translational Research Institute staff who executed the clinical study.
The authors declare the following competing financial interests: AI is a principal at Tymora Analytical Operations, which developed the EVtrap beads and commercialized PolyMAC enrichment kit. RP reports grants from Hanmi Pharmaceutical Co. and Janssen; consulting fees from Merck; grants, speaker fees and consulting fees from Novo Nordisk; consulting fees from Pfizer; grants from Poxel SA; grants and consulting fees from Sanofi; consulting fees from Scohia Pharma Inc.; consulting fees from Sun Pharmaceutical Industries. AC reports consulting fees from GlaxoSmithKline. Honoraria and fees for RP’s and AC’s services were paid directly to AdventHealth, a nonprofit organization. DM has consulted for Abbott, Medtronic, the Helmsley Charitable Trust, Sanofi, Novo Nordisk, and Eli Lilly and has served on an advisory board for Insulet.
The remaining authors declare that the research was conducted in the absence of any commercial or financial relationships that could be construed as a potential conflict of interest.
All claims expressed in this article are solely those of the authors and do not necessarily represent those of their affiliated organizations, or those of the publisher, the editors and the reviewers. Any product that may be evaluated in this article, or claim that may be made by its manufacturer, is not guaranteed or endorsed by the publisher.
The content is solely the responsibility of the authors and does not necessarily represent the official views of the National Institutes of Health.
The Supplementary Material for this article can be found online at: https://www.frontiersin.org/articles/10.3389/fendo.2023.1219293/full#supplementary-material
1. Atkinson MA, Campbell-Thompson M, Kusmartseva I, Kaestner KH. Organisation of the human pancreas in health and in diabetes. Diabetologia (2020) 63:1966–73. doi: 10.1007/s00125-020-05203-7
2. Atkinson MA, Eisenbarth GS, Michels AW. Type 1 diabetes. Lancet (2014) 383:69–82. doi: 10.1016/S0140-6736(13)60591-7
3. Redondo MJ, Hagopian WA, Oram R, Steck AK, Vehik K, Weedon M, et al. The clinical consequences of heterogeneity within and between different diabetes types. Diabetologia (2020) 63:2040–8. doi: 10.1007/s00125-020-05211-7
4. Fyvie MJ, Gillespie KM. The importance of biomarker development for monitoring type 1 diabetes progression rate and therapeutic responsiveness. Front Immunol (2023) 14:1158278. doi: 10.3389/fimmu.2023.1158278
5. Campbell-Thompson ML, Filipp SL, Grajo JR, Nambam B, Beegle R, Middlebrooks EH, et al. Relative pancreas volume is reduced in first-degree relatives of patients with type 1 diabetes. Diabetes Care (2019) 42:281–7. doi: 10.2337/dc18-1512
6. Sims EK, Cuthbertson D, Herold KC, Sosenko JM. The deterrence of rapid metabolic decline within 3 months after teplizumab treatment in individuals at high risk for type 1 diabetes. Diabetes (2021) 70:2922–31. doi: 10.2337/db21-0519
7. Nathan DM, Group DER. The diabetes control and complications trial/epidemiology of diabetes interventions and complications study at 30 years: overview. Diabetes Care (2014) 37:9–16. doi: 10.2337/dc13-2112
8. de Ferranti SD, de Boer IH, Fonseca V, Fox CS, Golden SH, Lavie CJ, et al. Type 1 diabetes mellitus and cardiovascular disease: a scientific statement from the American Heart Association and American Diabetes Association. Circulation (2014) 130:1110–30. doi: 10.1161/CIR.0000000000000034
9. Hoshino A, Kim HS, Bojmar L, Gyan KE, Cioffi M, Hernandez J, et al. Extracellular vesicle and particle biomarkers define multiple human cancers. Cell (2020) 182:1044–1061 e18. doi: 10.1016/j.cell.2020.07.009
10. Kalluri R, LeBleu VS. The biology, function, and biomedical applications of exosomes. Science (2020) 367(6478):eecu6977. doi: 10.1126/science.aau6977
11. Lakhter AJ, Pratt RE, Moore RE, Doucette KK, Maier BF, DiMeglio LA, et al. Beta cell extracellular vesicle miR-21-5p cargo is increased in response to inflammatory cytokines and serves as a biomarker of type 1 diabetes. Diabetologia (2018) 61:1124–34. doi: 10.1007/s00125-018-4559-5
12. Nunez Lopez YO, Iliuk A, Petrilli AM, Glass C, Casu A, Pratley RE. Proteomics and phosphoproteomics of circulating extracellular vesicles provide new insights into diabetes pathobiology. Int J Mol Sci (2022) 23:5779. doi: 10.3390/ijms23105779
13. Diaz Lozano IM, Sork H, Stone VM, Eldh M, Cao X, Pernemalm M, et al. Proteome profiling of whole plasma and plasma-derived extracellular vesicles facilitates the detection of tissue biomarkers in the non-obese diabetic mouse. Front Endocrinol (Lausanne) (2022) 13:971313. doi: 10.3389/fendo.2022.971313
14. Kraus VB. Biomarkers as drug development tools: discovery, validation, qualification and use. Nat Rev Rheumatol (2018) 14:354–62. doi: 10.1038/s41584-018-0005-9
15. Ho DE, Imai K, King G, Stuart EA. MatchIt: nonparametric preprocessing for parametric causal inference. J Stat Softw (2011) 42(8):1–28. doi: 10.18637/jss.v042.i08
16. Chen KY, Smith S, Ravussin E, Krakoff J, Plasqui G, Tanaka S, et al. Room indirect calorimetry operating and reporting standards (RICORS 1.0): A guide to conducting and reporting human whole-room calorimeter studies. Obes (Silver Spring) (2020) 28:1613–25. doi: 10.1002/oby.22928
17. Battelino T, Danne T, Bergenstal RM, Amiel SA, Beck R, Biester T, et al. Clinical targets for continuous glucose monitoring data interpretation: recommendations from the international consensus on time in range. Diabetes Care (2019) 42:1593–603. doi: 10.2337/dci19-0028
18. Iliuk A, Wu X, Li L, Sun J, Hadisurya M, Boris RS, et al. Plasma-derived extracellular vesicle phosphoproteomics through chemical affinity purification. J Proteome Res (2020) 19:2563–74. doi: 10.1021/acs.jproteome.0c00151
19. Langfelder P, Horvath S. WGCNA: an R package for weighted correlation network analysis. BMC Bioinf (2008) 9:559. doi: 10.1186/1471-2105-9-559
21. Tang F, Ishwaran H. Random forest missing data algorithms. Stat Anal Data Min (2017) 10:363–77. doi: 10.1002/sam.11348
22. Bushel P, pvca. Principal Variance Component Analysis (PVCA), in R package version 1.30. (2020).
23. Smyth GK. Linear models and empirical bayes methods for assessing differential expression in microarray experiments. Stat Appl Genet Mol Biol (2004) 3:1–25. doi: 10.2202/1544-6115.1027
24. Yu GC, Wang LG, Han YY, He QY. clusterProfiler: an R package for comparing biological themes among gene clusters. Omics (2012) 16:284–7. doi: 10.1089/omi.2011.0118
25. Keerthikumar S, Chisanga D, Ariyaratne D, Al Saffar H, Anand S, Zhao K, et al. ExoCarta: A web-based compendium of exosomal cargo. J Mol Biol (2016) 428:688–92. doi: 10.1016/j.jmb.2015.09.019
26. Gorini G, Nunez YO, Mayfield RD. Integration of miRNA and protein profiling reveals coordinated neuroadaptations in the alcohol-dependent mouse brain. PloS One (2013) 8:e82565. doi: 10.1371/journal.pone.0082565
27. Gibbs DL, Baratt A, Baric RS, Kawaoka Y, Smith RD, Orwoll ES, et al. Protein co-expression network analysis (ProCoNA). J Clin Bioinforma (2013) 3:11. doi: 10.1186/2043-9113-3-11
28. Virostko J, Williams J, Hilmes M, Bowman C, Wright JJ, Du L, et al. Pancreas volume declines during the first year after diagnosis of type 1 diabetes and exhibits altered diffusion at disease onset. Diabetes Care (2019) 42:248–57. doi: 10.2337/dc18-1507
29. Virostko J, Hilmes M, Eitel K, Moore DJ, Powers AC. Use of the electronic medical record to assess pancreas size in type 1 diabetes. PloS One (2016) 11:e0158825. doi: 10.1371/journal.pone.0158825
30. Su H, Na N, Zhang X, Zhao Y. The biological function and significance of CD74 in immune diseases. Inflammation Res (2017) 66:209–16. doi: 10.1007/s00011-016-0995-1
31. Zhang Y, Liu Y, Liu H, Tang WH. Exosomes: biogenesis, biologic function and clinical potential. Cell Biosci (2019) 9:19–9. doi: 10.1186/s13578-019-0282-2
32. Brahmer A, Neuberger E, Esch-Heisser L, Haller N, Jorgensen MM, Baek R, et al. Platelets, endothelial cells and leukocytes contribute to the exercise-triggered release of extracellular vesicles into the circulation. J Extracellular Vesicles (2019) 8:1615820. doi: 10.1080/20013078.2019.1615820
33. Palviainen M, Saraswat M, Varga Z, Kitka D, Neuvonen M, Puhka M, et al. Extracellular vesicles from human plasma and serum are carriers of extravesicular cargo-Implications for biomarker discovery. PloS One (2020) 15:e0236439–:e0236439. doi: 10.1371/journal.pone.0236439
34. Karasu E, Eisenhardt SU, Harant J, Huber-Lang M. Extracellular vesicles: packages sent with complement. Front Immunol (2018) 9. doi: 10.3389/fimmu.2018.00721
35. Clayton A, Harris CL, Court J, Mason MD, Morgan BP. Antigen-presenting cell exosomes are protected from complement-mediated lysis by expression of CD55 and CD59. Eur J Immunol (2003) 33:522–31. doi: 10.1002/immu.200310028
36. Baldwin WM III, Valujskikh A, Fairchild RL. C1q as a potential tolerogenic therapeutic in transplantation. Am J Transplant (2021) 21:3519–23. doi: 10.1111/ajt.16705
37. Miles LA, Lighvani S, Baik N, Parmer CM, Khaldoyanidi S, Mueller BM, et al. Chapter five - new insights into the role of plg-RKT in macrophage recruitment. In: Jeon KW, editor. International Review of Cell and Molecular Biology. Academic Press (2014). p. 259–302.
38. Mathieu M, Nevo N, Jouve M, Valenzuela JI, Maurin M, Verweij FJ, et al. Specificities of exosome versus small ectosome secretion revealed by live intracellular tracking of CD63 and CD9. Nat Commun (2021) 12:4389. doi: 10.1038/s41467-021-24384-2
39. Karimi N, Dalirfardouei R, Dias T, Lotvall J, Lasser C. Tetraspanins distinguish separate extracellular vesicle subpopulations in human serum and plasma - Contributions of platelet extracellular vesicles in plasma samples. J Extracell Vesicles (2022) 11:e12213. doi: 10.1002/jev2.12213
40. Hung ME, Leonard JN. Stabilization of exosome-targeting peptides via engineered glycosylation. J Biol Chem (2015) 290:8166–72. doi: 10.1074/jbc.M114.621383
41. Huang LH, Rau CS, Wu SC, Wu YC, Wu CJ, Tsai CW, et al. Identification and characterization of hADSC-derived exosome proteins from different isolation methods. J Cell Mol Med (2021) 25:7436–50. doi: 10.1111/jcmm.16775
42. Silver JS, Hunter CA. gp130 at the nexus of inflammation, autoimmunity, and cancer. J leukocyte Biol (2010) 88:1145–56. doi: 10.1189/jlb.0410217
43. White UA, Stephens JM. The gp130 receptor cytokine family: regulators of adipocyte development and function. Curr Pharm design (2011) 17:340–6. doi: 10.2174/138161211795164202
44. Ahluwalia TS, Prins BP, Abdollahi M, Armstrong NJ, Aslibekyan S, Bain L, et al. Genome-wide association study of circulating interleukin 6 levels identifies novel loci. Hum Mol Genet (2021) 30:393–409. doi: 10.1093/hmg/ddab023
45. Bin Dhuban K, Bartolucci S, d'Hennezel E, Piccirillo CA. Signaling through gp130 compromises suppressive function in human FOXP3(+) regulatory T cells. Front Immunol (2019) 10:1532. doi: 10.3389/fimmu.2019.01532
46. Plesner A, Greenbaum CJ, Gaur LK, Ernst RK, Lernmark A. Macrophages from high-risk HLA-DQB1*0201/*0302 type 1 diabetes mellitus patients are hypersensitive to lipopolysaccharide stimulation. Scandinavian J Immunol (2002) 56:522–9. doi: 10.1046/j.1365-3083.2002.01150.x
47. Shahbazi M, Ebadi H, Fathi D, Roshandel D, Mohamadhosseni M, Tahmasebi A, et al. HLA-DRB1*1501 intensifies the impact of IL-6 promoter polymorphism on the susceptibility to multiple sclerosis in an Iranian population. Multiple Sclerosis J (2010) 16:1173–7. doi: 10.1177/1352458510376177
48. Yanagawa Y, Onoé K. Distinct regulation of CD40-mediated interleukin-6 and interleukin-12 productions via mitogen-activated protein kinase and nuclear factor kappaB-inducing kinase in mature dendritic cells. Immunology (2006) 117:526–35. doi: 10.1111/j.1365-2567.2006.02329.x
49. Liu H, Jain R, Guan J, Vuong V, Ishido S, La Gruta NL, et al. Ubiquitin ligase MARCH 8 cooperates with CD83 to control surface MHC II expression in thymic epithelium and CD4 T cell selection. J Exp Med (2016) 213:1695–703. doi: 10.1084/jem.20160312
50. Liu H, Wilson KR, Firth AM, Macri C, Schriek P, Blum AB, et al. Ubiquitin-like protein 3 (UBL3) is required for MARCH ubiquitination of major histocompatibility complex class II and CD86. Nat Commun (2022) 13:1934. doi: 10.1038/s41467-022-29524-w
51. Schriek P, Liu H, Ching AC, Huang P, Gupta N, Wilson KR, et al. Physiological substrates and ontogeny-specific expression of the ubiquitin ligases MARCH1 and MARCH8. Curr Res Immunol (2021) 2:218–28. doi: 10.1016/j.crimmu.2021.10.004
52. Hiller H, Yang C, Beachy DE, Kusmartseva I, Candelario-Jalil E, Posgai AL, et al. Altered cellular localisation and expression, together with unconventional protein trafficking, of prion protein, PrP(C), in type 1 diabetes. Diabetologia (2021) 64:2279–91. doi: 10.1007/s00125-021-05501-8
53. Strom A, Wang G-S, Reimer R, Finegood DT, Scott FW. Pronounced cytosolic aggregation of cellular prion protein in pancreatic β-cells in response to hyperglycemia. Lab Invest (2007) 87:139–49. doi: 10.1038/labinvest.3700500
54. Kapoor N, Gupta R, Menon ST, Folta-Stogniew E, Raleigh DP, Sakmar TP. Nucleobindin 1 is a calcium-regulated guanine nucleotide dissociation inhibitor of G{alpha}i1. J Biol Chem (2010) 285:31647–60. doi: 10.1074/jbc.M110.148429
55. Tsukumo Y, Tomida A, Kitahara O, Nakamura Y, Asada S, Mori K, et al. Nucleobindin 1 controls the unfolded protein response by inhibiting ATF6 activation. J Biol Chem (2007) 282:29264–72. doi: 10.1074/jbc.M705038200
56. Williams P, Tulke S, Ilegems E, Berggren PO, Broberger C. Expression of nucleobindin 1 (NUCB1) in pancreatic islets and other endocrine tissues. Cell Tissue Res (2014) 358:331–42. doi: 10.1007/s00441-014-1948-z
57. Gupta R, Kapoor N, Raleigh DP, Sakmar TP. Nucleobindin 1 caps human islet amyloid polypeptide protofibrils to prevent amyloid fibril formation. J Mol Biol (2012) 421:378–89. doi: 10.1016/j.jmb.2012.04.017
58. Scarale MG, Copetti M, Garofolo M, Fontana A, Salvemini L, De Cosmo S, et al. The synergic association of hs-CRP and serum amyloid P component in predicting all-cause mortality in patients with type 2 diabetes. Diabetes Care (2020) 43:1025–32. doi: 10.2337/dc19-2489
59. Westermark GT, Krogvold L, Dahl-Jørgensen K, Ludvigsson J. Islet amyloid in recent-onset type 1 diabetes-the DiViD study. Upsala J Med Sci (2017) 122:201–3. doi: 10.1080/03009734.2017.1359219
60. Beery ML, Jacobsen LM, Atkinson MA, Butler AE, Campbell-Thompson M. Islet amyloidosis in a child with type 1 diabetes. Islets (2019) 11:44–9. doi: 10.1080/19382014.2019.1599707
61. Vella D, Zoppis I, Mauri G, Mauri P, Di Silvestre D. From protein-protein interactions to protein co-expression networks: a new perspective to evaluate large-scale proteomic data. EURASIP J Bioinform Syst Biol (2017) 2017:6–6. doi: 10.1186/s13637-017-0059-z
62. Bruschi M, Granata S, Santucci L, Candiano G, Fabris A, Antonucci N, et al. Proteomic analysis of urinary microvesicles and exosomes in medullary sponge kidney disease and autosomal dominant polycystic kidney disease. Clin J Am Soc Nephrol (2019) 14:834–43. doi: 10.2215/CJN.12191018
63. Lu JM, Chen YC, Ao ZX, Shen J, Zeng CP, Lin X, et al. System network analysis of genomics and transcriptomics data identified type 1 diabetes-associated pathway and genes. Genes Immun (2019) 20:500–8. doi: 10.1038/s41435-018-0045-9
64. Riquelme Medina I, Lubovac-Pilav Z. Gene co-expression network analysis for identifying modules and functionally enriched pathways in type 1 diabetes. PloS One (2016) 11:e0156006. doi: 10.1371/journal.pone.0156006
65. Adler LN, Jiang W, Bhamidipati K, Millican M, Macaubas C, Hung S-c, et al. The other function: class II-restricted antigen presentation by B cells. Front Immunol (2017) 8. doi: 10.3389/fimmu.2017.00319
66. Li C, Donninger H, Eaton J, Yaddanapudi K. Regulatory role of immune cell-derived extracellular vesicles in cancer: the message is in the envelope. Front Immunol (2020) 11. doi: 10.3389/fimmu.2020.01525
67. Muntasell A, Berger AC, Roche PA. T cell-induced secretion of MHC class II-peptide complexes on B cell exosomes. EMBO J (2007) 26:4263–72. doi: 10.1038/sj.emboj.7601842
68. Kim SH, Bianco NR, Shufesky WJ, Morelli AE, Robbins PD. MHC class II+ exosomes in plasma suppress inflammation in an antigen-specific and Fas ligand/Fas-dependent manner. J Immunol (2007) 179:2235–41. doi: 10.4049/jimmunol.179.4.2235
69. Bakela K, Athanassakis I. Soluble major histocompatibility complex molecules in immune regulation: highlighting class II antigens. Immunology (2018) 153:315–24. doi: 10.1111/imm.12868
70. Robbins PD, Morelli AE. Regulation of immune responses by extracellular vesicles. Nat Rev Immunol (2014) 14:195–208. doi: 10.1038/nri3622
Keywords: extracellular vesicles, proteomics, phosphoproteomics, type 1 diabetes, human
Citation: Casu A, Nunez Lopez YO, Yu G, Clifford C, Bilal A, Petrilli AM, Cornnell H, Carnero EA, Bhatheja A, Corbin KD, Iliuk A, Maahs DM and Pratley RE (2023) The proteome and phosphoproteome of circulating extracellular vesicle-enriched preparations are associated with characteristic clinical features in type 1 diabetes. Front. Endocrinol. 14:1219293. doi: 10.3389/fendo.2023.1219293
Received: 08 May 2023; Accepted: 06 July 2023;
Published: 28 July 2023.
Edited by:
Francoise Koumanov, University of Bath, United KingdomReviewed by:
Ernesto Satoshi Nakayasu, Pacific Northwest National Laboratory (DOE), United StatesCopyright © 2023 Casu, Nunez Lopez, Yu, Clifford, Bilal, Petrilli, Cornnell, Carnero, Bhatheja, Corbin, Iliuk, Maahs and Pratley. This is an open-access article distributed under the terms of the Creative Commons Attribution License (CC BY). The use, distribution or reproduction in other forums is permitted, provided the original author(s) and the copyright owner(s) are credited and that the original publication in this journal is cited, in accordance with accepted academic practice. No use, distribution or reproduction is permitted which does not comply with these terms.
*Correspondence: Anna Casu, QW5uYS5DYXN1QEFkdmVudEhlYWx0aC5jb20=; Richard E. Pratley, UmljaGFyZC5QcmF0bGV5Lk1EQEFkdmVudEhlYWx0aC5jb20=
†These authors have contributed equally to this work and share first authorship
Disclaimer: All claims expressed in this article are solely those of the authors and do not necessarily represent those of their affiliated organizations, or those of the publisher, the editors and the reviewers. Any product that may be evaluated in this article or claim that may be made by its manufacturer is not guaranteed or endorsed by the publisher.
Research integrity at Frontiers
Learn more about the work of our research integrity team to safeguard the quality of each article we publish.