
94% of researchers rate our articles as excellent or good
Learn more about the work of our research integrity team to safeguard the quality of each article we publish.
Find out more
ORIGINAL RESEARCH article
Front. Endocrinol. , 04 October 2023
Sec. Endocrinology of Aging
Volume 14 - 2023 | https://doi.org/10.3389/fendo.2023.1215512
This article is part of the Research Topic (Osteo)Sarcopenia & Sarcopenic Obesity, volume II View all 11 articles
 Lijiao Xiong1,2†
 Tingfeng Liao1,2†
 Tianting Guo3
 Zhaohao Zeng2,4
 Shuojia Wang1,2,5
 Guangyan Yang1,2
 Xiaohao Wang1,2
 Xinyu Wang1,2
 Jing Zhu1,2
 Pengfei Zhao1,2
 Yanchun Li1,2
 Lixing Li1,2Lin Kang1,2*
 Shu Yang1,2*
 Zhen Liang1,2*
Background: Sarcopenia has been linked to adverse health outcomes, including an increased risk of mortality. This study aimed to assess the 7-year mortality risk of sarcopenia in a community-based population in China and explore the causal relationship between components of sarcopenia and any death.
Methods: Data were sourced from the China Health and Retirement Longitudinal Study (CHARLS) conducted between 2011 and 2018. Sarcopenia was diagnosed using the Asian Working Group for Sarcopenia (AWGS) 2019 criteria. Logistic regression, Kaplan–Meier (KM) survival analysis, and propensity score matching with inverse probability of treatment weighting were used. Mendelian randomization (MR) analyses, conducted using European population data, were utilized to assess causality between sarcopenia and any death.
Results: The study included 9,006 participants: 3,892 had no sarcopenia, 3,570 had possible sarcopenia, 1,125 had sarcopenia, and 419 had severe sarcopenia. Over 7 years of follow-up, there were 871 deaths, including 196 with sarcopenia and 133 with severe sarcopenia. The KM curves showed that sarcopenia had a higher risk of mortality. Compared to those of no sarcopenia, the odds ratios (ORs) of sarcopenia for 7-year mortality were 1.41 (95% CI, 1.06–1.87) after adjusting for confounding variables (p < 0.05). The ORs of severe sarcopenia were 2.11 (95% CI, 1.51–2.95). Propensity score matching analysis and inverse probability of treatment weighting analysis confirmed these findings. The adjusted ORs of sarcopenia and 7-year mortality were 2.94 (95% CI, 1.6–5.39) in the 45–60 age group, 1.72 (95% CI, 1.11–2.68) in the 60–80 age group, and 5.03 (95% CI, 0.48–52.65) in the ≥80 age group. The ORs of severe sarcopenia and 7-year mortality were 6.92 (95% CI, 1.95–24.5) in the 45–60 age group, 2.59 (95% CI, 1.61–4.17) in the 60–80 age group, and 12.52 (95% CI, 1.18–133.18) in the ≥80 age group. The MR analyses, leveraging the inverse variance weighted (IVW) method, unveiled substantial causal links between low hand grip strength in individuals aged 60 and older, the usual walking pace, and mortality risk.
Conclusion: This study underscores the significant impact of sarcopenia and its components on mortality risk within the Chinese population. Particularly, low hand grip strength and usual walking pace emerged as noteworthy contributors to mortality risk.
Sarcopenia, characterized by loss of muscle mass and function, is a common condition in older adults that has been associated with increased disability, falls, hospitalization, and mortality (1–5). It has been reported to be prevalent in various groups, with estimates ranging from 9.9% to 40.4% among community-dwelling adults and 2% to 34% in outpatient settings, and affects as many as 56% of hospitalized patients (6–9). As the global population ages, the prevalence of sarcopenia is expected to increase significantly (10). Despite its growing recognition as a significant public health issue, there are limited data on the association between sarcopenia and mortality risk in Chinese community-dwelling adults. Moreover, the relationship between sarcopenia and mortality can be confounded by chronic diseases and other factors that commonly occur with aging. Propensity score matching has been used in previous research to account for these confounding factors, but typically for a single disease (11–14).
Sarcopenia is linked to a doubling of mortality risk in both community-dwelling adults and nursing home residents and a tripling of risk in cancer patients (11–14). As the world’s population continues to age, addressing the health implications of sarcopenia has become a critical priority. However, despite the increasing recognition of sarcopenia’s importance, there are still gaps in our understanding of its causal relationship with mortality.
This study aims to contribute to this understanding by investigating the causal links between different components of sarcopenia—specifically, appendicular lean mass, low hand grip strength, and usual walking pace—and the risk of mortality in a comprehensive manner. Our research combines data from a longitudinal study conducted among Chinese adults aged 45 years and older with a Mendelian randomization study utilizing European population data. By applying Mendelian randomization methods, we can better elucidate the causal relationships between these sarcopenia components and mortality risk.
The China Health and Retirement Longitudinal Study (CHARLS), established in 2011, is a national longitudinal study of community-dwelling adults in China, with its detailed validity and methodology previously documented (15, 16). The CHARLS protocol was approved by the Peking University Ethical Review Committee (IRB00001052-11015) following the Declaration of Helsinki. Informed consent was obtained from all participants. Data from Harmonized CHARLS 2011–2018 were included. Missing data on sex (n = 8), age (n = 305), weight (n = 4,099), height (n = 58), no-grip strength, walking speed, sitting test (n = 7,501), no follow-up (n = 1,345), blood sample data (n = 3,259), and age < 18 years (n = 3) were excluded. A total of 9,006 participants (≥18 years) were enrolled in the study (Figure 1).
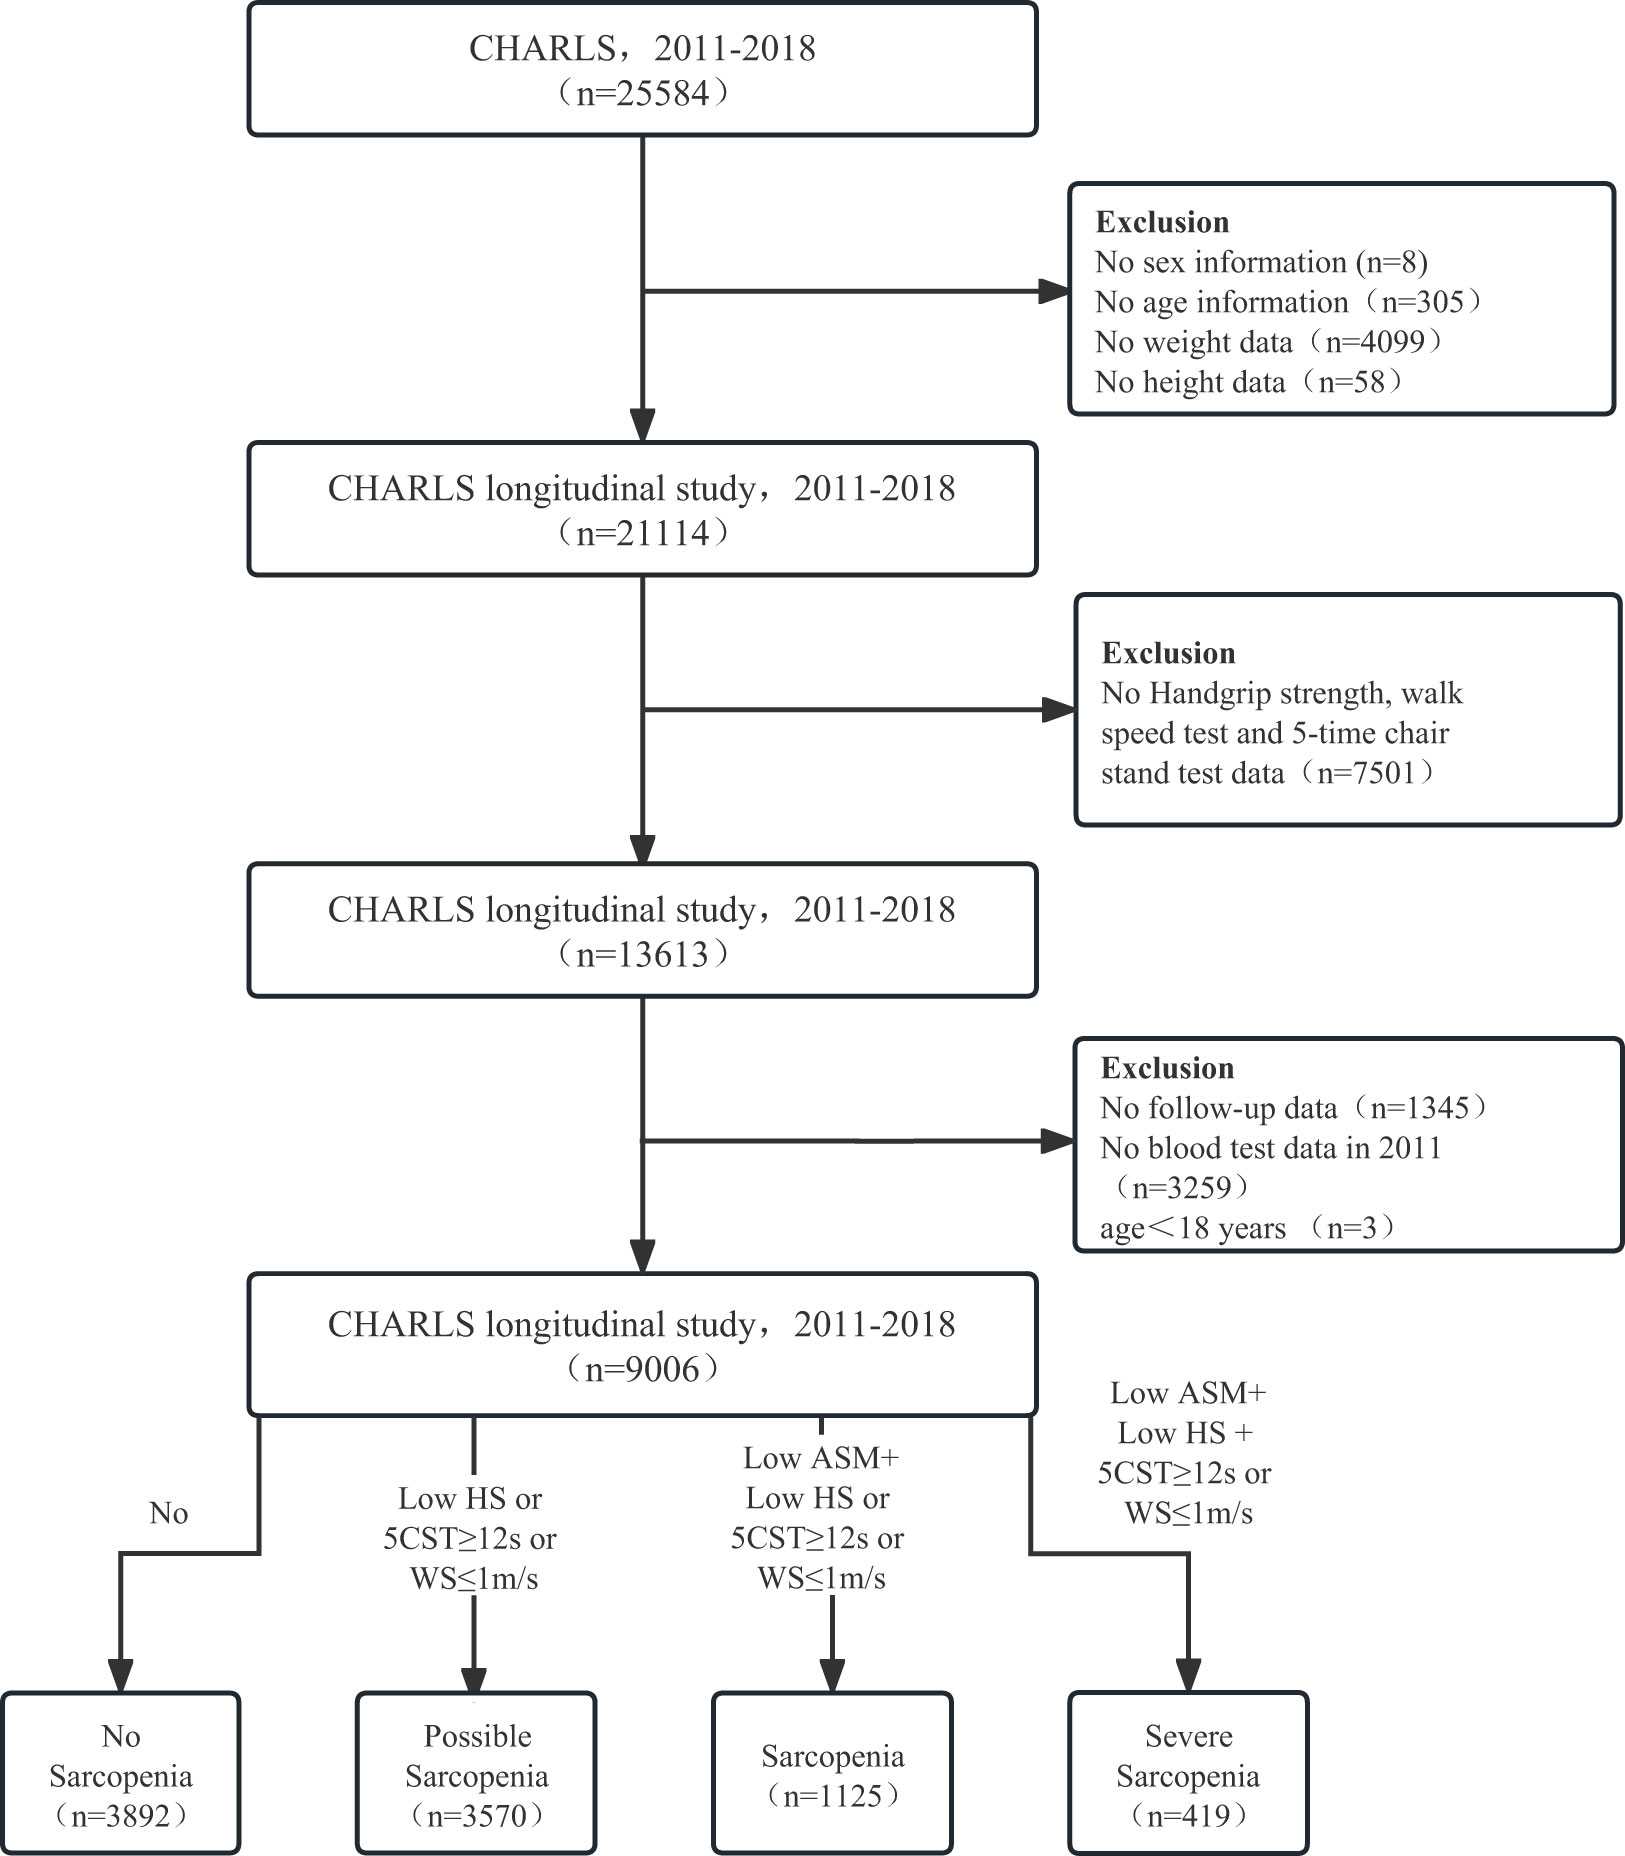
Figure 1 The flow diagram for the population in the CHARLS. CHARLS, The China Health and Retirement Longitudinal Study; HS, handgrip strength; CST, 5-time chair stand tests; WS, walk speed; ASM, appendicular skeletal muscle mass.
Asian Working Group for Sarcopenia (AWGS) 2019 algorithm was used to evaluate sarcopenia status in the CHARLS, including assessment of muscle mass, muscle strength, and physical performance (1). The muscle mass values, the appendicular skeletal muscle mass (ASM), were imputed using an anthropometric equation (ASM = 0.193 * body weight + 0.107 * height − 4.157 * sex − 0.037 * age − 2.631) mainly validated in Asia populations as described in previous studies (17, 18). The handgrip strength of the dominant hand was recorded by a Yuejian TM WL-1000 dynamometer. The participants carried out the gait speed and five-time chair stand tests, and the methods employed in the CHARLS have been described (15, 17).
From April 2011 to March 2019, all deaths were recorded, and the survival status of the participants was determined during the baseline investigation in 2011–2012, prior to follow-up. Death data were collected from life history surveys conducted in 2013, 2014, 2015, and 2018, with the follow-up period spanning approximately 8 years. The survival status of participants was ascertained through field investigations conducted by interviewers during four separate follow-up periods. Interviewers visited the residences of participants and, in the event of the participant’s death, collected relevant information by interviewing household members who lived with the deceased (19).
Sociodemographic and medical covariable data were extracted from the CHARLS 2011. These variables included age, gender (male or female), marital status (single, married, divorced, or widowed or others), education (elementary school or less, or secondary school or above), dwelling locations (urban or rural), drinking, smoking, and multimorbidity (20). The multimorbidity covariate consisted of self-reported data on 12 medically diagnosed conditions, including hypertension, diabetes, cancer, chronic lung diseases, liver disease, heart disease, stroke, kidney disease, digestive diseases, memory-related diseases, arthritis or rheumatoid arthritis, and asthma (20, 21).
For continuous variables, confidence intervals (CIs) of 95% were supplied, whereas percentage frequencies were provided for categorical variables. To compare continuous and categorical data, t-tests and χ2 were utilized. With the use of logistic regression models, the risk of mortality is determined. The Kaplan–Meier curves are depicted visually. To reduce potential selection bias, propensity score matching (PSM) was utilized to balance covariates between participants with and without sarcopenia or severe sarcopenia. After individual propensity scores were computed using a logistic regression model, the nearest-neighbor matching technique with a caliper width of 0.2 standard deviations of the propensity score was used to pair patients from the lowest hand grip strength (HGS) group with those from other groups. Then, a regression analysis was conducted using the inverse probability of treatment weighting (IPTW) (22). Statistical analyses were carried out using the R software package (http://www.R-project.org, The R Foundation) and the Free Statistics software version 1.7. Statistical significance was determined by a two-sided p-value <0.05.
The Mendelian randomization study was conducted using European populations to examine the causal relationship between sarcopenia and any death. The exposures analyzed were appendicular lean mass, low hand grip strength in those aged 60 years and older, and usual walking pace. Appendicular lean mass data were obtained in 2020 from 205,513 samples genotyped for 18,164,071 single-nucleotide polymorphisms (SNPs) (https://gwas.mrcieu.ac.uk/datasets/ebi-a-GCST90000026/). Low hand grip strength was analyzed in 2021 using 256,523 samples genotyped for 9,336,415 SNPs (https://gwas.mrcieu.ac.uk/datasets/ebi-a-GCST90007526/). The usual walking pace was examined in 2018 with 459,915 samples genotyped for 9,851,867 SNPs (https://gwas.mrcieu.ac.uk/datasets/ukb-b-4711/). The outcome was any cause mortality, analyzed in 2021 with 218,792 samples genotyped for 16,380,466 SNPs (https://gwas.mrcieu.ac.uk/datasets/finn-b-DEATH/). Sample sizes ranged from 205,513 to 459,915; SNPs analyzed spanned 9,336,415 to 18,164,071; years of data collection were from 2018 to 2021 (Supplementary Table 1).
The Mendelian randomization (MR) analysis was conducted employing the inverse variance weighted (IVW) method. The SNP selection process involved several methodologies: a significance threshold of p < 5 × 10⁻⁸ was applied to identify SNPs, achieving genome-wide significance. A threshold of r2 < 0.001 (with a clumping distance of 10,000 kb) was set to exclude SNPs that were in a state of linkage disequilibrium. In addressing potential pleiotropy, the PhenoScanner database was utilized for SNP identification and subsequent exclusion. Weak instrumental variables, as indicated by an F-statistic < 10, were systematically excluded from the analysis. The MR–pleiotropy residual sum and outlier (MR-PRESSO) method was employed before each MR analysis to eliminate potential outliers. Additionally, palindromic SNPs were eliminated through data harmonization between the any death dataset and the exposure dataset. Following this meticulous screening process, the remaining SNPs were retained for subsequent analyses. To validate the findings, alternative methods including MR-Egger, weighted median, and weighted mode were applied alongside IVW. Heterogeneity was assessed using Cochran’s Q test, while pleiotropy was evaluated through MR-Egger intercept testing and leave-one-out analysis. All statistical analyses were conducted using R software (version 4.3.0) for both MR analyses and sensitivity assessments.
The study included 9,006 participants, of which 45.9% were male and 54.1% were female. Among them, 3,892 had no sarcopenia, 3,570 had possible sarcopenia, 1,125 had sarcopenia, and 419 had severe sarcopenia. Over 7 years of follow-up, there were 871 deaths, including 147 without sarcopenia, 395 with possible sarcopenia, 196 with sarcopenia, and 133 with severe sarcopenia (Table 1).

Table 1 The baseline characteristics of the study population in the CHARLS.
The univariate and multivariate logistic regression analyses showed that the risk factors for 7-year mortality were sarcopenia (odds ratios (OR): 1.41, 95% CI, 1.06–1.87), severe sarcopenia (OR = 2.11, 95% CI, 1.51–2.95), age (OR = 1.09, 95% CI, 1.08–1.1), diabetes (OR = 1.51, 95% CI, 1.26 to 1.82), hypertension (OR = 1.31, 95% CI, 1.11 to 1.56), cancer (OR = 4.46, 95% CI, 2.45 to 8.09), stroke (OR = 1.64, 95% CI, 1.13 to 2.38), lung disease (OR = 1.82, 95% CI, 1.45 to 2.28), and memory-related diseases (OR = 2.11, 95% CI, 1.37–3.25) (p < 0.05). The protective factors for 7-year mortality were female (OR = 0.52, 95% CI, 0.43–0.63), married (OR = 0.33, 95% CI, 0.17–0.61), and divorced (OR = 0.46, 95% CI, 0.24–0.9) (p < 0.05) (Table 2).
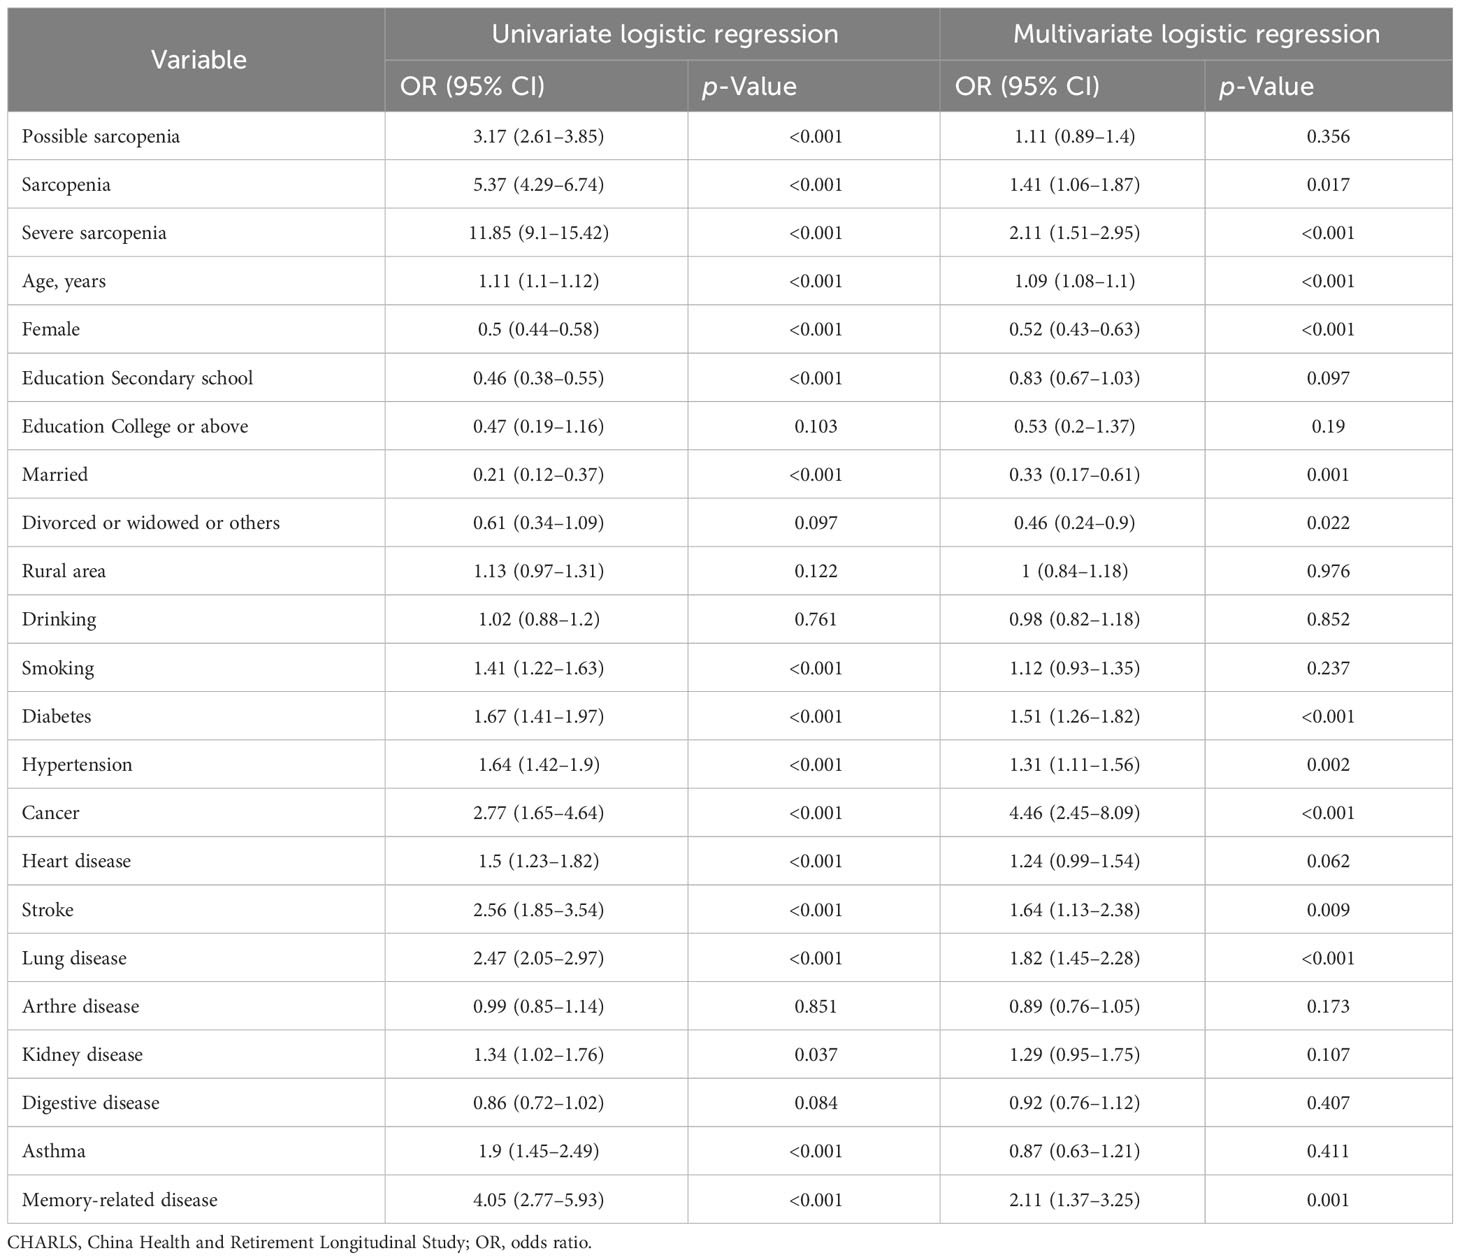
Table 2 Univariate and multivariate logistic analyses of risk factors for 7-year mortality in the CHARLS.
According to the Kaplan–Meier survival curves, sarcopenia and severe sarcopenia had a higher risk of 7-year mortality (Figure 2). The results from logistic regression analyses are presented in Table 2. Compared to no sarcopenia, the unadjusted OR of sarcopenia for 7-year mortality (model 1) was 5.37 (95% CI, 4.29–6.74), whereas for severe sarcopenia, it was 11.85 (95% CI, 9.1–15.42). After adjusting for age and sex (model 2), the OR of sarcopenia and severe sarcopenia for 7-year mortality was 1.41 (95% CI, 1.07–1.85) and 2.2 (95% CI, 1.59–3.05). Further adjusting for age, sex, education level, marriage status, urban area, drinking, and smoking (model 3), the OR of sarcopenia and severe sarcopenia for 7-year mortality was 1.39 (95% CI, 1.06–1.83) and 2.1 (95% CI, 1.51–2.92). Finally, after adjusting for age, body mass index (BMI), education level, marriage status, urban area, drinking, smoking, diabetes, hypertension, cancer, heart disease, stroke, lung disease, Arthre disease, liver disease, kidney disease, digestive disease, asthma, and memory-related disease (model 4), the OR of sarcopenia and severe sarcopenia for 7-year mortality was 1.41 (95% CI, 1.06–1.87) and 2.11 (95% CI, 1.51–2.95). All of the unadjusted and adjusted ORs of sarcopenia and severe sarcopenia were statistically significant (p < 0.05). The unadjusted OR of possible sarcopenia for the 7-year mortality was 3.17 (2.61–3.85) with a statistical difference (p < 0.05), but the adjusted OR was 1.11–1.23 without a statistical difference (p > 0.05) (Table 3).
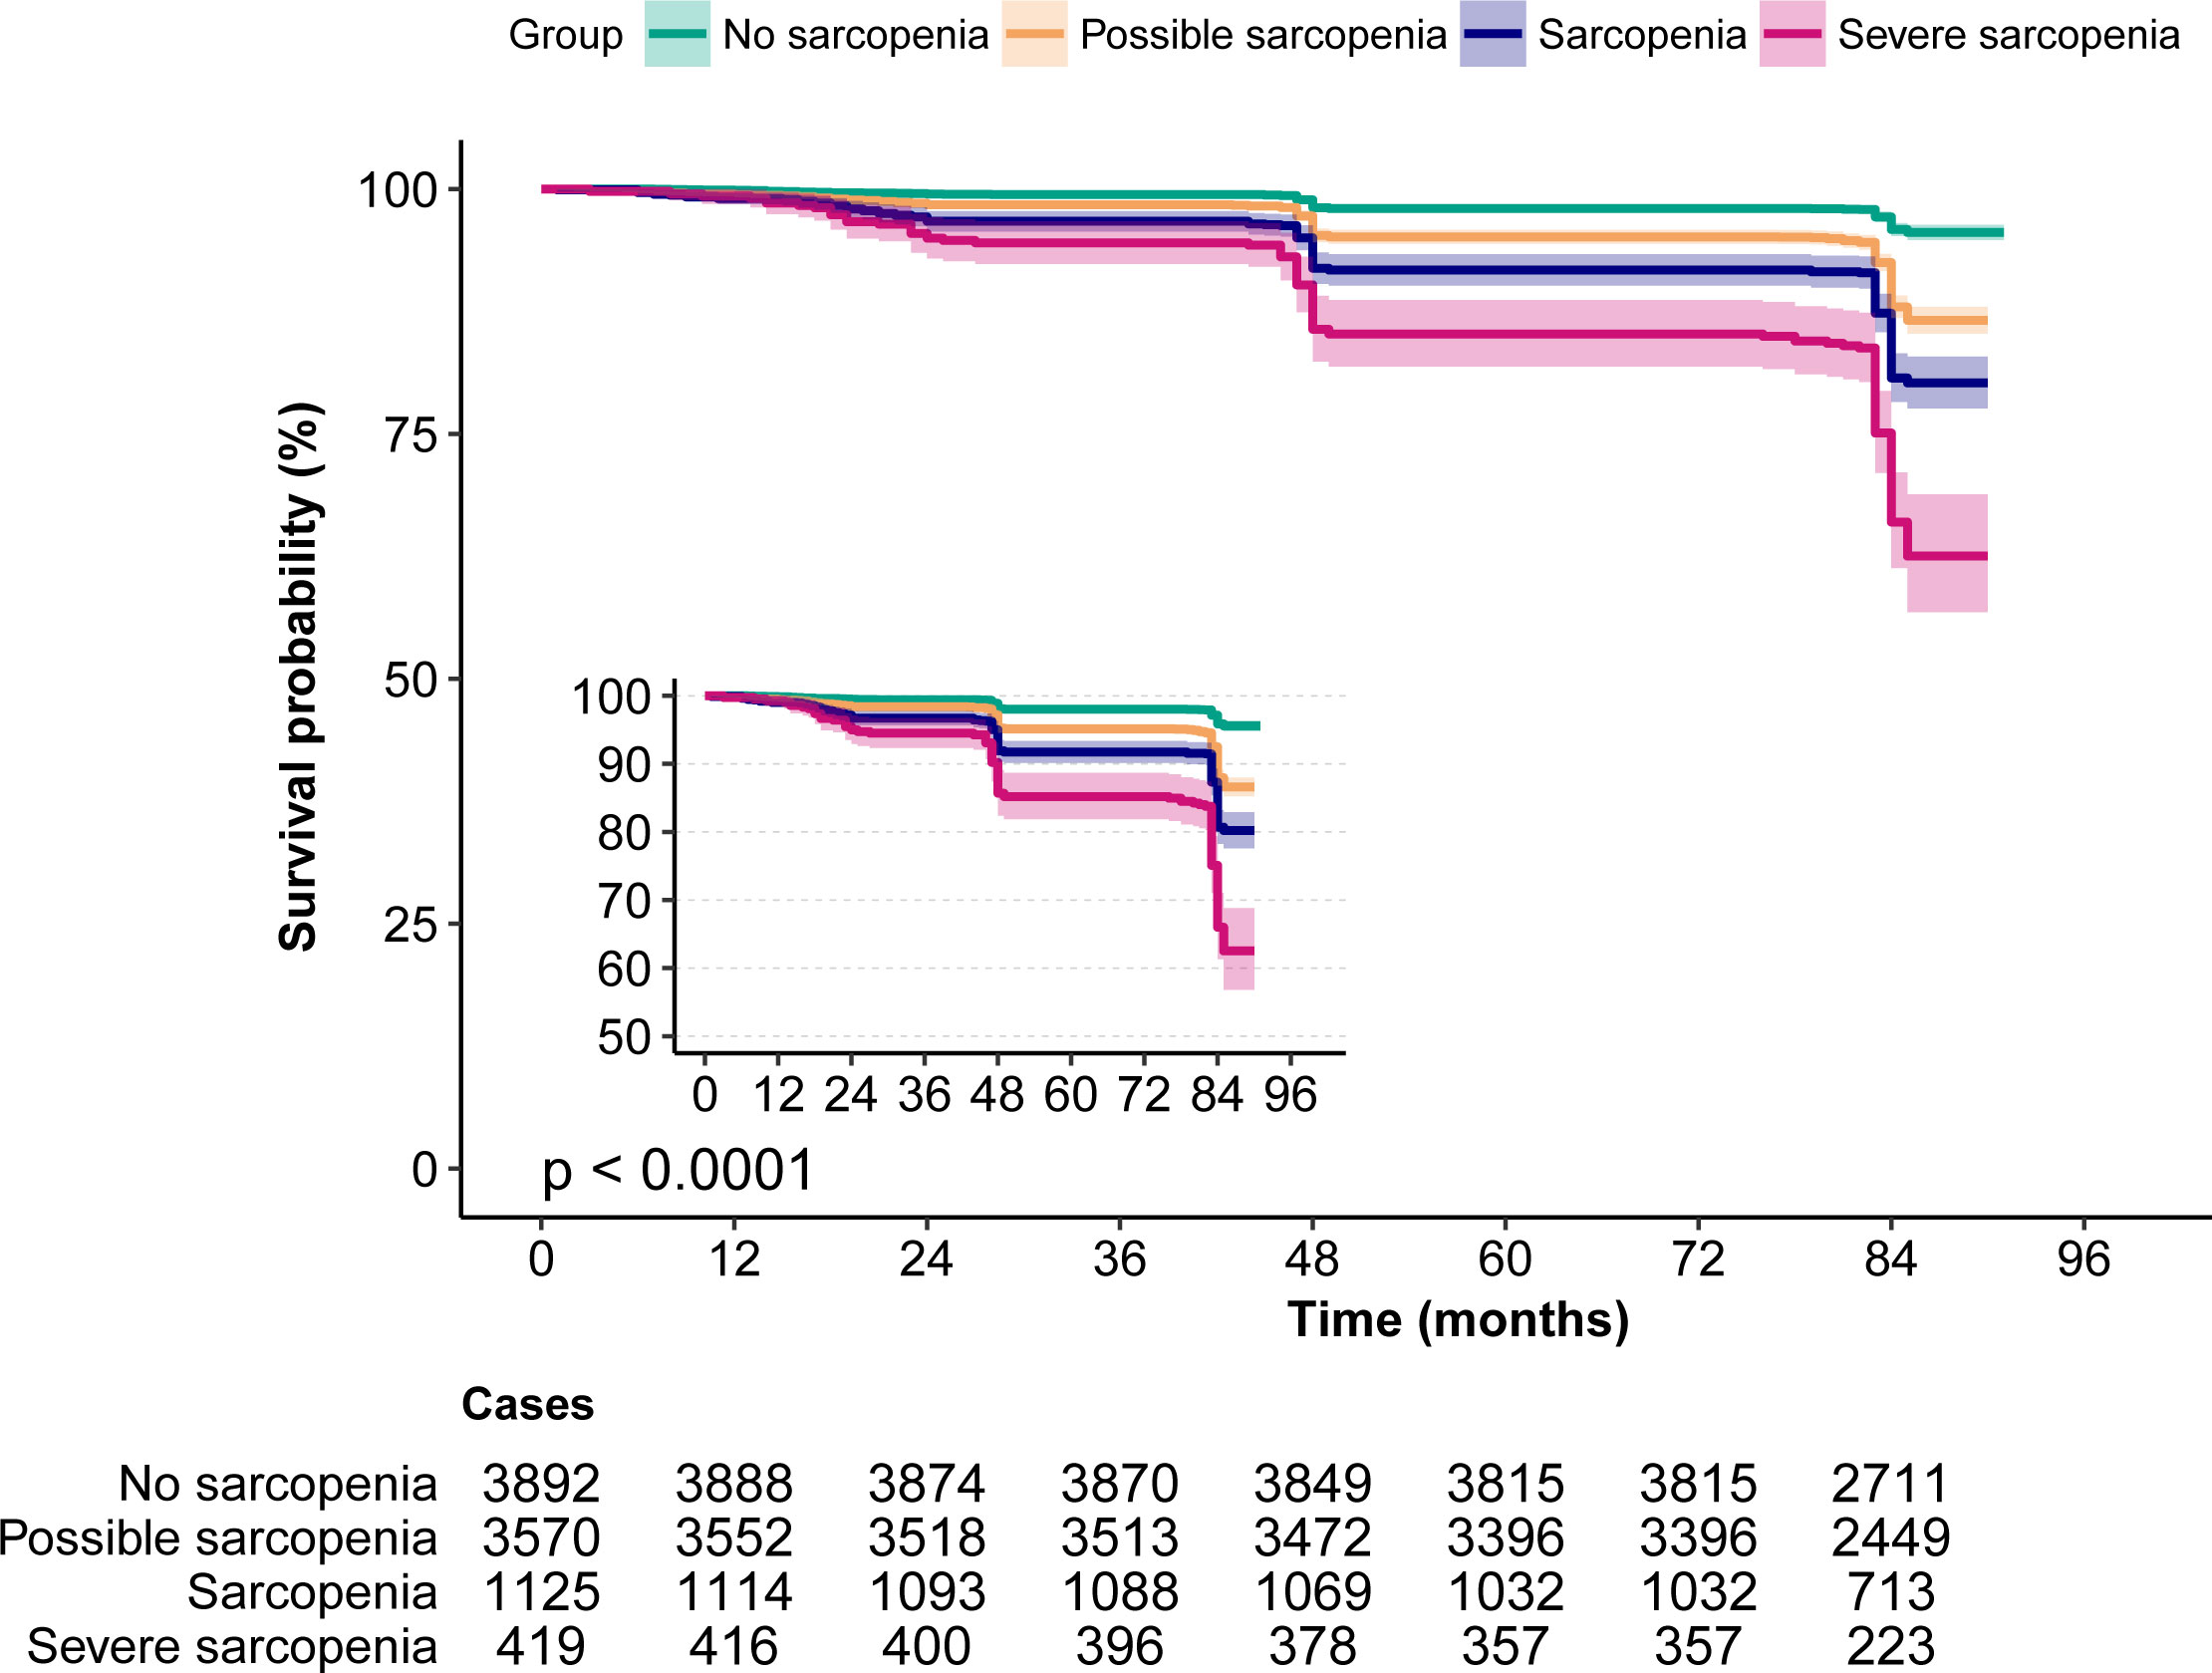
Figure 2 The Kaplan–Meier survival curves for sarcopenia associated with all-cause mortality risk. Note the small Kaplan–Meier graph on the left and its enlarged view.
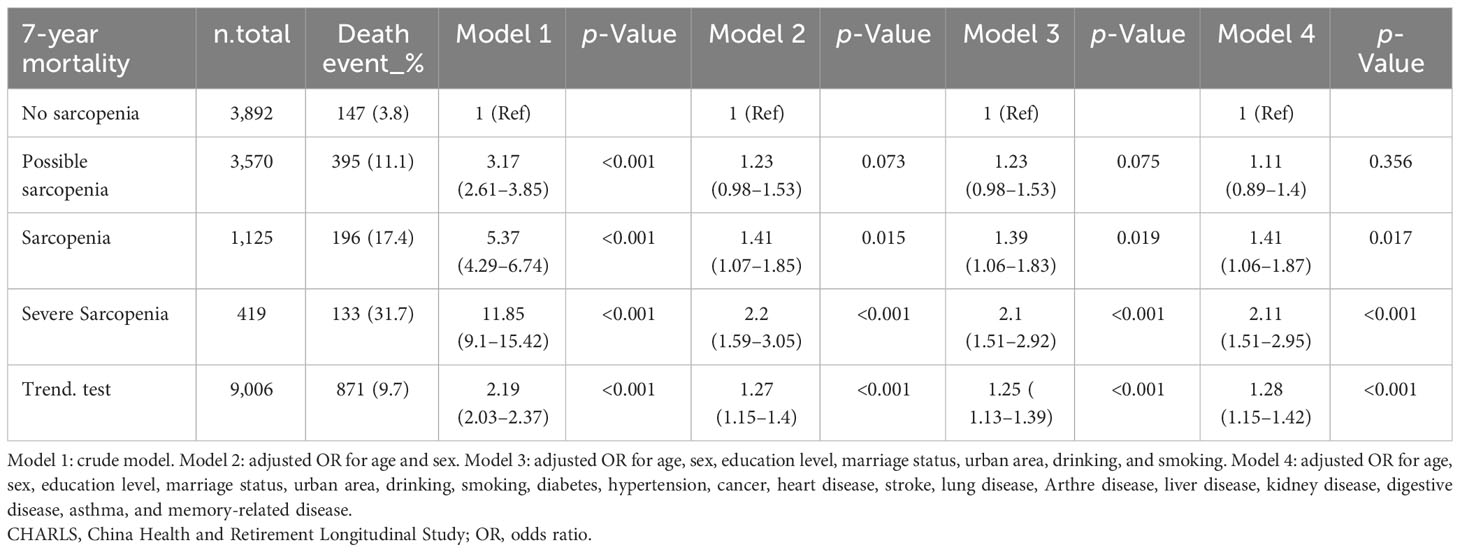
Table 3 Association of sarcopenia with 7-year mortality in the CHARLS.
Over a 7-year follow-up period, stratified analysis by age revealed that among individuals aged <45 years, there were 218 cases (4 deaths) of no sarcopenia, 43 cases (0 deaths) of possible sarcopenia, 3 cases (0 deaths) of sarcopenia, and 1 case (0 deaths) of severe sarcopenia. Among those aged ≥45 and <60 years, there were 3,405 cases (112 deaths) of no sarcopenia, 1,182 cases (52 deaths) of possible sarcopenia, 181 cases (14 deaths) of sarcopenia, and 28 cases (3 deaths) of severe sarcopenia. Among those aged ≥60 and <80 years, there were 263 cases (29 deaths) of no sarcopenia, 2,284 cases (317 deaths) of possible sarcopenia, 864 cases (145 deaths) of sarcopenia, and 325 cases (83 deaths) of severe sarcopenia. Among those aged ≥80 years, there were 6 cases (2 deaths) of no sarcopenia, 61 cases (26 deaths) of possible sarcopenia, 77 cases (37 deaths) of sarcopenia, and 65 cases (47 deaths) of severe sarcopenia. A statistically significant interaction between age and sarcopenia was observed in individuals aged ≥45 years (p < 0.05), but not in those aged <45 years (p > 0.05). The OR values of sarcopenia and 7-year mortality were 2.94 (95% CI, 1.6–5.39), 1.72 (95% CI, 1.11–2.68), and 5.03 (95% CI, 0.48–52.65) in the 45–60, 60–80, and ≥80 age groups, respectively. The OR values of severe sarcopenia and 7-year mortality were 6.92 (95% CI, 1.95–24.5), 2.59 (95% CI, 1.61–4.17), and 12.52 (95% CI, 1.18–133.18) in the 45–60, 60–80, and ≥80 age groups, respectively (Table 4).
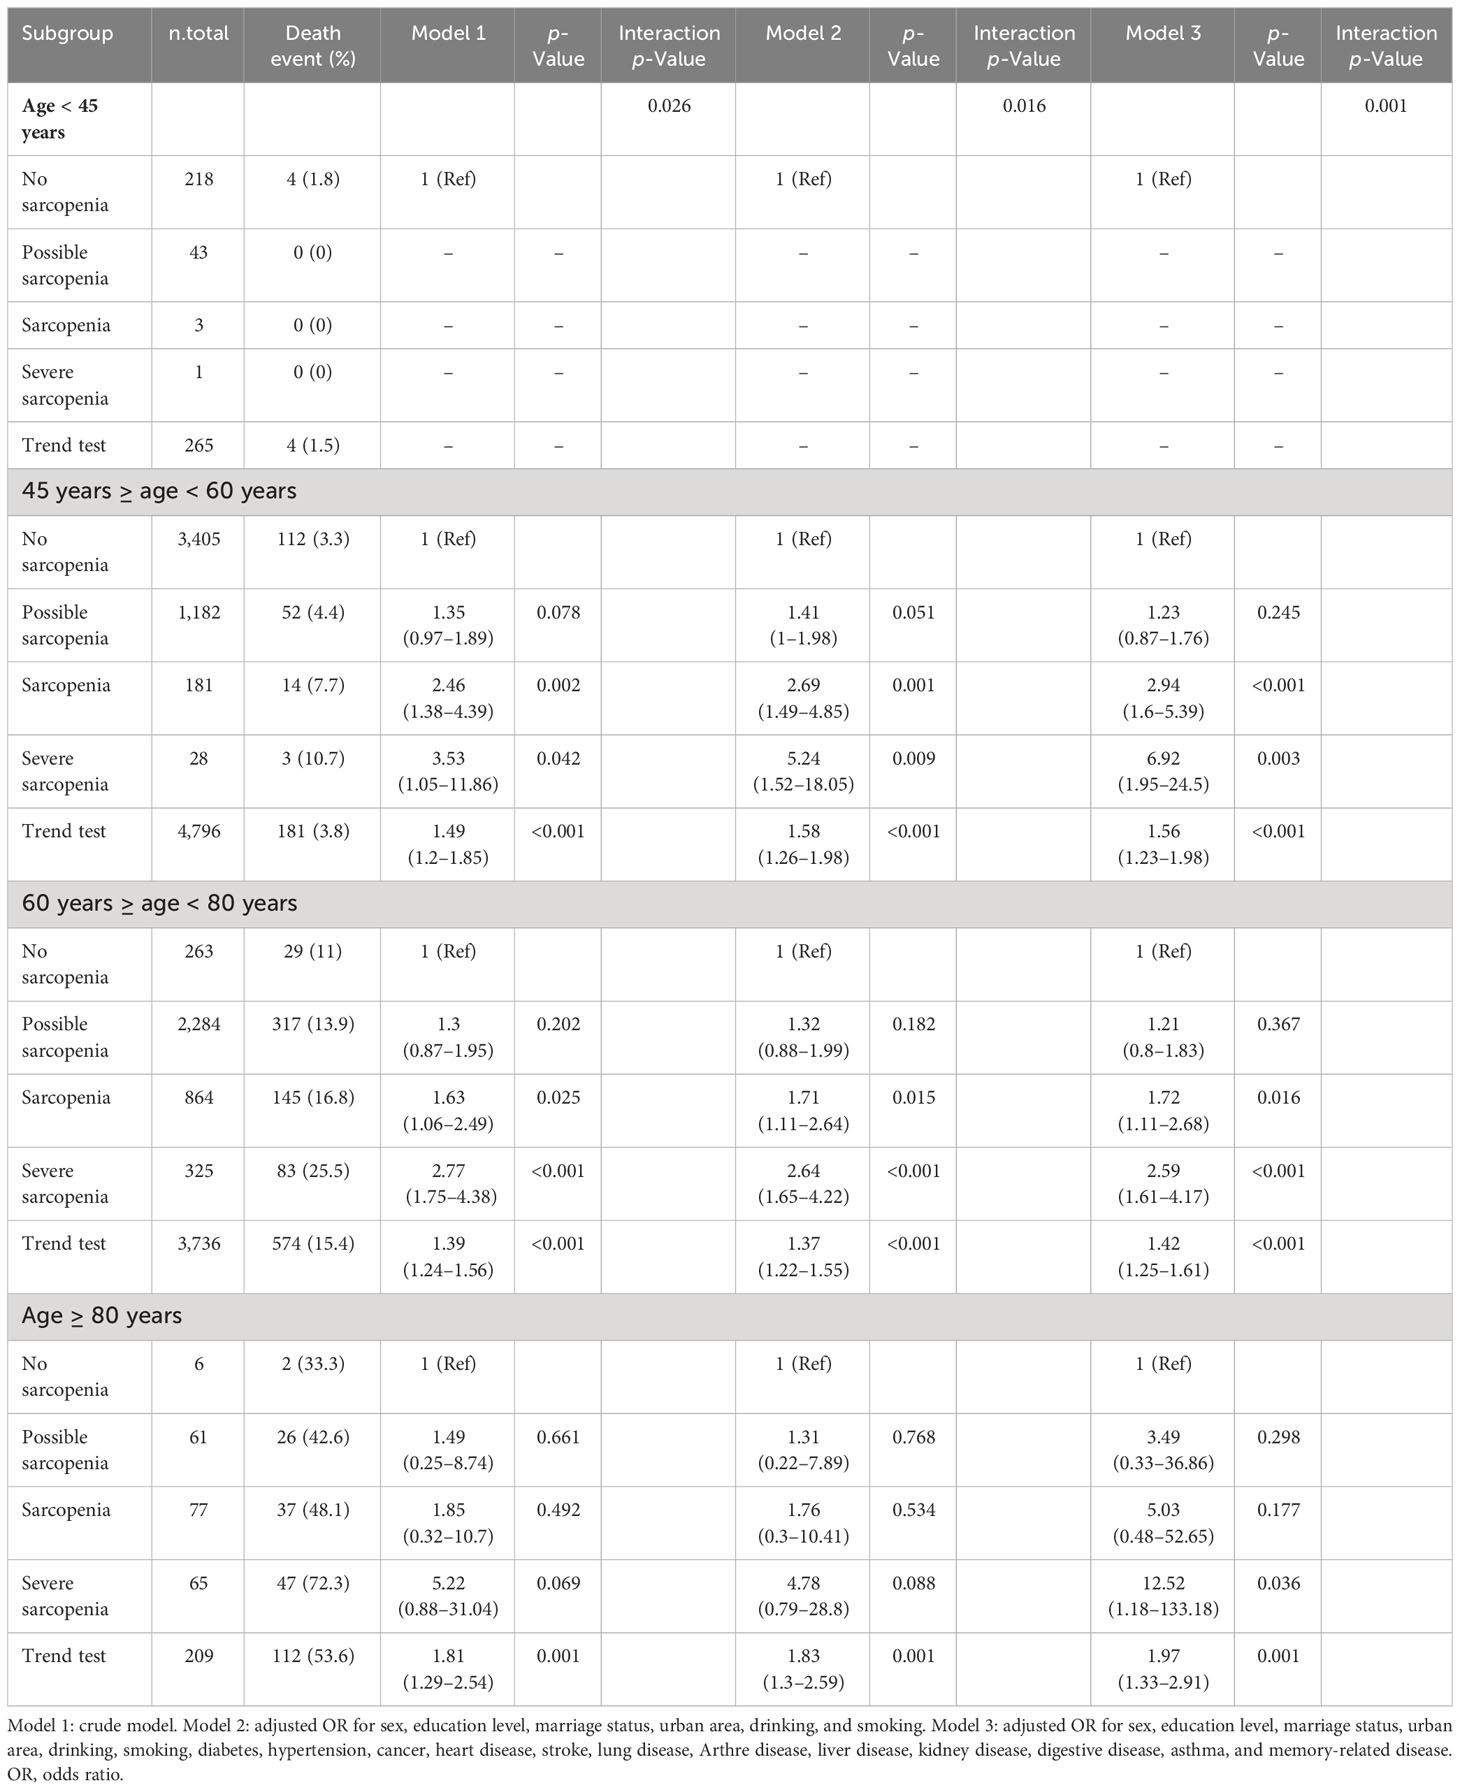
Table 4 Subgroup analysis stratified by age of the association between sarcopenia and 7-year mortality.
The sarcopenia and severe sarcopenia were matched as separate groups for propensity score matching. The baseline characteristics before and after propensity score matching are shown in Supplementary Table 2. In both sarcopenia and severe sarcopenia, there were significantly higher OR for 7-year mortality by PSM and IPTW analyses (p < 0.05). Before PSM, the unmatched crude ORs for 7-year mortality were 3.46 (2.98–4.02) for sarcopenia and 4.95 (3.97–6.16) for severe sarcopenia, whereas the multivariable ORs were 1.46 (1.21–1.76) for sarcopenia and 1.74 (1.35–2.24) for severe sarcopenia. After propensity score matching, the ORs for 7-year mortality were 1.33 (1.09–1.63) for sarcopenia and 1.7 (1.25–2.32) for severe sarcopenia. After the inverse probability of treatment weighting regression analysis, the ORs for 7-year mortality were 1.77 (1.49–2.09) and 2.28 (1.69–3.07) for sarcopenia and severe sarcopenia, respectively (Figure 3).
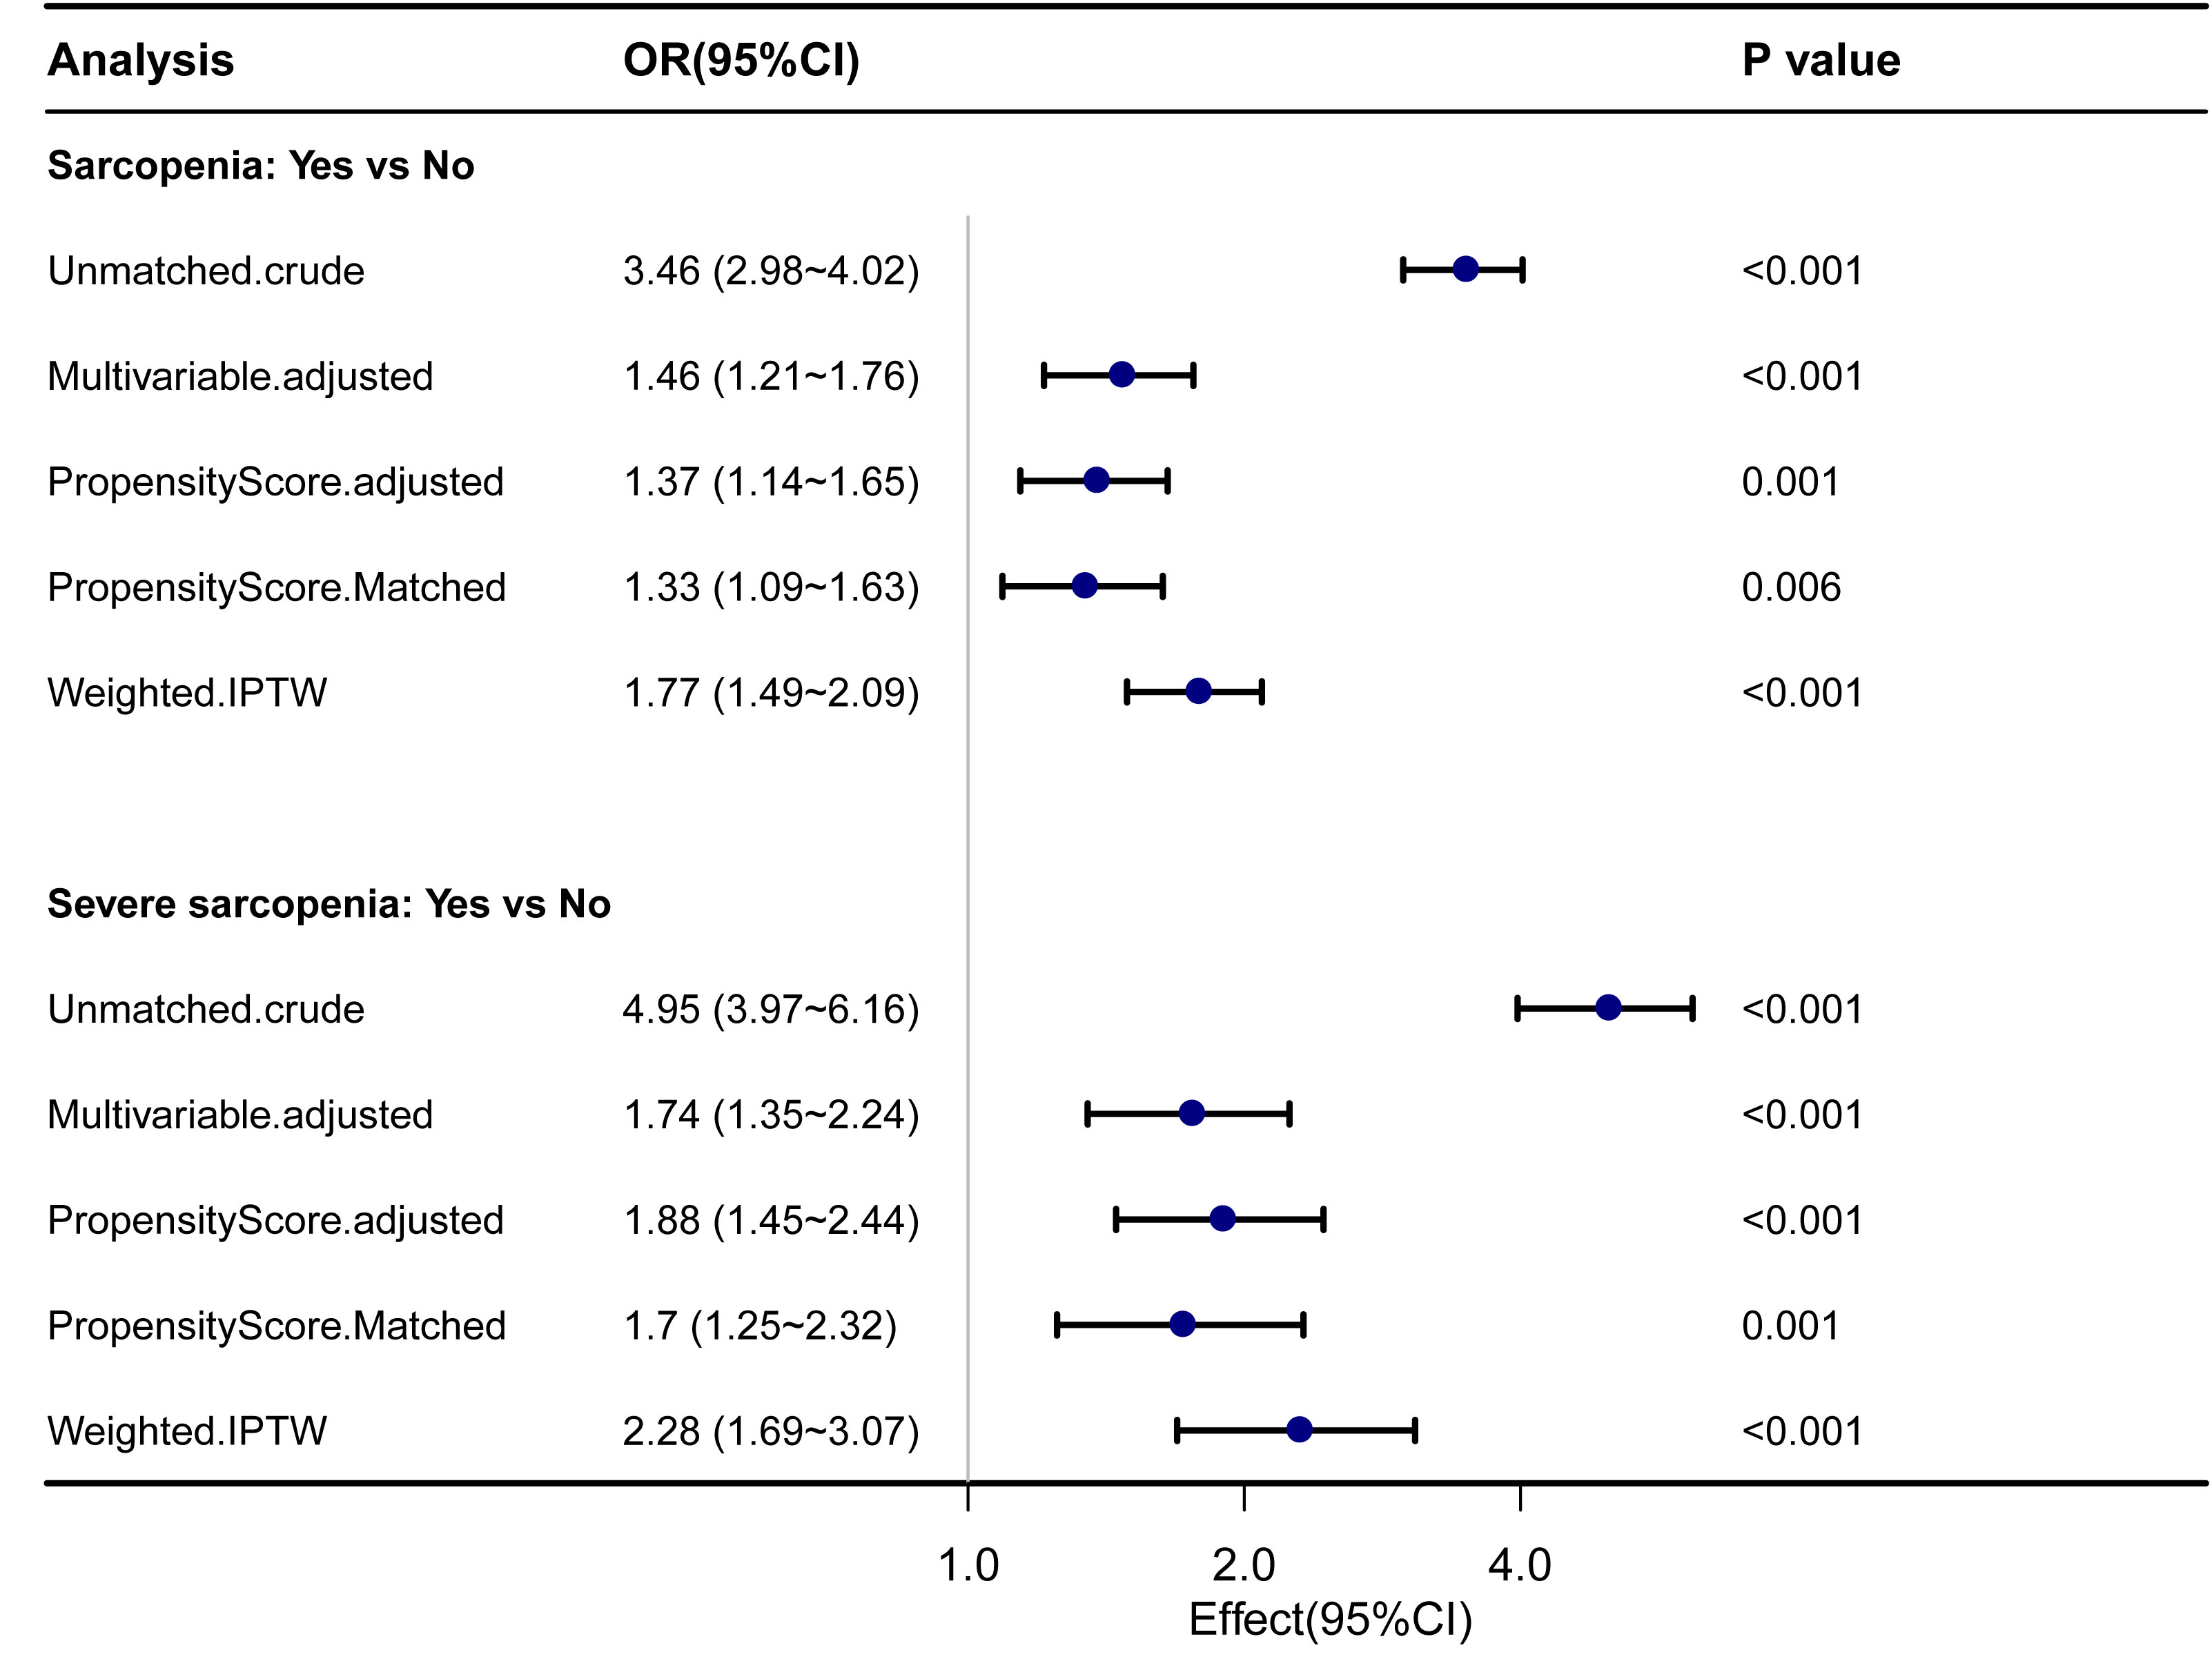
Figure 3 Forest plot shows ORs of all-cause mortality in participants with sarcopenia and severe sarcopenia using propensity score matching analysis. IPTW, the inverse probability of treatment weighting regression analysis; ORs, odds ratios.
This study examined the role of appendicular lean mass, a key component of sarcopenia, in relation to any death. Analyzing 283 SNPs with MR methods, we found significant results with the MR-Egger method (OR = 1.261, 95% CI, 1.056–1.507, p = 0.011). The weighted median method resulted in an OR of 0.948 (95% CI, 0.850–1.058, p = 0.341), while the IVW method resulted in an OR of 0.954 (95% CI, 0.892–1.021, p = 0.176). Heterogeneity (p > 0.05) and potential pleiotropy (p < 0.05) were assessed (Supplementary Figures 1–4 and Table 5).
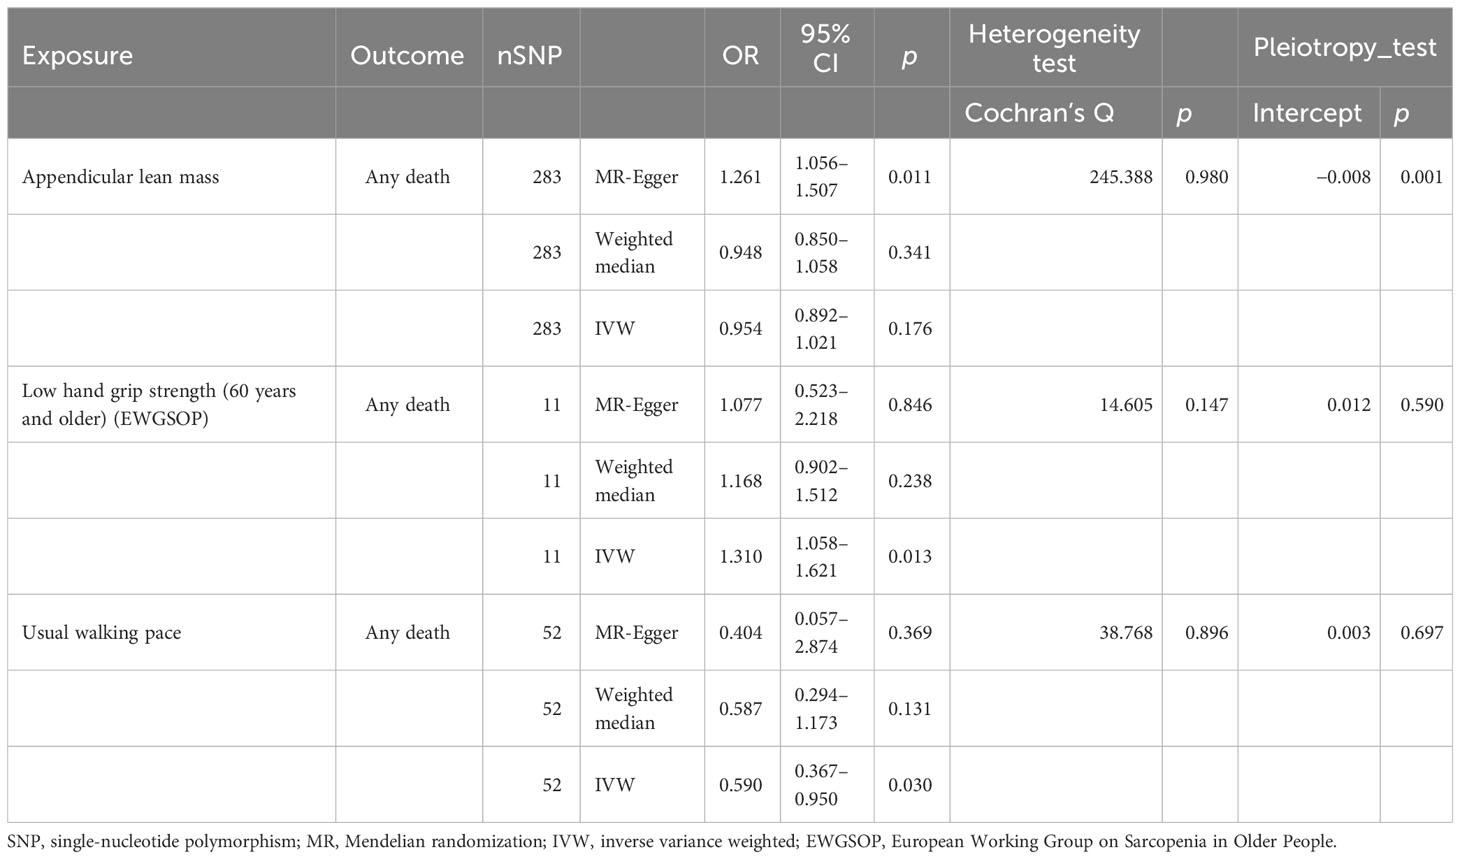
Table 5 The causal association between sarcopenia and risk of any death.
In our analysis of the impact of low hand grip strength on any death in individuals aged 60 and older (defined by the European Working Group on Sarcopenia in Older People (EWGSOP) criteria), we employed MR with a dataset of 11 SNPs. The IVW method demonstrated a significant association (OR = 1.310, 95% CI, 1.058–1.621, p = 0.013) between low hand grip strength and any death. Subsequently, the MR-Egger method showed an OR of 1.077 (95% CI, 0.523–2.218, p = 0.846), and the weighted median method yielded an OR of 1.168 (95% CI, 0.902–1.512, p = 0.238). Importantly, there was minimal evidence of heterogeneity (p > 0.05), and no substantial pleiotropy was observed (p > 0.05) (Supplementary Figures 5–8 and Table 5).
Examining the influence of the usual walking pace, another integral component of sarcopenia, on any death, 52 SNPs were analyzed using MR methods. The IVW method indicated a significant association (OR = 0.590, 95% CI, 0.367–0.950, p = 0.030) between the usual walking pace and any death. In contrast, the MR-Egger method did not reveal a statistically significant effect on mortality (OR = 0.404, 95% CI, 0.057–2.874, p = 0.369), and the weighted median method yielded an OR of 0.587 (95% CI, 0.294–1.173, p = 0.131). Similar to the previous exposure, minimal evidence of heterogeneity (p > 0.05) was observed, and no substantial pleiotropy was detected (p > 0.05) (Supplementary Figures 9–12 and Table 5).
In summary, these findings reveal associations between sarcopenia components (appendicular lean mass, low hand grip strength, and usual walking pace) and mortality risk.
Our study employed a multifaceted approach by combining longitudinal data from the CHARLS cohort with MR analysis to explore the complex relationships between various components of sarcopenia (appendicular lean mass, low hand grip strength, and usual walking pace) and mortality risk in older adults.
In this study, the prevalence of sarcopenia and severe sarcopenia in our study was 12.5% and 4.7%, respectively, which is consistent with previous studies in China. Our results showed that sarcopenia and severe sarcopenia were associated with a higher risk of 7-year mortality, even after adjusting for several potential confounding factors, consistent with previous studies conducted in other populations (7, 9, 23). Compared to participants without sarcopenia, those with sarcopenia had a 41% higher risk of mortality. Moreover, the risk of mortality was even higher for participants with severe sarcopenia, with a 111% higher risk than those without sarcopenia. This highlights the importance of early detection and intervention for sarcopenia before it progresses to a more severe stage.
Our study also identified several risk factors for mortality, including age, chronic diseases (such as diabetes, hypertension, cancer, stroke, lung disease, and memory-related diseases), and male gender. The association between sarcopenia and mortality risk is more pronounced in older age groups, with the highest risk observed in individuals aged ≥80 years. These findings are consistent with previous studies that have reported an association between these factors and mortality risk (8, 12, 24, 25).
To account for potential confounding by chronic diseases and age, we used propensity score matching, which confirmed the significant association between sarcopenia and mortality risk. While previous research has also utilized this approach, it has mainly focused on examining the relationship between sarcopenia and mortality in the context of a single disease. For instance, Lin et al. demonstrated that patients with both type 2 diabetes and sarcopenia were at higher risk for mortality than those without sarcopenia (13). Similarly, Bang et al. found that sarcopenia was associated with an increased incidence of postoperative acute kidney injury and overall mortality in patients undergoing surgery for abdominal aortic aneurysms (14). Furthermore, several studies have investigated the impact of sarcopenia on postoperative outcomes in cancer patients (11, 26). After utilizing propensity score matching to account for potential confounding factors, the association between sarcopenia and mortality risk remained significant. This underscores the importance of screening for sarcopenia in older adults and implementing age-specific interventions to address associated health risks.
Furthermore, our MR analysis introduced a causal dimension to this association. While MR results did not uniformly establish causal relationships between all sarcopenia components and mortality, they offered valuable insights. Importantly, the MR analysis using the IVW method demonstrated a significant causal association between low hand grip strength in individuals aged 60 and older and mortality risk. Additionally, the MR analysis using the IVW method of walking pace provided further support for this causal relationship. This highlights the importance of muscle strength as a key factor influencing healthy aging and longevity. However, the MR-Egger and weighted median methods did not provide supportive evidence, indicating potential complexities in this relationship and emphasizing the need for further investigation. Meanwhile, the MR analysis did not establish a significant causal relationship between appendicular lean mass and mortality risk. This discrepancy may warrant further exploration, considering the complexity of measuring muscle mass and the multifaceted nature of sarcopenia. It is possible that muscle quality and function, rather than muscle mass alone, play a more critical role in influencing mortality risk. These subtle differences underscore the need for ongoing research to elucidate underlying mechanisms.
Sarcopenia’s impact on mortality extends beyond physical frailty, encompassing a range of physiological and metabolic changes (8). One critical aspect is the increased risk of falls and fractures among individuals with reduced muscle mass and strength (27, 28). These incidents can trigger a chain reaction, leading to complications like infections, immobility, and secondary muscle loss, ultimately contributing to mortality (7, 8, 28). Chronic inflammation, hormonal shifts, and malnutrition are pivotal factors linking sarcopenia to mortality (25, 29). They can initiate or worsen various chronic diseases, significantly elevating the risk of premature death (10, 13). Strategies aimed at managing chronic diseases, reducing inflammation, optimizing hormone levels, and ensuring adequate nutrition can collectively improve the overall wellbeing of sarcopenic individuals, potentially reducing their mortality risk.
Our study has several strengths, including a large sample size, a longitudinal design, and the use of standardized diagnostic criteria for sarcopenia. Additionally, the inclusion of Mendelian randomization analysis, employing multiple methods such as IVW, MR-Egger, and weighted median, provided a robust basis for establishing causal links between sarcopenia components and mortality. Finally, rigorous adjustments for sociodemographic and medical covariates were performed to mitigate potential confounding effects. However, our study also has some limitations. First, the diagnosis of sarcopenia was based on a single measurement of muscle mass, strength, and function, which may not accurately reflect the individual’s sarcopenia status over time. Second, we did not have data on the cause of death, which limits our ability to assess the specific causes of mortality associated with sarcopenia. Finally, our study was based on observational data from Chinese adults, and the generalizability of our findings to other populations may be limited. Additionally, while efforts were made to address pleiotropy, the presence of residual pleiotropic effects cannot be entirely excluded.
In conclusion, our study demonstrates that sarcopenia and severe sarcopenia are strongly linked to higher mortality risk. Further research should explore interventions to mitigate these risks and enhance outcomes for individuals with sarcopenia.
Publicly available datasets were analyzed in this study. After obtaining permission, the CHARLS data can be found at: https://charls.charlsdata.com/users/profile/index/zh-cn.html.
The CHARLS is approved by the Biomedical Ethics Review Committee of Peking University, and all participants provide informed consent. The data of the CHARLS are available for free on the Peking University Open Research Data Platform (https://charls.charlsdata.com/). The study used publicly available deidentified data, and informed consent was waived. Based on a publicly accessible database, this study did not require ethical approval or informed consent.
LX: conception of the protocol, data analysis and interpretation, acquisition of the data, statistical analysis and interpretation of the data, and manuscript preparation. TL: manuscript preparation. TG, ZZ, SW, XHW, XYW, JZ, PZ, YL, and LL: study concept and design and interpretation of the results. GY, YL, LL, JZ, and PZ: revision of the manuscript. SY, LK, and ZL: concept and design, final drafting of the manuscript, and study supervision. All authors agreed to be fully accountable for ensuring the integrity and accuracy of the work. All authors contributed to the article and approved the submitted version.
This research was supported by grants from the Science and Technology Planning Project of Shenzhen City, Guangdong Province, China (Nos. KCXFZ20201221173600001 and JCYJ20220818102605013).
Thanks to the CHARLS research team and all respondents for their time and efforts. We thank the Free Statistics team for providing technical assistance and valuable data analysis and visualization tools.
The authors declare that the research was conducted in the absence of any commercial or financial relationships that could be construed as a potential conflict of interest.
All claims expressed in this article are solely those of the authors and do not necessarily represent those of their affiliated organizations, or those of the publisher, the editors and the reviewers. Any product that may be evaluated in this article, or claim that may be made by its manufacturer, is not guaranteed or endorsed by the publisher.
The Supplementary Material for this article can be found online at: https://www.frontiersin.org/articles/10.3389/fendo.2023.1215512/full#supplementary-material
Supplementary Figure 1 | The scatter plot of Appendicular Lean Mass on any death.
Supplementary Figure 2 | The forest plot of Appendicular Lean Mass on any death.
Supplementary Figure 3 | The leaveoneout plot of Appendicular Lean Mass on any death.
Supplementary Figure 4 | The funnel plot of Appendicular Lean Mass on any death.
Supplementary Figure 5 | The scatter plot of Low Hand Grip Strength (60 years and older) on any death.
Supplementary Figure 6 | The forest plot of Low Hand Grip Strength (60 years and older) on any death.
Supplementary Figure 7 | The leaveoneout plot of Low Hand Grip Strength (60 years and older) on any death.
Supplementary Figure 8 | The funnel plot of Low Hand Grip Strength (60 years and older) on any death.
Supplementary Figure 9 | The scatter plot of the Usual Walking Pace on any death.
Supplementary Figure 10 | The forest plot of the Usual Walking Pace on any death.
Supplementary Figure 11 | The leaveoneout plot of the Usual Walking Pace on any death.
Supplementary Figure 12 | The funnel plot of the Usual Walking Pace on any death.
1. Chen LK, Woo J, Assantachai P, Auyeung TW, Chou MY, Iijima K, et al. Asian working group for sarcopenia: 2019 consensus update on sarcopenia diagnosis and treatment. J Am Med Dir Assoc (2020) 21:300–7. doi: 10.1016/j.jamda.2019.12.012
2. Chen F, Xu S, Wang Y, Chen F, Cao L, Liu T, et al. Risk factors for sarcopenia in the elderly with type 2 diabetes mellitus and the effect of metformin. J Diabetes Res (2020) 2020:3950404. doi: 10.1155/2020/3950404
3. Zhang X, Huang P, Dou Q, Wang C, Zhang W, Yang Y, et al. Falls among older adults with sarcopenia dwelling in nursing home or community: A meta-analysis. Clin Nutr (2020) 39:33–9. doi: 10.1016/j.clnu.2019.01.002
4. Cruz-Jentoft AJ, Sayer AA. Sarcopenia. Lancet (2019) 393:2636–46. doi: 10.1016/S0140-6736(19)31138-9
5. Larsson L, Degens H, Li M, Salviati L, Lee YI, Thompson W, et al. Sarcopenia: Aging-related loss of muscle mass and function. Physiol Rev (2019) 99:427–511. doi: 10.1152/physrev.00061.2017
6. Wilkinson TJ, Miksza J, Yates T, Lightfoot CJ, Baker LA, Watson EL, et al. Association of sarcopenia with mortality and end-stage renal disease in those with chronic kidney disease: a UK Biobank study. J Cachexia Sarcopenia Muscle (2021) 12:586–98. doi: 10.1002/jcsm.12705
7. Kitamura A, Seino S, Abe T, Nofuji Y, Yokoyama Y, Amano H, et al. Sarcopenia: prevalence, associated factors, and the risk of mortality and disability in Japanese older adults. J Cachexia Sarcopenia Muscle (2021) 12:30–8. doi: 10.1002/jcsm.12651
8. Koon-Yee LG, Chun-Ming AP, Hoi-Yee LG, Chan M, Li HL, Man-Yung CB, et al. Sarcopenia and mortality in different clinical conditions: A meta-analysis. Osteoporos Sarcopenia (2021) 7:S19–27. doi: 10.1016/j.afos.2021.02.001
9. Xu J, Wan CS, Ktoris K, Reijnierse EM, Maier AB. Sarcopenia is associated with mortality in adults: A systematic review and meta-analysis. Gerontology (2022) 68:361–76. doi: 10.1159/000517099
10. Angulo J, El AM, Rodriguez-Manas L. Frailty and sarcopenia as the basis for the phenotypic manifestation of chronic diseases in older adults. Mol Aspects Med (2016) 50:1–32. doi: 10.1016/j.mam.2016.06.001
11. Okugawa Y, Toiyama Y, Yamamoto A, Shigemori T, Yin C, Narumi A, et al. Clinical impact of muscle quantity and quality in colorectal cancer patients: A propensity score matching analysis. JPEN J Parenter Enteral Nutr (2018) 42:1322–33. doi: 10.1002/jpen.1171
12. Sanchez-Tocino ML, Miranda-Serrano B, Lopez-Gonzalez A, Villoria-Gonzalez S, Pereira-Garcia M, Gracia-Iguacel C, et al. Sarcopenia and mortality in older hemodialysis patients. Nutrients (2022) 14:2354. doi: 10.3390/nu14112354
13. Lin JA, Hou JD, Wu SY. Effect of sarcopenia on mortality in type 2 diabetes: A long-term follow-up propensity score-matched diabetes cohort study. J Clin Med (2022) 11:4424. doi: 10.3390/jcm11154424
14. Bang JY, Jun IG, Lee JB, Ko YS, Kim KW, Jeong JH, et al. Impact of sarcopenia on acute kidney injury after infrarenal abdominal aortic aneurysm surgery: A propensity matching analysis. Nutrients (2021) 13:2212. doi: 10.3390/nu13072212
15. Gao K, Cao LF, Ma WZ, Gao YJ, Luo MS, Zhu J, et al. Association between sarcopenia and cardiovascular disease among middle-aged and older adults: Findings from the China health and retirement longitudinal study. EClinicalMedicine (2022) 44:101264. doi: 10.1016/j.eclinm.2021.101264
16. Zhao Y, Hu Y, Smith JP, Strauss J, Yang G. Cohort profile: the China health and retirement longitudinal study (CHARLS). Int J Epidemiol (2014) 43:61–8. doi: 10.1093/ije/dys203
17. Wu X, Li X, Xu M, Zhang Z, He L, Li Y. Sarcopenia prevalence and associated factors among older Chinese population: Findings from the China Health and Retirement Longitudinal Study. PLoS One (2021) 16:e247617. doi: 10.1371/journal.pone.0247617
18. Wen X, Wang M, Jiang CM, Zhang YM. Anthropometric equation for estimation of appendicular skeletal muscle mass in Chinese adults. Asia Pac J Clin Nutr (2011) 20:551–6.
19. Wang Y, Liu Y, Hu J, Guan H, Wang Y, Liu M, et al. Association of handgrip strength with all-cause mortality: a nationally longitudinal cohort study in China. J Sci Med Sport (2022) 25:878–83. doi: 10.1016/j.jsams.2022.08.005
20. Gao K, Ma WZ, Huck S, Li BL, Zhang L, Zhu J, et al. Association between sarcopenia and depressive symptoms in chinese older adults: Evidence from the China health and retirement longitudinal study. Front Med (Lausanne) (2021) 8:755705. doi: 10.3389/fmed.2021.755705
21. Beard JR, Si Y, Liu Z, Chenoweth L, Hanewald K. Intrinsic capacity: Validation of a new WHO concept for healthy aging in a longitudinal chinese study. J Gerontol A Biol Sci Med Sci (2022) 77:94–100. doi: 10.1093/gerona/glab226
22. Austin PC, Stuart EA. Moving towards best practice when using inverse probability of treatment weighting (IPTW) using the propensity score to estimate causal treatment effects in observational studies. Stat Med (2015) 34:3661–79. doi: 10.1002/sim.6607
23. Shu X, Lin T, Wang H, Zhao Y, Jiang T, Peng X, et al. Diagnosis, prevalence, and mortality of sarcopenia in dialysis patients: a systematic review and meta-analysis. J Cachexia Sarcopenia Muscle (2022) 13:145–58. doi: 10.1002/jcsm.12890
24. Sepulveda-Loyola W, Osadnik C, Phu S, Morita AA, Duque G, Probst VS. Diagnosis, prevalence, and clinical impact of sarcopenia in COPD: a systematic review and meta-analysis. J Cachexia Sarcopenia Muscle (2020) 11:1164–76. doi: 10.1002/jcsm.12600
25. Uchida T, Sekine R, Matsuo K, Kigawa G, Umemoto T, Tanaka K. Benefit of laparoscopic compared to standard open gastric cancer surgery for sarcopenic patients: a propensity score-matching analysis. Surg Endosc (2022) 36:9244–53. doi: 10.1007/s00464-022-09416-2
26. Lunt E, Ong T, Gordon AL, Greenhaff PL, Gladman J. The clinical usefulness of muscle mass and strength measures in older people: a systematic review. Age Ageing (2021) 50:88–95. doi: 10.1093/ageing/afaa123
27. Zhong BX, Zhong HL, Zhou GQ, Xu WQ, Lu Y, Zhao Q. Physical performance and risk of hip fracture in community-dwelling elderly people in China: A 4-year longitudinal cohort study. Maturitas (2021) 146:26–33. doi: 10.1016/j.maturitas.2021.01.003
28. Yates T, Zaccardi F, Dhalwani NN, Davies MJ, Bakrania K, Celis-Morales CA, et al. Association of walking pace and handgrip strength with all-cause, cardiovascular, and cancer mortality: a UK Biobank observational study. Eur Heart J (2017) 38:3232–40. doi: 10.1093/eurheartj/ehx449
Keywords: the CHARLS, sarcopenia, mortality risk, the propensity score matching, Mendelian randomization
Citation: Xiong L, Liao T, Guo T, Zeng Z, Wang S, Yang G, Wang X, Wang X, Zhu J, Zhao P, Li Y, Li L, Kang L, Yang S and Liang Z (2023) The relationship between sarcopenia and mortality in Chinese community-dwelling adults: a 7-year cohort study with propensity score matching and Mendelian randomization. Front. Endocrinol. 14:1215512. doi: 10.3389/fendo.2023.1215512
Received: 02 May 2023; Accepted: 13 September 2023;
Published: 04 October 2023.
Edited by:
Yannis Dionyssiotis, General University Hospital of Patras, GreeceCopyright © 2023 Xiong, Liao, Guo, Zeng, Wang, Yang, Wang, Wang, Zhu, Zhao, Li, Li, Kang, Yang and Liang. This is an open-access article distributed under the terms of the Creative Commons Attribution License (CC BY). The use, distribution or reproduction in other forums is permitted, provided the original author(s) and the copyright owner(s) are credited and that the original publication in this journal is cited, in accordance with accepted academic practice. No use, distribution or reproduction is permitted which does not comply with these terms.
*Correspondence: Zhen Liang, bGlhbmcuemhlbkBzemhvc3BpdGFsLmNvbQ==; Shu Yang, eWFuZy5zaHVAc3pob3NwdGlhbC5jb20=; Lin Kang, a2FuZy5saW5Ac3pob3NwaXRhbC5jb20=
†These authors have contributed equally to this work
Disclaimer: All claims expressed in this article are solely those of the authors and do not necessarily represent those of their affiliated organizations, or those of the publisher, the editors and the reviewers. Any product that may be evaluated in this article or claim that may be made by its manufacturer is not guaranteed or endorsed by the publisher.
Research integrity at Frontiers
Learn more about the work of our research integrity team to safeguard the quality of each article we publish.