 Zhaoxiang Wang
 Han Qian2†
- 1Department of Endocrinology, Affiliated Kunshan Hospital of Jiangsu University, Kunshan, Jiangsu, China
- 2Department of Cardiology, Affiliated Taicang Hospital of Soochow University, Suzhou, Jiangsu, China
- 3Department of Endocrinology, Affiliated Wujin Hospital of Jiangsu University, Changzhou, Jiangsu, China
Purpose: Triglyceride-glucose (TyG) index is a simple and reliable indicator of metabolic dysfunction. We aimed to investigate a possible relationship between TyG index and albuminuria in the United States adult population.
Methods: This cross-sectional study was conducted among adults with complete TyG index and urinary albumin/urinary creatinine (UACR) from 2011-2018 National Health and Nutrition Examination Survey (NHANES). The independent relationship between TyG index and albuminuria (UACR>30mg/g) was evaluated. TyG index was compared with insulin resistance represented by homeostatic model assessment of insulin resistance (HOMA-IR), and metabolic syndrome. Subgroup analysis was also performed.
Results: A total of 9872 participants were included in this study, and the average TyG index was 8.53 ± 0.01. The proportion of albuminuria gradually increased with the increase of TyG index quartile interval. Elevated TyG index was independently associated with albuminuria, and this association persisted after additional adjustments for HOMA-IR or dichotomous metabolic syndrome. The area under the ROC curve (AUC) of TyG index was larger than that of log (HOMA-IR). Subgroup analysis suggested that the relationship between TyG index and albuminuria is of greater concern in age<60, overweight/obese, diabetic, and metabolic syndrome patients.
Conclusion: The TyG index may be a potential epidemiological tool to quantify the role of metabolic dysfunction, rather than just insulin resistance, in albuminuria in the United States adult population. Further large-scale prospective studies are needed to confirm our findings.
1 Introduction
As a progressive disease, chronic kidney disease (CKD) has become one of the leading causes of death and suffering in the 21st century, affecting more than 10% of the general population worldwide (1). Patients with CKD also present with an increased risk of cardiovascular disease (2). In normal conditions, albumin is excreted in minimal amounts in the urine, making its detection challenging. However, when the glomerular filtration membrane is disrupted, the proteins in the glomerular filtration fluid are increased. In the early stages of glomerulopathy, when a routine urine protein test is negative, urinary microalbumin levels may vary and increase as the disease progresses (3). It is the most sensitive and reliable diagnostic index for early diabetic nephropathy and early hypertensive nephropathy (4, 5). Elevated albuminuria levels are an independent predictor of cardiovascular risk and have shown a strong association with non-alcoholic fatty liver disease (NAFLD) (6–10). Albuminuria is present in up to 40% of diabetic patients and has become an essential screening program for diabetic kidney disease (DKD) and diabetic cardiovascular events (11, 12).
Insulin resistance and metabolic syndrome are strongly associated with albuminuria (13–15). The HOMA-IR index was obtained using the homeostatic model assessment of insulin resistance (16). It is widely utilized in research on the development and progression of metabolic diseases, acting as a commonly employed indicator to evaluate the severity of insulin resistance (17, 18). Metabolic syndrome, defined by a combination of several laboratory and physical examination measures, is a dichotomous approach and thus does not allow for an assessment of the degree of risk (19). TyG index is a measure of metabolic dysfunction calculated from fasting triglyceride (TG, mg/dL) and fasting plasma glucose (FPG, mg/dL) measurements. It was considered a reliable surrogate marker of insulin resistance (20, 21). Multiple studies have indicated that TyG and HOMA-IR exhibit comparable accuracy in measuring insulin resistance when compared to the gold standard hyperinsulinemic-euglycemic clamp (19, 22, 23). Moreover, TyG index performed better than HOMA-IR in the diagnosis of metabolic syndrome (19, 24). NAFLD is a further expression of the metabolic syndrome (25). TyG index also serves as an effective surrogate marker for NAFLD and is associated with the underlying mechanisms of the disease, as well as NAFLD-related pathology, including extrahepatic tumors (26). Previous studies have demonstrated elevated TyG index can predict the progression of coronary artery calcification and the occurrence of adverse cardiovascular events (20, 27).
While several studies have investigated the association between TyG index and albuminuria, most of these studies have been limited to a single population and few have involved the United States population. More importantly, none of these studies considered the effects of insulin resistance and metabolic syndrome (28–31). The purpose of this study was to investigate the association between TyG index and albuminuria in the population of the National Health and Nutrition Examination Survey (NHANES) based on larger sample size. TyG index was compared vs. insulin resistance represented by HOMA-IR, and vs. metabolic syndrome.
2 Materials and methods
2.1 Data source
All the data in this study came from NHANES, which is a research program designed to assess the health and nutrition status of adults and children in the United States administered by the National Center for Health Statistics (NCHS) (32). NHANES has a complex, multistage, probability sampling design that allows it to be generalized to the US population (32). The protocol for the NHANES study was approved by the NCHS Research Ethics Review Board, and its detailed design and data are publicly available at https://www.cdc.gov/nchs/nhanes/. The current study included all participants older than 20 years with complete TyG index, albuminuria, and glomerular filtration rates from NHANES 2011 to 2018 who were in the fasting subsample.
2.2 Outcome definitions
Urinary albumin and creatinine were measured by solid-phase fluorescent immunoassay and modified Jaffe kinetic method, respectively. UACR was calculated by dividing the urinary albumin (mg/dL) concentration by the urinary creatinine concentration (mg/L). UACR was categorized as <30, 30–300, and ≥300mg/g in subgroup analysis. Albuminuria, defined as an UACR>30 mg/g, was considered as an outcome variable in our analysis (33). UACR 30–300 and ≥ 300mg/g correspond to moderately increased albuminuria and severely increased albuminuria, respectively.
2.3 Exposure definitions
TyG index was calculated as ln (fasting triglyceride[mg/dl] × fasting plasma glucose[mg/dl]/2). HOMA-IR was calculated using the following formula: (fasting insulin[µIU/ml] × fasting plasma glucose[mmol/L])/22.5. HOMA-IR was log-transformed for modeling in this study. Metabolic syndrome is defined based on criteria developed jointly by international organizations such as the International Diabetes Federation, the National Heart, Lung and Blood Institute and the American Heart Association (34). Metabolic syndrome includes at least three of the five: elevated waist circumference (WC, cm), hypertension, hyperglycemia, elevated TG and decreased high density lipoprotein cholesterol (HDL-c, mg/dl).
2.4 Covariate definitions
Demographic data (age, gender, and race) was obtained. Some potential covariates were also included in this study, such as smoking status (never/former/current), physical activity (vigorous/moderate/less than moderate), hypertension (yes/no), diabetes (yes/no), cardiovascular disease (yes/no), body mass index (BMI, kg/m2), WC, total cholesterol (TC, mg/dl), HDL-c, low density lipoprotein cholesterol (LDL-c, mg/dl), serum creatinine (Scr, mg/dl), and estimated glomerular filtration rate (eGFR, ml/min/1.73 m2). BMI was categorized as <25, 25-29.9 and ≥30 kg/m2, which corresponded to normal weight, overweight, and obese population for participants. The presence of cardiovascular disease was determined based on self-reported history of heart attack, stroke, congestive heart failure, coronary artery disease, or angina. eGFR was calculated according to the CKD Epidemiology Collaboration (CKD-EPI) creatinine equation consisting of age, gender, race, and Scr (35). Detailed measurement procedures for all variables in this study were publicly available in the NHANES database.
2.5 Statistical analysis
All statistical analyses were performed in accordance with Centers for Disease Control and Prevention (CDC) guidelines. A complex multistage cluster survey design was considered, and fasting subsample weights combined with four cycles were applied. Continuous variables were expressed as weighted mean with standard error (SE), and categorical parameters were presented as proportions. Weighted one-way ANOVA and weighted chi-squared tests were used for multiple-group comparisons of continuous and categorical variables respectively. Logistic and linear models were used to test the association between TyG index (continuous/quartile) and albuminuria and UACR in different models. The variance inflation factor (VIF) was employed to assess the level of collinearity among independent variables (36). The VIF is computed using a multivariate linear regression model. The VIF of each independent variable is equal to 1 divided by (1 − R2), where R2 represents the coefficient of determination obtained by regressing the independent variables on the remaining independent variables. Independent variables with VIF greater than 5 were excluded. In model 1, no covariates were adjusted. In model 2, age, gender, and race were adjusted. Model 3 was adjusted for age, gender, race, smoking status, physical activity, hypertension, diabetes, cardiovascular disease, BMI, Scr, and eGFR. Weighted Pearson correlation analysis was used to evaluate the correlation between TyG index and other parameters. ROC was used to compare TyG index and TyG-derived indices with log (HOMA-IR). Age (<60/≥60 years), gender (female/male), BMI (normal weight/overweight/obese), diabetes (yes/no), hypertension (yes/no), metabolic syndrome (yes/no), cardiovascular disease (yes/no), and eGFR (<60/60-90/≥90ml/min/1.73 m2) were stratified for subgroup analysis. Empower software (http://www.empowerstats.com) and R version 4.1.0 (http://www.R-project.org) were employed for all analyses. P value <0.05 was considered statistically significant.
3 Results
3.1 Baseline characteristics of study population
According to the inclusion criteria, a total of 9872 subjects were included in the study, with an average age of 46.81 ± 0.35 years, including 48.94% male. We compared general information and clinical indicators for subjects in the non-albuminuria, moderately increased albuminuria and severely increased albuminuria groups (Table 1). Compared with non-albuminuria group, age, male, smoking proportion, less than moderate physical activity, hypertension prevalence, diabetes prevalence, cardiovascular disease prevalence, metabolic syndrome prevalence, BMI, WC, FPG, FIns, TG, Scr, urinary albumin, and HOMA-IR were significantly increased in moderately increased albuminuria and severely increased albuminuria groups (P<0.001), and LDL-c, HDL-c, urinary creatinine, and eGFR were decreased (P<0.05). There were also differences in race distribution among groups (P<0.001). Note that TyG levels were higher in the moderately increased albuminuria and severely increased albuminuria groups than in the non-albuminuria group (P<0.001).
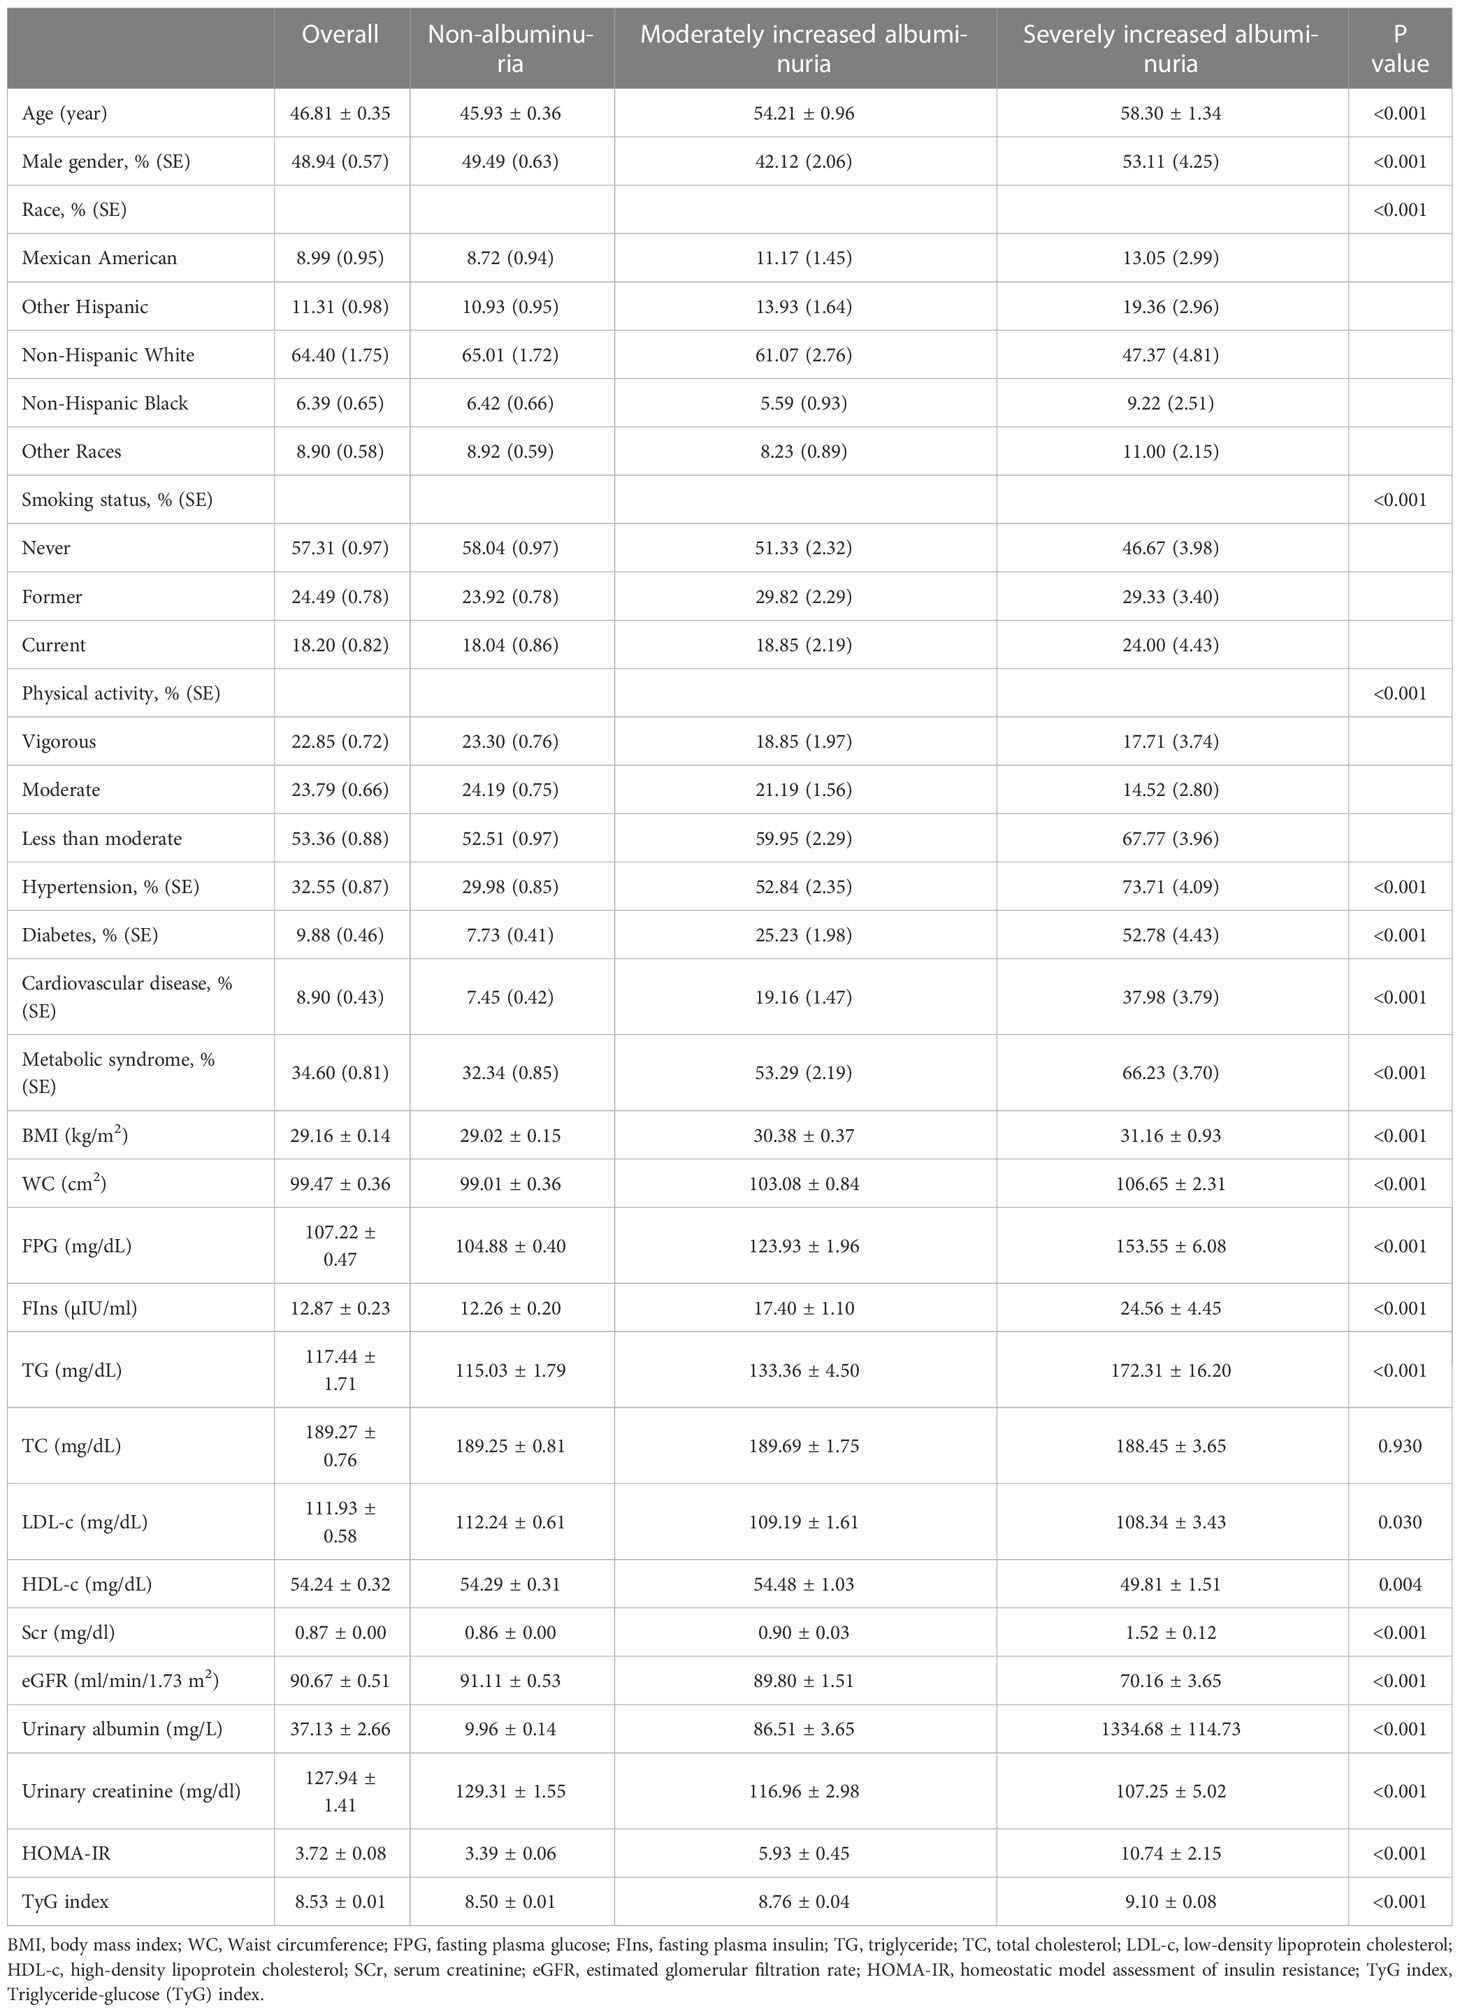
Table 1 Baseline characteristics of study population according to UACR, weighted.
3.2 Clinical features of the participants according to the quartiles of TyG index
According to the TyG level of all subjects, they were divided into four groups from low to high: quartile I (TyG<8.07), quartile II (8.07<TyG ≤ 8.50), quartile III (8.50<TyG ≤ 8.96), and quartile IV (TyG>8.96) (Table 2). Compared with quartile I-TyG group, age, male, smoking proportion, hypertension prevalence, diabetes prevalence, cardiovascular disease prevalence, metabolic syndrome prevalence, BMI, WC, FPG, FIns, TG, TC, Scr, urinary albumin, and HOMA-IR were significantly increased in quartile II-TyG, quartile III-TyG, and quartile IV-TyG groups increased significantly (P<0.001), and LDL-c, HDL-c, and eGFR decreased significantly (P<0.001). Most importantly, with the gradual increase of TyG level, the UACR level (19.34 ± 2.44 vs. 21.88 ± 2.94 vs. 25.75 ± 2.59 vs. 72.46 ± 10.90, P<0.001) and the number of people with albuminuria (7.13% vs. 7.66% vs. 8.27% vs. 16.58%, P <0.001) gradually increased.

Table 2 Clinical and laboratory characteristics based on TyG index quartiles, weighted.
3.3 Association of TyG index with albuminuria independent of HOMA-IR or metabolic syndrome
Our results showed that higher TyG index was associated with increased likelihood of increased albuminuria. This association was significant in model 1 [OR (95%CI): 1.871 (1.725-2.030), P<0.001], model 2 [OR (95%CI): 1.772 (1.622-1.936), P<0.001], model 3 [OR (95%CI): 1.391 (1.258-1.539), P<0.001], and the model with additional adjustment for log (HOMA-IR) [OR (95%CI): 1.346 (1.204-1.506), P<0.001] or metabolic syndrome [OR (95%CI): 1.316 (1.178-1.470), P<0.001]. We transformed TyG index from a continuous variable to a categorical variable. Compared to the lowest TyG index quartile, the highest TyG index quartile had 32.0% and 27.3% increased risk of albuminuria in the model with additional adjusted for log (HOMA-IR) or metabolic syndrome, respectively (Table 3). Using the UACR as a dependent variable for the linear regression analysis, we can also find that TyG index is closely related to UACR (Table 4).
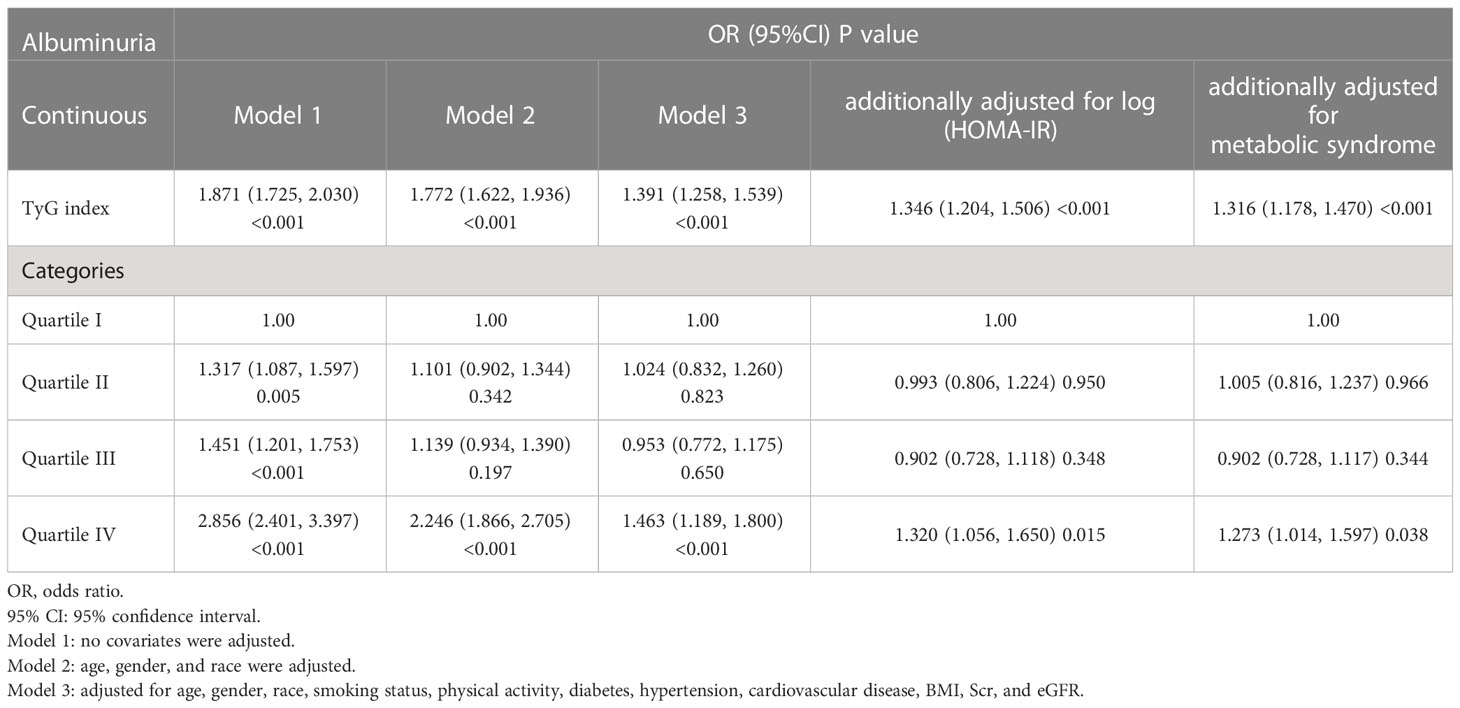
Table 3 The association between TyG index and albuminuria.
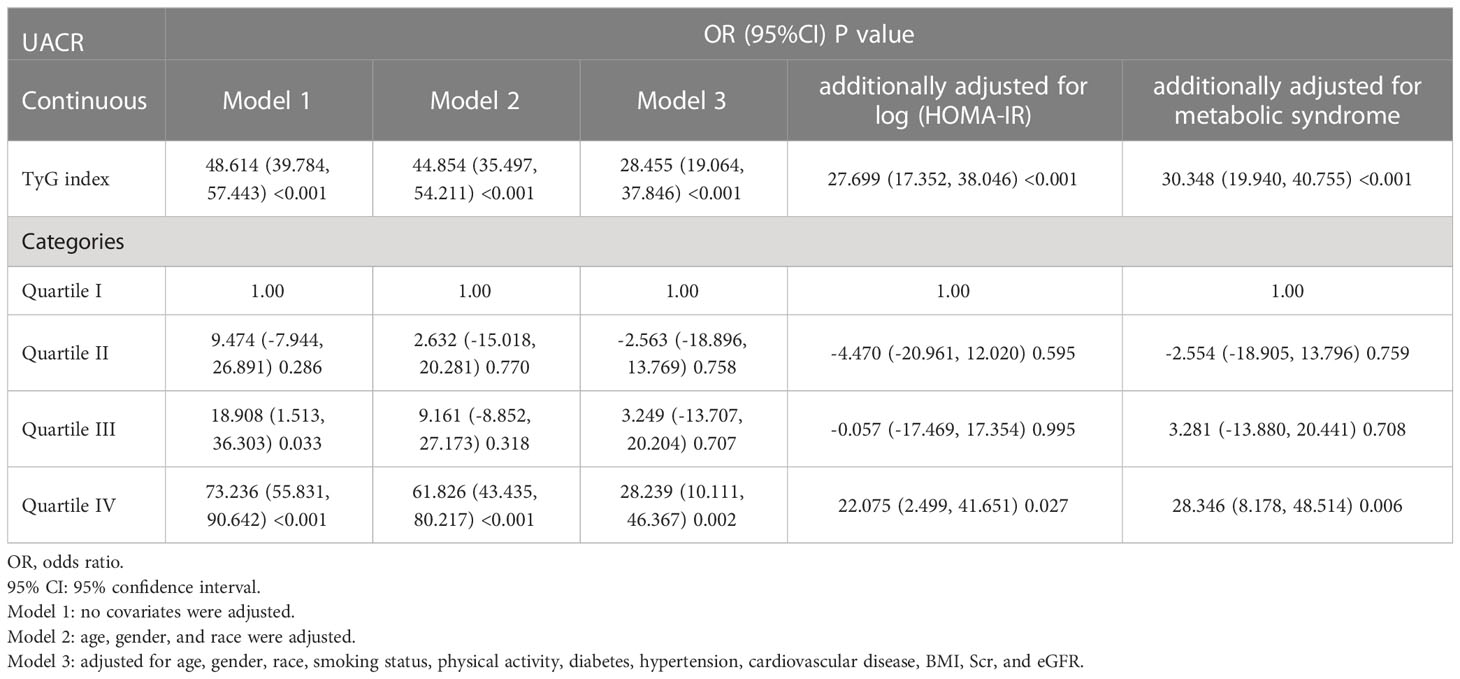
Table 4 The association between TyG index and UACR.
3.4 Correlation of TyG index with clinical parameters
Weighted Pearson correlation analysis suggested that the TyG index was consistently positively correlated with age, gender, race, smoking status, hypertension, diabetes, cardiovascular disease, WC, FPG, TG, TC, LDL-c, Scr, urinary albumin, UACR, albuminuria, and negatively correlated with HDL-c, urinary creatinine, and eGFR, whether unadjusted, or adjusted for log (HOMA-IR), metabolic syndrome (P<0.001) (Table 5).
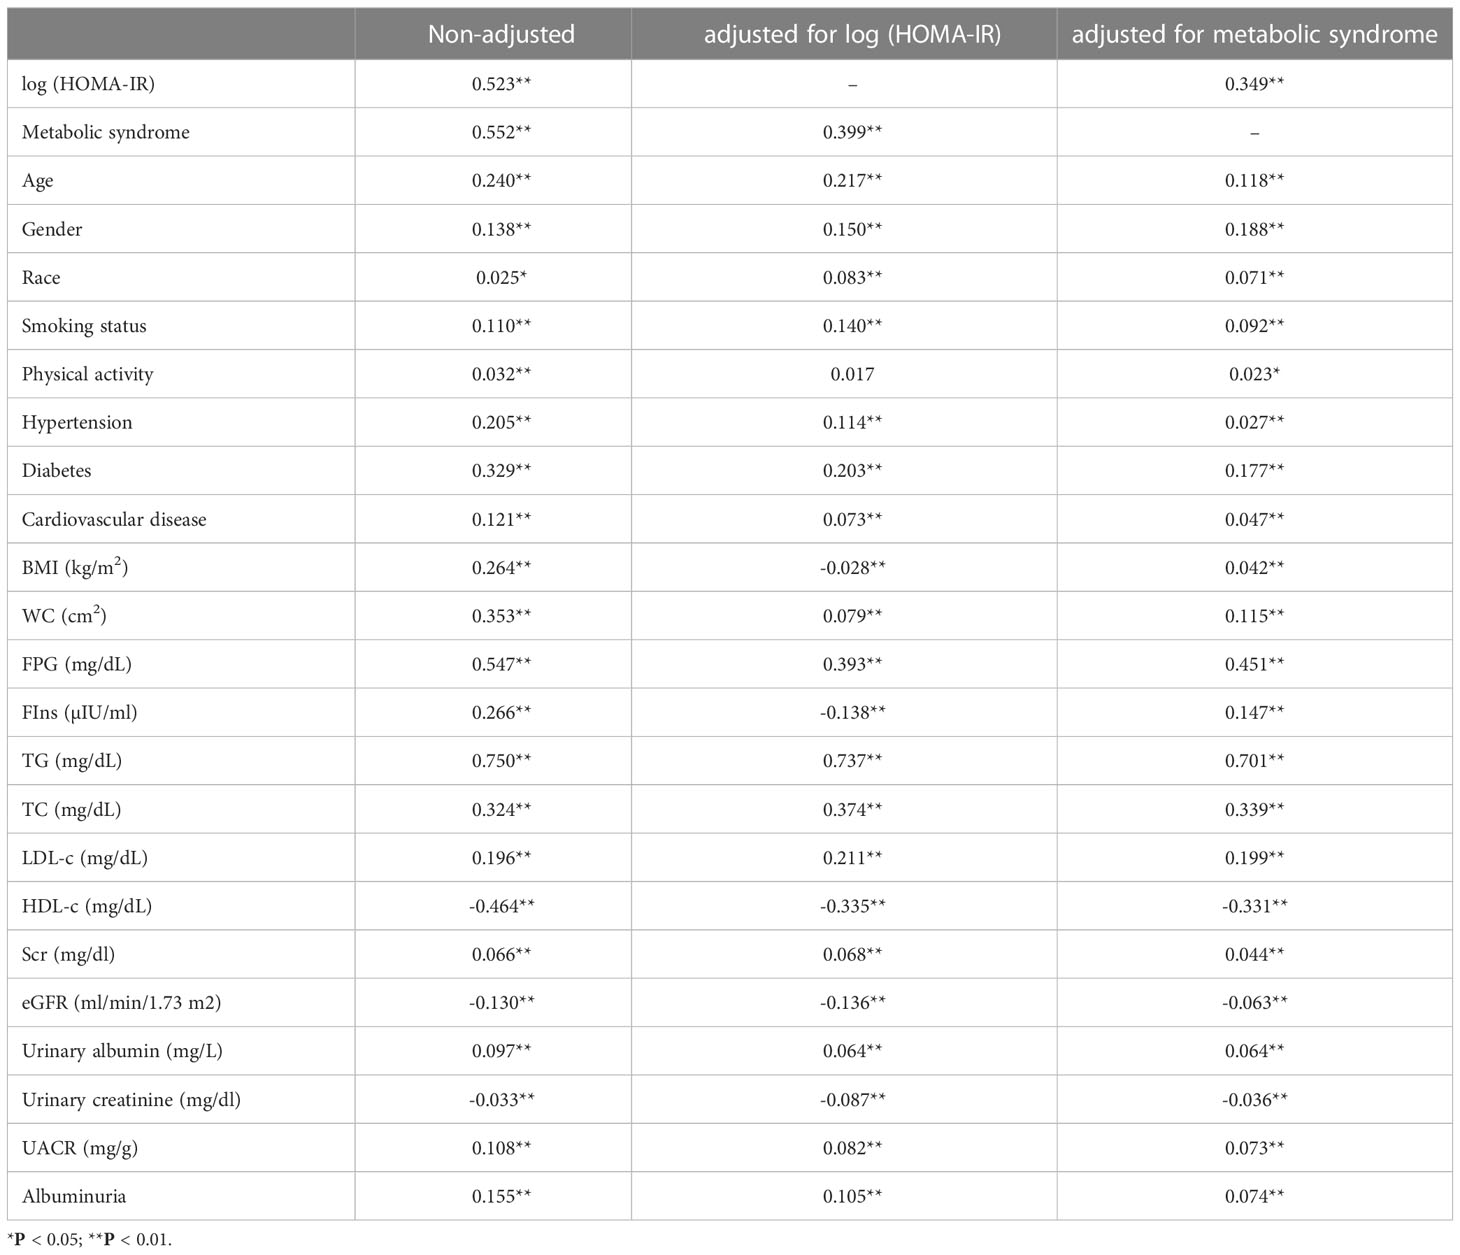
Table 5 Correlation of TyG index with other parameters in the whole study population.
3.5 Multivariate logistic regression models of albuminuria
After removing covariates with VIF greater than 5, we performed a multivariate logistic regression analysis (Table 6). The independent variables included the TyG index, log (HOMA-IR), metabolic syndrome, age, gender, race, smoking status, physical activity, hypertension, diabetes, cardiovascular disease, BMI, Scr, and eGFR. The dependent variable was albuminuria. The results showed that TyG index [OR (95%CI): 1.283 (1.138-1.446), P<0.001] was more strongly associated with albuminuria than log (HOMA-IR) [OR (95%CI): 1.138 (0.908-1.426), P=0.263] and metabolic syndrome [OR (95%CI): 1.213 (1.024-1.438), P<0.05].
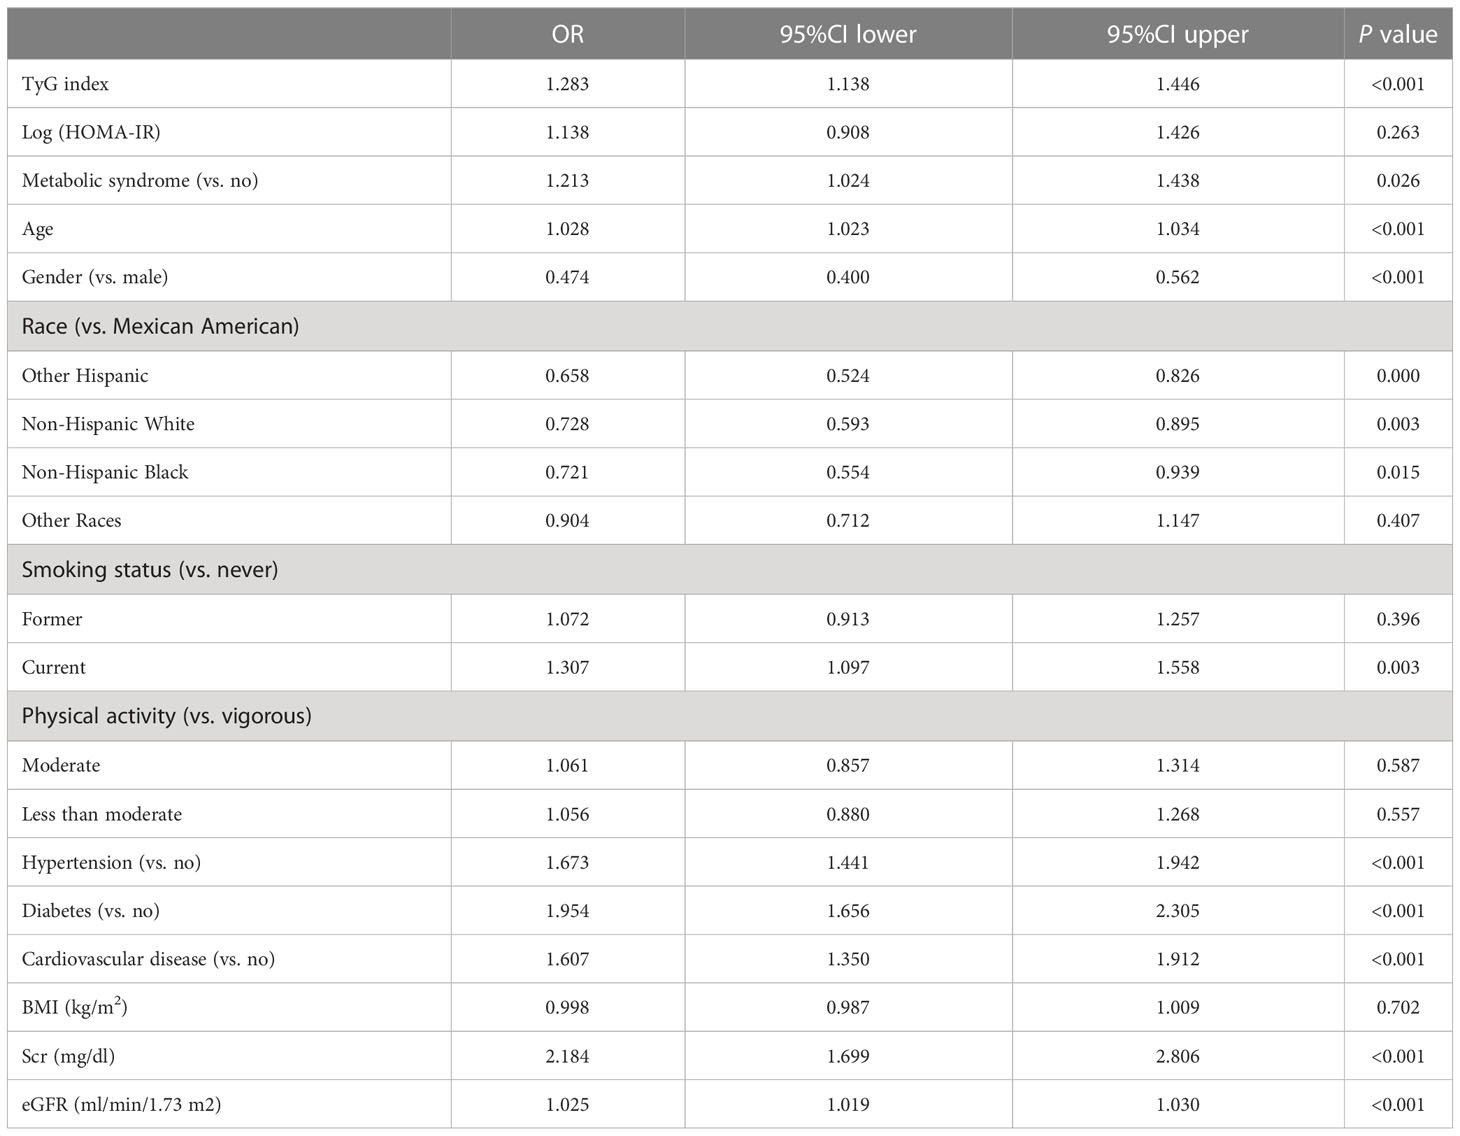
Table 6 Multivariate logistic regression models of albuminuria.
3.6 Evaluation of the Impact of TyG index on albuminuria
As Figure 1 shows the performance for evaluating the endpoint among TyG index, TyG-derived indices, and log (HOMA-IR) for albuminuria risk, the AUC of the marker is as follows: BMI 0.557, WC 0.589, log (HOMA-IR) 0.597, TyG-BMI (TyG × BMI) 0.587, TyG-WC (TyG ×WC) 0.616, and TyG 0.616.
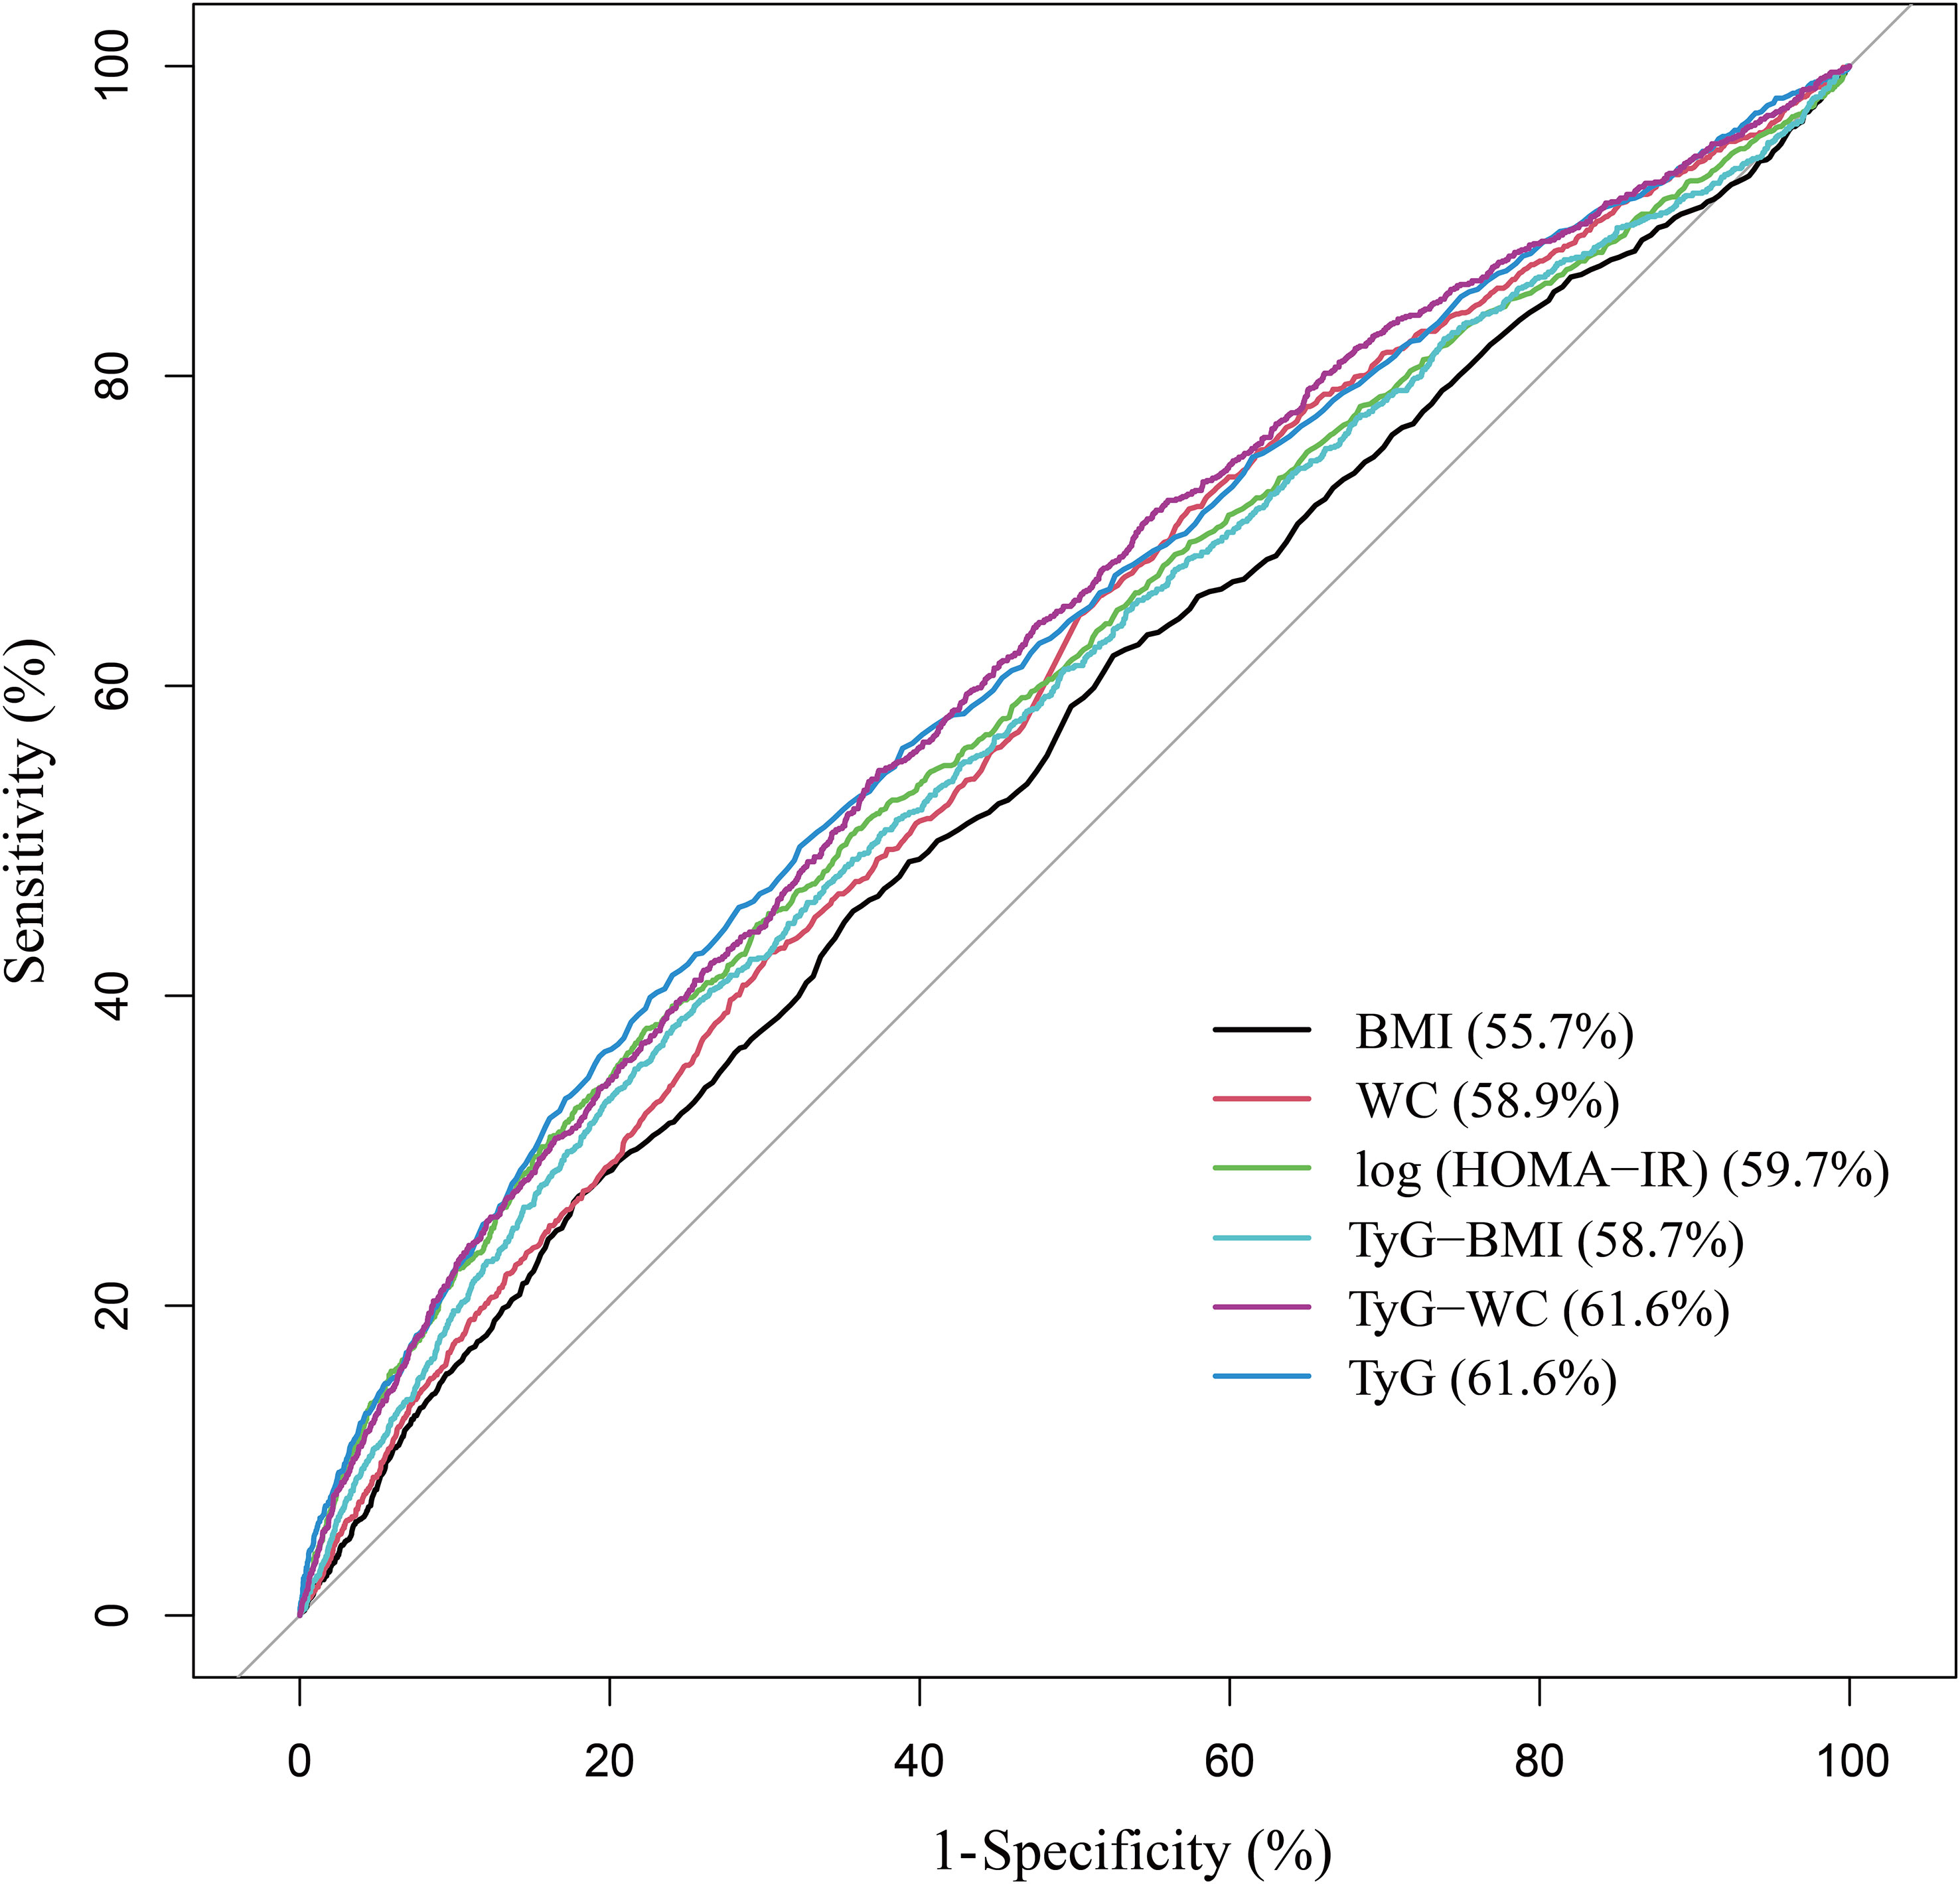
Figure 1 ROC analysis.
3.7 Subgroup analysis
Our subgroup analysis showed that the degree of association between TyG index levels and albuminuria was inconsistent across populations. The interaction test suggested that the relationship between TyG index and albuminuria was influenced by age (<60/≥60), BMI (normal weight/overweight/obese), diabetes (yes/no), and metabolic syndrome (yes/no) stratification (P<0.05). Age < 60, overweight/obesity, diabetes, and metabolic syndrome may be effector modifiers (Figure 2).

Figure 2 Subgroup analysis.
4 Discussion
In this cross-sectional study of 9872 participants, we found that TyG index is a valid biomarker of metabolic dysfunction with relevancy to albuminuria in the United States population. Its association with albuminuria appears to be largely independent of insulin resistance.
Insulin resistance is consistently associated with increased urinary albumin excretion (37, 38). Podocytes are thought to be the initial step in the development of albuminuria, and insulin signaling in podocytes appears to be important for maintaining the integrity of the glomerular filtration barrier (39, 40). Insulin resistance can also induce adipose tissue inflammation to activate and release proinflammatory cytokines such as IL-6 and TNF-α, which induce endothelial dysfunction, leading to albuminuria and impaired renal function (41, 42). Several previous studies have also described the association between TyG and albuminuria from this perspective (28, 30, 43). However, TyG index continued to be associated with albuminuria after mutual adjustment of HOMA-IR, suggesting that the mechanism of albuminuria induced by insulin resistance could not fully explain the effect of TyG index. This finding was also hinted at a previous longitudinal study of the Chinese population. Participants in the high TyG index, low HOMA-IR group had a higher risk of new-onset albuminuria than participants in the low TyG index, low HOMA-IR group (44). Additionally, the ROC curves showed that the evaluation value of the TyG index for albuminuria was significantly higher than log (HOMA-IR), while the TyG-derived indices did not greatly improve. The TyG index has been extensively studied and validated as a marker of insulin resistance and metabolic abnormalities, unlike other TyG-derived indices. However, the TyG-WC index may also be valuable since it considers waist circumference, an essential measure of central obesity.
Our study further discovered that TyG’s link to albuminuria persisted even after taking metabolic syndrome into account. This highlights the additive value of the TyG index in the investigation of metabolic risk factors for albuminuria. It may be more beneficial to use continuous rather than dichotomous measures of metabolic syndrome. At the same time, the results of mutual correction based on multivariate logistic regression can also be seen that the correlation between TyG index and albuminuria was stronger than that between HOMA-IR, metabolic syndrome, and albuminuria.
Further stratified subgroup analyses and interaction test suggested that the relationship between TyG index and albuminuria is of greater concern in age<60, overweight/obese, diabetic, and metabolic syndrome patients, at least in the United States population. Hypertension can worsen kidney injury and cause albuminuria, an important marker for cardiovascular events. Previous studies have also suggested a bidirectional association between hypertension and metabolic dysfunction, such as NAFLD (45). However, we did not find that hypertension or cardiovascular disease influenced the magnitude of the association between TyG index and albuminuria. This may suggest that the TyG index is more directly reflect the effects of metabolic dysfunction on albuminuria and is more valuable in people with metabolic dysfunction.
What is clear is that TyG index was associated with albuminuria, a relationship that was largely independent of insulin resistance represented by HOMA-IR. Future studies are needed to determine its performance as a predictive biomarker. In addition, special attention should be paid to differences in subgroups based on age, BMI, diabetes, and metabolic syndrome. There are some limitations in this study. First, due to the cross-sectional design of this study, a prospective study with large sample size is needed to clarify the causal relationship. Second, although we adjusted for some potential covariates, we could not completely exclude the influence of other possible confounders. Finally, the stratification of other subgroups was not considered, such as different types of diabetes, NAFLD, etc.
5 Conclusion
In a nationally representative study of adults aged ≥20, the TyG index was associated with albuminuria. These findings cannot be fully explained by the insulin resistance or the dichotomous definition of metabolic syndrome. This metric shows promise as an epidemiological tool for quantifying the role of metabolic dysfunction in albuminuria and possibly for predictive value.
Data availability statement
Publicly available datasets were analyzed in this study. This data can be found here: https://www.cdc.gov/nchs/nhanes/.
Ethics statement
The studies involving human participants were reviewed and approved by National Center for Health Statistics (NCHS) Research Ethics Review Board. The patients/participants provided their written informed consent to participate in this study.
Author contributions
All authors listed have made a substantial, direct, and intellectual contribution to the work and approved it for publication.
Funding
This study was funded by the Suzhou Science and Technology Planning Project (STL2021006) and the Science and Technology Project of Changzhou Health Commission (WZ202226).
Acknowledgments
We want to acknowledge all participants of this study and the support provided by the Jiangsu University.
Conflict of interest
The authors declare that the research was conducted in the absence of any commercial or financial relationships that could be construed as a potential conflict of interest.
Publisher's note
All claims expressed in this article are solely those of the authors and do not necessarily represent those of their affiliated organizations, or those of the publisher, the editors and the reviewers. Any product that may be evaluated in this article, or claim that may be made by its manufacturer, is not guaranteed or endorsed by the publisher.
References
1. Kovesdy CP. Epidemiology of chronic kidney disease: an update 2022. Kidney Int Suppl (2011) (2022) 12(1):7–11. doi: 10.1016/j.kisu.2021.11.003
2. Mathew RO, Bangalore S, Lavelle MP, Pellikka PA, Sidhu MS, Boden WE, et al. Diagnosis and management of atherosclerotic cardiovascular disease in chronic kidney disease: a review. Kidney Int (2017) 91(4):797–807. doi: 10.1016/j.kint.2016.09.049
3. Levey AS, Becker C, Inker LA. Glomerular filtration rate and albuminuria for detection and staging of acute and chronic kidney disease in adults: a systematic review. Jama (2015) 313(8):837–46. doi: 10.1001/jama.2015.0602
4. Wang XL, Lu JM, Pan CY, Tian H, Li CL. A comparison of urinary albumin excretion rate and microalbuminuria in various glucose tolerance subjects. Diabetes Med (2005) 22(3):332–5. doi: 10.1111/j.1464-5491.2004.01408.x
5. Griffin KA. Hypertensive kidney injury and the progression of chronic kidney disease. Hypertension (2017) 70(4):687–94. doi: 10.1161/HYPERTENSIONAHA.117.08314
6. Lambers Heerspink HJ, Gansevoort RT. Albuminuria is an appropriate therapeutic target in patients with CKD: the pro view. Clin J Am Soc Nephrol (2015) 10(6):1079–88. doi: 10.2215/CJN.11511114
7. Perkovic V, Verdon C, Ninomiya T, Barzi F, Cass A, Patel A, et al. The relationship between proteinuria and coronary risk: a systematic review and meta-analysis. PloS Med (2008) 5(10):e207. doi: 10.1371/journal.pmed.0050207
8. Jardine M, Zhou Z, Lambers Heerspink HJ, Hockham C, Li Q, Agarwal R, et al. Kidney, cardiovascular, and safety outcomes of canagliflozin according to baseline albuminuria: A CREDENCE secondary analysis. Clin J Am Soc Nephrol (2021) 16(3):384–95. doi: 10.2215/CJN.15260920
9. Qin Z, Li H, Wang L, Geng J, Yang Q, Su B, et al. Systemic immune-inflammation index is associated with increased urinary albumin excretion: A population-based study. Front Immunol (2022) 13:863640. doi: 10.3389/fimmu.2022.863640
10. Wijarnpreecha K, Thongprayoon C, Boonpheng B, Panjawatanan P, Sharma K, Ungprasert P, et al. Nonalcoholic fatty liver disease and albuminuria: a systematic review and meta-analysis. Eur J Gastroenterol Hepatol (2018) 30(9):986–94. doi: 10.1097/MEG.0000000000001169
11. Thoenes M, Bramlage P, Khan BV, Schieffer B, Kirch W, Weir MR. Albuminuria: pathophysiology, epidemiology and clinical relevance of an emerging marker for cardiovascular disease. Future Cardiol (2007) 3(5):519–24. doi: 10.2217/14796678.3.5.519
12. Lin YC, Chang YH, Yang SY, Wu KD, Chu TS. Update of pathophysiology and management of diabetic kidney disease. J Formos Med Assoc (2018) 117(8):662–75. doi: 10.1016/j.jfma.2018.02.007
13. Gu S, Wang A, Ning G, Zhang L, Mu Y. Insulin resistance is associated with urinary albumin-creatinine ratio in normal weight individuals with hypertension and diabetes: The REACTION study. J Diabetes (2020) 12(5):406–16. doi: 10.1111/1753-0407.13010
14. Park SK, Chun H, Ryoo JH, et al. A cohort study of incident microalbuminuria in relation to HOMA-IR in Korean men. Clin Chim Acta (2015) 446:111–6. doi: 10.1016/j.cca.2015.03.043
15. Rowley K, O’Dea K, Best JD. Association of albuminuria and the metabolic syndrome. Curr Diabetes Rep (2003) 3(1):80–6. doi: 10.1007/s11892-003-0058-1
16. Matthews DR, Hosker JP, Rudenski AS, Naylor BA, Treacher DF, Turner RC. Homeostasis model assessment: insulin resistance and beta-cell function from fasting plasma glucose and insulin concentrations in man. Diabetologia (1985) 28(7):412–9. doi: 10.1007/BF00280883
17. Wang T, Lu J, Shi L, et al. Association of insulin resistance and β-cell dysfunction with incident diabetes among adults in China: a nationwide, population-based, prospective cohort study. Lancet Diabetes Endocrinol (2020) 8(2):115–24. doi: 10.1016/S2213-8587(19)30425-5
18. González-González JG, Violante-Cumpa JR, Zambrano-Lucio M, et al. HOMA-IR as a predictor of health outcomes in patients with metabolic risk factors: A systematic review and meta-analysis. High Blood Press Cardiovasc Prev (2022) 29(6):547–64. doi: 10.1007/s40292-022-00542-5
19. Wu TD, Fawzy A, Brigham E, et al. Association of triglyceride-glucose index and lung health: A population-based study. Chest (2021) 160(3):1026–34. doi: 10.1016/j.chest.2021.03.056
20. Park K, Ahn CW, Lee SB, et al. Elevated tyG index predicts progression of coronary artery calcification. Diabetes Care (2019) 42(8):1569–73. doi: 10.2337/dc18-1920
21. Simental-Mendía LE, Rodríguez-Morán M, Guerrero-Romero F. The product of fasting glucose and triglycerides as surrogate for identifying insulin resistance in apparently healthy subjects. Metab Syndr Relat Disord (2008) 6(4):299–304. doi: 10.1089/met.2008.0034
22. Vasques AC, Novaes FS, de Oliveira Mda S, et al. TyG index performs better than HOMA in a Brazilian population: a hyperglycemic clamp validated study. Diabetes Res Clin Pract (2011) 93(3):e98–e100. doi: 10.1016/j.diabres.2011.05.030
23. Guerrero-Romero F, Simental-Mendía LE, González-Ortiz M, et al. The product of triglycerides and glucose, a simple measure of insulin sensitivity. Comparison with the euglycemic-hyperinsulinemic clamp. J Clin Endocrinol Metab (2010) 95(7):3347–51. doi: 10.1210/jc.2010-0288
24. Son DH, Lee HS, Lee YJ, Lee JH, Han JH. Comparison of triglyceride-glucose index and HOMA-IR for predicting prevalence and incidence of metabolic syndrome. Nutr Metab Cardiovasc Dis (2022) 32(3):596–604. doi: 10.1016/j.numecd.2021.11.017
25. Tarantino G, Saldalamacchia G, Conca P, Arena A. Non-alcoholic fatty liver disease: further expression of the metabolic syndrome. J Gastroenterol Hepatol (2007) 22(3):293–303. doi: 10.1111/j.1440-1746.2007.04824.x
26. Tarantino G, Crocetto F, Di Vito C, Creta M, Martino R, Pandolfo SD, et al. Association of NAFLD and insulin resistance with non metastatic bladder cancer patients: A cross-sectional retrospective study. J Clin Med (2021) 10(2):346. doi: 10.3390/jcm10020346
27. Wang A, Tian X, Zuo Y, Chen S, Meng X, Wu S, et al. Change in triglyceride-glucose index predicts the risk of cardiovascular disease in the general population: a prospective cohort study. Cardiovasc Diabetol (2021) 20(1):113. doi: 10.1186/s12933-021-01305-7
28. Tian Y, Sun J, Qiu M, Lu Y, Qian X, Sun W, et al. Association between the triglyceride-glucose index and albuminuria in hypertensive individuals. Clin Exp Hypertens (2023) 45(1):2150204. doi: 10.1080/10641963.2022.2150204
29. Oh D, Park SH, Lee S, Yang E, Choi HY, Park HC, et al. High triglyceride-glucose index with renal hyperfiltration and albuminuria in young adults: the Korea National Health and Nutrition Examination Survey (KNHANES V, VI, and VIII). J Clin Med (2022) 11(21). doi: 10.3390/jcm11216419
30. Pan Y, Zhong S, Zhou K, et al. Association between diabetes complications and the triglyceride-glucose index in hospitalized patients with type 2 diabetes. J Diabetes Res (2021) 2021:8757996. doi: 10.1155/2021/8757996
31. Zhao S, Yu S, Chi C, et al. Association between macro- and microvascular damage and the triglyceride glucose index in community-dwelling elderly individuals: the Northern Shanghai Study. Cardiovasc Diabetol (2019) 18(1):95. doi: 10.1186/s12933-019-0898-x
33. Cho YT, Chen CW, Chen MP, et al. Diagnosis of albuminuria by tryptic digestion and matrix-assisted laser desorption ionization/time-of-flight mass spectrometry. Clin Chim Acta (2013) 420:76–81. doi: 10.1016/j.cca.2012.12.016
34. Alberti KG, Eckel RH, Grundy SM, et al. Harmonizing the metabolic syndrome: a joint interim statement of the International Diabetes Federation Task Force on Epidemiology and Prevention; National Heart, Lung, and Blood Institute; American Heart Association; World Heart Federation; International Atherosclerosis Society; and International Association for the Study of Obesity. Circulation (2009) 120(16):1640–5. doi: 10.1161/CIRCULATIONAHA.109.192644
35. Levey AS, Stevens LA, Schmid CH, et al. A new equation to estimate glomerular filtration rate. Ann Intern Med (2009) 150(9):604–12. doi: 10.7326/0003-4819-150-9-200905050-00006
36. Cheng J, Sun J, Yao K, Xu M, Cao Y. A variable selection method based on mutual information and variance inflation factor. Spectrochim Acta A Mol Biomol Spectrosc (2022) 268:120652. doi: 10.1016/j.saa.2021.120652
37. Pilz S, Rutters F, Nijpels G, et al. Insulin sensitivity and albuminuria: the RISC study. Diabetes Care (2014) 37(6):1597–603. doi: 10.2337/dc13-2573
38. Fliser D, Pacini G, Engelleiter R, et al. Insulin resistance and hyperinsulinemia are already present in patients with incipient renal disease. Kidney Int (1998) 53(5):1343–7. doi: 10.1046/j.1523-1755.1998.00898.x
39. Welsh GI, Coward RJ. Podocytes, glucose and insulin. Curr Opin Nephrol Hypertens (2010) 19(4):379–84. doi: 10.1097/MNH.0b013e32833ad5e4
40. Jauregui A, Mintz DH, Mundel P, Fornoni A. Role of altered insulin signaling pathways in the pathogenesis of podocyte malfunction and microalbuminuria. Curr Opin Nephrol Hypertens (2009) 18(6):539–45. doi: 10.1097/MNH.0b013e32832f7002
41. De Cosmo S, Menzaghi C, Prudente S, Trischitta V. Role of insulin resistance in kidney dysfunction: insights into the mechanism and epidemiological evidence. Nephrol Dial Transplant (2013) 28(1):29–36. doi: 10.1093/ndt/gfs290
42. Shimobayashi M, Albert V, Woelnerhanssen B, et al. Insulin resistance causes inflammation in adipose tissue. J Clin Invest (2018) 128(4):1538–50. doi: 10.1172/JCI96139
43. Liu N, Liu C, Qu Z, Tan J. Association between the triglyceride-glucose index and chronic kidney disease in adults. Int Urol Nephrol (2023) 55(5):1279–89.
44. Gao W, Wang J, Chen Y, et al. Discordance between the triglyceride glucose index and HOMA-IR in incident albuminuria: a cohort study from China. Lipids Health Dis (2021) 20(1):176. doi: 10.1186/s12944-021-01602-w
Keywords: triglyceride-glucose index, insulin resistance, metabolic syndrome, albuminuria, NHANES
Citation: Wang Z, Qian H, Zhong S, Gu T, Xu M and Yang Q (2023) The relationship between triglyceride-glucose index and albuminuria in United States adults. Front. Endocrinol. 14:1215055. doi: 10.3389/fendo.2023.1215055
Received: 01 May 2023; Accepted: 07 August 2023;
Published: 23 August 2023.
Edited by:
Weixia Sun, The First hospital of Jilin University, ChinaReviewed by:
Yifan Bu, Harvard Medical School, United StatesGiovanni Tarantino, University of Naples Federico II, Italy
Jayanta Gupta, Florida Gulf Coast University, United States
Copyright © 2023 Wang, Qian, Zhong, Gu, Xu and Yang. This is an open-access article distributed under the terms of the Creative Commons Attribution License (CC BY). The use, distribution or reproduction in other forums is permitted, provided the original author(s) and the copyright owner(s) are credited and that the original publication in this journal is cited, in accordance with accepted academic practice. No use, distribution or reproduction is permitted which does not comply with these terms.
*Correspondence: Qichao Yang, eWFuZ3FpY2hhbzcyM0Bob3RtYWlsLmNvbQ==
†These authors have contributed equally to this work