
94% of researchers rate our articles as excellent or good
Learn more about the work of our research integrity team to safeguard the quality of each article we publish.
Find out more
ORIGINAL RESEARCH article
Front. Endocrinol. , 17 July 2023
Sec. Bone Research
Volume 14 - 2023 | https://doi.org/10.3389/fendo.2023.1207949
This article is part of the Research Topic Quantitative Bone Imaging Methods View all 9 articles
 Jannis Bodden1*
 Michael Dieckmeyer1,2
 Nico Sollmann1,3,4
 Egon Burian5
 Sebastian Rühling1
 Maximilian T. Löffler1,6
 Anjany Sekuboyina1,7,8Malek El Husseini1,7
 Claus Zimmer1,3
 Jan S. Kirschke1,3
 Thomas Baum1
Objectives: To investigate vertebral osteoporotic fracture (VF) prediction by automatically extracted trabecular volumetric bone mineral density (vBMD) from routine CT, and to compare the model with fracture prevalence-based prediction models.
Methods: This single-center retrospective study included patients who underwent two thoraco-abdominal CT scans during clinical routine with an average inter-scan interval of 21.7 ± 13.1 months (range 5–52 months). Automatic spine segmentation and vBMD extraction was performed by a convolutional neural network framework (anduin.bonescreen.de). Mean vBMD was calculated for levels T5-8, T9-12, and L1-5. VFs were identified by an expert in spine imaging. Odds ratios (ORs) for prevalent and incident VFs were calculated for vBMD (per standard deviation decrease) at each level, for baseline VF prevalence (yes/no), and for baseline VF count (n) using logistic regression models, adjusted for age and sex. Models were compared using Akaike’s and Bayesian information criteria (AIC & BIC).
Results: 420 patients (mean age, 63 years ± 9, 276 males) were included in this study. 40 (25 female) had prevalent and 24 (13 female) had incident VFs. Individuals with lower vBMD at any spine level had higher odds for VFs (L1-5, prevalent VF: OR,95%-CI,p: 2.2, 1.4–3.5,p=0.001; incident VF: 3.5, 1.8–6.9,p<0.001). In contrast, VF status (2.15, 0.72–6.43,p=0.170) and count (1.38, 0.89–2.12,p=0.147) performed worse in incident VF prediction. Information criteria revealed best fit for vBMD-based models (AIC vBMD=165.2; VF status=181.0; count=180.7).
Conclusions: VF prediction based on automatically extracted vBMD from routine clinical MDCT outperforms prediction models based on VF status and count. These findings underline the importance of opportunistic quantitative osteoporosis screening in clinical routine MDCT data.
Osteoporosis is a systemic disease that primarily affects bone and is characterized by a quantitative and qualitative decrease in bone substance (1). As a result of impaired bone stability, patients with osteoporosis frequently suffer vertebral (fragility) fractures (VFs), which are associated with a drastic reduction in quality of life and life expectancy (2). Approximately 50% of women and 20% of men experience at least one disease-related fracture during their lifetime, and individuals with a single VF have a 12.6-fold increased risk of further fractures in the future (3–10). Therefore, the history of fractures is queried with the FRAX® questionnaire (http://www.shef.ac.uk/FRAX), an instrument specifically designed to calculate the risk for future VFs (11). However, because clinically silent VFs frequently stay unrecognized, the risk of VFs in those individuals may be drastically underestimated (12). This emphasizes the paramount importance of early-stage diagnosis of osteoporosis and identification of individuals at risk for VFs.
The reference standard for the diagnosis of osteoporosis is given by measurements of bone mineral density by dual X-ray absorptiometry, but the technique’s lower costs and broader availability compared with quantitative computed tomography (CT) are bought by poorer discrimination capabilities between individuals with and without VFs (13–17). In addition, both dual X-ray absorptiometry and dedicated quantitative CT for the purpose of diagnosing osteoporosis require exposure to ionizing radiation and involve additional organizational effort (18–20).
Opportunistic bone densitometry uses imaging data acquired as part of routine clinical practice to determine bone mineral density and is becoming increasingly important as diagnostic CT scans proliferate. While prediction of incident VFs appears feasible in routine CT, region-of-interest segmentation, correction for intravenously administered contrast media, and conversion of Hounsfield Units (HU) to bone mineral density have, until recently, required significant manual effort (21–25). Newly developed deep learning-based tools enable automatic extraction of volumetric bone mineral density (vBMD) from routine clinical CT with specific correction for intravenous contrast phase and specifics of the used CT scanner and protocol (14, 22–26).
However, the performance of models based on automatically extracted opportunistic vBMD measurements to predict VFs, in contrast to established models that account for fracture status and number, is still unclear. Therefore, the aims of this study were to (i) determine cross-sectional associations between opportunistic vBMD and prevalent VFs, (ii) investigate whether vBMD, baseline VF status, and VF count are associated with imminent VFs, and (iii) compare the newly developed vBMD-based fracture prediction models with models based on baseline VF status and number.
The institutional ethics committee approved this study and, because of its retrospective nature, waived the requirement for written informed consent. Individuals eligible for participation were retrospectively identified via our institution’s picture archiving and communication system. All individuals had received two thoraco-abdominal multi-detector CT scans at a single site for the purpose of oncologic staging during the six-year inclusion period (Figure 1). For each subject, the first scan was considered “baseline” and the second scan was considered “follow-up”. The time interval between both scans had to be at least 5 months.
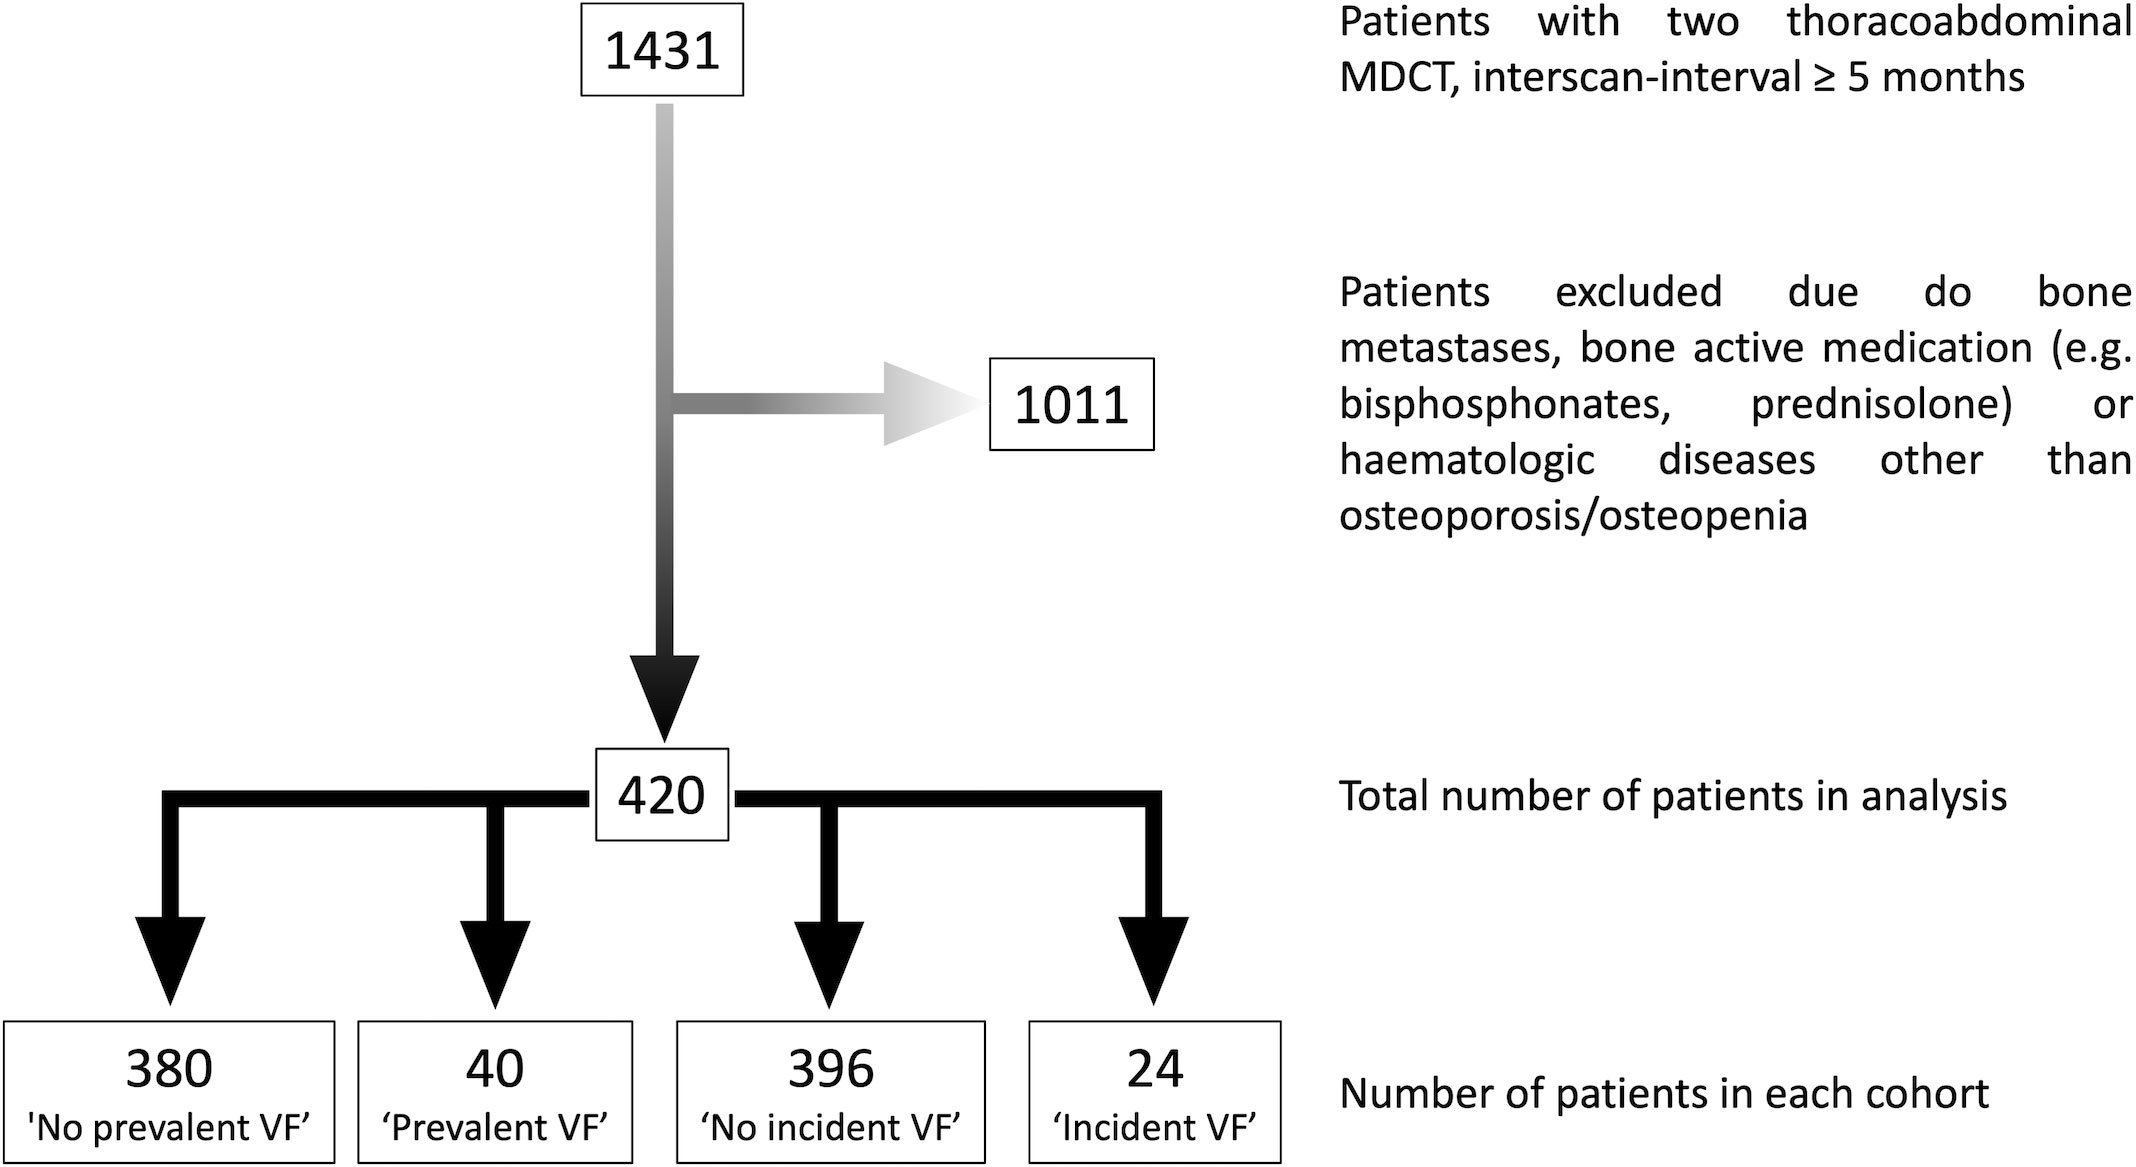
Figure 1 Flow chart depicting the process of patient in- and exclusion.
All scans were manually reviewed for complete coverage of the thoraco-lumbar spine, and subjects with bone metastases, other focal bone lesions of the spine, foreign material implants in the spine with adjacent beam hardening artifacts, or severe motion artifacts were excluded. In addition, all subjects taking bone-active drugs (e. g. bisphosphonates, corticosteroids) or with an established bone disease other than osteoporosis or osteopenia prior to their respective baseline scan were identified and excluded by medical record review.
All scans were acquired using our institute’s multi-detector CT scanner (Somatom Sensation Cardiac 64; Siemens Healthineers) with 64 detector rows. Tube voltage was set to 120 kVp and the average tube load was 200 mAs. As all scans were performed for oncologic staging, barium-based oral contrast medium was taken approximately 1 h prior to the exam by each individual (Barilux Scan; Sanochemia Diagnostics). For the same reason, all scans were acquired in early venous contrast-phase, performed 70 s after intravenous administration of an iodine-based contrast agent (Fresenius Pilot C; Fresenius Kabi). Intravenous contrast was dose-adjusted for body-weight (≤ 80 kg: 80 ml; 80 kg - 100 kg: 90 ml; > 100 kg: 100 ml) and applied at a flow-rate of 3.0 ml/s. Sagittal views of the spine were reformatted for each scan (slice thickness of 3 mm) using a standard bone kernel.
In each scan, the vertebrae of the thoraco-lumbar spine (T1-L5) were automatically labeled and segmented using a convolutional neural network (CNN)-based framework (https://anduin.bonescreen.de), trained on publicly available data (14, 24–29). The tool is based on a deep learning algorithm and creates individual masks for the cortical and trabecular vertebral body compartments as well as laminar regions, facet joints, and processes (Figure 2). For the purpose of quality assurance, a neuroradiologist specialized in spine imaging manually reviewed all automated segmentations and corrected them, as necessary (27). Simultaneously, the neuroradiologist further identified and excluded single vertebrae with Modic-type sclerotic endplate changes and intraosseous venous malformations according to the ACR guidelines for quantitative CT (https://www.acr.org/-/media/ACR/Files/Practice-Parameters/qct.pdf).
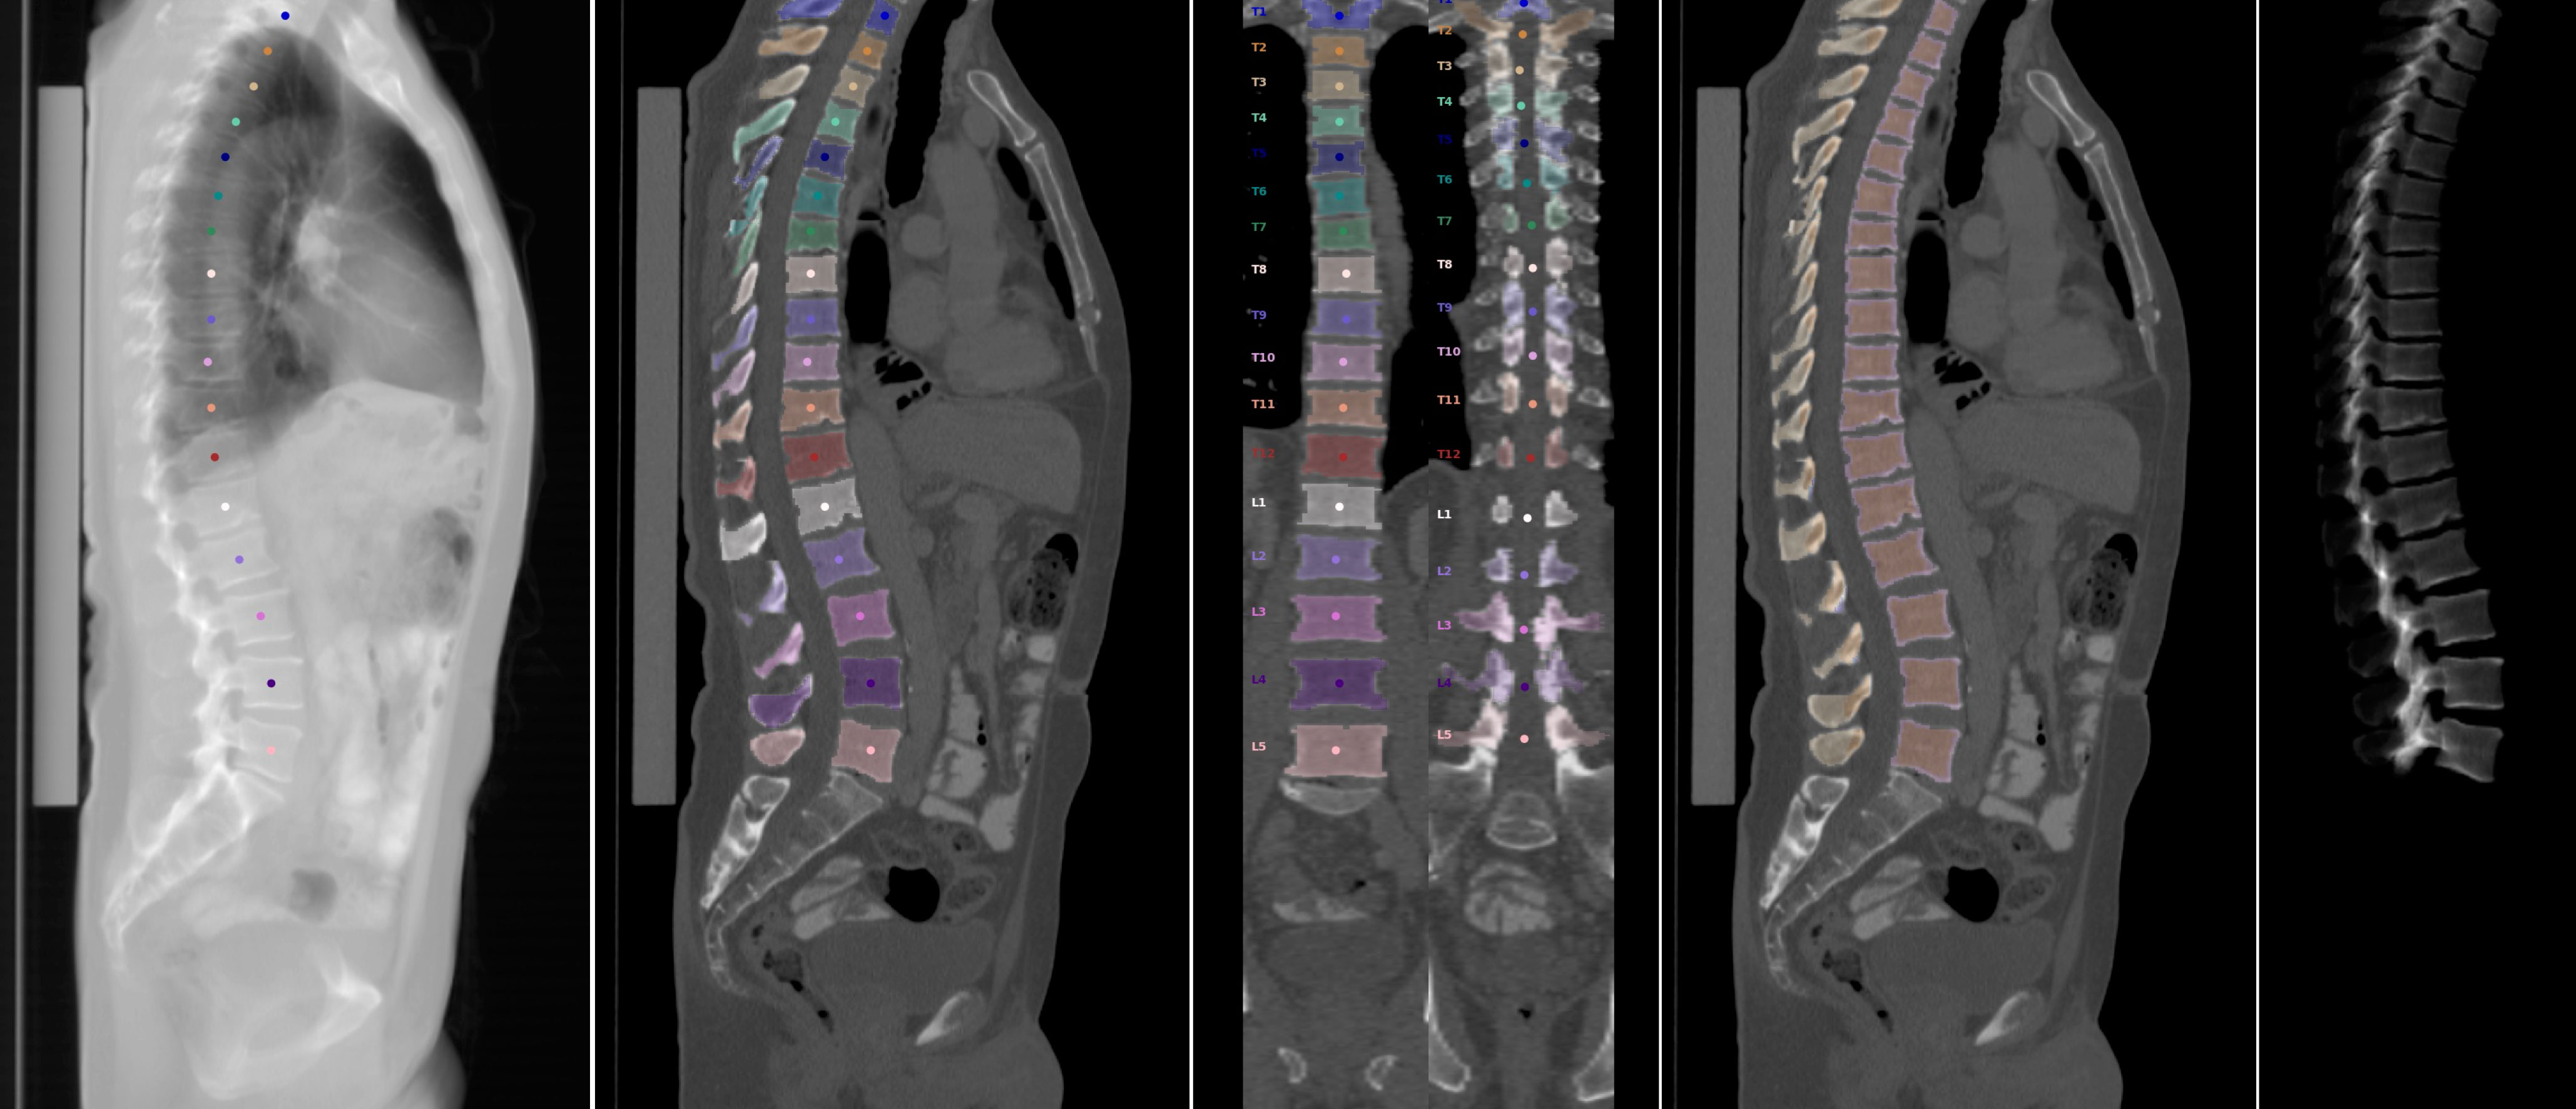
Figure 2 Steps of automated vertebral body segmentation, as performed by the convolutional neural network framework. From left to right: Automated vertebral body detection and labeling. Segmentation of vertebral components, including posterior elements (sagittal and coronal view). Separation of cortical and trabecular bone. Three-dimensional reconstruction of segmented vertebra.
Based on the aforementioned segmentation masks, trabecular density of each vertebral body was measured in HU. Following asynchronous calibration using a commercially available phantom (QRM QSA-717 Phantom; Quality Assurance in Radiology and Medicine GmbH), HU-to-vBMD conversion was performed using a linear equation model (slope = 0.63). Automated correction for the contrast phase was achieved by implementation of a two-dimensional DenseNet model (26).
Each subject’s baseline and follow-up scans were manually reviewed for VFs by two readers in consensus (N.S. and M.D., with 9 and 4 years of experience, respectively), adopting a method previously published by Bauer et al. (30). Specifically, VFs were defined as vertebral compression fractures falling into the subcategories A1-4 according to the AO/OTA classification system, and the fracture count was noted for baseline scans (31).
Fractures were classified as ‘prevalent’ if they were present at the baseline scan and ‘incident’ if they were not present at the baseline scan, but at the follow-up scan, i. e., occurred between baseline and follow-up scans. Four cohorts were defined, based on fracture status: ‘no prevalent VF’, ‘prevalent VF’, ‘no incident VF’, and ‘incident VF’. Baseline fracture status did not affect inclusion in the fracture incidence cohorts.
All statistical tests were performed using STATA v13.1 software (StataCorp LLC) with a two-sided level of significance of p < 0.05. Mean trabecular vBMD was calculated for three compartments (T5-8, T9-12, and L1-5). Age and sex are both well-known predictors of VFs and osteoporosis, therefore we investigated cohort differences (no prevalent VF’ vs. ‘prevalent VF’ and ‘no incident VF’ vs. ‘incident VF’) using t-tests for age and chi-squared as well as Fisher’s exact tests for sex. If cohort differences were statistically significant (p < 0.05), we included the variables as predictors in our multivariate analyses to address confounding. Furthermore, cohort differences in vBMD at each level were investigated using t-tests.
First, multivariate logistic regression models were used to determine the association between vBMD at each of the three vertebral levels (T5-8, T9-12, and L1-5) and prevalent VFs. Further, the association between the VF count at baseline and vBMD (T5-8, T9-12, and L1-5) was investigated using multivariate linear regression models. In the second part of the analysis, associations between the predictors vBMD (T5-8, T9-12, and L1-5), baseline VF status (yes/no), and baseline VF count and the outcome of incident VFs were also determined using multivariate logistic regression models. Prevalent VF status was stepwise added to all vBMD-based models in the secondary analysis to investigate any confounding.
To simplify model comparisons, all models were also calculated per standard deviation (SD) decrease in vBMD using odds ratio (OR)SD, coefficient (Coef)SD, and 95%-confidence intervals (CISD). Finally, in order to determine and compare the model fit, Akaike’s and Schwarz’s Bayesian information criteria (AIC & BIC) were calculated for models predicting incident fractures. AIC & BIC are both model performance measures, that aid in model selection, as they reflect how well the individual model represents the data. Lower AIC and BIC values indicate a better fit (32).
In summary, we identified 1431 individuals who underwent two thoraco-abdominal multi-detector CT scans at the defined scanner for the purpose of cancer staging in the six-year time period. Of those, 1011 were excluded due to bone metastases, use of bone-active medication, and/or hematological diseases other than osteoporosis, diagnosed prior to the baseline scan. Lastly, 420 individuals were eligible for inclusion (276 male, 65.7%). The average age at baseline was 62.9 ± 9.3 years (range 39 to 88 years) and the average inter-scan interval between baseline and follow-up scans was 21.7 ± 13.1 months (range 5 to 52 months). Comprehensive information on demographics of each cohort and fracture distribution is presented in Table 1.
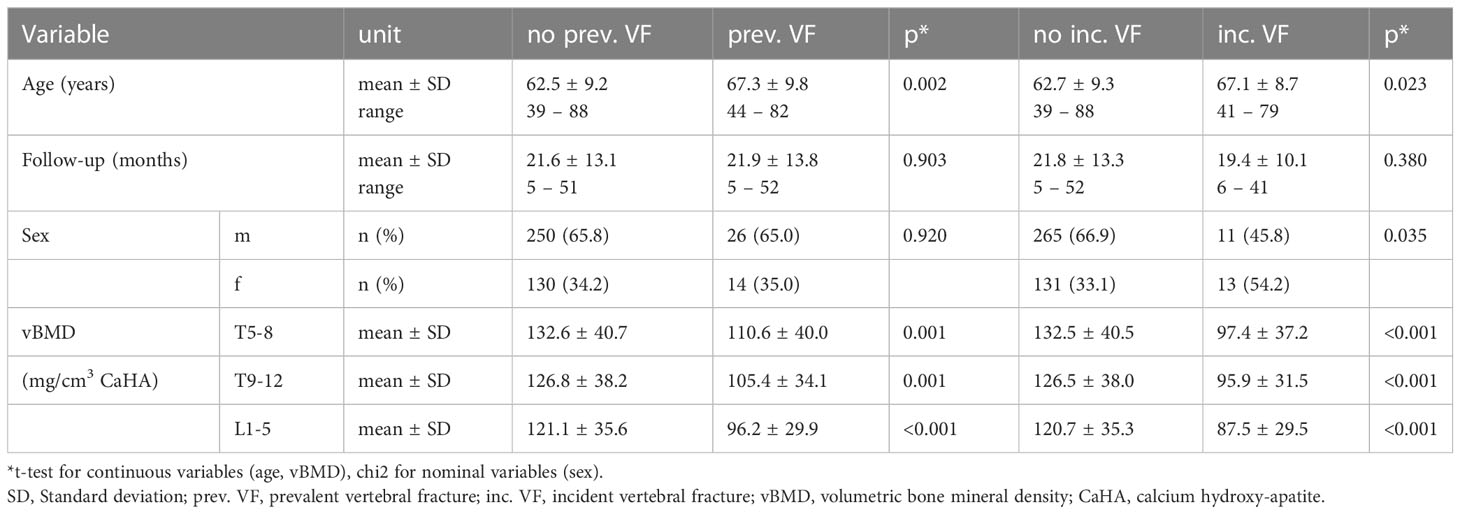
Table 1 Cohort characteristics.
Prevalent VFs were detected in 40 out of 420 individuals (9.5%), and individuals with prevalent fractures had lower vBMD compared to those without (p ≤ 0.001) (Figure 3A). Of all individuals with prevalent VFs, 14 had multiple VFs for a total of 66 fractures. Twenty-four individuals (5.7%) suffered incident compression fractures during the follow-up interval, and the cohort with incident fractures had significantly lower vBMD than the cohort without (p < 0.001) (Figure 3B). Outliers in vBMD measurements (shown in Figures 3A, B) were on average 50.6 years old and did not show a clear sex predominance (60% male), when compared to the entire cohort. In non-fractured individuals, the highest rate of outliers was found at the T5-8 level (n = 8; 2%), while only one measurement outlier was found for patients with a prevalent fracture (L1-L5 vBMD). Manual review of outliers’ MDCT scans and charts did not reveal underlying bone diseases or artifacts.
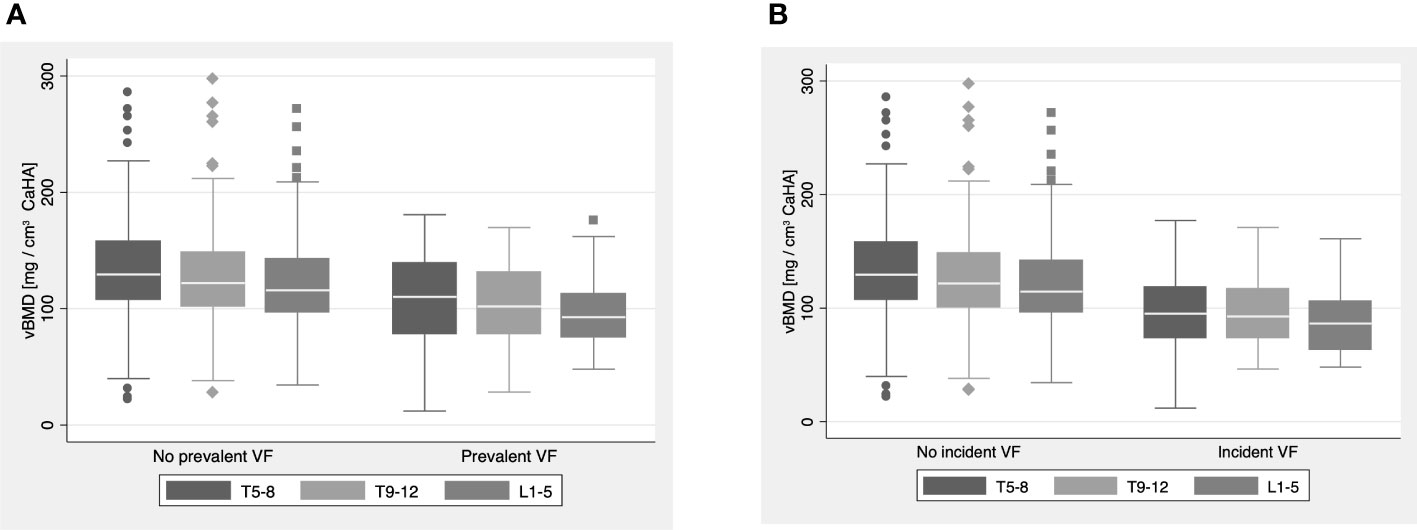
Figure 3 (A, B) Boxplots visualizing volumetric bone mineral density measurements (vBMD) at the T5-8, T9-12 and L1-5 level for the (A) ‘no prevalent VF’ and ‘prevalent VF’ cohorts and (B) ‘no incident VF’ and ‘incident VF’ cohorts. Throughout all levels, vBMDs in the ‘prevalent VF’ and ‘incident VF’ cohorts were significantly lower compared to their counterpart without VFs (p ≤ 0.001).
Across sexes, VF prevalence was similar (male: 10.4%, female: 10.7%, p = 0.92 and 1.00), but individuals with VFs were older than those without (67.3 ± 9.8 years vs. 62.5 ± 9.2 years, p = 0.002) (Table 1). Thus, to account for confounding, multivariate analyses included age as a predictor.
Through all vertebral levels, lower vBMD was associated with higher odds for prevalent VFs and ORs increased gradually in a cranio-caudal direction (Table 2): vBMD at the lumbar spine (L1-5) was the strongest predictor of prevalent VFs (ORSD = 2.21, 95%-CISD = 1.38 – 3.51, p = 0.001). A greater number of prevalent VFs was also strongly associated with lower vBMD across all vertebral levels: the strongest association was again found for the lumbar spine, but a cranio-caudal increase in coefficients was not observed (L1-5: CoefSD = -0.103, 95%-CISD = -0.166 – 0.039, p = 0.002) (Table 3 and Figure 4A).
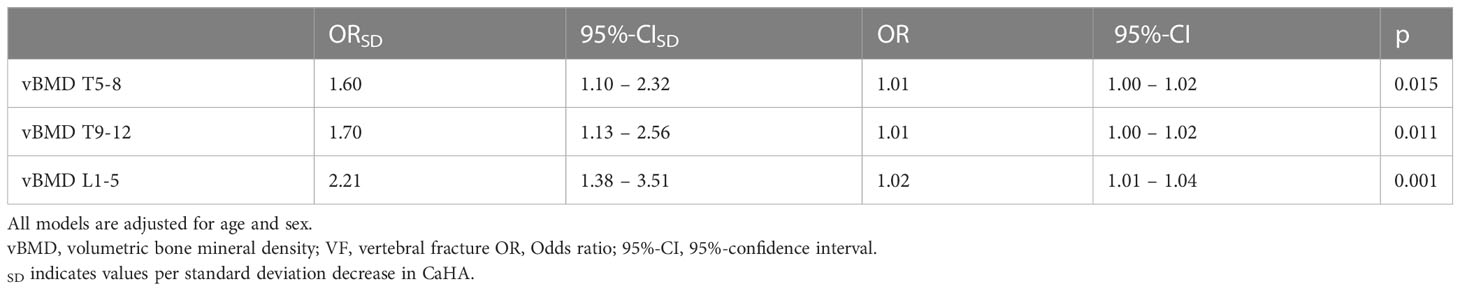
Table 2 Prevalent VF prediction by vBMD.
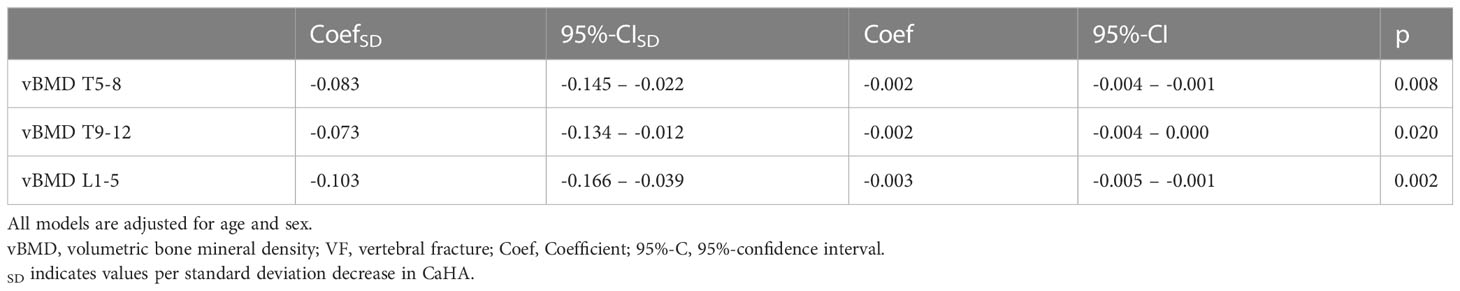
Table 3 Correlation of vBMD and prevalent VF count at baseline.
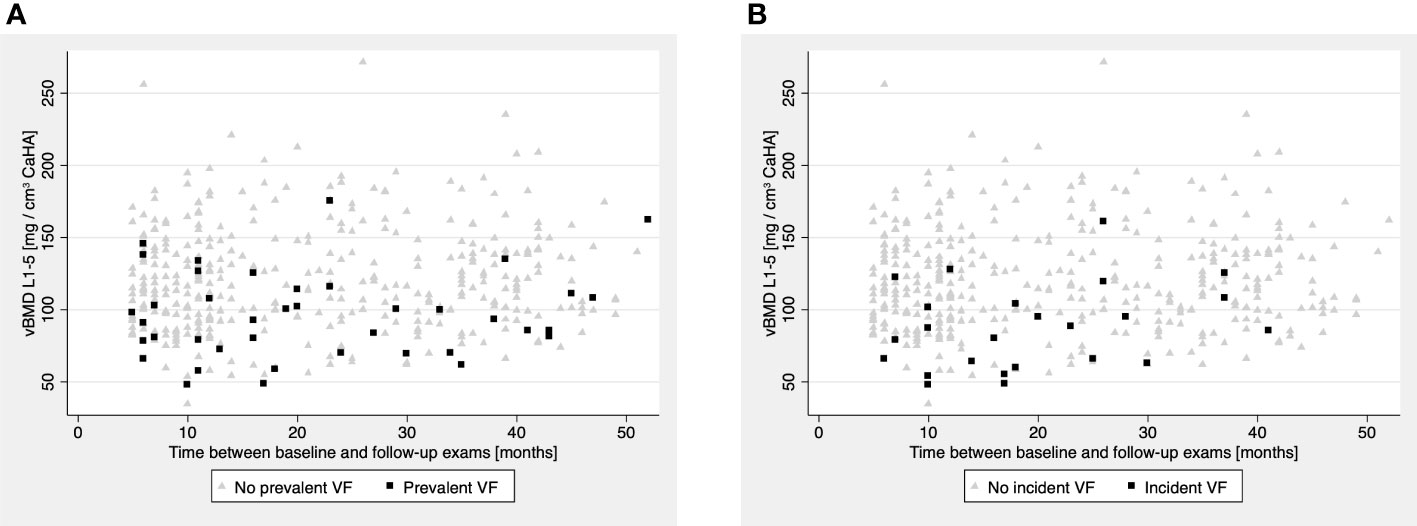
Figure 4 (A, B) Volumetric bone mineral density (vBMD) at the L1-5 level plotted against the time between baseline and follow-up scan in months. (A) Patients with prevalent VFs (black squares) were predominantly observed in the lower vBMD range, compared to patients without prevalent VFs (light-grey triangles). (B) Analogously, patients with incident VFs (black squares) were predominantly observed in the lower vBMD range, compared to patients without incident VFs (light-grey triangles).
Females had a higher VF incidence rate than males (9.9% vs. 4.1%, p = 0.035 and 0.045, for chi-squared and Fisher’s exact test, respectively), and individuals suffering incident VFs were older compared to those, who did not have incident VFs (67.1 ± 8.7 years vs. 62.7 ± 9.3 years, p = 0.02) (Table 1). Thus, sex and age were both treated as confounders and included as predictors in all following multivariate models.
Although odds for incident VFs were greater in individuals with prevalent VFs and a higher VF count at baseline, multivariate models for both of these variables did not reach statistical significance (VF status: ORSD = 2.15, 95%-CI = 0.72 – 6.43, p = 0.170; VF count: OR = 1.38, 95%-CI = 0.89 – 2.12, p = 0.147) (Table 4). Contrasting these findings, models based on opportunistic vBMD measurements showed that, through all considered vertebral levels, individuals with lower vBMD had significantly greater odds for incident VFs (T5-8, T9-12, L1-5: ORSD range = 1.48 – 3.54, p ≤ 0.001, respectively), and all findings withstood the additional adjustment for baseline VF status (Table 5) (Figure 4B).
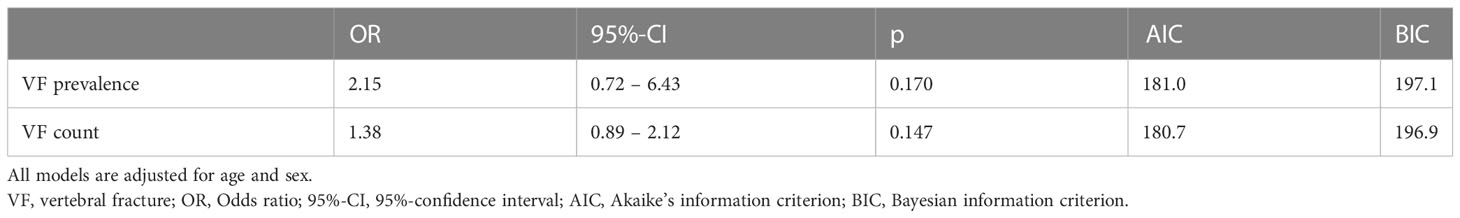
Table 4 Incident VF prediction by prevalent VF status and -count.
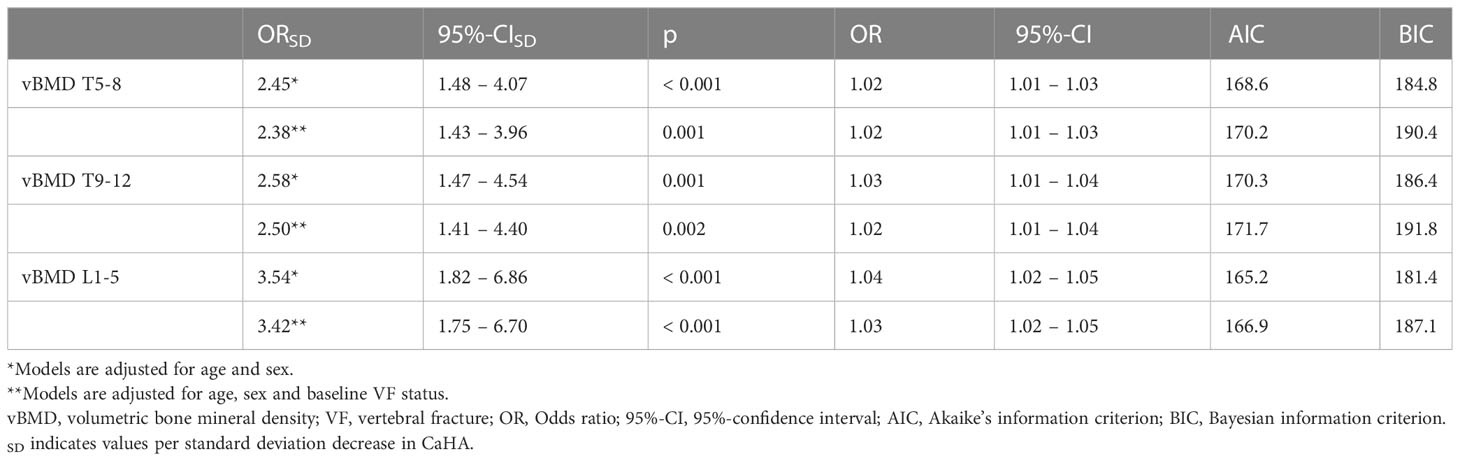
Table 5 Incident VF prediction by vBMD.
Model comparisons showed similar fit of models based on VF status and count (VF status: AIC = 181.0, BIC = 197.1; VF count: AIC = 180.7, BIC = 196.9). Fit of vBMD-based models was superior compared to models based on baseline VF status and VF count, and the model based on vBMD for L1-L5 fitted best (AIC = 165.2, BIC = 181.4).
This study investigated whether opportunistic vBMD measurements obtained by an automated CNN-based framework predict future VFs and compared the developed prediction models with established models, which are based on VF prevalence. The major finding was that VF prediction using opportunistic vBMD-based models was found to be superior to prediction based on prevalent VFs. This may highlight the potential role of systematic, opportunistic vBMD assessments in addressing the current challenges of osteoporosis treatment and diagnosis.
While the overall prevalence rate of VFs was similar in females (10.7%) and males (10.4%), a strong imbalance was observed in VF incidence: females suffered 54.2% of VFs, although they represented only 34.3% of the cohort. These findings underline the well-known observation that females are at higher risk of osteoporosis and associated fractures, particularly during the post-menopause decades of life (8, 9, 33, 34).
Lumbar spine vBMD was most valuable for predicting incident VFs. Odds for incident VFs were increased 3.5-fold in individuals with a vBMD of -1 SD compared with the rest of the cohort. These results are comparable to previous studies that reported ORs of 2-6 or hazard ratios of 2.5-4.4 per SD vBMD decrease, respectively (14, 22, 35–37). However, previous studies focusing on vBMD measurements at the lumbar spine were limited by their smaller cohort sizes of 84-105 individuals (14, 22, 35). In contrast, Therkildsen et al. investigated 1487 patients but manually derived vBMD measurements from noncontrast-enhanced cardiac CTs covering only the thoracic spine and (36). While Johannesdottir et al. additionally analyzed lumbar vBMD at the L1-2 level, the authors’ approach with manual quantitative CT measurements limited to specific vertebrae was still inherently different from ours (37). The current approach combines the strengths of a larger cohort of 420 subjects, automated opportunistic vBMD extraction and vBMD extraction from the thoracic and lumbar spine.
A number of studies have previously investigated risk factors for imminent VFs and found that prevalent VFs are a strong predictor thereof (3–7). This finding is addressed in the FRAX® tool (http://www.shef.ac.uk/FRAX), which queries fracture history in a dedicated question and includes it as an independent risk factor in the fracture risk calculation (11). Although individuals with prevalent VFs were more likely to suffer incident VFs than those without prevalent VFs with an OR of 2.15, the fracture-based models did however not reach statistical significance. This observation was confirmed by AIC and BIC: Both tests yielded lower scores for vBMD-based models, suggesting a superior fit (38). While in clinical practice, assessing fracture history through anamnesis is uncomplicated and provides valuable insights into bone stability and should therefore be performed whatsoever, vBMD-based fracture prediction models may particularly be useful in individuals with silent (i.e., clinically unrecognized) fractures (12).
We need to acknowledge some limitations of our present study. All scans were performed with a single scanner, which may lead to questions whether our findings are reproducible using other scanners. Previous studies that investigated the tool used for automatic vBMD extraction have addressed this question and showed that findings between scanners were indeed comparable, when appropriately calibrated (14, 22, 24). Another limitation of this study is the cohort composition. As mentioned above, more than half of the included individuals were males, despite the observation that females are more frequently affected by osteoporosis and VFs. This problem may have been avoided by frequency matching for sex (and age). However, this would have reduced our cohort size, which we intended to avoid. Further, frequency matching may induce new bias, as the cohorts may become too similar, which affects the observable effect size (39, 40). Instead, we decided to address this topic by including both variables (sex and age) as confounders in our multivariate analysis, where still statistically significant differences between the cohorts with and without VFs were found. While we did find vBMD outliers in our data (Figures 3A, B), we could not identify underlying confounders. On one side, vBMD measurements with asynchronous external calibration are known to be influenced by spine positioning in relation to the gantry due to x-ray field inhomogeneities and differences in beam hardening dependent on the scanner’s isocenter (41, 42). On the other side, chart data on bone active medications may be incomplete, introducing a possible bias to our findings. The inclusion criteria for this study may have resulted in a mainly oncologic patient population. Although we ruled out bone metastases during chart and imaging review, oncologic patients are nonetheless known to be at increased risk of bone loss and subsequent fractures, which limits the generalizability of our findings to non-oncologic populations. While our study highlights the potential role of opportunistic vBMD measurements in VF prediction, dual x-ray absorptiometry remains the gold standard for the diagnosis of osteoporosis and is implemented into current fracture prediction tools, like FRAX® (11, 19). However, MDCT scan numbers have drastically increased over the past 20 years (43). Therefore, opportunistic vBMD measurements gain increasing relevance, particularly for patients at risk of bone loss, like oncologic patients.
Prediction of VFs based on opportunistic vBMD assessments with an automated CNN-based framework is feasible and could particularly improve fracture prediction and detection in individuals receiving regular CT scans for oncologic staging. Moreover, vBMD was a stronger predictor of imminent VFs than fracture history. Opportunistic vBMD measurements from an automated framework for vertebral body segmentation and vBMD extraction could therefore enable fracture prevention measures.
The raw data supporting the conclusions of this article will be made available by the authors, without undue reservation.
The studies involving human participants were reviewed and approved by Ethikkommission der Technischen Universität München. Written informed consent for participation was not required for this study in accordance with the national legislation and the institutional requirements.
JB: Methodology, Formal analysis, Investigation, Data Curation, Writing - Original Draft, Visualization. MD: Conceptualization, Software, Data Curation, Writing – Review & Editing. NS: Writing – Review & Editing. EB: Writing – Review & Editing. SR: Writing – Review & Editing. ML: Software, Data curation, Writing – Review & Editing. AS: Writing – Review & Editing. MH: Writing – Review & Editing. CZ: Writing – Review & Editing, Resources, Supervision. JK: Writing – Review & Editing, Funding acquisition. TB: Conceptualization, Resources, Data Curation, Writing – Review & Editing, Supervision, Project administration, Funding acquisition. All authors contributed to the article and approved the submitted version.
The present work was supported by the German Research Foundation (Deutsche Forschungsgemeinschaft, DFG, project 432290010, JK and TB).
JK, MH and AS are Cofounders of Bonescreen GmbH.
The remaining authors declare that the research was conducted in the absence of any commercial or financial relationships that could be construed as a potential conflict of interest.
All claims expressed in this article are solely those of the authors and do not necessarily represent those of their affiliated organizations, or those of the publisher, the editors and the reviewers. Any product that may be evaluated in this article, or claim that may be made by its manufacturer, is not guaranteed or endorsed by the publisher.
1. Consensus development conference: Diagnosis, prophylaxis, and treatment of osteoporosis. Am J Med (1993) 94(6):646–50. doi: 10.1016/0002-9343(93)90218-e
2. Hernlund E, Svedbom A, Ivergård M, Compston J, Cooper C, Stenmark J, et al. Osteoporosis in the european union: Medical management, epidemiology and economic burden. a report prepared in collaboration with the international osteoporosis foundation (Iof) and the european federation of pharmaceutical industry associations (Efpia). Arch Osteoporos (2013) 8(1):136. doi: 10.1007/s11657-013-0136-1
3. Roux C, Fechtenbaum J, Kolta S, Briot K, Girard M. Mild prevalent and incident vertebral fractures are risk factors for new fractures. Osteoporos Int (2007) 18(12):1617–24. doi: 10.1007/s00198-007-0413-1
4. Naves M, Diaz-Lopez JB, Gomez C, Rodriguez-Rebollar A, Rodriguez-Garcia M, Cannata-Andia JB. The effect of vertebral fracture as a risk factor for osteoporotic fracture and mortality in a spanish population. Osteoporos Int (2003) 14(6):520–4. doi: 10.1007/s00198-003-1405-4
5. Roux C, Briot K. Imminent fracture risk. Osteoporos Int (2017) 28(6):1765–9. doi: 10.1007/s00198-017-3976-5
6. Lunt M, O'Neill TW, Felsenberg D, Reeve J, Kanis JA, Cooper C, et al. Characteristics of a prevalent vertebral deformity predict subsequent vertebral fracture: Results from the european prospective osteoporosis study (Epos). Bone (2003) 33(4):505–13. doi: 10.1016/s8756-3282(03)00248-5
7. Delmas PD, Genant HK, Crans GG, Stock JL, Wong M, Siris E, et al. Severity of prevalent vertebral fractures and the risk of subsequent vertebral and nonvertebral fractures: Results from the more trial. Bone (2003) 33(4):522–32. doi: 10.1016/s8756-3282(03)00241-2
8. Rachner TD, Khosla S, Hofbauer LC. Osteoporosis: Now and the future. Lancet (2011) 377(9773):1276–87. doi: 10.1016/s0140-6736(10)62349-5
9. Sambrook P, Cooper C. Osteoporosis. Lancet (2006) 367(9527):2010–8. doi: 10.1016/S0140-6736(06)68891-0
10. HHS. Bone health and osteoporosis: A report of the surgeon general. Rockville, MD: US Department of Health and Human Services, Office of the Surgeon General (2004).
11. Kanis JA, Johnell O, Oden A, Johansson H, McCloskey E. Frax and the assessment of fracture probability in men and women from the uk. Osteoporos Int (2008) 19(4):385–97. doi: 10.1007/s00198-007-0543-5
12. Kanis JA, Johnell O, Oden A, Borgstrom F, Zethraeus N, De Laet C, et al. The risk and burden of vertebral fractures in sweden. Osteoporos Int (2004) 15(1):20–6. doi: 10.1007/s00198-003-1463-7
13. Rehman Q, Lang T, Modin G, Lane NE. Quantitative computed tomography of the lumbar spine, not dual x-ray absorptiometry, is an independent predictor of prevalent vertebral fractures in postmenopausal women with osteopenia receiving long-term glucocorticoid and hormone-replacement therapy. Arthritis Rheum (2002) 46(5):1292–7. doi: 10.1002/art.10277
14. Löffler MT, Jacob A, Valentinitsch A, Rienmüller A, Zimmer C, Ryang YM, et al. Improved prediction of incident vertebral fractures using opportunistic qct compared to dxa. Eur Radiol (2019) 29(9):4980–9. doi: 10.1007/s00330-019-06018-w
15. Arabi A, Baddoura R, Awada H, Khoury N, Haddad S, Ayoub G, et al. Discriminative ability of dual-energy x-ray absorptiometry site selection in identifying patients with osteoporotic fractures. Bone (2007) 40(4):1060–5. doi: 10.1016/j.bone.2006.11.017
16. Maricic M. Use of dxa-based technology for detection and assessment of risk of vertebral fracture in rheumatology practice. Curr Rheumatol Rep (2014) 16(8):436. doi: 10.1007/s11926-014-0436-5
17. Lin W, He C, Xie F, Chen T, Zheng G, Yin H, et al. Discordance in lumbar bone mineral density measurements by quantitative computed tomography and dual-energy x-ray absorptiometry in postmenopausal women: A prospective comparative study. Spine J (2023) 23(2):295–304. doi: 10.1016/j.spinee.2022.10.014
18. Link TM. Osteoporosis imaging: State of the art and advanced imaging. Radiology (2012) 263(1):3–17. doi: 10.1148/radiol.2631201201
19. Link TM, Kazakia G. Update on imaging-based measurement of bone mineral density and quality. Curr Rheumatol Rep (2020) 22(5):13. doi: 10.1007/s11926-020-00892-w
20. Engelke K, Adams JE, Armbrecht G, Augat P, Bogado CE, Bouxsein ML, et al. Clinical use of quantitative computed tomography and peripheral quantitative computed tomography in the management of osteoporosis in adults: The 2007 iscd official positions. J Clin Densitom (2008) 11(1):123–62. doi: 10.1016/j.jocd.2007.12.010
21. Bodden J, Sun D, Joseph GB, Huang LW, Andreadis C, Hughes-Fulford M, et al. Identification of non-hodgkin lymphoma patients at risk for treatment-related vertebral density loss and fractures. Osteoporos Int (2021) 32(2):281–91. doi: 10.1007/s00198-020-05577-9
22. Dieckmeyer M, Löffler MT, El Husseini M, Sekuboyina A, Menze B, Sollmann N, et al. Level-specific volumetric bmd threshold values for the prediction of incident vertebral fractures using opportunistic qct: A case-control study. Front Endocrinol (Lausanne) (2022) 13:882163. doi: 10.3389/fendo.2022.882163
23. Sollmann N, Kirschke JS, Kronthaler S, Boehm C, Dieckmeyer M, Vogele D, et al. Imaging of the osteoporotic spine - quantitative approaches in diagnostics and for the prediction of the individual fracture risk. Rofo (2022) 194(10):1088–99. doi: 10.1055/a-1770-4626
24. Sollmann N, Löffler MT, El Husseini M, Sekuboyina A, Dieckmeyer M, Rühling S, et al. Automated opportunistic osteoporosis screening in routine computed tomography of the spine: Comparison with dedicated quantitative ct. J Bone Miner Res (2022) 37(7):1287–96. doi: 10.1002/jbmr.4575
25. Löffler MT, Jacob A, Scharr A, Sollmann N, Burian E, El Husseini M, et al. Automatic opportunistic osteoporosis screening in routine ct: Improved prediction of patients with prevalent vertebral fractures compared to dxa. Eur Radiol (2021) 31(8):6069–77. doi: 10.1007/s00330-020-07655-2
26. Rühling S, Navarro F, Sekuboyina A, El Husseini M, Baum T, Menze B, et al. Automated detection of the contrast phase in mdct by an artificial neural network improves the accuracy of opportunistic bone mineral density measurements. Eur Radiol (2022) 32(3):1465–74. doi: 10.1007/s00330-021-08284-z
27. Sekuboyina A, Husseini ME, Bayat A, Löffler M, Liebl H, Li H, et al. Verse: A vertebrae labelling and segmentation benchmark for multi-detector ct images. Med Image Anal (2021) 73:102166. doi: 10.1016/j.media.2021.102166
28. Liebl H, Schinz D, Sekuboyina A, Malagutti L, Loffler MT, Bayat A, et al. A computed tomography vertebral segmentation dataset with anatomical variations and multi-vendor scanner data. Sci Data (2021) 8(1):284. doi: 10.1038/s41597-021-01060-0
29. Loffler MT, Sekuboyina A, Jacob A, Grau AL, Scharr A, El Husseini M, et al. A vertebral segmentation dataset with fracture grading. Radiol Artif Intell (2020) 2(4):e190138. doi: 10.1148/ryai.2020190138
30. Bauer JS, Muller D, Ambekar A, Dobritz M, Matsuura M, Eckstein F, et al. Detection of osteoporotic vertebral fractures using multidetector ct. Osteoporos Int (2006) 17(4):608–15. doi: 10.1007/s00198-005-0023-8
31. Marsh JL, Slongo TF, Agel J, Broderick JS, Creevey W, DeCoster TA, et al. Fracture and dislocation classification compendium - 2007: Orthopaedic trauma association classification, database and outcomes committee. J Orthop Trauma (2007) 21(10 Suppl):S1–133. doi: 10.1097/00005131-200711101-00001
32. Akaike H. Information theory and an extension of the maximum likelihood principle. In: Parzen E, Tanabe K, Kitagawa G, editors. Selected papers of hirotugu akaike. New York, NY: Springer New York (1998). p. 199–213.
33. NIH consensus development panel on osteoporosis prevention d, therapy. osteoporosis prevention, diagnosis, and therapy. JAMA (2001) 285(6):785–95. doi: 10.1001/jama.285.6.785
34. Chesnut CH III. Osteoporosis, an underdiagnosed disease. JAMA (2001) 286(22):2865–6. doi: 10.1001/jama.286.22.2865
35. Allaire BT, Lu D, Johannesdottir F, Kopperdahl D, Keaveny TM, Jarraya M, et al. Prediction of incident vertebral fracture using ct-based finite element analysis. Osteoporos Int (2019) 30(2):323–31. doi: 10.1007/s00198-018-4716-1
36. Therkildsen J, Nissen L, Jorgensen HS, Thygesen J, Ivarsen P, Frost L, et al. Thoracic bone mineral density derived from cardiac ct is associated with greater fracture rate. Radiology (2020) 296(3):499–508. doi: 10.1148/radiol.2020192706
37. Johannesdottir F, Allaire B, Kopperdahl DL, Keaveny TM, Sigurdsson S, Bredella MA, et al. Bone density and strength from thoracic and lumbar ct scans both predict incident vertebral fractures independently of fracture location. Osteoporos Int (2021) 32(2):261–9. doi: 10.1007/s00198-020-05528-4
38. Dziak JJ, Coffman DL, Lanza ST, Li R, Jermiin LS. Sensitivity and specificity of information criteria. Brief Bioinform (2020) 21(2):553–65. doi: 10.1093/bib/bbz016
39. de Graaf MA, Jager KJ, Zoccali C, Dekker FW. Matching, an appealing method to avoid confounding? Nephron Clin Pract (2011) 118(4):c315–8. doi: 10.1159/000323136
41. Bligh M, Bidaut L, White RA, Murphy WA, Stevens DM, Cody DD. Helical multidetector row quantitative computed tomography (Qct) precision. Acad Radiol (2009) 16(2):150–9. doi: 10.1016/j.acra.2008.08.007
42. Suetens P. Fundamentals of medical imaging. Cambridge Medicine: Cambridge university press (2017).
Keywords: osteoporosis, osteoporotic fractures, bone density, tomography, x-ray computed, artificial intelligence
Citation: Bodden J, Dieckmeyer M, Sollmann N, Burian E, Rühling S, Löffler MT, Sekuboyina A, El Husseini M, Zimmer C, Kirschke JS and Baum T (2023) Incidental vertebral fracture prediction using neuronal network-based automatic spine segmentation and volumetric bone mineral density extraction from routine clinical CT scans. Front. Endocrinol. 14:1207949. doi: 10.3389/fendo.2023.1207949
Received: 18 April 2023; Accepted: 14 June 2023;
Published: 17 July 2023.
Edited by:
Phil Salmon, Bruker microCT, BelgiumReviewed by:
Hiromitsu Shinozaki, Gunma University, JapanCopyright © 2023 Bodden, Dieckmeyer, Sollmann, Burian, Rühling, Löffler, Sekuboyina, El Husseini, Zimmer, Kirschke and Baum. This is an open-access article distributed under the terms of the Creative Commons Attribution License (CC BY). The use, distribution or reproduction in other forums is permitted, provided the original author(s) and the copyright owner(s) are credited and that the original publication in this journal is cited, in accordance with accepted academic practice. No use, distribution or reproduction is permitted which does not comply with these terms.
*Correspondence: Jannis Bodden, amFubmlzLmJvZGRlbkB0dW0uZGU=
Disclaimer: All claims expressed in this article are solely those of the authors and do not necessarily represent those of their affiliated organizations, or those of the publisher, the editors and the reviewers. Any product that may be evaluated in this article or claim that may be made by its manufacturer is not guaranteed or endorsed by the publisher.
Research integrity at Frontiers
Learn more about the work of our research integrity team to safeguard the quality of each article we publish.