
94% of researchers rate our articles as excellent or good
Learn more about the work of our research integrity team to safeguard the quality of each article we publish.
Find out more
ORIGINAL RESEARCH article
Front. Endocrinol. , 28 July 2023
Sec. Endocrinology of Aging
Volume 14 - 2023 | https://doi.org/10.3389/fendo.2023.1201132
 Yuqing Li1
 Jiaofeng Gui1
 Haiyang Liu2Lei-lei Guo3Jinlong Li4Yunxiao Lei5Xiaoping Li6Lu Sun6Liu Yang7
 Ting Yuan5Congzhi Wang7
 Dongmei Zhang8Huanhuan Wei5Jing Li9Mingming Liu9Ying Hua10
 Lin Zhang7*
Objective: To predict the optimal cut-off values for screening and predicting metabolic syndrome(MetS) in a middle-aged and elderly Chinese population using 13 obesity and lipid-related indicators, and to identify the most suitable predictors.
Methods: The data for this cross-sectional investigation came from the China Health and Retirement Longitudinal Study (CHARLS), including 9457 middle-aged and elderly people aged 45-98 years old. We examined 13 indicators, including waist circumference (WC), body mass index (BMI), waist-height ratio (WHtR), visceral adiposity index (VAI), a body shape index (ABSI), body roundness index (BRI), lipid accumulation product index (LAP), conicity index (CI), Chinese visceral adiposity index (CVAI), triglyceride-glucose index (TyG-index) and their combined indices (TyG-BMI, TyG-WC, TyG-WHtR). The receiver operating characteristic curve (ROC) was used to determine the usefulness of indicators for screening for MetS in the elderly and to determine their cut-off values, sensitivity, specificity, and area under the curve (AUC). Association analysis of 13 obesity-related indicators with MetS was performed using binary logistic regression analysis.
Results: A total of 9457 middle-aged and elderly Chinese were included in this study, and the overall prevalence of the study population was 41.87% according to the diagnostic criteria of NCEP ATP III. According to age and gender, the percentage of males diagnosed with MetS was 30.67% (45-54 years old: 30.95%, 55-64 years old: 41.02%, 65-74 years old: 21.19%, ≥ 75 years old: 6.84%). The percentage of females diagnosed with MetS was 51.38% (45-54 years old: 31.95%, 55-64 years old: 39.52%, 65-74 years old: 20.43%, ≥ 75 years old: 8.10%). The predictive power of Tyg-related parameters was more prominent in both sexes. In addition, LAP and CVAI are also good at predicting MetS. ABSI had a poor prediction ability.
Conclusions: Among the middle-aged and elderly population in China, after adjusting for confounding factors, all the indicators except ABSI had good predictive power. The predictive power of Tyg-related parameters was more prominent in both sexes. In addition, LAP and CVAI are also good at predicting MetS.
Metabolic syndrome(MetS) (1, 2) refers to an energy disorder characterized by the presence of at least any three or more of the following risk factors: elevated fasting glucose, elevated blood pressure, elevated triglyceride levels, reduced high-density lipoprotein cholesterol (HDL-C), and obesity (especially central obesity). A study by scholars Ranasinghe et al. (3) noted that the Asia-Pacific region faces a serious epidemic of MetS. In most countries, nearly one-fifth or more of adults are affected by MetS with a long-term increase in prevalence (3). MetS is more widespread in the senior population (4–6). Over 30% of middle-aged and older persons globally had MetS (7), while a research conducted in China in 2020 (8) indicated that 33.38% of the Chinese population had MetS.
In addition, obesity and abdominal fat deposition lead to several metabolic abnormalities that result in increased hepatic glucose output and decreased insulin sensitivity in skeletal muscle, liver, and adipose tissue, processes that are closely linked to the pathogenesis of type 2 diabetes (9). In recent years, the clinical identification of MetS is becoming increasingly important because the MetS has been shown to increase the risk of type 2 diabetes by 5-fold and the risk of cardiovascular disease by 2-fold over 5 to 10 years (10). It is found that the mortality rate of patients with MetS is much higher than that of patients without MetS (11). Furthermore, patients with MetS have a 2- to 4-fold increased risk of stroke, a 3- to 4-fold increased risk of myocardial infarction, and a 2-fold increased risk of dying from such events compared to those without MetS, regardless of a previous history of cardiovascular events (12, 13). Therefore, it is significant to find the best predictor of MetS.
The World Health Organization (WHO) (14), the International Diabetes Federation (IDF) (15), and the NCEP ATP III (2005) (1, 2) have developed some of the more widely used diagnostic criteria for MetS at the moment. However, it can be difficult to use these criteria for diagnosis during extensive screening in primary healthcare facilities. In order to forecast the risk of MetS, there is a clinical need for more simple and user-friendly screening indicators.
Direct assessment of obesity and fat distribution by computed tomography (CT) or magnetic resonance imaging (MRI) is the gold standard (16), but this method is expensive and complex for the general public. The other method is an indirect response to obesity through anthropometric measurements. In recent years, there has been growing epidemiological evidence that simple and easily available anthropometric measures can be used to predict the likelihood of MetS (17, 18). Body mass index (BMI) has been utilized as the most common measure of obesity and overweight in earlier research (19). In a study by Navarra (20), it was proposed that the triglyceride-glucose index(Tyg index) is the best predictor of metabolic disorders. In addition, waist-height ratio (WHtR) (21) was the best indicator of dyslipidemia and hyperglycemia, while waist circumference (WC) was also a better predictor of blood pressure abnormalities. In Iran, the results of a study similarly showed (22) that WHtR has a better diagnostic value for MetS in the elderly, followed by BMI, visceral adiposity index (VAI), waist-to-hip ratio, and neck circumference, with a body shape index (ABSI) having a weaker predictive value (23). Body roundness index (BRI) has been proposed as a potentially useful clinical predictor of MetS in Peruvian adults (24).
The best way to use anthropometric indicators to predict metabolic disease is still up for debate (25), despite the fact that all of these indicators can be used to assess obesity and metabolic disease. This is because anthropometric indicators are influenced by factors like race, age, and gender, and body composition may differ across populations and ethnicities (26–28). The development of programs to alter risk factors and aid in delaying the start and progression of MetS later in life can be aided by the early identification of those who are at risk. Consequently, the goal of this study was to explore the screening and predictive roles of obesity and lipid-related indicators for MetS in middle-aged and elderly Chinese, as well as the optimal predicted cut-off values to offer a basis for MetS prevention and therapy.
The China Center for Economic Research at Peking University performed the 2011 China Health and Retirement Longitudinal Survey Wave (CHARLS Wave 2011), a nationally representative longitudinal investigation, which provided the data for our study (29). Participants in CHARLS were recruited from May 2011 to March 2012. 9,457 individuals from the CHARLS Wave 2011 study were included in our analysis after missing data subjects were removed. Without any direct interaction with people, all data are provided in the open as microdata at http://charls.pku.edu.cn/index/zh-cn.html. All participants gave their informed consent prior to the collection of data, and the study was approved by the Ethics Committee of the China Center for Economic Research at Peking University.
Study subjects for this investigation were chosen from the China Health and Retirement Longitudinal Study (CHARLS), Wave 1 (2011). The CHARLS Wave 2011 was used to choose participants for this study (29). The average age of the 9457 individuals that participated in CHARLS was 59.28 years (standard deviation SE=9.64, range 45-98 years). Males had a mean age of 60.29 years (SE=9.33; range 45-98 years) while females had a mean age of 58.41 years (SE=9.81; range 45-92 years).
Baseline characteristics including age, sex, education, marital status, living place, smoking status, drinking status, taking activities, and Having regular exercises, and the counts of Chronic diseases were collected by self-report. Taking activities included communicating with friends or providing help to neighbors, friends, or family, or doing a sport, social, or other kind of club or playing Ma-jong, or playing played cards, chess, or going to community club, or taking part in a community-related organization, or doing voluntary or charity work, or caring for a sick or disabled adult, or attending an educational or training course, or stock investment, or using the Internet were dichotomized as ever (at least once a month) or never (30). Chronic diseases included cancer or malignant tumor, dyslipidemia, hypertension, chronic lung diseases, diabetes or high blood sugar, liver disease, kidney disease, asthma were reported by the respondents, arthritis or rheumatism, stomach or other digestive disease, heart attack, coronary heart disease, angina, congestive heart failure, or other heart problems, emotional, nervous, or psychiatric problems, memory-related disease, stroke (30). Most variables depended on our previous research studies (31–36).
The NCEP ATP III (2005) (1, 2) put forward the definition and diagnostic criteria of MetS. According to the standard Chinese definition (37, 38), components of MetS are divided into five categories (1): the waist circumference of central obesity is defined as ≥ 80 cm for women and ≥ 90 cm for men (2). Elevated TG levels: TG levels ≥ 150 mg/dL (3). Low HDL-C levels: HDL-C levels< 40 mg/dL for men and< 50 mg/dL for women (4). Elevated BP: systolic blood pressure (SBP) ≥130 mmHg and/or diastolic blood pressure (DBP) of ≥ 85 mmHg or using antihypertensive therapy (5). Elevated FPG levels: FPG levels ≥ 100 mg/dL or using antidiabetic medications or self-reported medical history of diabetes. When 3 of 5 of the listed characteristics are present, a diagnosis of metabolic syndrome can be made.
The Chinese Center for Disease Control and Prevention in Beijing received the venous blood samples within two weeks of them leaving the Centers for Disease Control and Prevention (CDC) station. The samples were immediately stored and frozen at -20°C before being delivered. When the necessary assays were completed in the lab of the Chinese Medical University, they were put in a deep refrigerator and kept at -80°C. At the Capital Medical University Youanmen Clinical Laboratory, triglycerides (TG), fasting plasma glucose (FPG), and high-density lipoprotein cholesterol (HDL-C) were measured using the enzyme colorimetric assay. We divided TG levels into two groups, ≥150 mg/dL and<150 mg/dL, in accordance with a classification that has previously been employed in studies (31). When fasting plasma glucose is ≥126 mg/dL or 7.0 mmol/L and above, it indicates abnormal blood glucose (39). HDL-C values below 40 mg/dL in men and below 50 mg/dL in women were considered abnormal (40).
BMI was calculated by dividing the body weight (kg) by the square of the height (m2) (41, 42). During the blood pressure measurement, which is done in a quiet environment with the left arm on a flat surface with the palm facing upward so that the upper arm is at the same height as the heart, the subject should be at ease while sitting. The blood pressure is then measured using a blood pressure monitor. Hypertension was formerly described as having a systolic blood pressure (SBP) greater than 130 mmHg and/or a diastolic blood pressure (DBP) less than 85 mmHg (43, 44). At the conclusion of expiration, the umbilical level was chosen, and the waist size was measured (45); when the waist circumference of women ≥ 80cm, men ≥ 90cm, known as central obesity. WHtR was calculated by the ratio of waist circumference to height (46). VAI was calculated using BMI, WC, TG and HDL-C, with different formulas for men and women (47). It is important to note that VAI, Chinese visceral adiposity index (CVAI), lipid accumulation product index (LAP) and TyG index were required to perform invasive manipulations to obtain TG and HDL-C. Other indicators were calculated using the following equations (48–55).
Statistical Product Service Solutions (SPSS) software, version 25.0, was used to conduct the analyses (IBM SPSS, Armonk, NY, USA). By sex, sociodemographic traits were analyzed and percentages were provided. To compare the categorical variable distribution across sex, a chi-square test was utilized. The mean and standard deviation were used to express continuous variables. In order to evaluate the variations in mean distributions by sex, independent samples t-tests were utilized. The unadjusted and adjusted relationships between anthropometric and MetS components were evaluated using binary logistic regression. We calculated odds ratios (ORs) and 95% confidence intervals (95%CI) adjusting for age, sex, educational levels, marital status, live place, current smoking, alcohol drinking, activities, exercises, and chronic diseases. To determine the area under the curve (AUC) and 95% confidence interval as a predictor of MetS, the receiver operating characteristic curve (ROC) was utilized (56). The significance of the AUC is that an area greater than 0.9 indicates high accuracy, 0.7-0.9 indicates moderate accuracy, 0.5-0.7 indicates low accuracy, and 0.5 indicates a chance result (57). The ROC curve can also be used to determine sensitivity, specificity, positive predictive value, negative predictive value, positive likelihood ratio, and negative likelihood ratio. The Youden index, which is derived using the formula: [maximum (sensitivity + specificity-1)] (58), which is the maximum vertical distance between the ROC curve and the diagonal or chance line, determines the cut-off values of the predictor based on the highest value.
Table 1 shows the basic characteristics of the participants. A total of 9457 subjects were included in this study, of whom 4340 (45.89%) were male and 5117 (54.11%) were female. Among them, there were significant differences between men and women in age, education, marital status, alcohol consumption, smoking, number of chronic diseases, WC, BMI, WHtR, VAI, ABSI, BRI, LAP, CI, CVAI, TyG index, TyG-BMI, TyG-WC, TyG -WHtR (P< 0.05). However, the distribution of residence, social activities, and physical activity habits were not statistically significant between the male and female subgroups (P > 0.05). Because of these significant differences between males and females (P< 0.05), we performed the main analyses separately by sex.
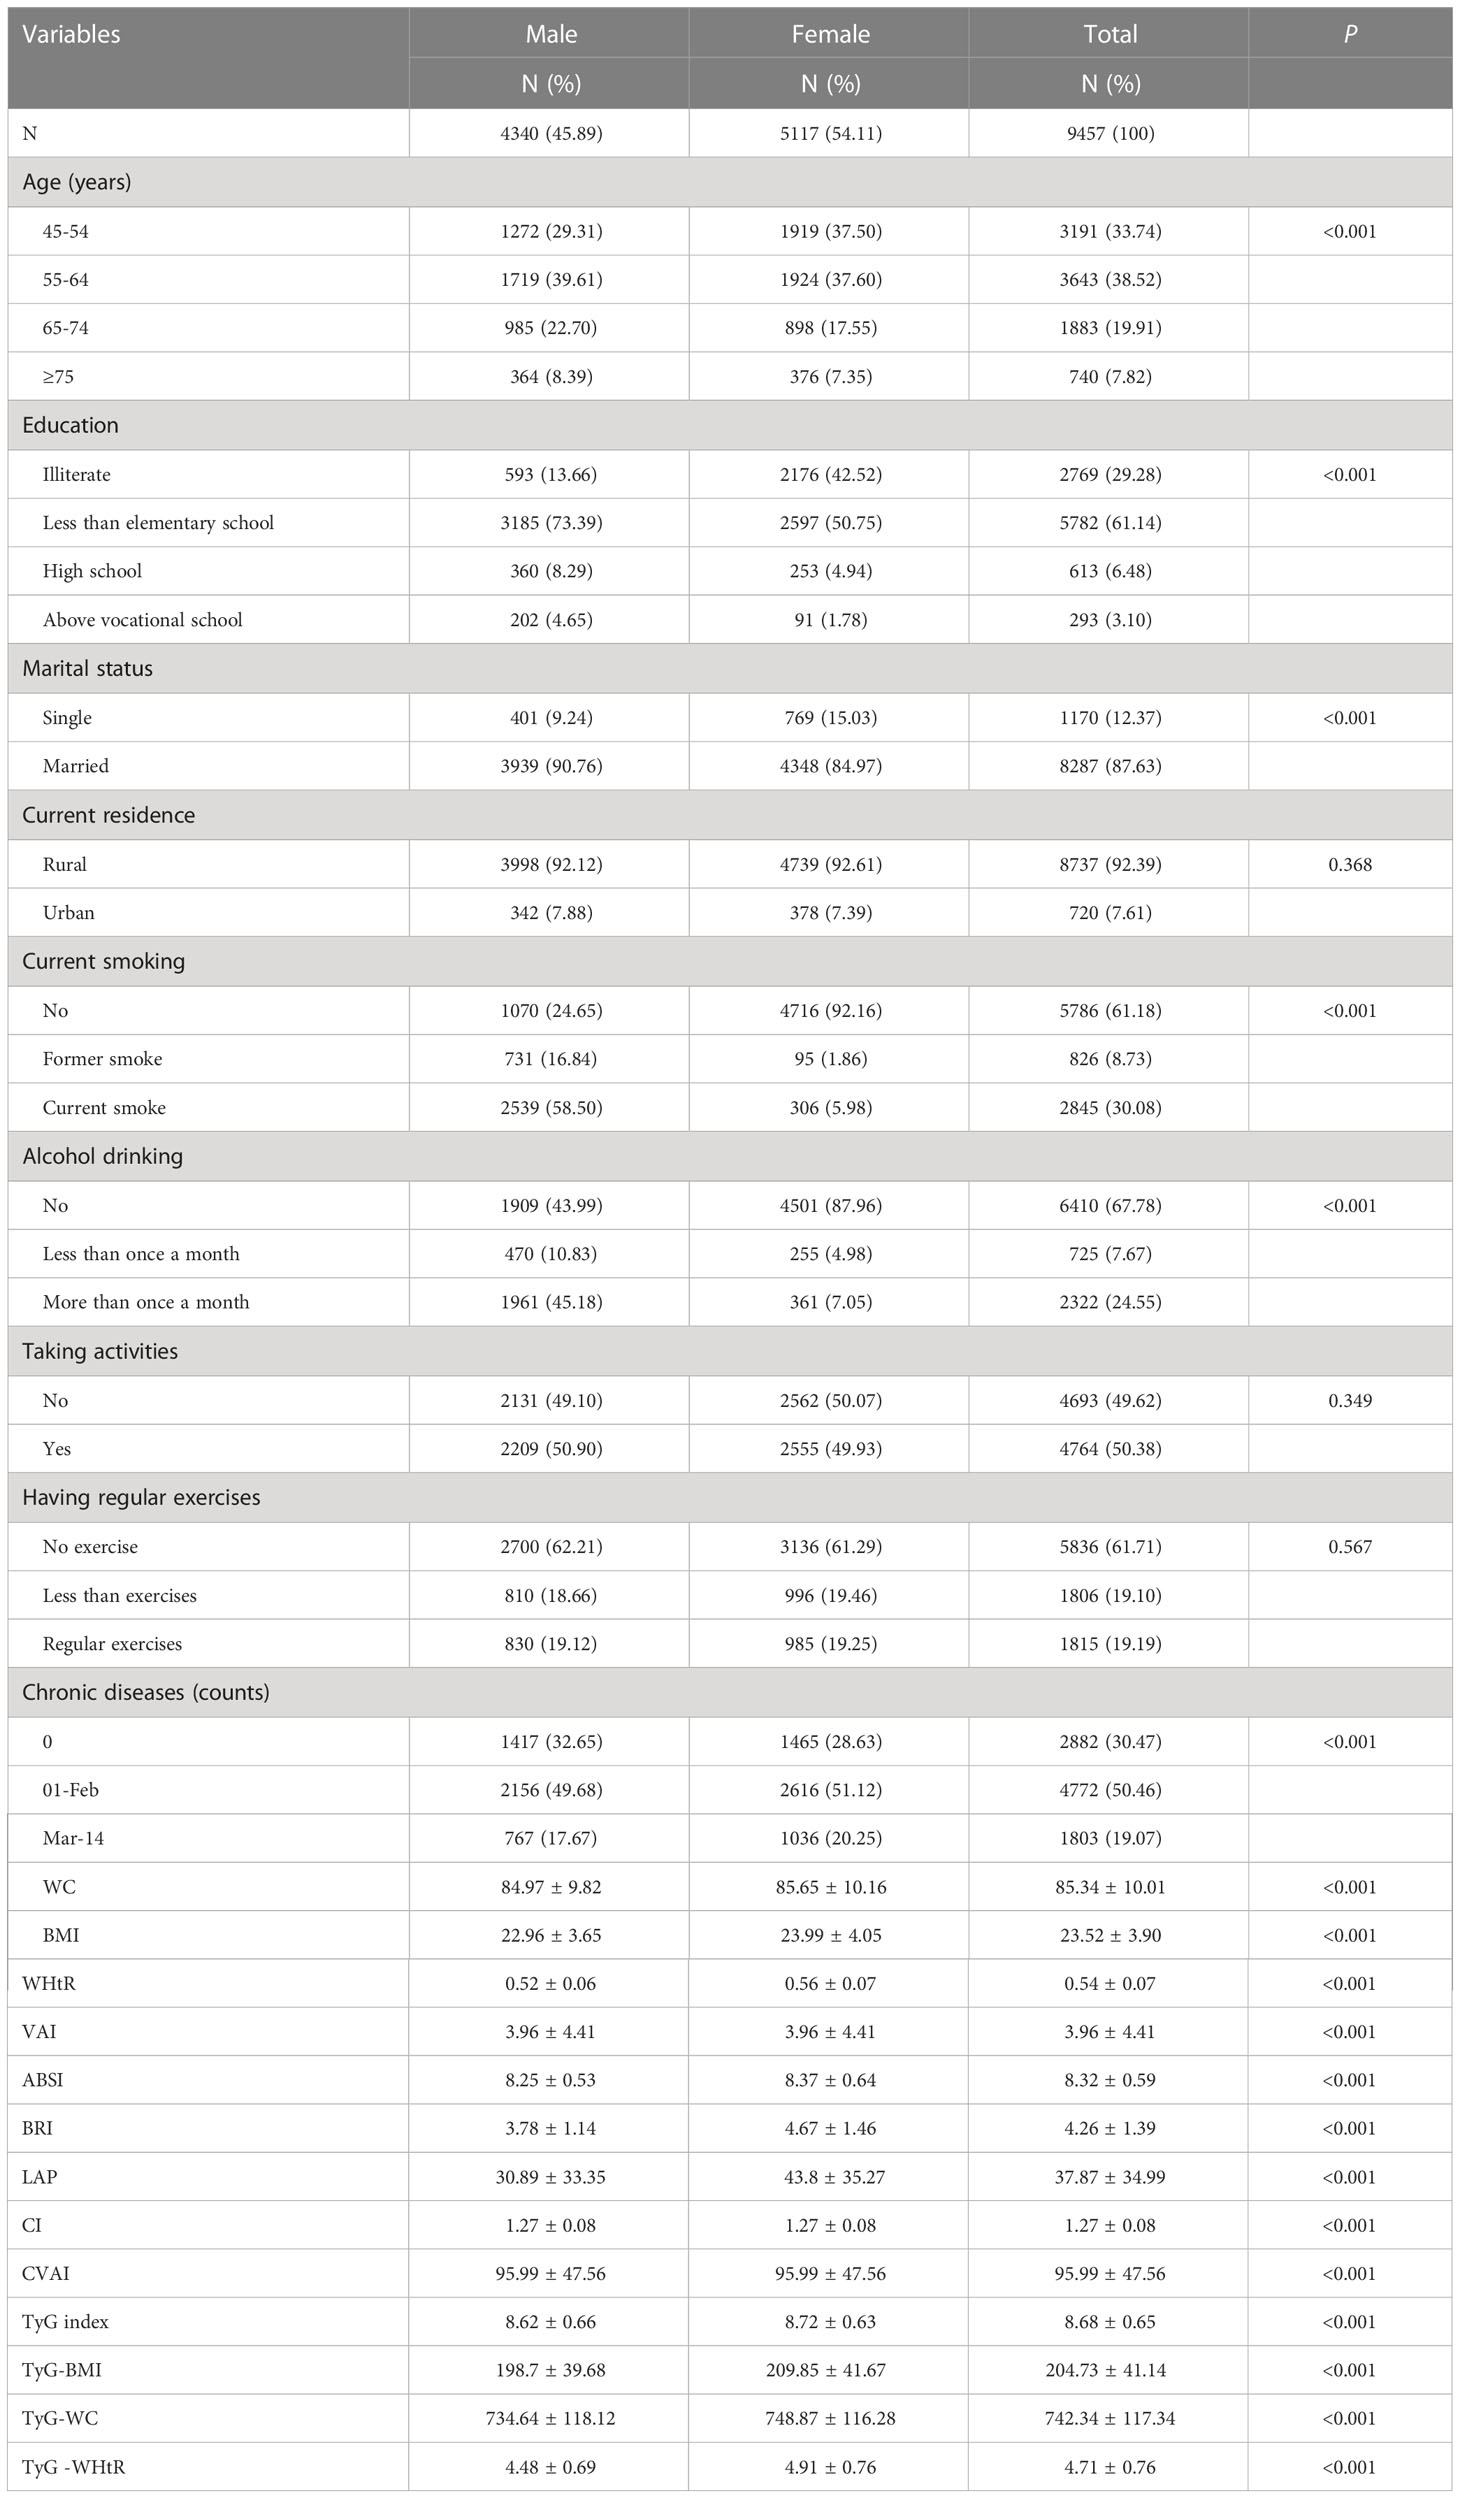
Table 1 Characteristics of participants with full samples (N=9457).
Table 2 shows the baseline characteristics of the study participants with and without MetS by sex. According to the research results, the proportion of women suffering from MetS was much higher (51.83%, compared to 30.67% for men). Men with MetS had significant differences in age, education, current residence, smoking, alcohol consumption, social activity, physical activity, number of chronic diseases, WC, BMI, WHtR, VAI, ABSI, BRI, LAP, CI, CVAI, TyG index, TyG-BMI, TyG-WC and TyG-WHtR (P< 0.05); women had significant differences in all aspects (P< 0.05), with the exception of education and current residence (P > 0.05).
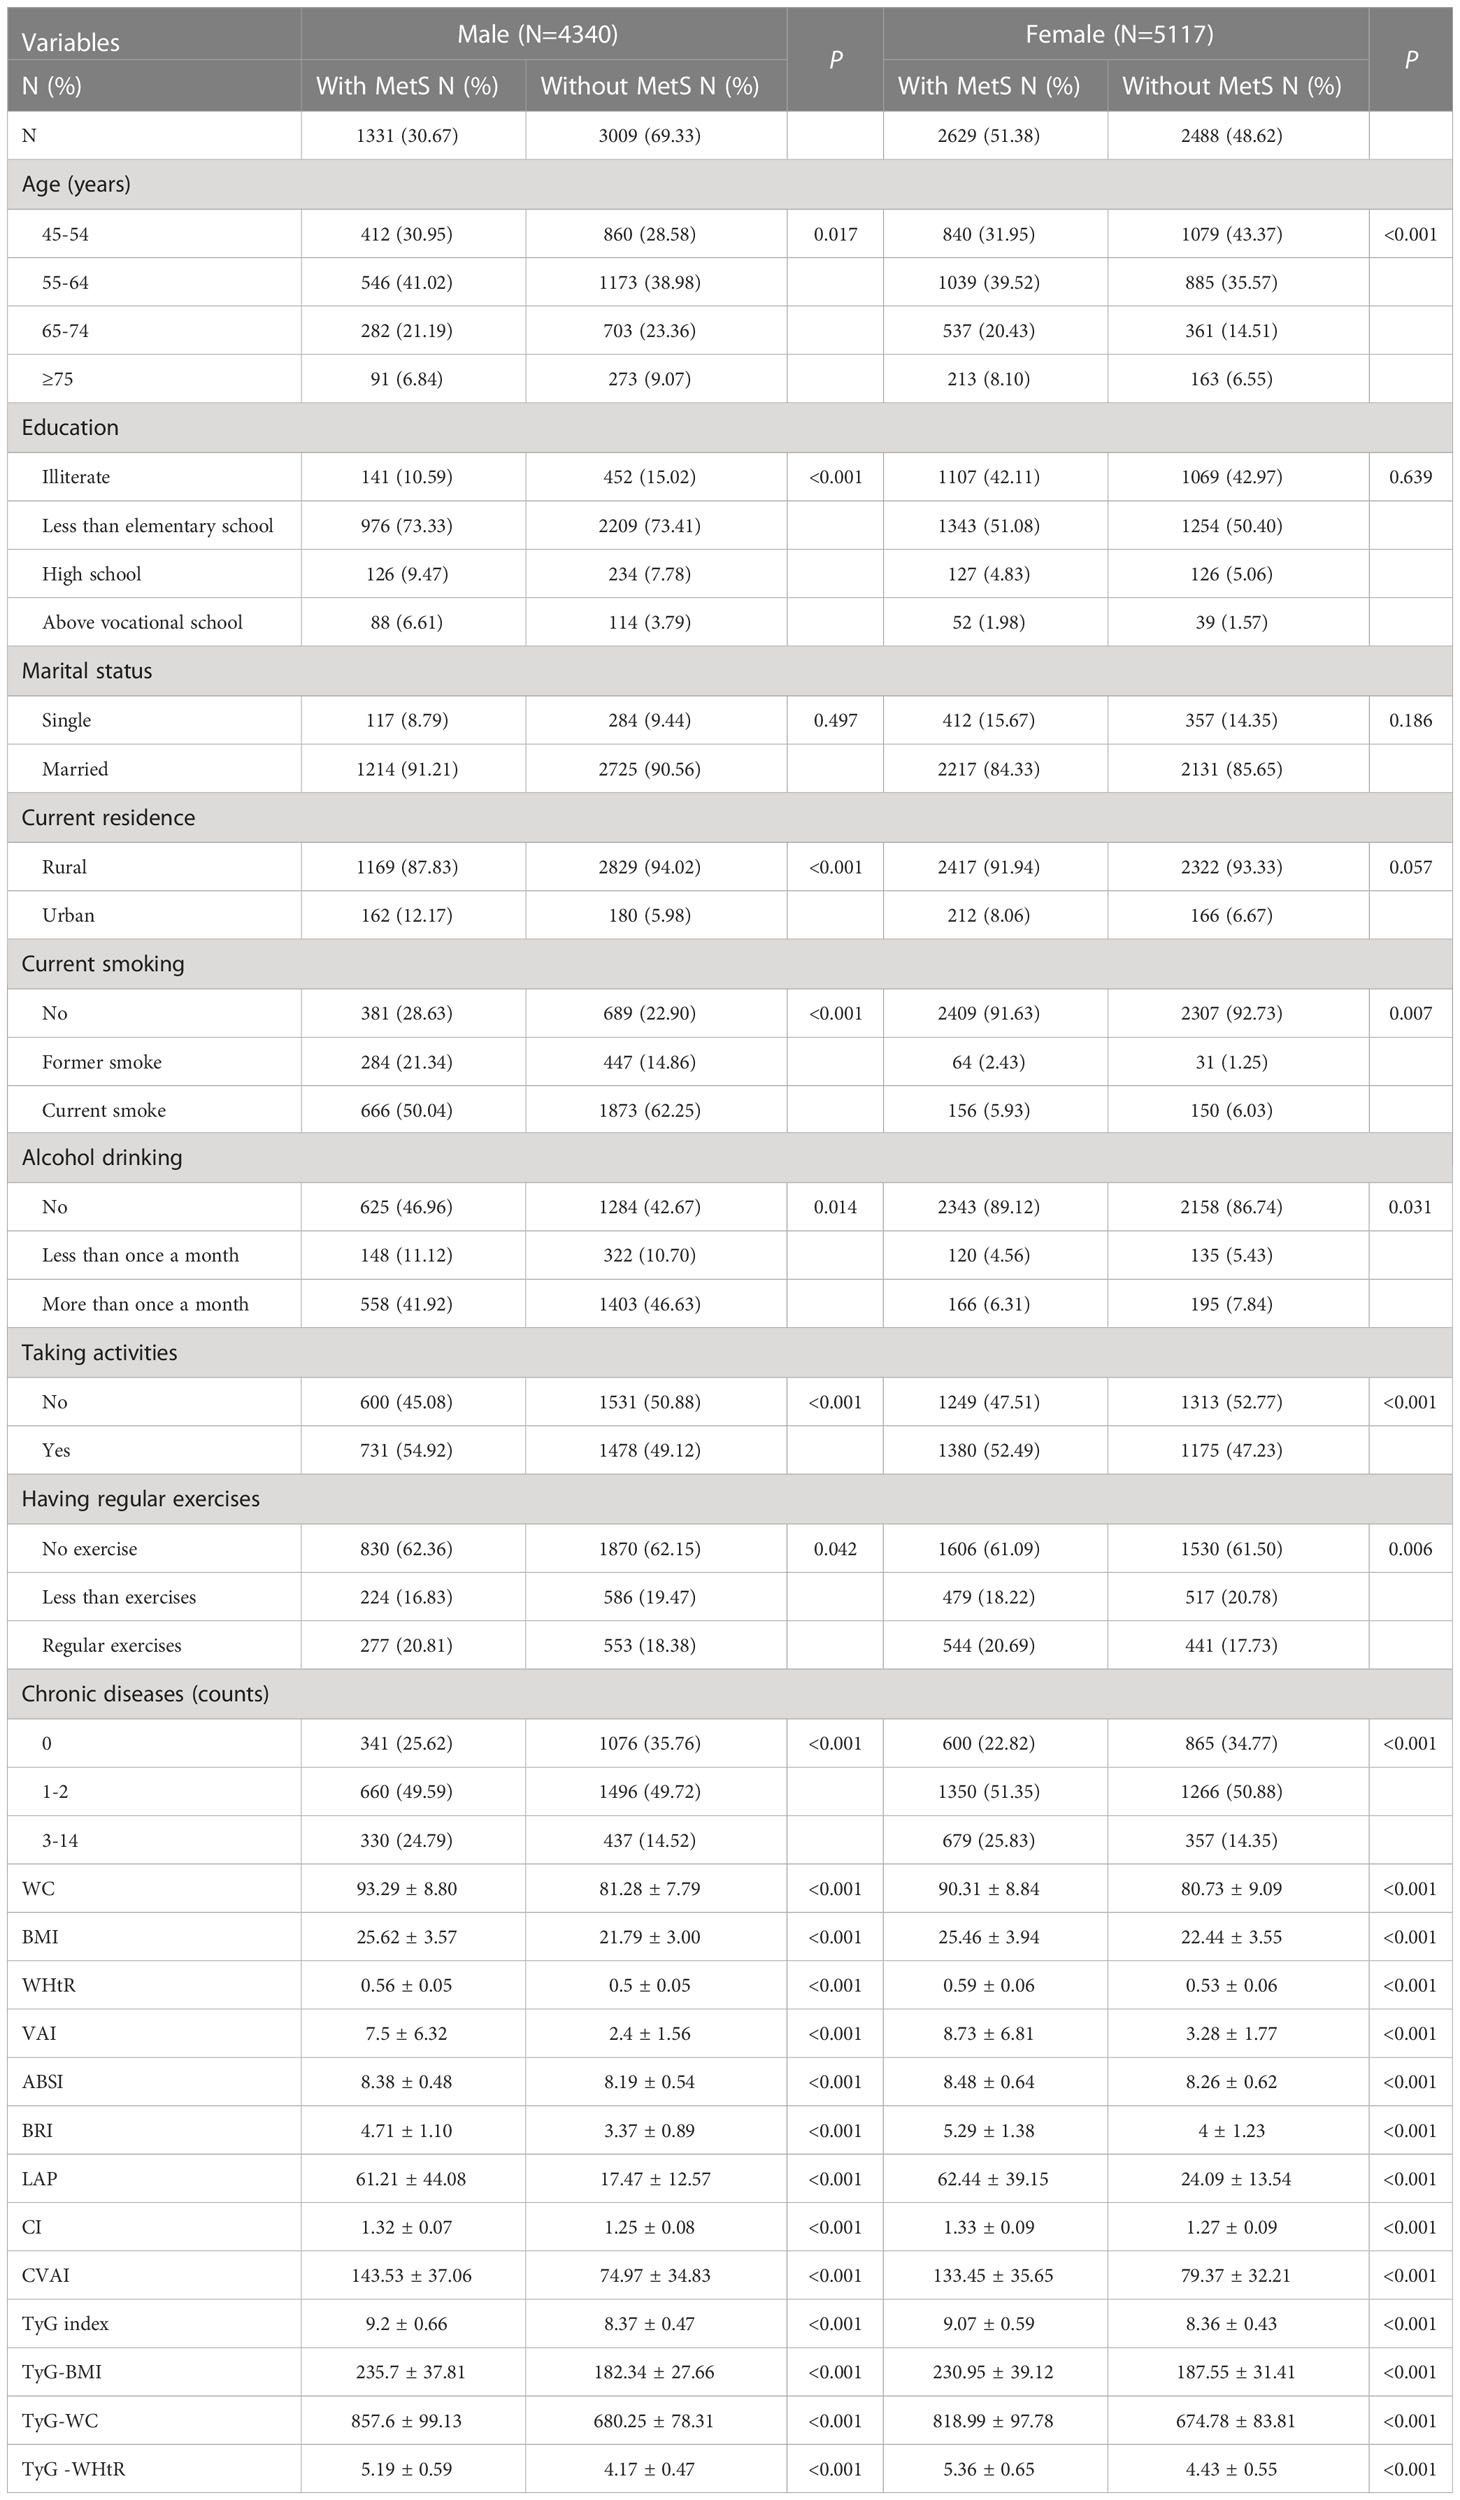
Table 2 Baseline characteristics of the study participants with and without MetS by sex.
Table 3 shows the cut-off values between the AUC, sensitivity, and specificity for obesity and lipid-related indices to detect MetS by sex. We observed the predictive value of obesity and lipid-related indicators for MetS by sex using the ROC. The ROC curves of each indicator in the prediction of MetS risk in men and women are shown in Figures 1, 2 respectively. As shown in the table and figures, among men, the Tyg-WC index was the best predictor of MetS in the middle-aged and elderly male population (AUC=0.924, SE=0.004, 95% CI [0.915,0.932], and optimal cutoffs=763.595). Meanwhile, Tyg-WHtR (AUC=0.917, SE=0.005, 95%CI [0.908,0.926], and optimal cutoffs=4.687) and LAP (AUC=0.912, SE=0.005, 95% CI [0.903,0.921], and optimal cutoffs=27.895) had similar predictive values. Meanwhile, among women, LAP was the most accurate predictor of MetS in middle-aged and elderly women (AUC=0.876, SE=0.005, 95%CI [0.867,0.885], and optimal cutoffs=35.867), CVAI (AUC=0.874, SE=0.005, 95%CI [0.864,0.883], and optimal cutoffs=105.340) and Tyg-WC (AUC=0.873, SE=0.005,95%CI [0.864,0.883], and optimal cutoffs =731.378) had similar predictive values. All of the above indicators were statistically different (P<0.05). In addition, the predictive value of ABSI as a predictor was small in both sexes (P<0.05).
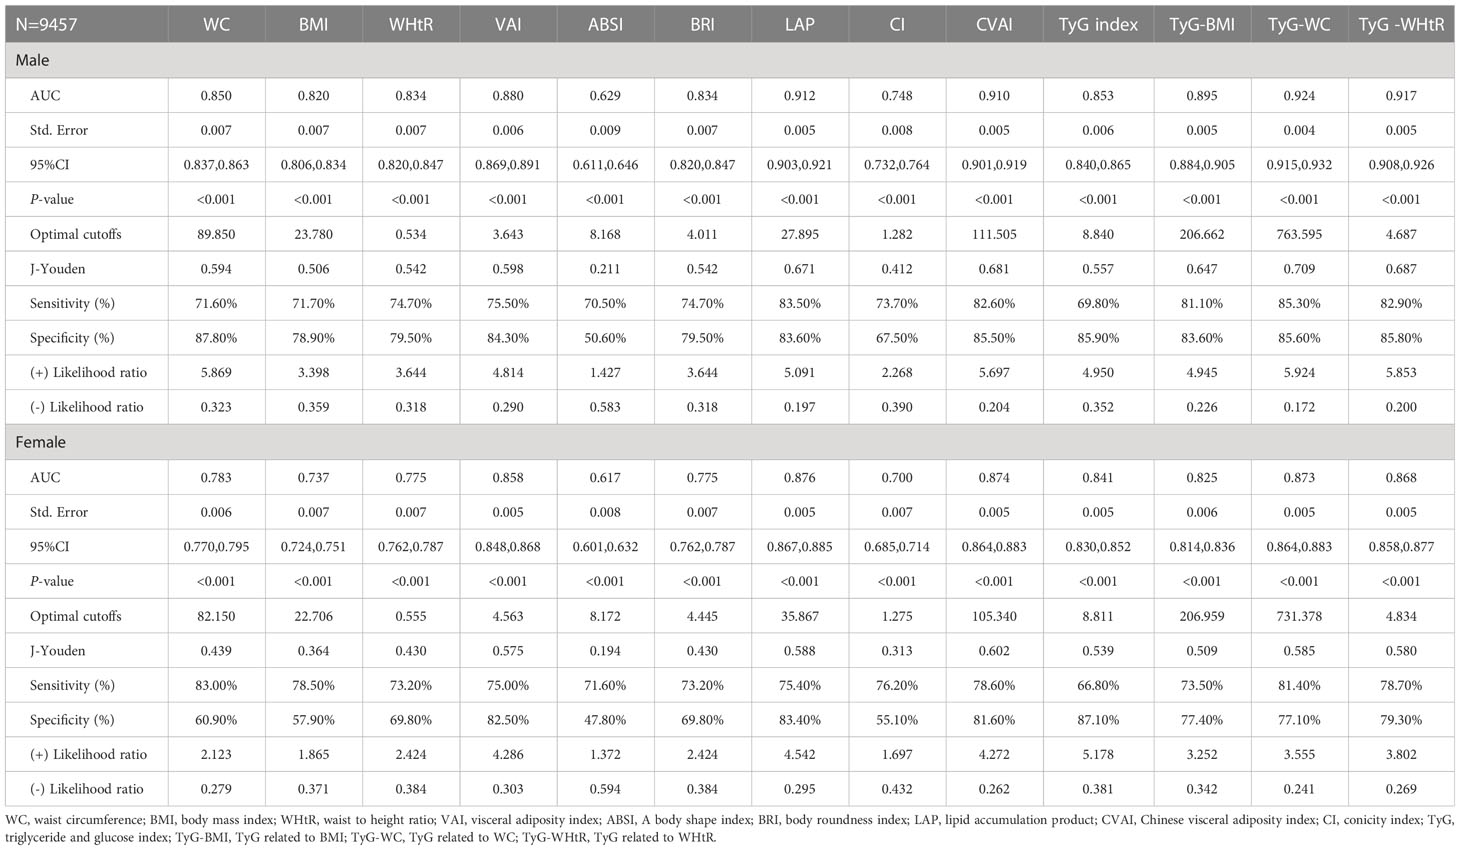
Table 3 Cut-off between AUC, sensitivity and specificity for obesity- and lipid-related indices to detect metabolic syndrome by sex.
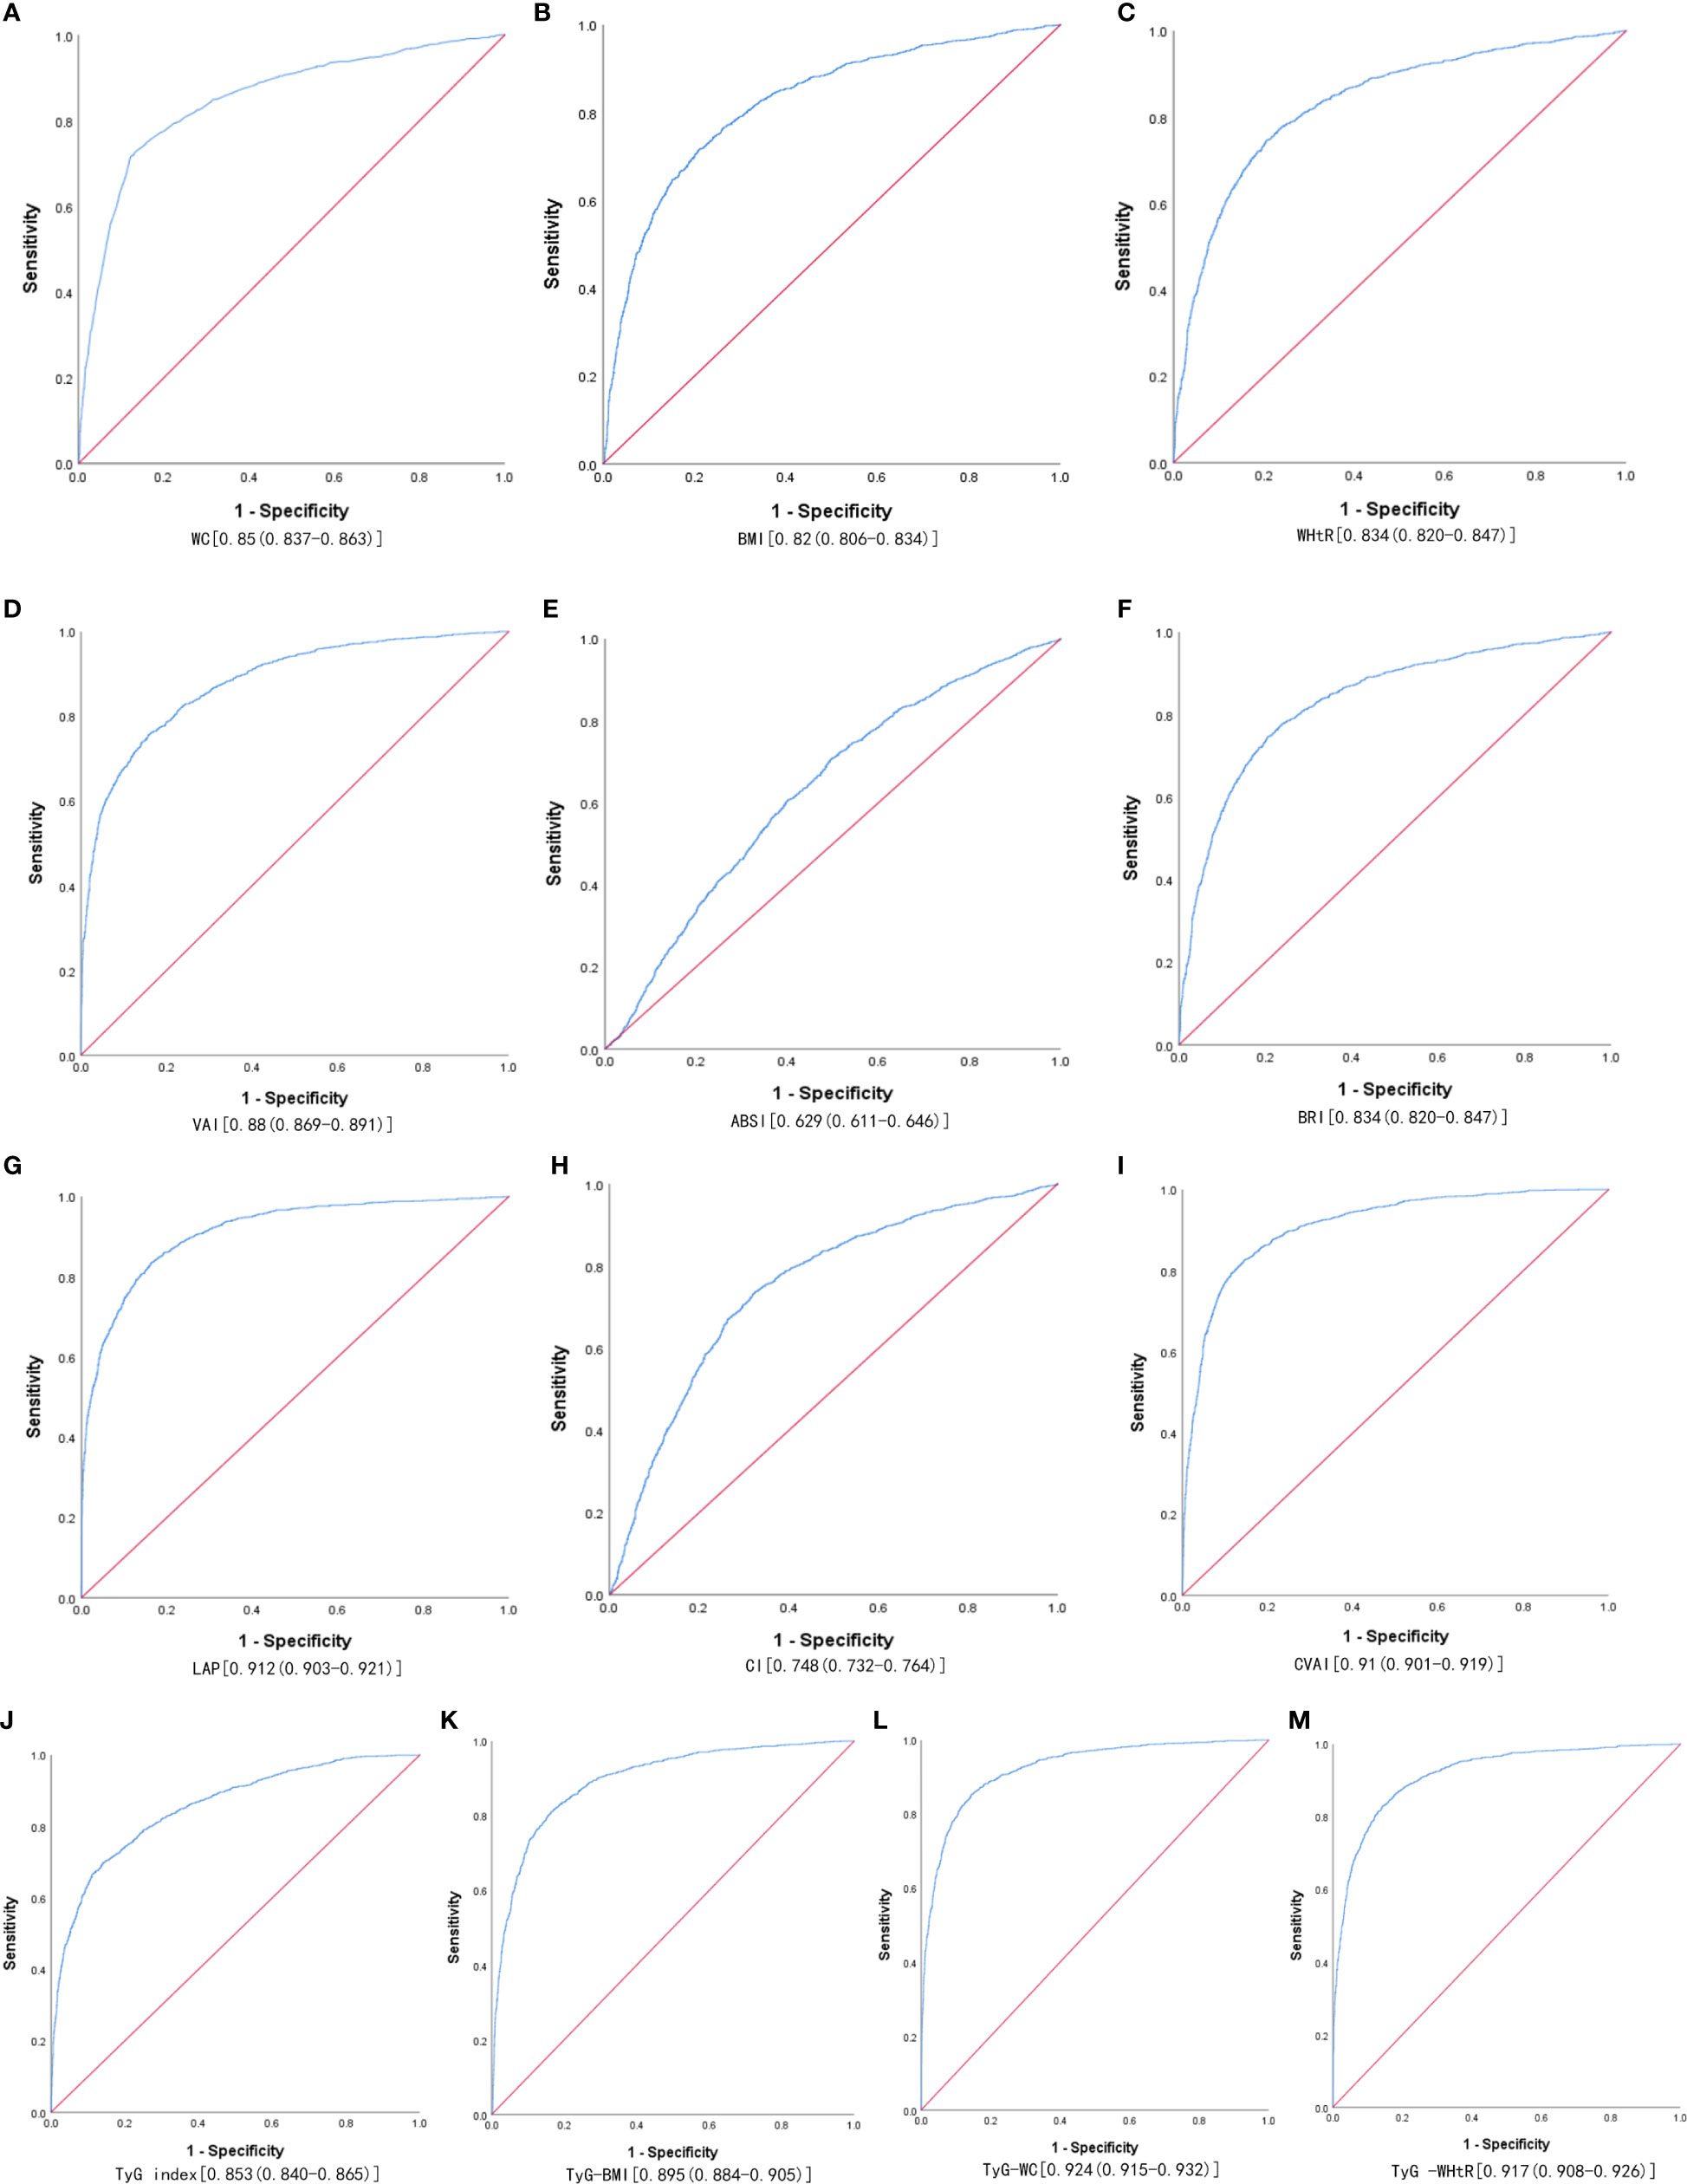
Figure 1 The ROC curves of each indicator in the prediction of MetS risk in males. (A) WC, (B) BMI, (C) WHtR, (D) VAI, (E) ABSI, (F) BRI, (G) LAP, (H) CI, (I) CVAI, (J) TyG-index, (K) TyG-BMI, (L) TyG-WC, (M) TyG-WHtR.
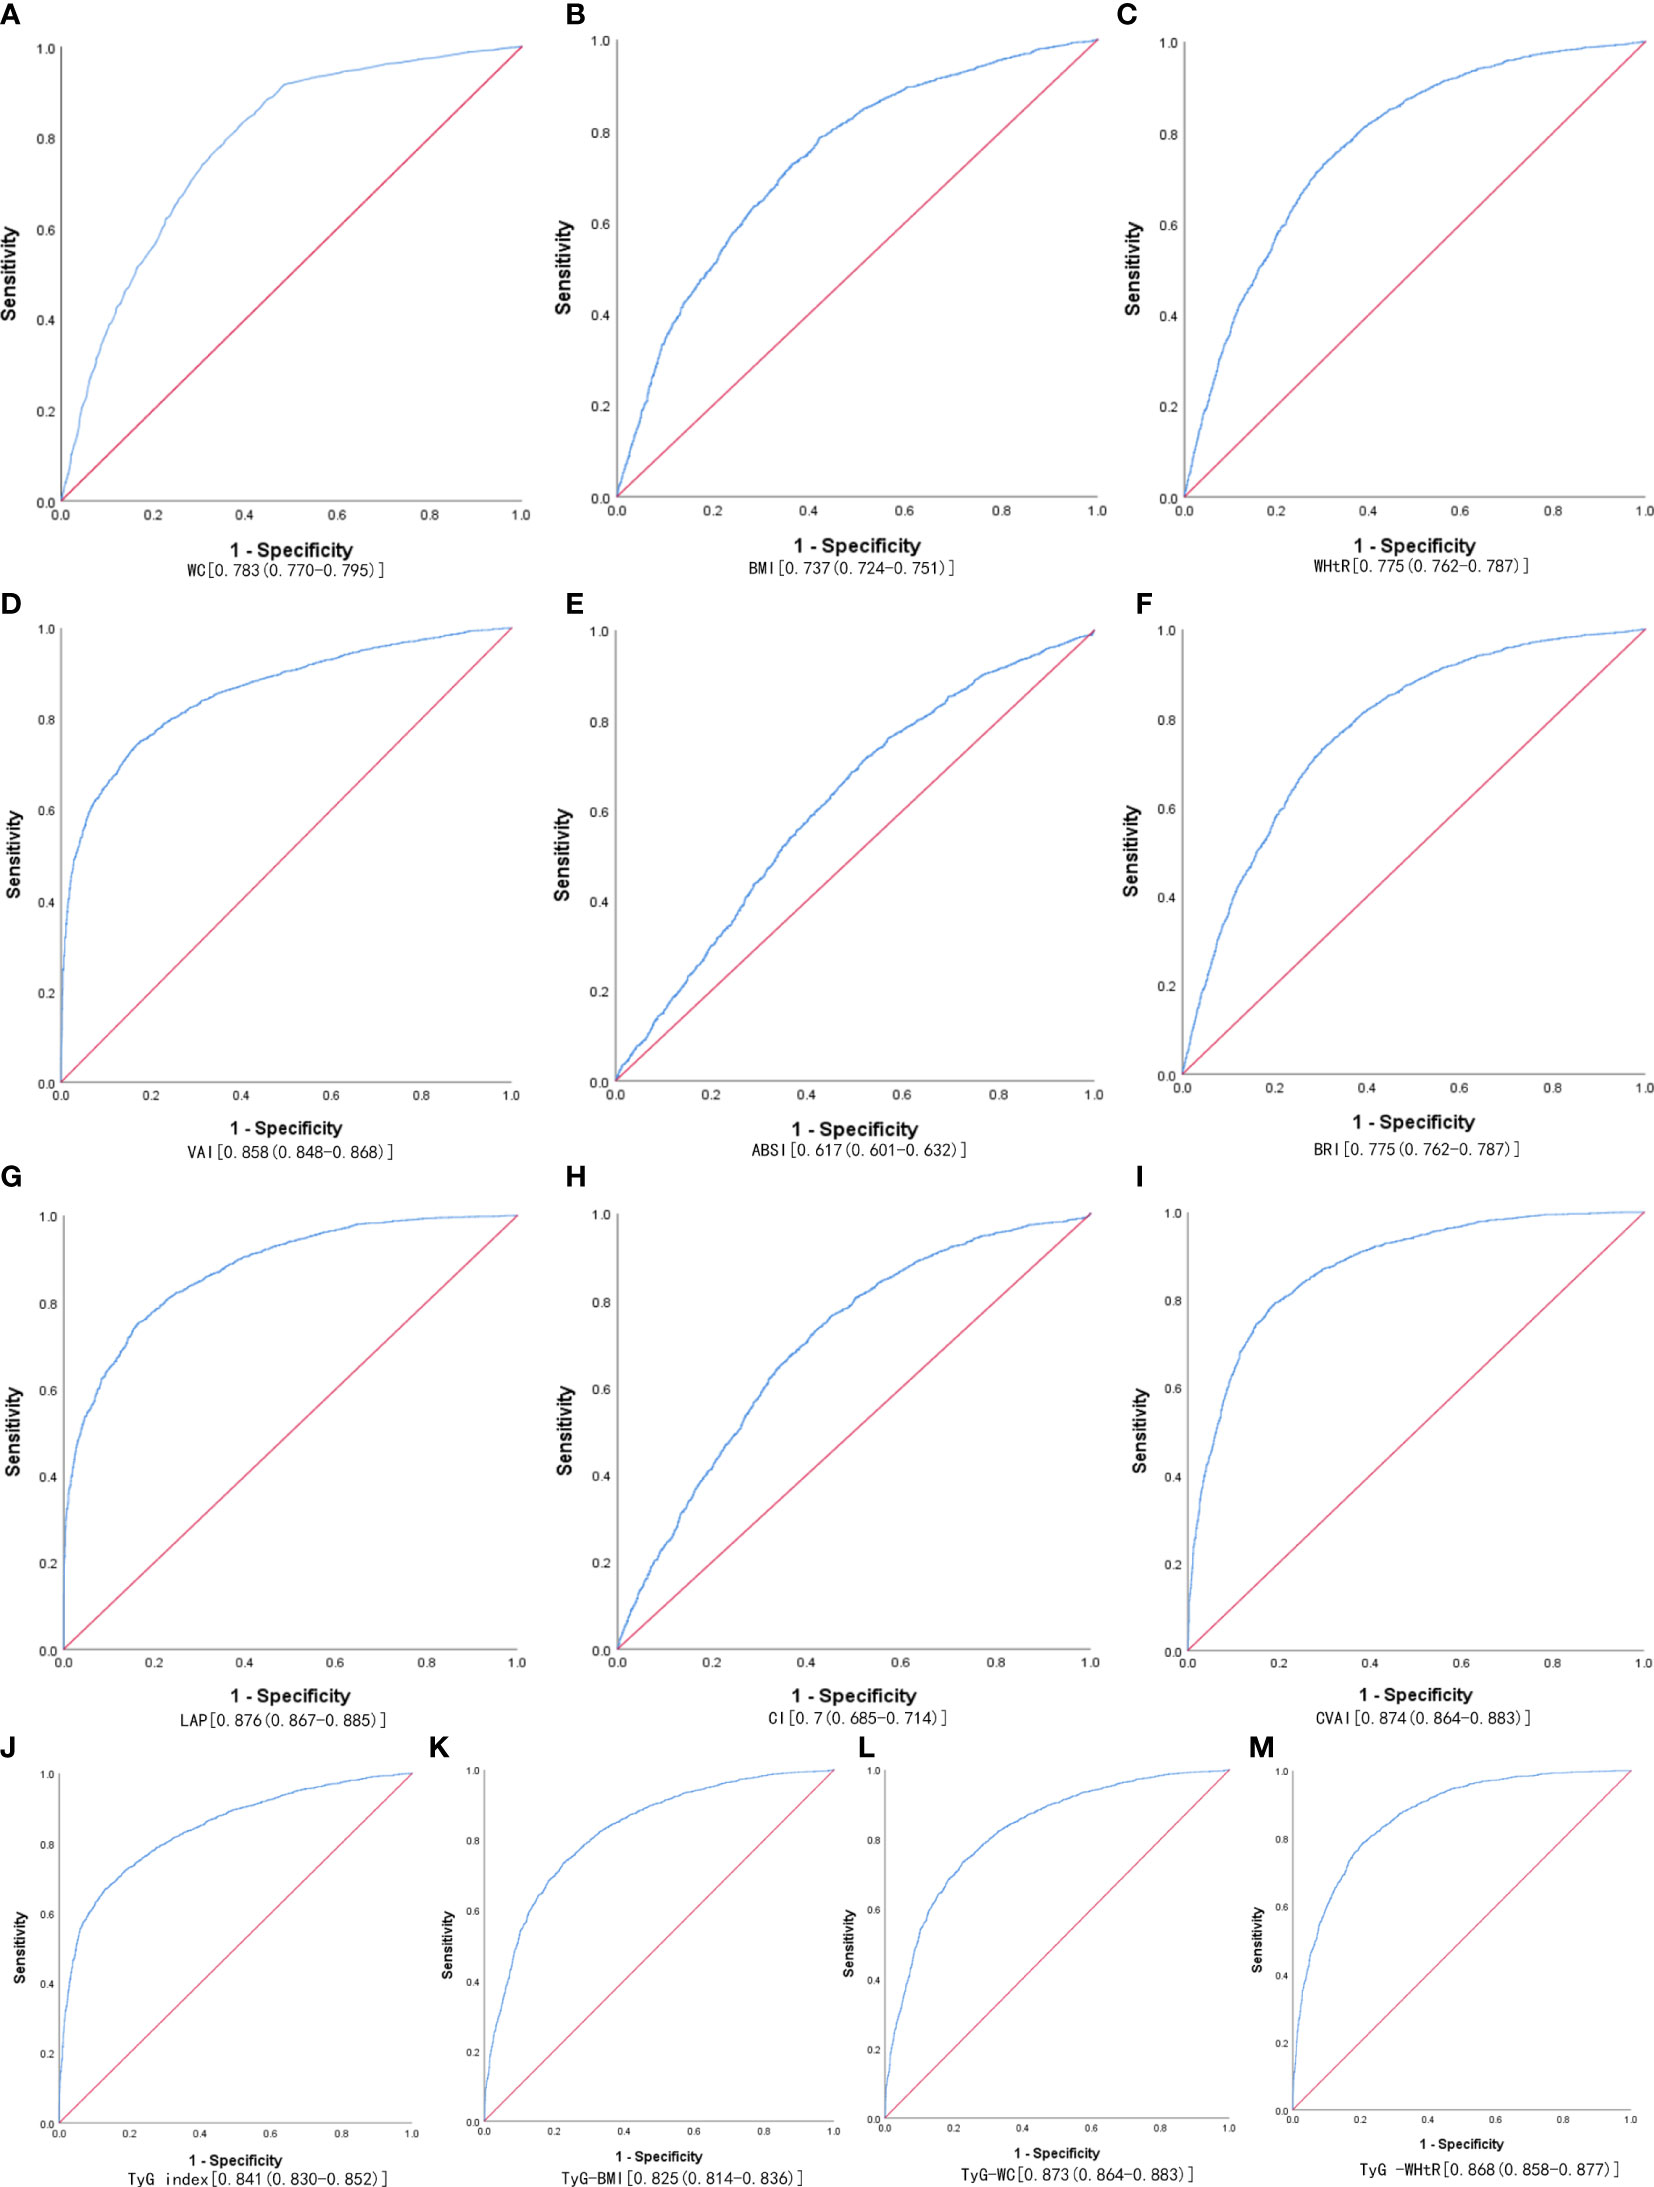
Figure 2 The ROC curves of each indicator in the prediction of MetS risk in females. (A) WC, (B) BMI, (C) WHtR, (D) VAI, (E) ABSI, (F) BRI, (G) LAP, (H) CI, (I) CVAI, (J) TyG-index, (K) TyG-BMI, (L) TyG-WC, (M) TyG-WHtR.
Table 4 shows the associations of obesity- and lipid-related indices with MetS and its components. According to the values in Table 3, 13 obesity- and lipid-related indices were transformed into two-category variables in this investigation. Table 4 is based on the transformed variables. A larger OR, in general, suggests a higher risk factor. Both before and after adjusting for age, education, marital status, current residence, current smoking, alcohol drinking, social activity, exercise, and chronic disease counts, the odds of MetS increased progressively with increasing obesity and units of lipid measurement for both men and women. Each unit rise in the Tyg index, for example, was related to a 14.525-fold increase in the likelihood of developing MetS in males(95% CI: 12.349,17.085). Each unit increase in BMI was linked to a 5.769-fold increase in the likelihood of developing MetS in women(95% CI: 5.052,6.588). In addition, 13 indicators had statistical significance after adjustment of confounding factors (P < 0.05). Figures 3, 4 show the forest diagram of or value before and after adjustment of confounding factors for males and females, respectively.
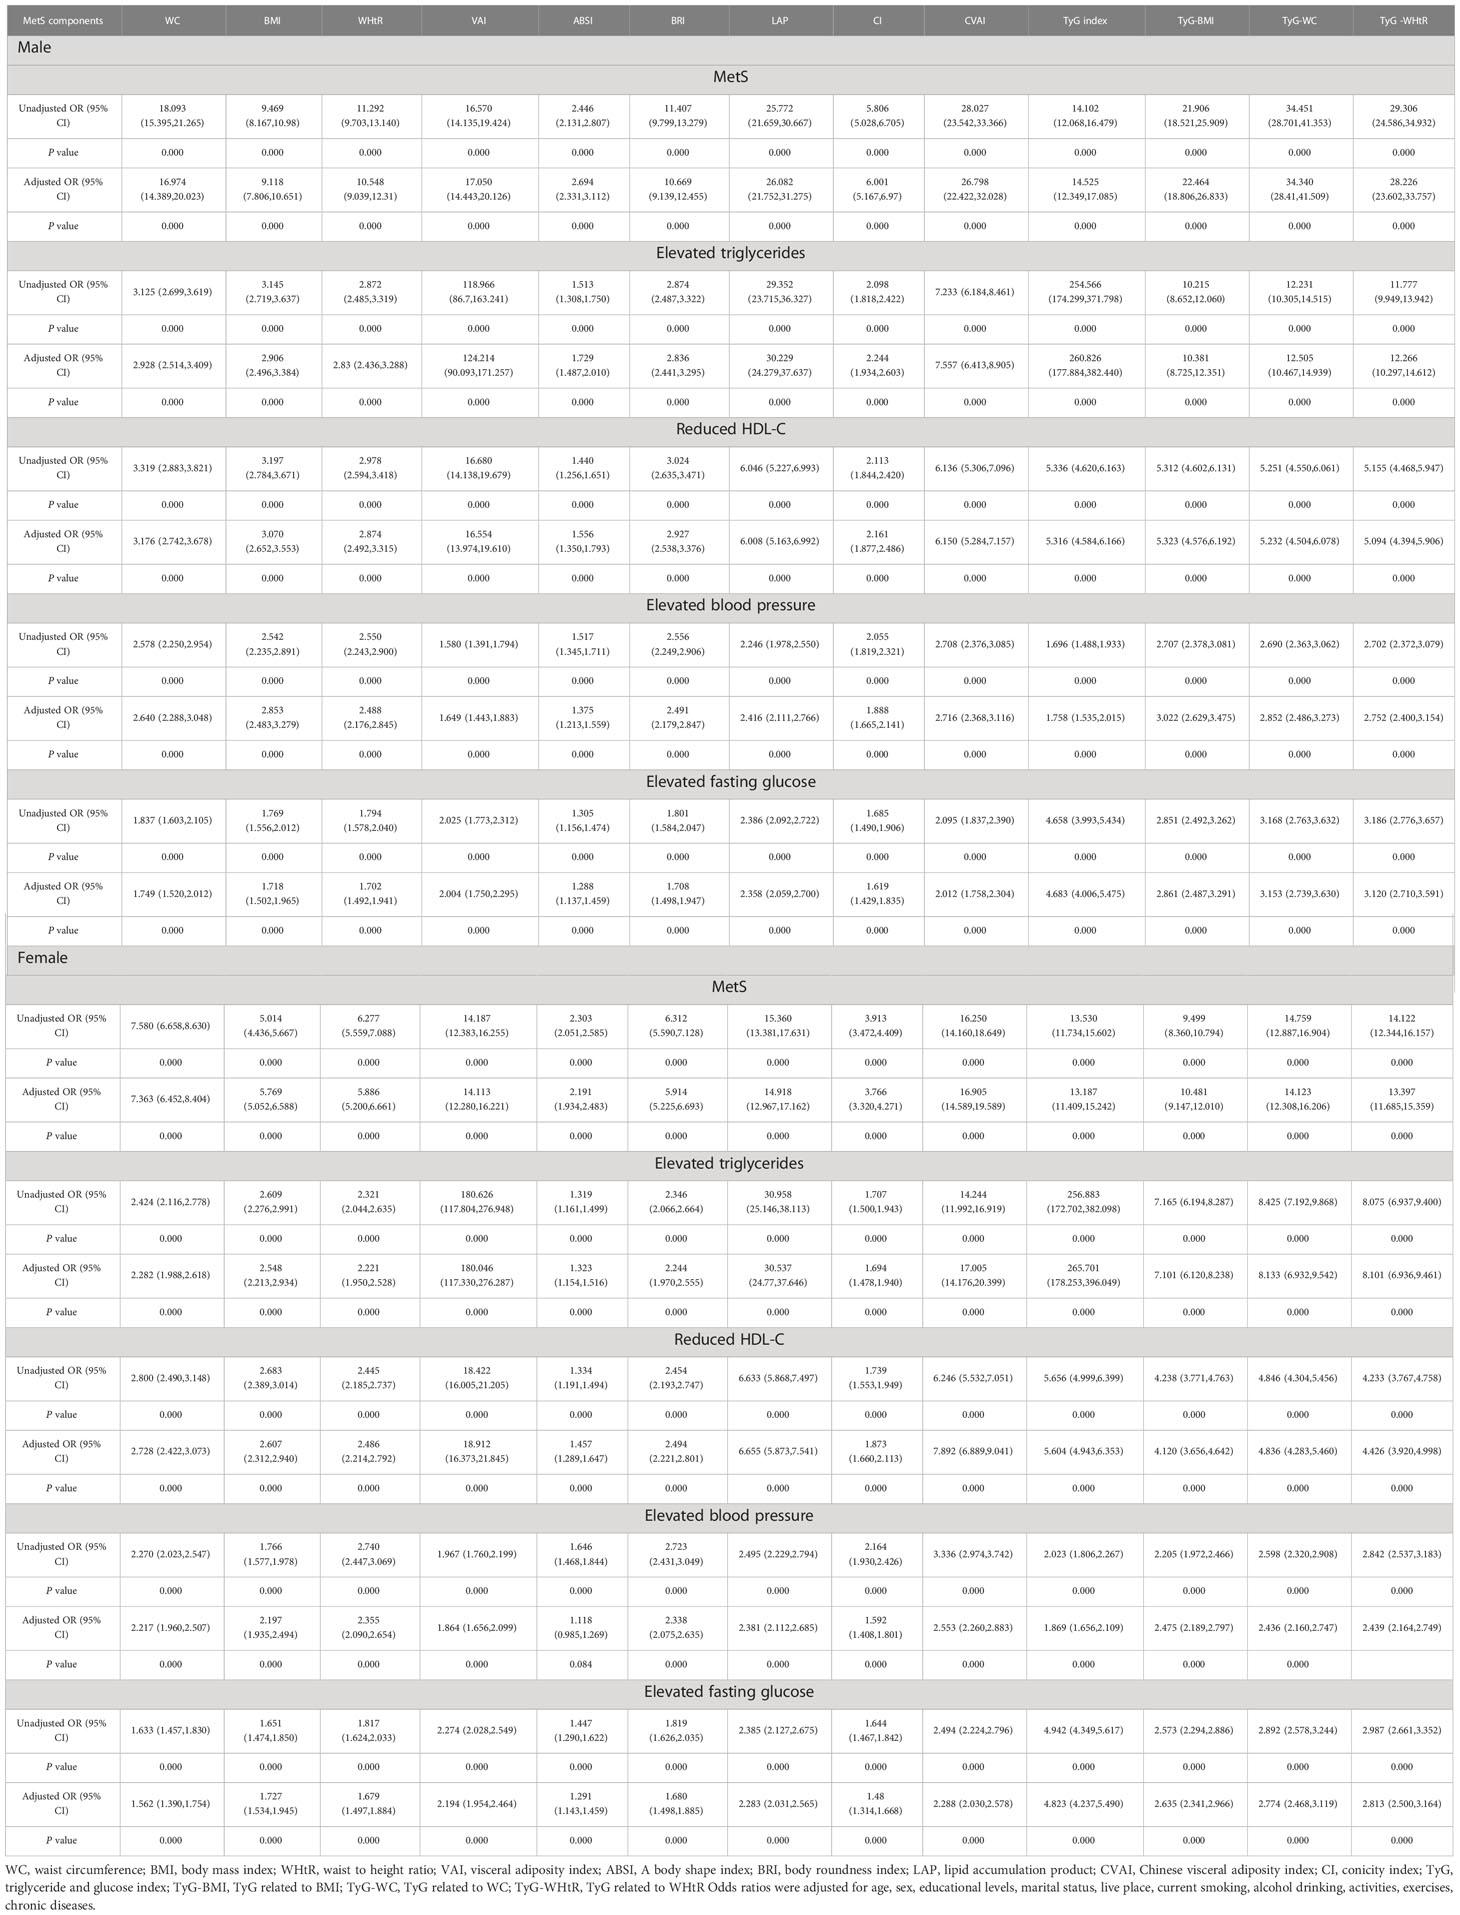
Table 4 Associations of obesity- and lipid-related indices with MetS and its components.
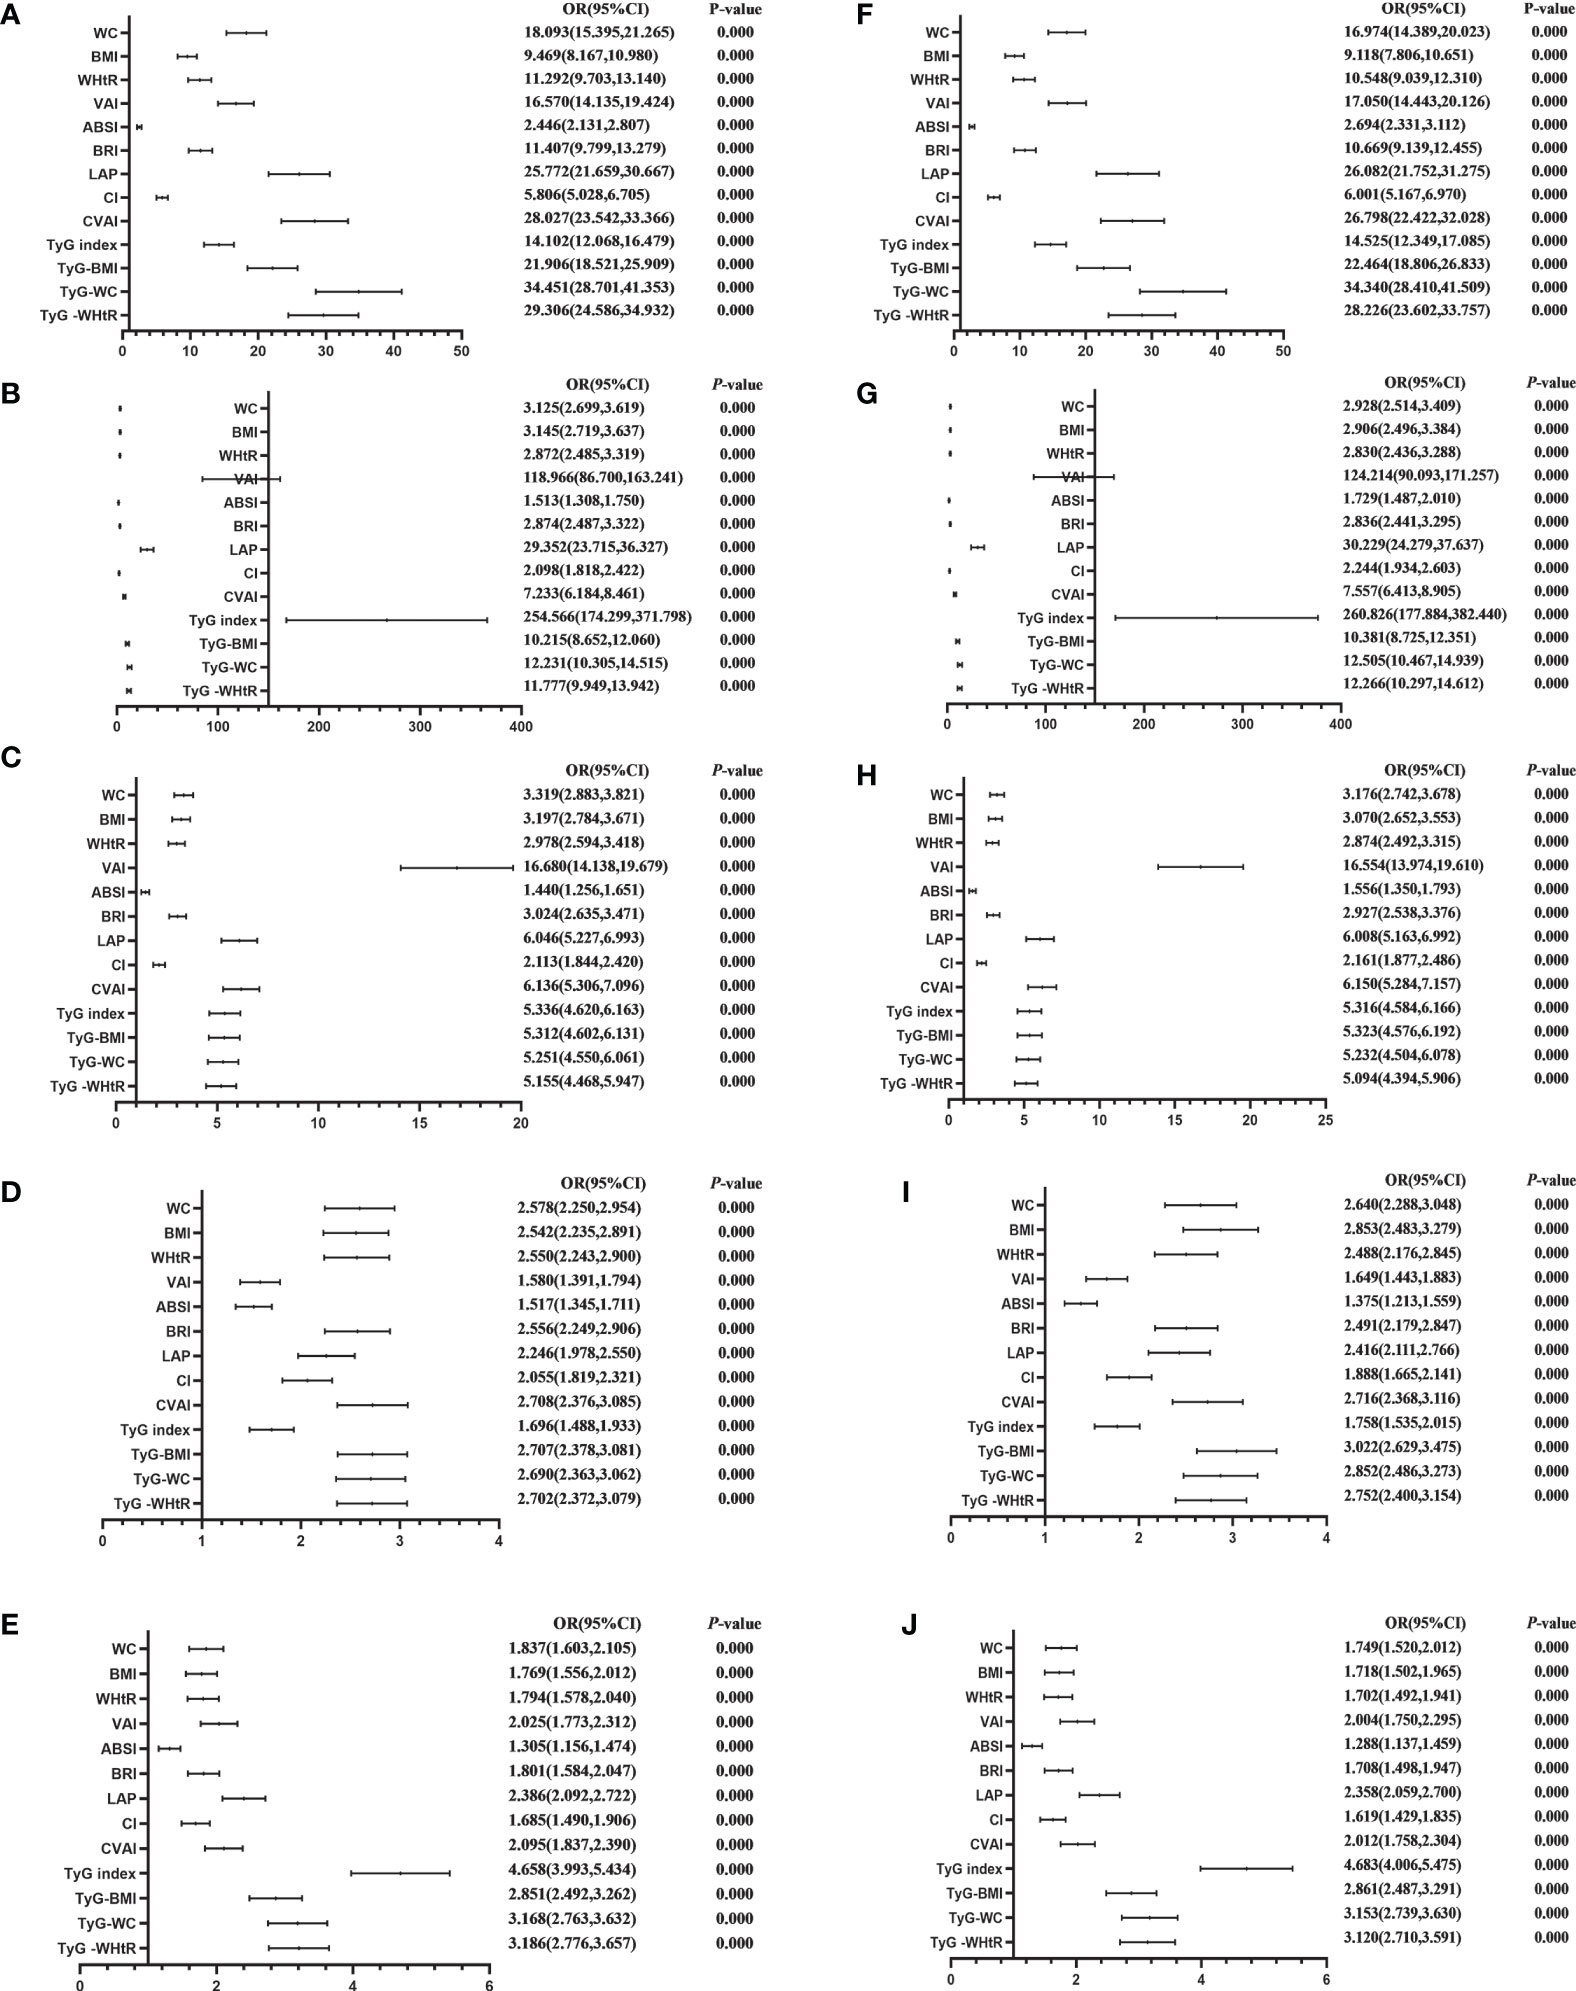
Figure 3 Forest diagram of OR before and after adjustment of confounding factors for male. (A) MetS unadjusted, (B) Elevated triglycerides unadjusted, (C) Reduced HDL-C unadjusted, (D) Elevated blood pressure unadjusted, (E) Elevated fasting glucose unadjusted, (F) MetS adjusted, (G) Elevated triglycerides adjusted, (H) Reduced HDL-C adjusted, (I) Elevated blood pressure adjusted, (J) Elevated fasting glucose adjusted. Adjusted OR: Adjusted for age, educational levels, marital status, live place, current smoking, alcohol drinking, activities, exercises, chronic diseases.
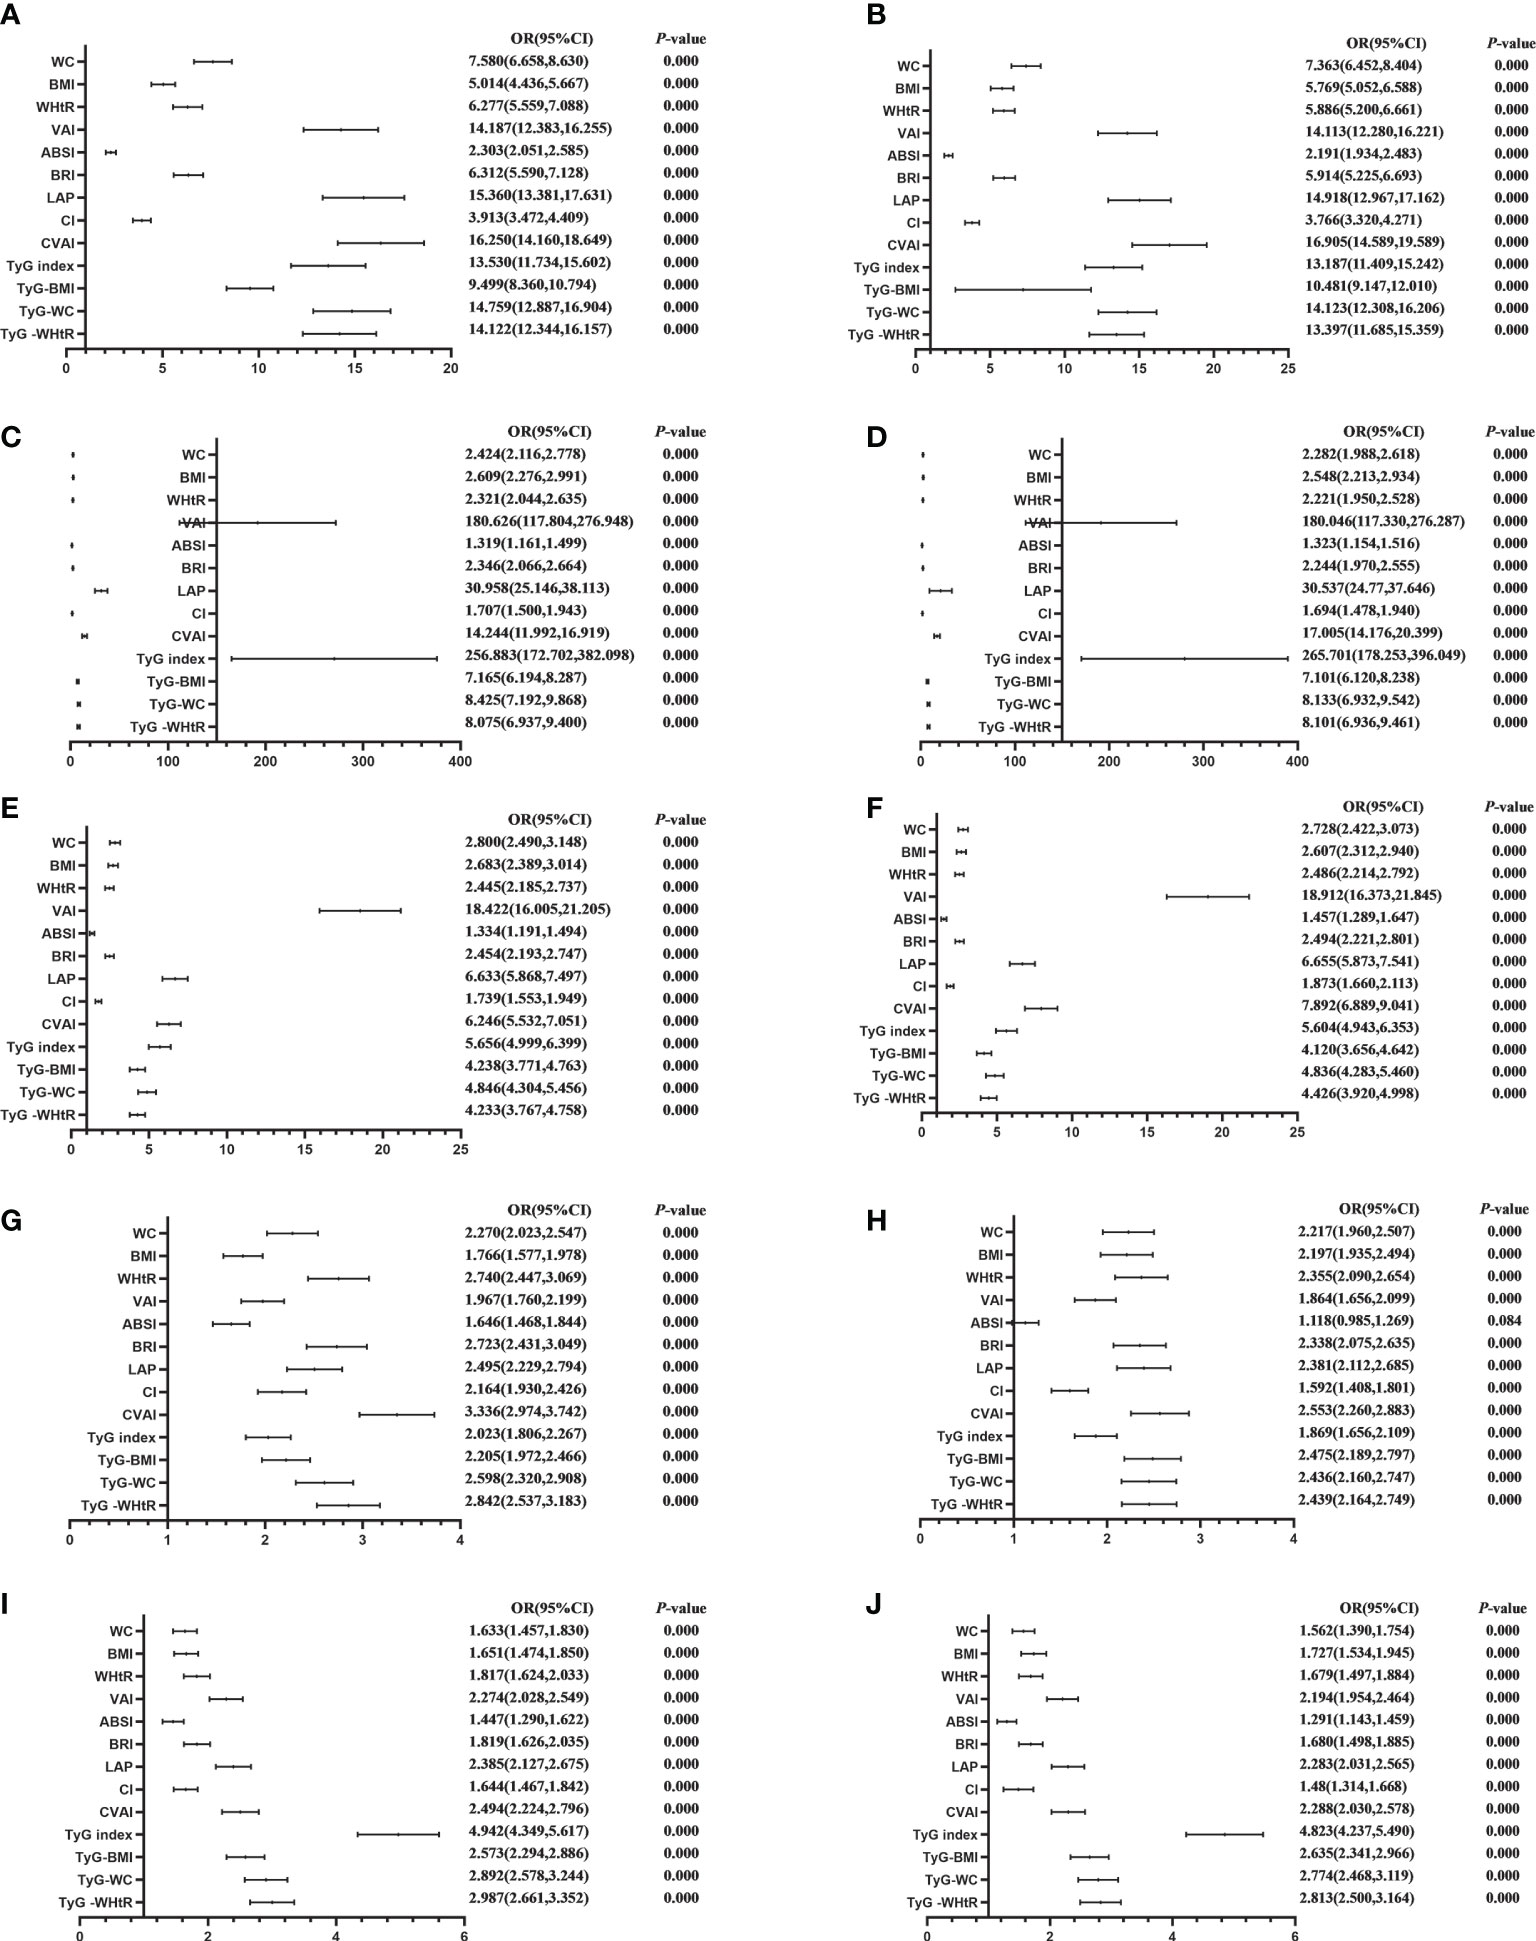
Figure 4 Forest diagram of OR before and after adjustment of confounding factors for female. (A) MetS unadjusted, (B) Elevated triglycerides unadjusted, (C) Reduced HDL-C unadjusted, (D) Elevated blood pressure unadjusted, (E) Elevated fasting glucose unadjusted, (F) MetS adjusted, (G) Elevated triglycerides adjusted, (H) Reduced HDL-C adjusted, (I) Elevated blood pressure adjusted, (J) Elevated fasting glucose adjusted. Adjusted OR: Adjusted for age, educational levels, marital status, live place, current smoking, alcohol drinking, activities, exercises, chronic diseases.
A total of 9457 middle-aged and elderly Chinese were included in this study, and the overall prevalence of the study population was 41.87% according to the diagnostic criteria of NCEP ATP III. Among them, there were 4340 males and 30.67% were diagnosed with MetS. There were 5117 females, and 51.38% were diagnosed with MetS. It is easy to see that the prevalence of MetS is high in our middle-aged and elderly population, both in men and women. Therefore, it is necessary to explore indicators that can predict the prevalence in order to prevent and delay the increase of prevalence.
In this cross-sectional study, 12 indicators were found to have much higher predictive value for MetS than ABSI. In a similar vein, it has been demonstrated (23, 24, 59–61) that although ABSI is linked to insulin resistance in older Chinese adults without diabetes and in general Chinese adults, it does not correlate well with various risks and MetS and is, therefore, a less desirable insulin resistance discriminator. This result is due to the high concentration of ABSI near the average value and relatively small variance, which makes ABSI perform poorly in predicting chronic diseases (62). The predictive power of Tyg-related parameters was more prominent in both sexes. In addition, LAP and CVAI are also good at predicting MetS.
Firstly, the excellent predictive power of Tyg-related parameters has to be mentioned first. In this study, the predictive ability of the TYG-related parameter (Tyg index, Tyg-WC, Tyg-BMI, and Tyg-WhtR) was excellent in both sexes(P < 0.05). A notion initially introduced by Ko et al. (63) is known as the Tyg index-related parameters, which integrate the TyG index with WC, BMI, and WHtR. They discovered that measures associated with the TyG index had the highest AUC values for predicting IR, compared to lipid measurements, lipid ratios, visceral obesity indicators, and adipokines. It was demonstrated in a cross-sectional research by Raimi et al. (64) that the TyG index was useful in diagnosing MetS and that the combination of the TyG index and anthropometric characteristics enhanced MetS identification and prediction; similarly, our findings demonstrated that WC, BMI, and WHtR alone were all less predictive of MetS than when combined with Tyg index predictive power of the pertinent parameters (Tyg-WC, Tyg-BMI, and Tyg-WhtR). And the findings of earlier researchers support our findings (63, 65–68), but these studies involved fewer participants.
Secondly, we found that although the prediction value of LAP is good, and the cut-off values obtained in our research were slightly different from that of other scholars. The cut-off values of LAP for predicting MetS in our study were 27.895 cm·mmol/L in men and 35.867 cm·mmol/L in women. But the results in other studies are different. For example, Haijiang Dai et al. (69) found that MetS prevalence increased with increasing LAP levels in both male and female groups. Maximum sensitivity and specificity for the diagnosis of MetS were found when LAP ≥ 30.5 cm·mmol/L in men and LAP ≥ 23.0 cm·mmol/L in women. In a study by Nascimento-Ferreira et al. (70), the greatest sensitivity and specificity were obtained with LAP cut-off values of 34.2 cm·mmol/L for the total sample. Stratification by age yielded LAP cut-off values of 64.1 cm.mmol/L and 38 cm.mmol/L in males and females under 50 years of age, respectively; for subjects over 50 years of age, the LAP cut-off values were 36.4 cm.mmol/L and 34.2 cm·mmol/L in males and females, respectively. The different LAP metrics in males and females’ performance may be due to the physiological differences in height, weight, and body composition between the sexes, with adipose tissue more likely to accumulate around the trunk and abdomen in men and usually around the hips and thighs in women (71). LAP is closely related to the development of MetS, and several studies at home and abroad have affirmed the value of LAP in predicting and diagnosing MetS (72–75), but the LAP had some differences in the cut-off values, and the reasons for this may be related to many factors such as race, differences in the mean age of the study subjects and the different definitions of MetS chosen.
Thirdly, Chinese Visceral Adiposity Index (CVAI) (51) was put forward because there are racial restrictions in the measurement of VAI, and it has been proved that CVAI is more suitable for China people’s physique (76). The ability of CVAI in predicting MetS is obviously superior to traditional indicators (BMI, WC, etc.) (77, 78). In our study, after adjusting for confounding factors such as sex, age and education, the probability of male patients with high CVAI is still high (adjusted OR=26.798). Therefore, CVAI can also be considered as an independent factor of the prevalence of MetS.
Limitations in this study should be aware of. Firstly, because our study was cross-sectional in nature, we were unable to determine a temporal relationship between adiposity measurements and MetS. Future research must evaluate the association between anthropometric measurements and MetS risk throughout time and develop clinical tools, such as cut-off values, to forecast MetS risk. Secondly, even though confounders were taken into account in the multivariate regression model, this link should be investigated prospectively since unmeasured or inaccurately measured covariates may lead to residual confounding. Thirdly, many participants were excluded because of the lack of data, and further research should collect more complete data. The study’s very large sample of 9457 middle-aged and older Chinese is another important strength. The analytical approach that managed the various confounders is another strength.
Among the middle-aged and elderly population in China, after adjusting for confounding factors, all the indicators except ABSI had good predictive power. The predictive power of Tyg-related parameters was more prominent in both sexes. In addition, LAP and CVAI are also good at predicting MetS.
The original contributions presented in the study are included in the article/supplementary materials. Further inquiries can be directed to the corresponding author.
Approval for this study was given by the medical ethics committee of Wannan medical college (approval number 2021–3). The patients/participants provided their written informed consent to participate in this study.
Conceived and designed the research: LZ. Wrote the paper: YQL. Analyzed the data: YQL and LZ. Revised the paper: YQL, JG, LZ, HL, L-LG, JLL, YXL, XL, LS, LY, TY, CW, DZ, HW, JL, ML, and YH. The authors read and approved the final manuscript.
This work was supported by the NSFC (70910107022, 71130002) and National Institute on Aging (R03-TW008358-01; R01-AG037031-03S1), World Bank (7159234), and the publication fee was supported by the Support Program for Outstanding Young Talents from the Universities and Colleges of Anhui Province for LZ(gxyqZD2021118).
The authors would like to thank the members of the CHARLS as well as all participants for their contribution.
The authors declare that the research was conducted in the absence of any commercial or financial relationships that could be construed as a potential conflict of interest.
All claims expressed in this article are solely those of the authors and do not necessarily represent those of their affiliated organizations, or those of the publisher, the editors and the reviewers. Any product that may be evaluated in this article, or claim that may be made by its manufacturer, is not guaranteed or endorsed by the publisher.
1. De Luis DA, Mongil RL, Sagrado MG, Trigo JAL, Mora PF, Sanz JC, et al. Prevalence of metabolic syndrome with International Diabetes Federation Criteria and ATP III Program in patients 65 years of age or older. J nutrition Health Aging (2010) 14(5):400–4. doi: 10.1007/s12603-010-0087-9
2. Ramachandran A, Snehalatha C, Satyavani K, Sivasankari S, Vijay V. Metabolic syndrome in urban Asian Indian adults–a population study using modified ATP III criteria. Diabetes Res Clin Pract (2003) 60(3):199–204. doi: 10.1016/s0168-8227(03)00060-3
3. Ranasinghe P, Mathangasinghe Y, Jayawardena R, Hills AP, Misra A. Prevalence and trends of metabolic syndrome among adults in the asia-pacific region: a systematic review. BMC Public Health (2017) 17(1):101. doi: 10.1186/s12889-017-4041-1
4. Ervin RB. Prevalence of metabolic syndrome among adults 20 years of age and over, by sex, age, race and ethnicity, and body mass index: United States,2003-2006. Natl Health Stat Rep (2009) 13:1–7.
5. Akbulut G, Koksal E, Bilici S, Acar Tek N, Yildiran H, Karadag MG, et al. Metabolic syndrome (MS) in elderly: a cross sectional survey. Arch Gerontol Geriatr (2011) 53(3):e263–6. doi: 10.1016/j.archger.2010.11.021
6. Sumner AD, Sardi GL, Reed JF 3rd. Components of the metabolic syndrome differ between young and old adults in the US population. J Clin hypertension (Greenwich Conn) (2012) 14(8):502–6. doi: 10.1111/j.1751-7176.2012.00647.x
7. Grundy SM. Metabolic syndrome pandemic. Arterioscler Thromb Vasc Biol (2008) 28(4):629–36. doi: 10.1161/ATVBAHA.107.151092
8. Ge H, Yang Z, Li X, Liu D, Li Y, Pan Y, et al. The prevalence and associated factors of metabolic syndrome in Chinese aging population. Sci Rep (2020) 10(1):20034. doi: 10.1038/s41598-020-77184-x
9. Kahn SE, Hull RL, Utzschneider K. Mechanisms linking obesity to insulin resistance and type 2 diabetes. Nature (2006) 444(7121):840–6. doi: 10.1038/nature05482
10. Alberti KG, Eckel RH, Grundy SM, Zimmet PZ, Cleeman JI, Donato KA, et al. Harmonizing the metabolic syndrome: a joint interim statement of the International Diabetes Federation Task Force on Epidemiology and Prevention; National Heart, Lung, and Blood Institute; American Heart Association; World Heart Federation; International Atherosclerosis Society; and International Association for the Study of Obesity. Circulation (2009) 120(16):1640–5. doi: 10.1161/CIRCULATIONAHA.109.192644
11. Gluvic Z, Zaric B, Resanovic I, Obradovic M, Mitrovic A. Link between metabolic syndrome and insulin resistance. Curr Vasc Pharmacol (2017) 15(1):30–9. doi: 10.2174/1570161114666161007164510
12. Alberti KG, Zimmet P, Shaw J; IDF Epidemiology Task Force Consensus Group. The metabolic syndrome—a new worldwide definition. Lancet (2005) 366(9491):1059–62. doi: 10.1016/S0140-6736(05)67402-8
13. Olijhoek JK, van der Graaf Y, Banga JD, Algra A, Rabelink TJ, Visseren FL, et al. The metabolic syndrome is associated with advanced vascular damage in patients with coronary heart disease, stroke, peripheral arterial disease or abdominal aortic aneurysm. Eur Heart J (2004) 25(4):342–8. doi: 10.1016/j.ehj.2003.12.007
14. Alberti KG, Zimmet PZ. Definition, diagnosis and classification of diabetes mellitus and its complications. Diabetic Med J Br Diabetic Assoc (1998) 15(7):539–53. doi: 10.1002/(SICI)1096-9136(199807)15:7<539::AID-DIA668>3.0.CO;2-S
15. Alberti KG, Zimmet PZ. Metabolic syndrome–a new world-wide definition. A Consensus Statement from the International Diabetes Federation. Diabetic Med J Br Diabetic Assoc (2006) 23(5):469–80. doi: 10.1111/j.1464-5491.2006.01858.x
16. Borga M, West J, Bell JD, Harvey NC, Romu T, Heymsfield SB, et al. Advanced body composition assessment: from body mass index to body composition profiling. J Investig Med (2018) 66(5):1–9. doi: 10.1136/jim-2018-000722
17. Ceolin J, Engroff P, Mattiello R, Schwanke CHA. Performance of anthropometric indicators in the prediction of metabolic syndrome in the elderly. Metab syndrome related Disord (2019) 17(4):232–9. doi: 10.1089/met.2018.0113
18. Dominguez-Reyes T, Quiroz-Vargas I, Salgado-Bernabe AB, Salgado-Goytia L, Munoz-Valle JF, Parra-Rojas I. Anthropometric measurements as predictive indicators of metabolic risk in a Mexican population. Nutr Hosp (2017) 34(1):96–101. doi: 10.20960/nh.983. Las medidas antropometricas como indicadores predictivos de riesgo metabolico en una poblacion mexicana.
19. Ortega FB, Sui X, Lavie CJ, Blair SN. Body mass index, the most widely used but also widely criticized index: would a criterion standard measure of total body fat be a better predictor of cardiovascular disease mortality? Mayo Clin Proc (2016) 91(4):443–55. doi: 10.1016/j.mayocp.2016.01.008
20. Ramírez-Vélez R, Pérez-Sousa MÁ, González-Ruíz K, et al. Obesity- and lipid-related parameters in the identification of older adults with a high risk of prediabetes according to the American Diabetes Association: An analysis of the 2015 health, well-being, and aging study. Nutrients (2019) 11(11):2654. doi: 10.3390/nu11112654
21. Liu J, Tse LA, Liu Z, Rangarajan S, Hu B, Yin L, et al. Predictive values of anthropometric measurements for cardiometabolic risk factors and cardiovascular diseases among 44 048 chinese. Ann Hum Biol (2019) 8(16):e010870. doi: 10.1161/jaha.118.010870
22. Khosravian S, Bayani MA, Hosseini SR, Bijani A, Mouodi S, Ghadimi R. Comparison of anthropometric indices for predicting the risk of metabolic syndrome in older adults. Rom J Intern Med (2021) 59(1):43–9. doi: 10.2478/rjim-2020-0026
23. Haghighatdoost F, Sarrafzadegan N, Mohammadifard N, Asgary S, Boshtam M, Azadbakht L. Assessing body shape index as a risk predictor for cardiovascular diseases and metabolic syndrome among Iranian adults. Nutr (Burbank Los Angeles County Calif) (2014) 30(6):636–44. doi: 10.1016/j.nut.2013.10.021
24. Stefanescu A, Revilla L, Lopez T, Sanchez SE, Williams MA, Gelaye B. Using A Body Shape Index (ABSI) and Body Roundness Index (BRI) to predict risk of metabolic syndrome in Peruvian adults. J Int Med Res (2020) 48(1):300060519848854. doi: 10.1177/0300060519848854
25. Paula HA, Ribeiro Rde C, Rosado LE, Abranches MV, Franceschini Sdo C. Classic anthropometric and body composition indicators can predict risk of metabolic syndrome in elderly. Ann Nutr Metab (2012) 60(4):264–71. doi: 10.1159/000337943
26. Lear SA, Gasevic D. Ethnicity and metabolic syndrome: implications for assessment, management and prevention. Nutrients (2019) 12(1):15. doi: 10.3390/nu12010015
27. Carroll JF, Chiapa AL, Rodriquez M, Phelps DR, Cardarelli KM, Vishwanatha JK, et al. Visceral fat, waist circumference, and BMI: impact of race/ethnicity. Obesity (2008) 16(3):600–7. doi: 10.1038/oby.2007.92
28. Lovejoy JC, de la Bretonne JA, Klemperer M, Tulley R. Abdominal fat distribution and metabolic risk factors: Effects of race. Metabolism (1996) 45(9):1119–24. doi: 10.1016/S0026-0495(96)90011-6
29. Li C, Liu T, Sun W, Wu L, Zou ZY. Prevalence and risk factors of arthritis in a middle-aged and older Chinese population: the China health and retirement longitudinal study. Rheumatol (Oxford) (2015) 54(4):697–706. doi: 10.1093/rheumatology/keu391
30. Zhang L, Li JL, Guo LL, Xu G, Yang L, Wang C, et al. Weight changes and the incidence of depressive symptom in the middle-aged and older adults: findings from the Chinese nationwide cohort study. BMC Public Health (2022) 22(1):2282. doi: 10.1186/s12889-022-14624-5
31. Zhang L, Li JL, Guo LL, Li H, Li D, Xu G. The interaction between serum uric acid and triglycerides level on blood pressure in middle-aged and elderly individuals in China: result from a large national cohort study. BMC Cardiovasc Disord (2020) 20(1):174. doi: 10.1186/s12872-020-01468-3
32. Zhang L, Li JL, Zhang LL, Guo LL, Li H, Li D. No association between C-reactive protein and depressive symptoms among the middle-aged and elderly in China: Evidence from the China Health and Retirement Longitudinal Study. Medicine (2018) 97(38):e12352. doi: 10.1097/MD.0000000000012352
33. Zhang L, Li JL, Zhang LL, Guo LL, Li H, Li D. Body mass index and serum uric acid level: Individual and combined effects on blood pressure in middle-aged and older individuals in China. Medicine (2020) 99(9):e19418. doi: 10.1097/MD.0000000000019418
34. Zhang L, Li JL, Zhang LL, Guo LL, Li H, Yan W, et al. Relationship between adiposity parameters and cognition: the "fat and jolly" hypothesis in middle-aged and elderly people in China. Medicine (2019) 98(10):e14747. doi: 10.1097/MD.0000000000014747
35. Zhang L, Liu K, Li H, Li D, Chen Z, Zhang LL, et al. Relationship between body mass index and depressive symptoms: the "fat and jolly" hypothesis for the middle-aged and elderly in China. BMC Public Health (2016) 16(1):1201. doi: 10.1186/s12889-016-3864-5
36. Zhang L, Yang L, Wang C, Yuan T, Zhang D, Wei H, et al. Individual and combined association analysis of famine exposure and serum uric acid with hypertension in the mid-aged and older adult: a population-based cross-sectional study. BMC Cardiovasc Disord (2021) 21(1):420. doi: 10.1186/s12872-021-02230-z
37. Unwin N, Bhopal R, Hayes L, White M, Alberti G. A comparison of the new international diabetes federation definition of metabolic syndrome to WHO and NCEP definitions in Chinese, European and South Asian origin adults. Ethn Dis (2007) 17(3):522. doi: 10.1016/j.envres.2007.11.003
38. Ko GT, Cockram CS, Chow CC, Yeung VT, Chan WB, So WY, et al. Metabolic syndrome by the international diabetes federation definition in Hong Kong Chinese. Diabetes Res Clin Pract (2006) 73(1):58–64. doi: 10.1016/j.diabres.2005.11.009
39. Kerner W, Bruckel J, German Diabetes A. Definition, classification and diagnosis of diabetes mellitus. Exp Clin Endocrinol Diabetes (2014) 122(7):384–6. doi: 10.1055/s-0034-1366278
40. Barbalho SM, Tofano RJ, de Oliveira MB, Quesada KR, Barion MR, Akuri MC, et al. HDL-C and non-HDL-C levels are associated with anthropometric and biochemical parameters. J Vasc Bras (2019) 18:e20180109. doi: 10.1590/1677-5449.180109
41. Lee JJ, Ahn J, Hwang J, Han SW, Lee KN, Kim JB, et al. Relationship between uric acid and blood pressure in different age groups. Clin Hypertens (2015) 21:14. doi: 10.1186/s40885-015-0022-9
42. ZHOUBEI-FAN. Effect of body mass index on all—cause mortality and incidence of cardiovascular diseases—Report for meta—Analysis of prospective studies on optimal cut—off points of body mass index in chinese adults. Biomed Environ Sci (2002) 15(3):8.
43. Yao F, Bo Y, Zhao L, Li Y, Ju L, Fang H, et al. Prevalence and influencing factors of metabolic syndrome among adults in china from 2015 to 2017. Nutrients (2021) 13(12):4475. doi: 10.3390/nu13124475
44. Thomas GN, Ho SY, Janus ED, Lam KS, Hedley AJ, Lam TH, et al. The US National Cholesterol Education Programme Adult Treatment Panel III (NCEP ATP III) prevalence of the metabolic syndrome in a Chinese population. Diabetes Res Clin Pract (2005) 67(3):251–7. doi: 10.1016/j.diabres.2004.07.022
45. Zhang L, Yang L, Wang C, Yuan T, Zhang D, Wei H, et al. Combined effect of famine exposure and obesity parameters on hypertension in the midaged and older adult: A population-based cross-sectional study. BioMed Res Int (2021) 2021:5594718. doi: 10.1155/2021/5594718
46. Zhang FL, Ren JX, Zhang P, Jin H, Qu Y, Yu Y, et al. Strong association of waist circumference (WC), body mass index (BMI), waist-to-height ratio (WHtR), and waist-to-hip ratio (WHR) with diabetes: A population-based cross-sectional study in jilin province, China. J Diabetes Res (2021) 2021:8812431. doi: 10.1155/2021/8812431
47. Amato MC, Giordano C, Galia M, Criscimanna A, Vitabile S, Midiri M, et al. Visceral Adiposity Index: a reliable indicator of visceral fat function associated with cardiometabolic risk. Diabetes Care (2010) 33(4):920–2. doi: 10.2337/dc09-1825
48. Krakauer NY, Krakauer JC. A new body shape index predicts mortality hazard independently of body mass index. PloS One (2012) 7(7):e39504. doi: 10.1371/journal.pone.0039504
49. Thomas DM, Bredlau C, Bosy-Westphal A, Mueller M, Shen W, Gallagher D, et al. Relationships between body roundness with body fat and visceral adipose tissue emerging from a new geometrical model. Obesity (2013) 21(11):2264–71. doi: 10.1002/oby.20408
50. Kahn HS. The "lipid accumulation product" performs better than the body mass index for recognizing cardiovascular risk: a population-based comparison. BMC Cardiovasc Disord (2005) 5:26. doi: 10.1186/1471-2261-5-26
51. Xia MF, Chen Y, Lin HD, Ma H, Li XM, Aleteng Q, et al. A indicator of visceral adipose dysfunction to evaluate metabolic health in adult Chinese. Sci Rep (2016) 6:38214. doi: 10.1038/srep38214
52. Rato Q. Conicity index: An anthropometric measure to be evaluated. Rev Port Cardiol (2017) 36(5):365–6. doi: 10.1016/j.repc.2017.02.003
53. Unger G, Benozzi SF, Perruzza F, Pennacchiotti GL. Triglycerides and glucose index: a useful indicator of insulin resistance. Endocrinol Nutr (2014) 61(10):533–40. doi: 10.1016/j.endonu.2014.06.009
54. Selvi NMK, Nandhini S, Sakthivadivel V, Lokesh S, Srinivasan AR, Sumathi S. Association of triglyceride-glucose index (TyG index) with hbA1c and insulin resistance in type 2 diabetes mellitus. Maedica (Bucur) (2021) 16(3):375–81. doi: 10.26574/maedica.2021.16.3.375
55. Jiang C, Yang R, Kuang M, Yu M, Zhong M, Zou Y. Triglyceride glucose-body mass index in identifying high-risk groups of pre-diabetes. Lipids Health Dis (2021) 20(1):161. doi: 10.1186/s12944-021-01594-7
56. Hanley JA, McNeil BJ. The meaning and use of the area under a receiver operating characteristic (ROC) curve. Radiology (1982) 143(1):29–36. doi: 10.1148/radiology.143.1.7063747
57. Fischer JE, Bachmann LM, Jaeschke R. A readers' guide to the interpretation of diagnostic test properties: clinical example of sepsis. Intensive Care Med (2003) 29(7):1043–51. doi: 10.1007/s00134-003-1761-8
58. Fluss R, Faraggi D, Reiser B. Estimation of the Youden Index and its associated cutoff point. Biom J (2005) 47(4):458–72. doi: 10.1002/bimj.200410135
59. Alves LF, Cruz JO, da Costa Souza AL. Performance of adiposity indicators in predicting metabolic syndrome in older adults. Arch Endocrinol Metab (2021) 65(5):588–95. doi: 10.20945/2359-3997000000372
60. Wu K, He S, Zheng Y, Chen X. ABSI is a poor predictor of insulin resistance in Chinese adults and elderly without diabetes. Arch Endocrinol Metab (2018) 62(5):523–9. doi: 10.20945/2359-3997000000072
61. Calderón-García JF, Roncero-Martín R, Rico-Martín S. Effectiveness of body roundness index (BRI) and a body shape index (ABSI) in predicting hypertension: A systematic review and meta-analysis of observational studies. Int J Environ Res Public Health (2021) 18(21):11607. doi: 10.3390/ijerph182111607.
62. Ji M, Zhang S, An R. Effectiveness of A Body Shape Index (ABSI) in predicting chronic diseases and mortality: a systematic review and meta-analysis. Obes Rev (2018) 19(5):737–59. doi: 10.1111/obr.12666
63. Er LK, Wu S, Chou HH, Hsu LA, Teng MS, Sun YC, et al. Triglyceride glucose-body mass index is a simple and clinically useful surrogate marker for insulin resistance in nondiabetic individuals. PloS One (2016) 11(3):e0149731. doi: 10.1371/journal.pone.0149731
64. Raimi TH, Dele-Ojo BF, Dada SA, Fadare JO, Ajayi DD, Ajayi EA, et al. Triglyceride-glucose index and related parameters predicted metabolic syndrome in Nigerians. Metab syndrome related Disord (2021) 19(2):76–82. doi: 10.1089/met.2020.0092
65. Zheng S, Shi S, Ren X, Han T, Li Y, Chen Y, et al. Triglyceride glucose-waist circumference, a novel and effective predictor of diabetes in first-degree relatives of type 2 diabetes patients: cross-sectional and prospective cohort study. J Transl Med (2016) 14:260. doi: 10.1186/s12967-016-1020-8
66. Zhang X, Zhang T, He S, Jia S, Zhang Z, Ye R, et al. Association of metabolic syndrome with TyG index and TyG-related parameters in an urban Chinese population: a 15-year prospective study. Diabetol Metab syndrome (2022) 14(1):84. doi: 10.1186/s13098-022-00855-4
67. Cho YK, Lee J, Kim HS, Kim EH, Lee MJ, Yang DH, et al. Triglyceride glucose-waist circumference better predicts coronary calcium progression compared with other indices of insulin resistance: A longitudinal observational study. J Clin Med (2020) 10(1):92. doi: 10.3390/jcm10010092.
68. Lim J, Kim J, Koo SH, Kwon GC. Comparison of triglyceride glucose index, and related parameters to predict insulin resistance in Korean adults: An analysis of the 2007-2010 Korean National Health and Nutrition Examination Survey. PloS One (2019) 14(3):e0212963. doi: 10.1371/journal.pone.0212963
69. Dai H, Wang W, Chen R, Chen Z, Lu Y, Yuan H. Lipid accumulation product is a powerful tool to predict non-alcoholic fatty liver disease in Chinese adults. Nutr Metab (Lond) (2017) 14:49. doi: 10.1186/s12986-017-0206-2
70. Nascimento-Ferreira MV, Rendo-Urteaga T, Vilanova-Campelo RC, Carvalho HB, da Paz Oliveira G, Paes Landim MB, et al. The lipid accumulation product is a powerful tool to predict metabolic syndrome in undiagnosed Brazilian adults. Clin Nutr (Edinburgh Scotland) (2017) 36(6):1693–700. doi: 10.1016/j.clnu.2016.12.020
71. Bredella MA. Sex differences in body composition. Adv Exp Med Biol (2017) 1043:9–27. doi: 10.1007/978-3-319-70178-3_2
72. Ahn N, Baumeister SE, Amann U, Rathmann W, Peters A, Huth C, et al. Visceral adiposity index (VAI), lipid accumulation product (LAP), and product of triglycerides and glucose (TyG) to discriminate prediabetes and diabetes. Sci Rep (2019) 9(1):9693. doi: 10.1038/s41598-019-46187-8
73. Bermudez V, Salazar J, Fuenmayor J, Nava M, Ortega A, Duran P, et al. Lipid accumulation product is more related to insulin resistance than the visceral adiposity index in the maracaibo city population, Venezuela. J Obes (2021) 2021:5514901. doi: 10.1155/2021/5514901
74. Tian T, Pei H, Chen Z, Hailili G, Wang S, Sun Y, et al. Comparison of lipid accumulation product and body mass index as indicators of diabetes diagnosis among 215,651 Chinese adults. PeerJ (2020) 8:e8483. doi: 10.7717/peerj.8483
75. Ching YK, Chin YS, Appukutty M, Gan WY, Chan YM. Comparisons of conventional and novel anthropometric obesity indices to predict metabolic syndrome among vegetarians in Malaysia. Sci Rep (2020) 10(1):20861. doi: 10.4103/0970-258x.303619
76. Amato MC, Giordano C, Pitrone M, Galluzzo A. Cut-off points of the visceral adiposity index (VAI) identifying a visceral adipose dysfunction associated with cardiometabolic risk in a Caucasian Sicilian population. Lipids Health Dis (2011) 10:183. doi: 10.1186/1476-511X-10-183
77. Wei J, Liu X, Xue H, Wang Y, Shi Z. Comparisons of visceral adiposity index, body shape index, body mass index and waist circumference and their associations with diabetes mellitus in adults. Nutrients (2019) 11(7):1580. doi: 10.3390/nu11071580.
78. Han M, Qin P, Li Q, Qie R, Liu L, Zhao Y, et al. Chinese visceral adiposity index: A reliable indicator of visceral fat function associated with risk of type 2 diabetes. Diabetes Metab Res Rev (2021) 37(2):e3370. doi: 10.1002/dmrr.3370
Keywords: metabolic syndrome, cross-sectional study, middle-aged and elderly, receiver operating characteristic curve, ROC (receiver operating characteristic curve)
Citation: Li Y, Gui J, Liu H, Guo L-l, Li J, Lei Y, Li X, Sun L, Yang L, Yuan T, Wang C, Zhang D, Wei H, Li J, Liu M, Hua Y and Zhang L (2023) Predicting metabolic syndrome by obesity- and lipid-related indices in mid-aged and elderly Chinese: a population-based cross-sectional study. Front. Endocrinol. 14:1201132. doi: 10.3389/fendo.2023.1201132
Received: 06 April 2023; Accepted: 12 July 2023;
Published: 28 July 2023.
Edited by:
Masashi Tanaka, Health Science University, JapanReviewed by:
Carmen Pheiffer, South African Medical Research Council, South AfricaCopyright © 2023 Li, Gui, Liu, Guo, Li, Lei, Li, Sun, Yang, Yuan, Wang, Zhang, Wei, Li, Liu, Hua and Zhang. This is an open-access article distributed under the terms of the Creative Commons Attribution License (CC BY). The use, distribution or reproduction in other forums is permitted, provided the original author(s) and the copyright owner(s) are credited and that the original publication in this journal is cited, in accordance with accepted academic practice. No use, distribution or reproduction is permitted which does not comply with these terms.
*Correspondence: Lin Zhang, eWFvcmFuMjAwOEAxNjMuY29t
Disclaimer: All claims expressed in this article are solely those of the authors and do not necessarily represent those of their affiliated organizations, or those of the publisher, the editors and the reviewers. Any product that may be evaluated in this article or claim that may be made by its manufacturer is not guaranteed or endorsed by the publisher.
Research integrity at Frontiers
Learn more about the work of our research integrity team to safeguard the quality of each article we publish.