
94% of researchers rate our articles as excellent or good
Learn more about the work of our research integrity team to safeguard the quality of each article we publish.
Find out more
ORIGINAL RESEARCH article
Front. Endocrinol. , 07 November 2023
Sec. Bone Research
Volume 14 - 2023 | https://doi.org/10.3389/fendo.2023.1200892
 Jinsheng Yu1‡
 Chen Zhuang2‡Wenxuan Guo3‡Xing Zhou1§Yixuan Chen1§Likang Wang1§Wenkai Li1§Yiwen Zhu1§
 Rujie Zhuang3*†Kun Tian3*
Objective: To explore the causal association between breakfast skipping and bone mineral density (BMD) through two-sample Mendelian randomisation (MR) analysis.
Methods: A two-sample MR approach was adopted to explore the causal relationship of breakfast skipping with BMDs (across three skeletal sites and five age groups). Publicly available genome-wide association study summary data were used for MR analysis. We used five methods to estimate the causal associations between breakfast skipping and BMDs: inverse-variance weighting (IVW), MR-Egger, weighted median, simple mode, and weighted mode. IVW was used for the main analysis and the remaining four methods were used as supplementary analyses. The heterogeneity of the MR results was determined using IVW and MR-Egger methods. The pleiotropy of the MR results was determined using MR-Egger intercept. Furthermore, a leave-one-out test was performed to determine whether the MR results were affected by a single nucleotide polymorphism.
Results: With the IVW method, we did not find any causal relationship between breakfast skipping and forearm, femoral neck, and lumbar spine BMD. Subsequently, when we included BMD data stratified by five different age groups in the analysis, the results showed that there was no apparent causal effect between breakfast skipping and age-stratified BMD. This finding was supported by all four supplementary methods (P > 0.05 for all methods). No heterogeneity or horizontal pleiotropy was detected in any of the analyses (P > 0.05). The leave-one-out tests conducted in the analyses did not identify any single nucleotide polymorphism that could have influenced the MR results, indicating the reliability of our findings.
Conclusion: No causal effect was found between breakfast skipping and BMD (across three skeletal sites and five age groups).
Ageing-related disorders have become more prevalent in contemporary society because of advancements in healthcare, changes in socioeconomic conditions, and improvements in lifestyle. As a result, there has been a significant improvement in life expectancy (1). Osteoporosis is a common condition that affects the musculoskeletal system, causing a reduction in bone mass and degradation of bone microarchitecture. This, in turn, increases the risk of individuals developing pathological fractures because of decreased bone density (2). Currently, the method for diagnosing osteoporosis is by evaluating a patient’s bone mineral density (BMD) through dual energy X-ray absorptiometry (DXA) assessment, which is also the gold standard for defining osteoporosis (3). Osteoporosis is more common in women than men, with a prevalence of 29.9% in women aged 50 years or older, which is 13.9% higher than that in men (4). An estimated $25 billion is expected to be spent on osteoporosis-related pathological fractures in the United States in 2025 (5). The primary approach for treating osteoporosis at present is through medication, including bisphosphonates, calcitonin, oestrogen, and oestrogen receptor agonists. However, these medications have limited efficacy in treating the condition and can cause significant adverse reactions (6). Therefore, it is important to recognise the risk factors that contribute to osteoporosis, screen individuals who are at risk, and facilitate prevention and early intervention as necessary. Many studies have demonstrated factors that are associated with the disease, such as older age, sex, as well as a diverse range of clinical, medical, behavioural, nutritional, and genetic factors (3, 5, 7, 8).
Food intake timing is a contributing factor to the risk of chronic diseases (9, 10). Breakfast, as the first meal of the day, plays an important role in providing essential nutrients and regulating metabolism. According to research, individuals who do not eat breakfast during both childhood and adulthood are more likely to develop various chronic diseases, including hypertension, cardiovascular metabolic disorders, insulin resistance, and diabetes, in adulthood. By contrast, individuals who have breakfast during both periods have a lower risk (11). In a report targeting adult males in Japan, research findings have indicated that adult males who regularly eat breakfast have the highest bone density, followed by those who occasionally eat breakfast, while the group who rarely eat breakfast have the lowest bone density (12). Another 3-year prospective study supports this viewpoint, indicating that skipping breakfast is not only significantly associated with a decline in bone density but also with changes in bone structure. This correlation exists in both male and female individuals (13). However, we need to approach the results of observational studies with caution, as they are susceptible to confounding factors and reverse causation. Randomised controlled trials have a higher level of evidence compared with other study designs, but they require more resources in terms of manpower, materials, and finances, and can be difficult to implement.
Mendelian randomisation (MR) is an analytical method that investigates causal relationships between exposure and outcome by using genetic variables as instrumental variables (IVs). This analytical approach follows Mendel’s law of inheritance, in which alleles are randomly distributed during meiosis, substantially reducing interference from confounding factors. Furthermore, since diseases occur after genetic variations, and the temporal sequence cannot be reversed, MR analysis is not influenced by reverse causality when exploring causal relationships between exposure and outcome. Its mechanism is similar to that of randomised controlled trials (14, 15), making this genetic-variable-based analytical method capable of yielding more reliable conclusions (16). Previous MR studies have demonstrated causal effects of factors such as fasting glucose (17), low-density lipoprotein cholesterol (18), and central obesity (19) on the development of BMD. However, an MR study on the causal effect of breakfast skipping on BMD has not been conducted.
In this study, a two-sample MR approach was used to estimate the causal effects of breakfast skipping on site-specific and age-specific BMDs.
Specifically, in MR analysis, as shown in Figure 1, effective IVs must adhere to three key assumptions. Firstly, only genetic variants (single nucleotide polymorphisms, SNPs) strongly associated with the exposure (breakfast skipping) can be used as IVs. Secondly, genetic variants should not be correlated with any potential confounding factors to ensure the reliability of the MR analysis. Thirdly, genetic variants must influence the outcome (BMDs) solely through their effect on the exposure and should not impact the outcome through any other pathways. Building upon these assumptions, we estimated the causal relationship between breakfast skipping and forearm BMD (FABMD), femoral neck BMD (FNBMD), lumbar spine BMD (LSBMD), and across five age groups (0–15 years, 15–30 years, 30–45 years, 45–60 years, and over 60 years).
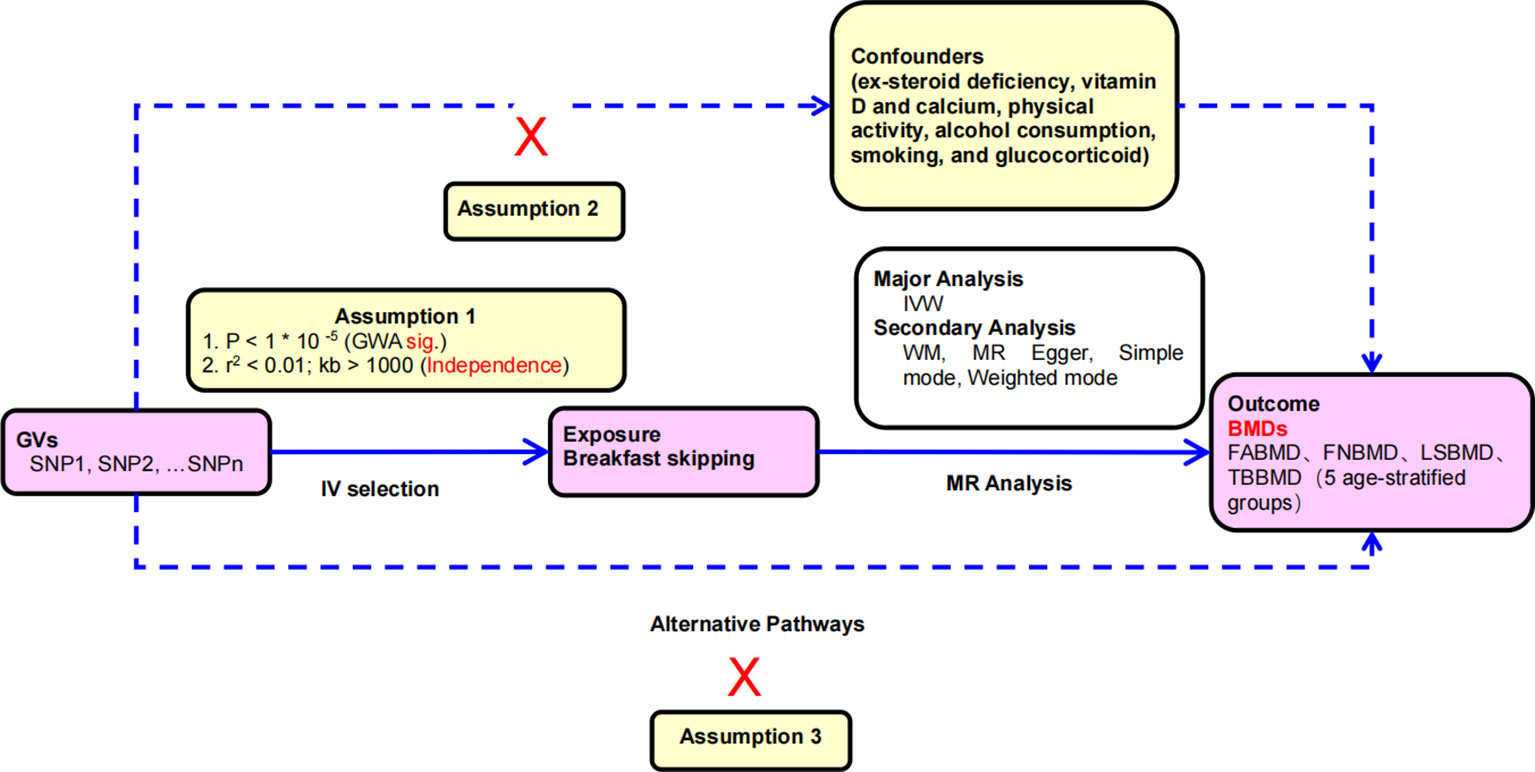
Figure 1 Principles of mendelian randomization study: (1) The relevance assumption: there is a strong correlation between the instrumental variable and the exposure factor being studied. (2) The independence assumption: the instrumental variable should not be associated with any potential confounder; (3) The exclusion restriction assumption: the instrumental variable should influence the outcome risk merely through the exposures, not via any alternative pathway.
We chose the most comprehensive genome-wide association study (GWAS) data on breakfast skipping (20). Dietary data were collected from 193,860 participants, including 106,284 female participants (accounting for approximately 54% of the total sample) using Oxford WebQ (21), a web-based 24-hour diet recall. The participants had an average age of 56.8 years and an average body mass index of 26.9 kg/m2. This method required participants to report their dietary intake over the past 24 hours. Breakfast skipping was assessed with the use of data from up to five web-based 24-hour diet recalls. Participants were asked, “Did you eat breakfast yesterday? This could be at any time. Please choose Yes or No”. Responses from all completed recalls (up to five times) were considered. The responses were categorised into three groups: breakfast skipping (always responded “No”), sometimes breakfast skipping (sometimes responded “Yes”), and breakfast consumers (always responded “Yes”). Full summary statistics for the breakfast skipping (N = 193,860) GWAS are available for download from the Musculoskeletal KP genetic association datasets (https://msk.hugeamp.org/datasets.html).
The forearm, femoral neck, and lumbar spine are the three skeletal sites most commonly used for DXA-based BMD measurement when diagnosing and screening for osteoporosis. The GWAS data for BMDs was downloaded from the Genetic Factors for Osteoporosis Consortium website (http://www.gefos.org/). The data provide bone density measurements for the forearm, femoral neck, and lumbar spine, with sample sizes of 8,143 (FABMD), 32,735 (FNBMD), and 28,498 (LSBMD). These data are from the largest GWAS study to date on DXA-measured BMD and represent the most comprehensive dataset available on this topic (22).
In addition, we obtained total body BMD (TBBMD) data for five age groups (0–15 years, 15–30 years, 30–45 years, 45–60 years, and over 60 years) from a large GWAS meta-analysis (23), encompassing data for 66,628 individuals (0–15 years: n = 11,807; 15–30 years: n = 4,180; 30–45 years: n = 10,062; 45–60 years: n = 18,805; and over 60 years: n = 22,504). In this study, all individuals (except for the age-stratified BMD data) belong to the European population, and the age-stratified data were provided by individuals of European ancestry (86%) and mixed backgrounds (14%).
First, we extracted SNPs strongly correlated with the exposure (breakfast skipping), using a screening criterion of (P < 5 × 10⁻⁸) (24). Second, to avoid a linkage disequilibrium among the included SNPs, we used the “clump” function to select independent SNPs (r2 <0.001 and windows size >10,000 kb) as IVs, which ensured reliability of the analysis results (25). After screening, only six SNPs were identified, so we relaxed the criteria to 1 × 10⁻⁵, R2 < 0.01, and window size = 1,000 kb for selecting breakfast skipping-related IVs. Third, we manually reviewed SNPs that met the above criteria using the PhenoScanner database, excluding SNPs directly related to osteoporosis and SNPs associated with confounding factors (risk and protective factors) for osteoporosis. Confounding factors include but are not limited to sex-steroid deficiency (26, 27), vitamin D and calcium (28, 29), physical activity (30), alcohol consumption (31, 32), smoking (33), and glucocorticoid (34)). Fourth, after the criteria-based screening, qualified SNPs were used to extract outcome information. During this process, if SNP information was missing, we did not use proxy functions. Additionally, we further screened the extracted SNPs to remove those with non-concordant alleles and palindromic SNPs with ambiguous strands (35, 36). Fifth, to enhance the reliability of the MR analysis results, we calculated the F-statistic of each SNP using the formula (37), and if the F-statistic was greater than 10, the results were less likely to be influenced by weak IVs (37). Finally, we retained the SNPs that met the criteria as IVs for the subsequent MR analysis.
We employed five methods for performing MR analysis to investigate the causal relationship between breakfast skipping and BMD. The inverse-variance weighting (IVW) (38) method assumes that all SNPs are valid instrumental variables and that there is no correlation between each SNP. In this scenario, the IVW method can provide the most accurate causal estimates (39), while the methods MR-Egger (40), weighted median (41), simple mode (42), and weighted mode (43) are considered supplementary analysis methods. In addition, we conducted heterogeneity, pleiotropy, and sensitivity analyses to assess whether heterogeneity and pleiotropy would impact our MR results. First, to quantitatively evaluate the degree of heterogeneity among individual SNPs, we calculated the Q-statistics and I2 values (44). The “leave-one-out” approach was used to identify potentially influential SNPs. This involved performing the MR analysis multiple times, each time leaving out a different SNP (40). Subsequently, we employed the “mr_pleiotropy_test” function from the R TwoSampleMR package to examine the pleiotropy of our effect estimates using the MR-Egger intercept method. Lastly, to obtain outlier-adjusted estimates of causal associations, we employed the MR-PRESSO (Pleiotropy RESidual Sum and Outlier) analysis. This involved removing one or more pleiotropic outlying SNPs and reconducting MR analyses (45). All statistical analyses were performed using R (version 4.2.2) using the Two-Sample MR package (22), with P values < 0.05 regarded as statistically significant.
SNPs that did not meet the criteria, including those with linkage disequilibrium or MAF < 0.01, palindromic SNPs, and confounder-related SNPs, were excluded. The remaining SNPs that met the criteria can be found in Additional file 1. Afterward, we extracted the SNPs and their corresponding statistical data that were associated with the outcome. We selected 15, 14, 14, 19, 18, 20, 20, and 20 SNPs as instrumental variables for the causal analyses between breakfast skipping and FABMD, FNBMD, LSBMD, TBBMD (0–15 years), TBBMD (15–30 years), TBBMD (30–45 years), TBBMD (45–60 years), and TBBMD (over 60 years). Detailed information is provided in Additional file 2.
We used five different analytical methods to explore the causal relationship between breakfast skipping and BMDs. The results of these methods are presented in Tables 1, 2. In the analysis, the IVW method did not find any proof to suggest that breakfast skipping causes changes in BMDs (FABMD: β = 0.502, Se = 0.355, P = 0.158; FNBMD: β = −0.162, Se = 0.151, P = 0.284; LSBMD: β = 0.026, Se = 0.211, P = 0.901). Figures 2A–C present scatter plots of the MR analysis for the causal relationship between breakfast skipping and FABMD, FNBMD, and LSBMD, respectively. In Figures 3A–C, the causal relationships between breakfast skipping and FABMD, FNBMD, and LSBMD, respectively, are presented in forest plots. In the figures, we could observe the causal effects of individual SNPs as well as the overall SNPs effects. Finally, we present the results of the leave-one-out analysis in Figures 4A–C. During this process, we did not identify any single SNP with a strong effect that would influence the overall outcome, demonstrating the robustness and reliability of our findings.
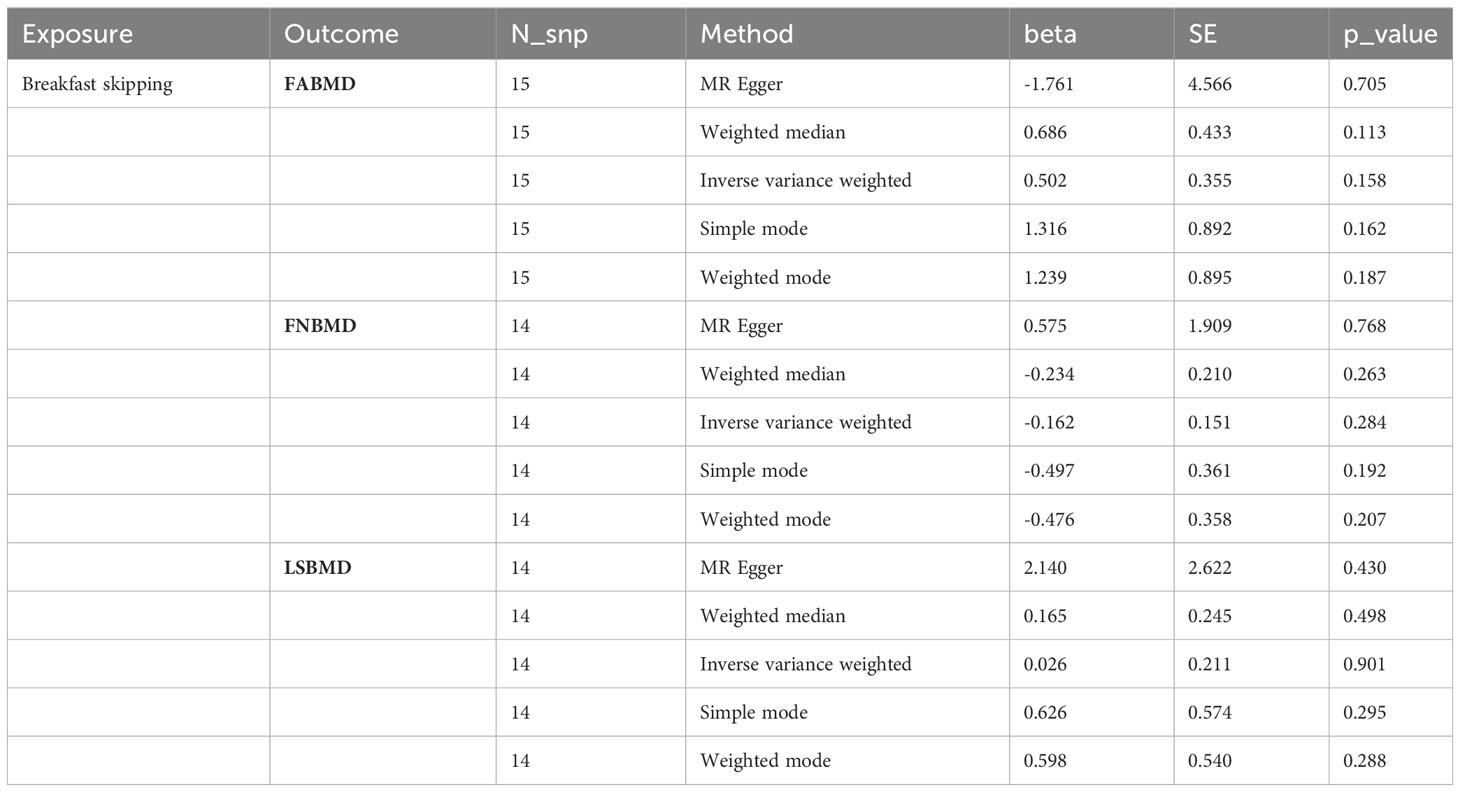
Table 1 MR estimates from different methods of assessing the causal effect of breakfast skipping on BMDs by site.
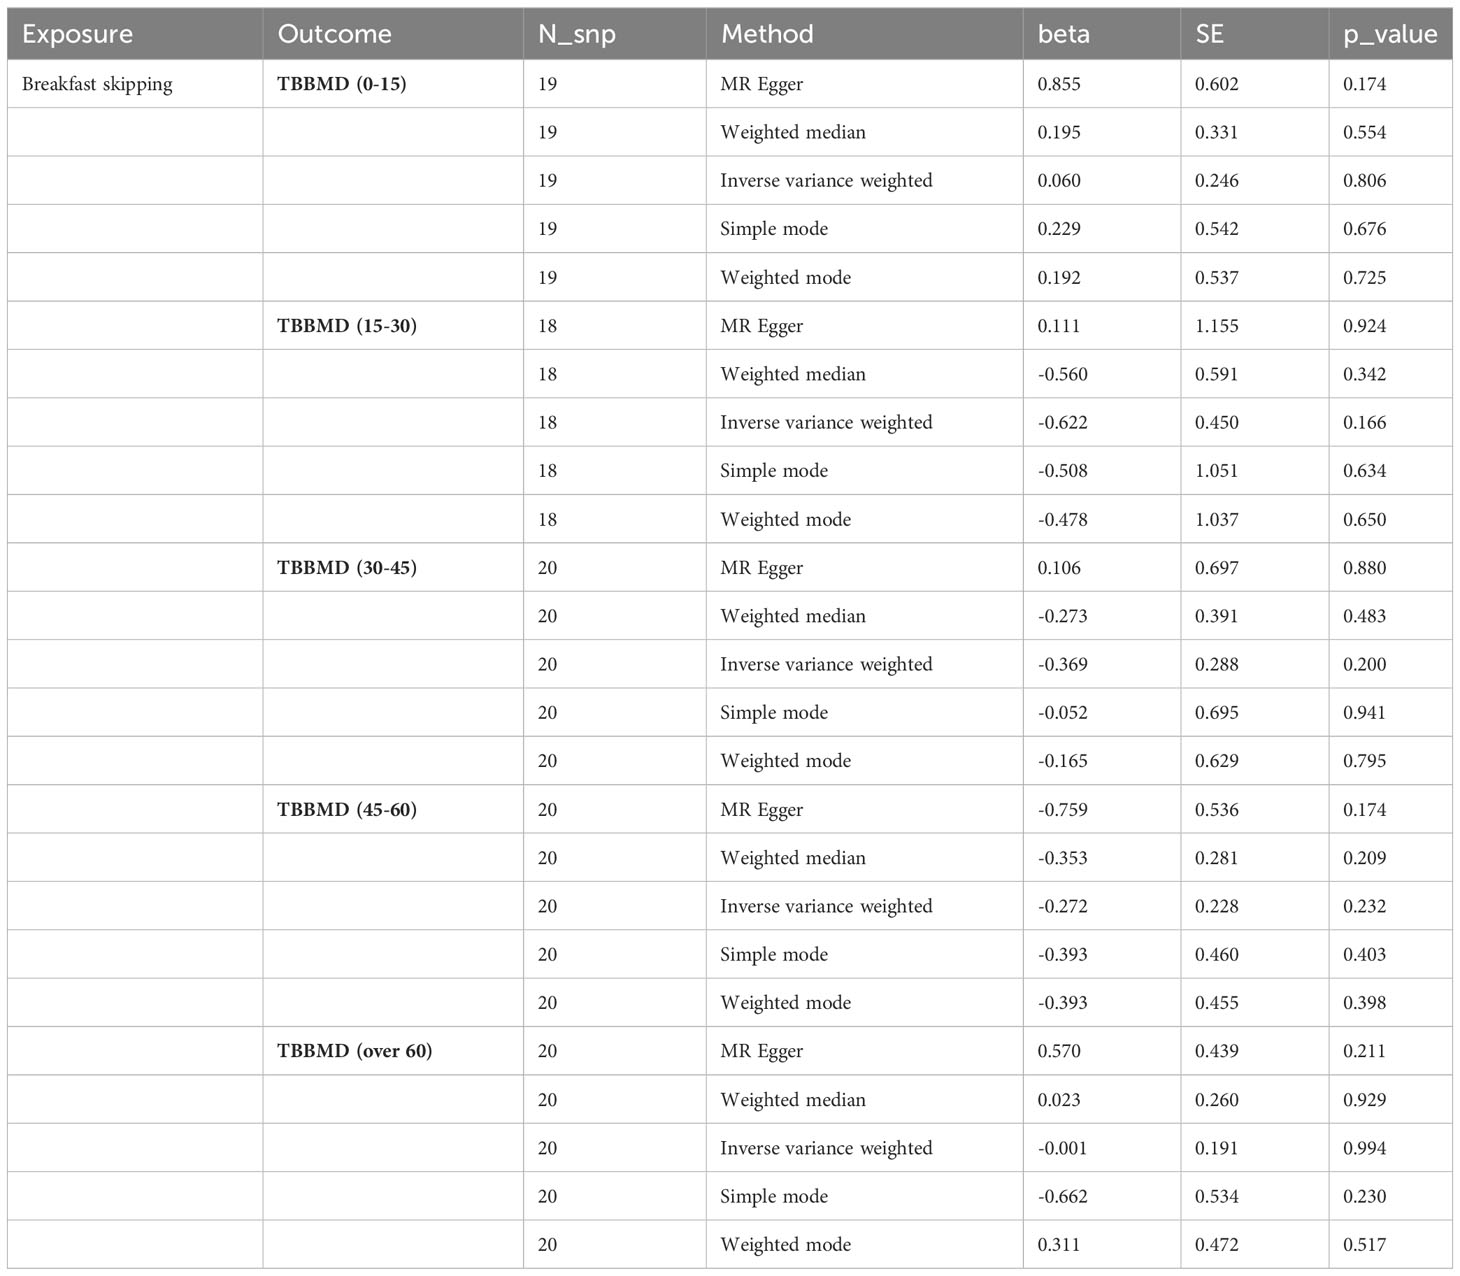
Table 2 MR estimates from different methods of assessing the causal effect of breakfast skipping on BMDs at different ages.
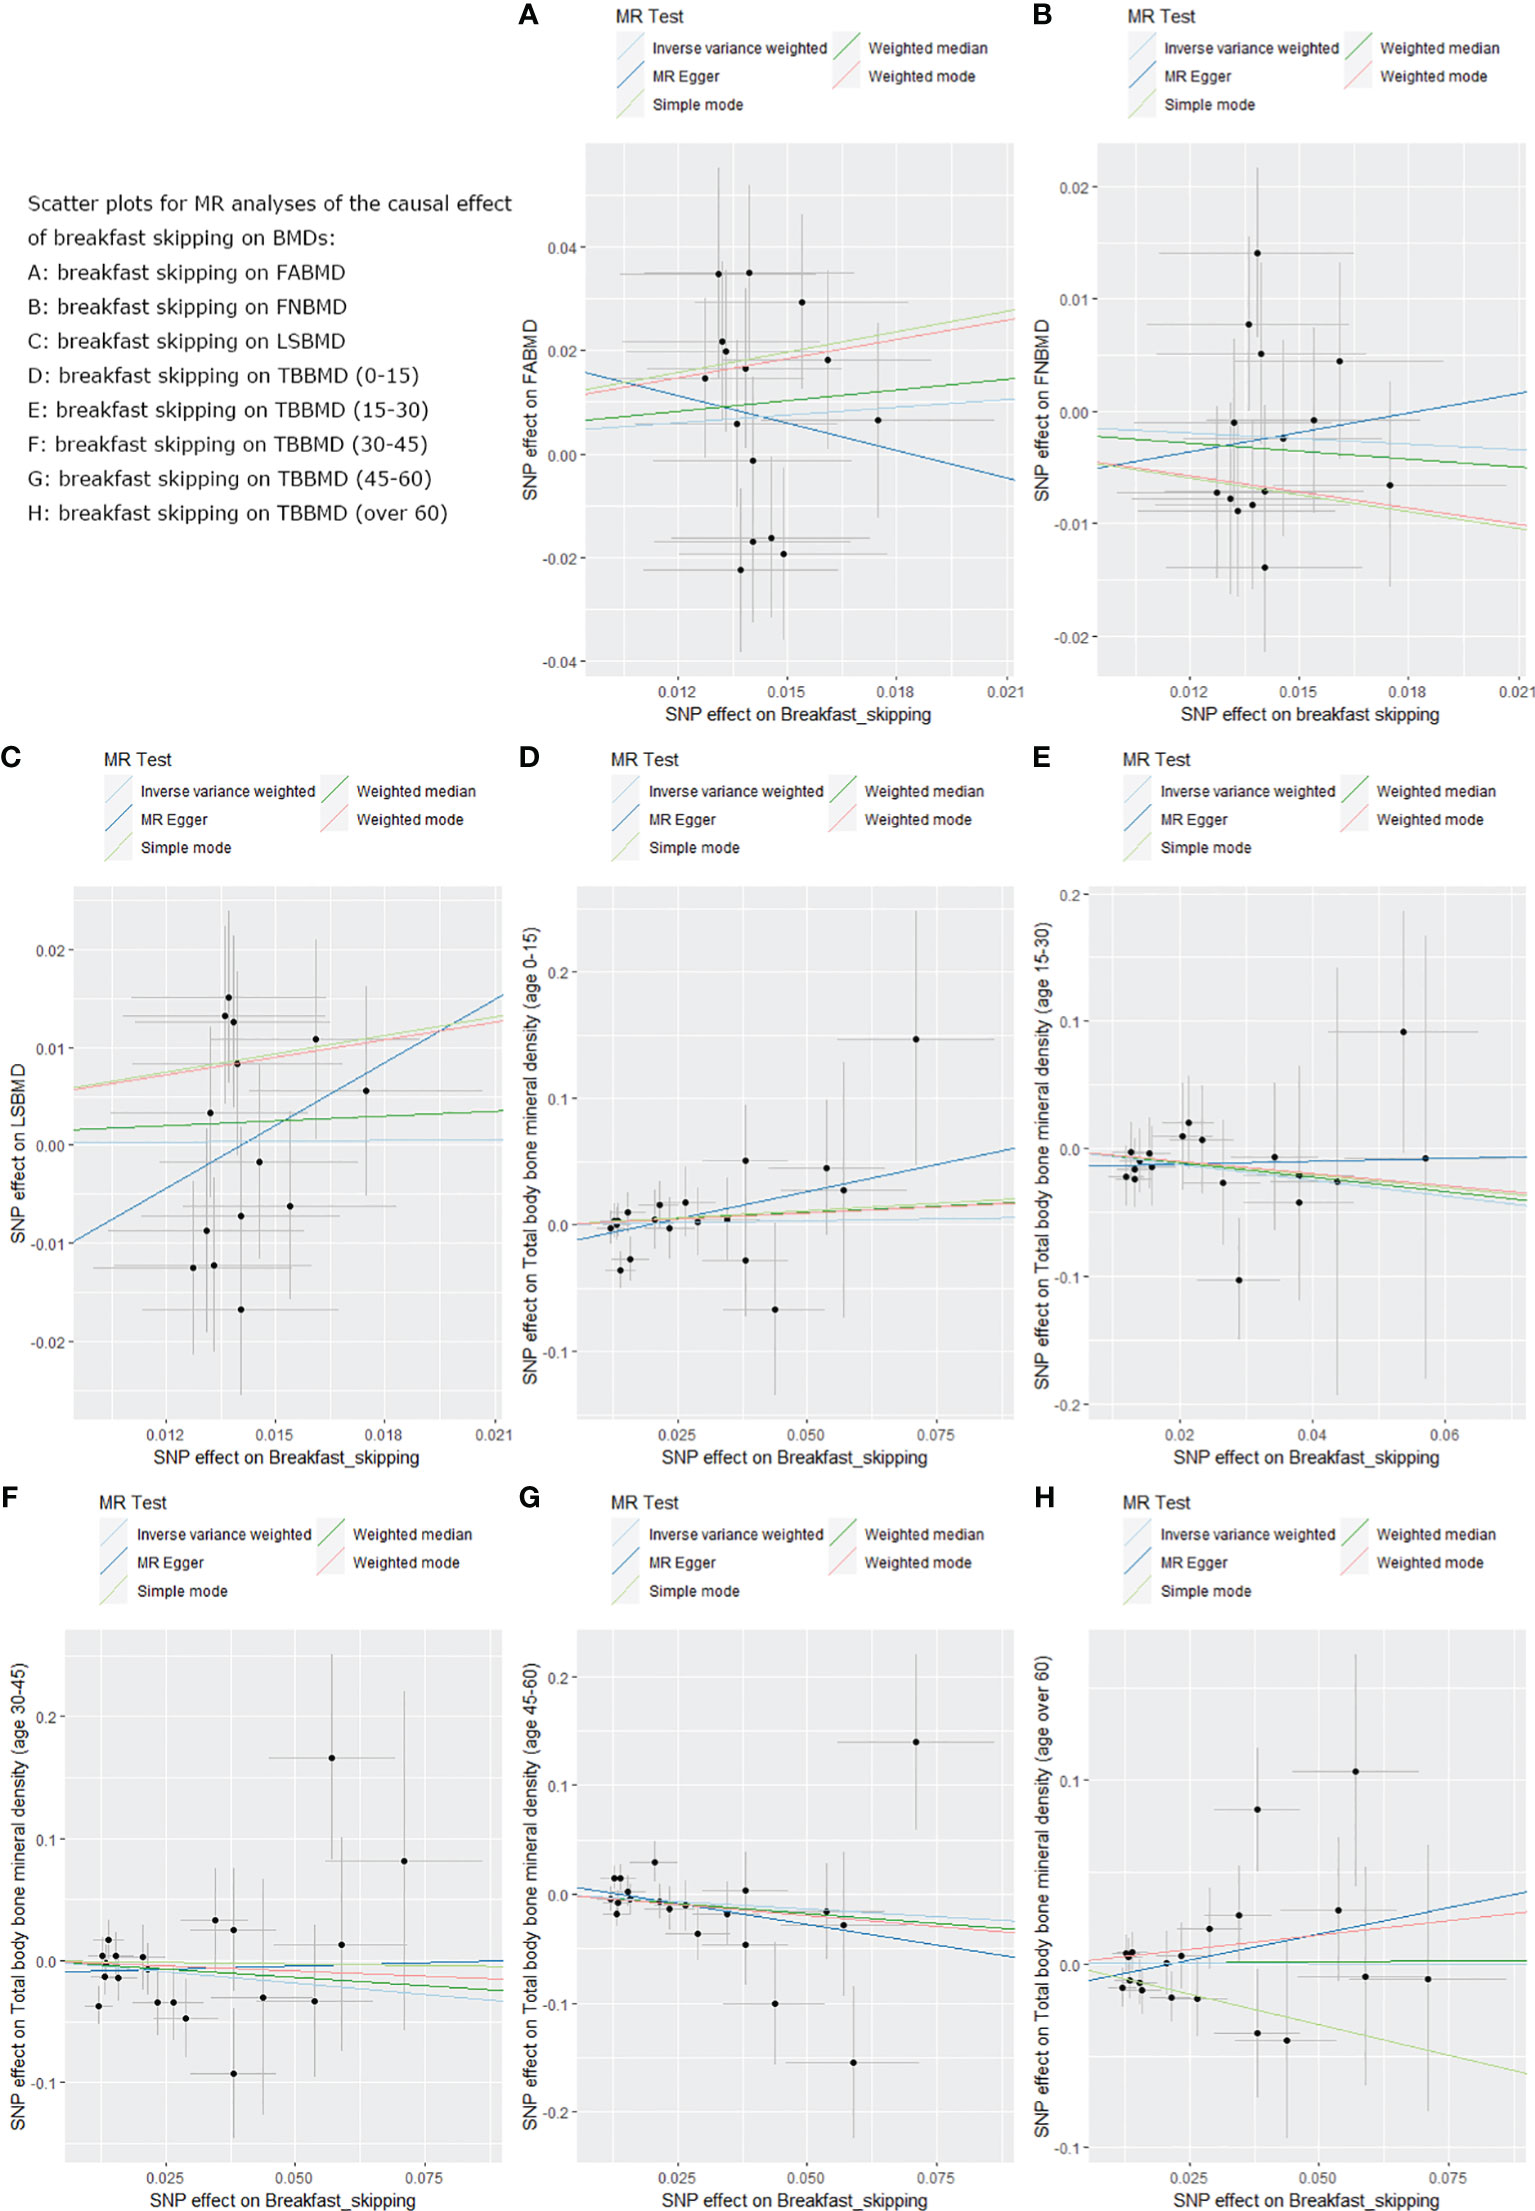
Figure 2 Scatter plots for the MR analysis, which explore the causal effect of breakfast skipping on BMDs. (A): The scatter plot for breakfast skipping on FABMD. (B): The scatter plot for breakfast skipping on FNBMD. (C): The scatter plot for breakfast skipping on LSBMD. (D): The scatter plot for breakfast skipping on TBBMD (0-15). (E): The scatter plot for breakfast skipping on TBBMD (15-30). (F): The scatter plot for breakfast skipping on TBBMD (30-45). (G): The scatter plot for breakfast skipping on TBBMD (45-60). (H): The scatter plot for breakfast skipping on TBBMD (over 60).
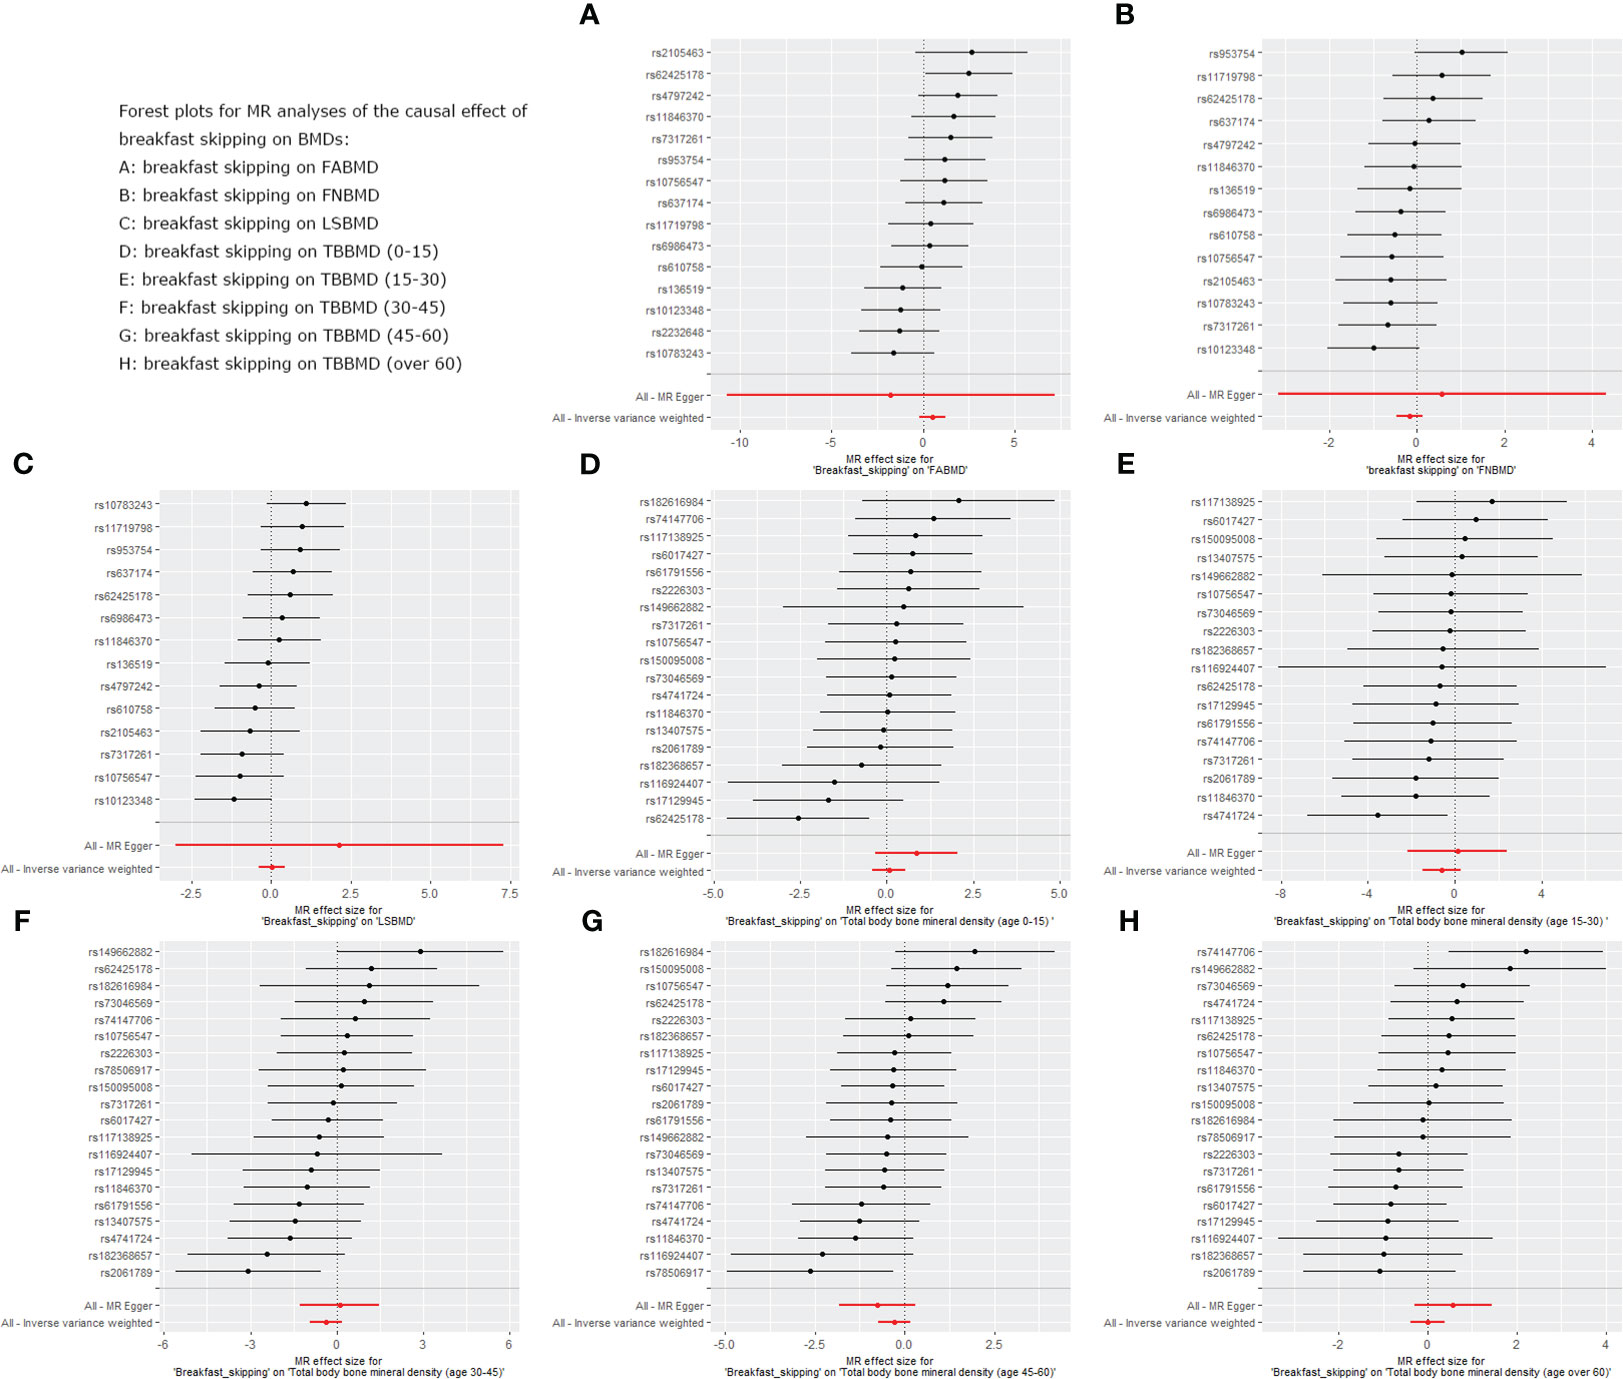
Figure 3 Forest plot for MR analysis of single and summarized SNPs effects on relationship between “breakfast skipping” and “BMDs”. (A): The forest plot for breakfast skipping on FABMD. (B): The forest plot for breakfast skipping on FNBMD. (C): The forest plot for breakfast skipping on LSBMD. (D): The forest plot for breakfast skipping on TBBMD (0-15). (E): The forest plot for breakfast skipping on TBBMD (15-30). (F): The forest plot for breakfast skipping on TBBMD (30-45). (G): The forest plot for breakfast skipping on TBBMD (45-60). (H): The forest plot for breakfast skipping on TBBMD (over 60).
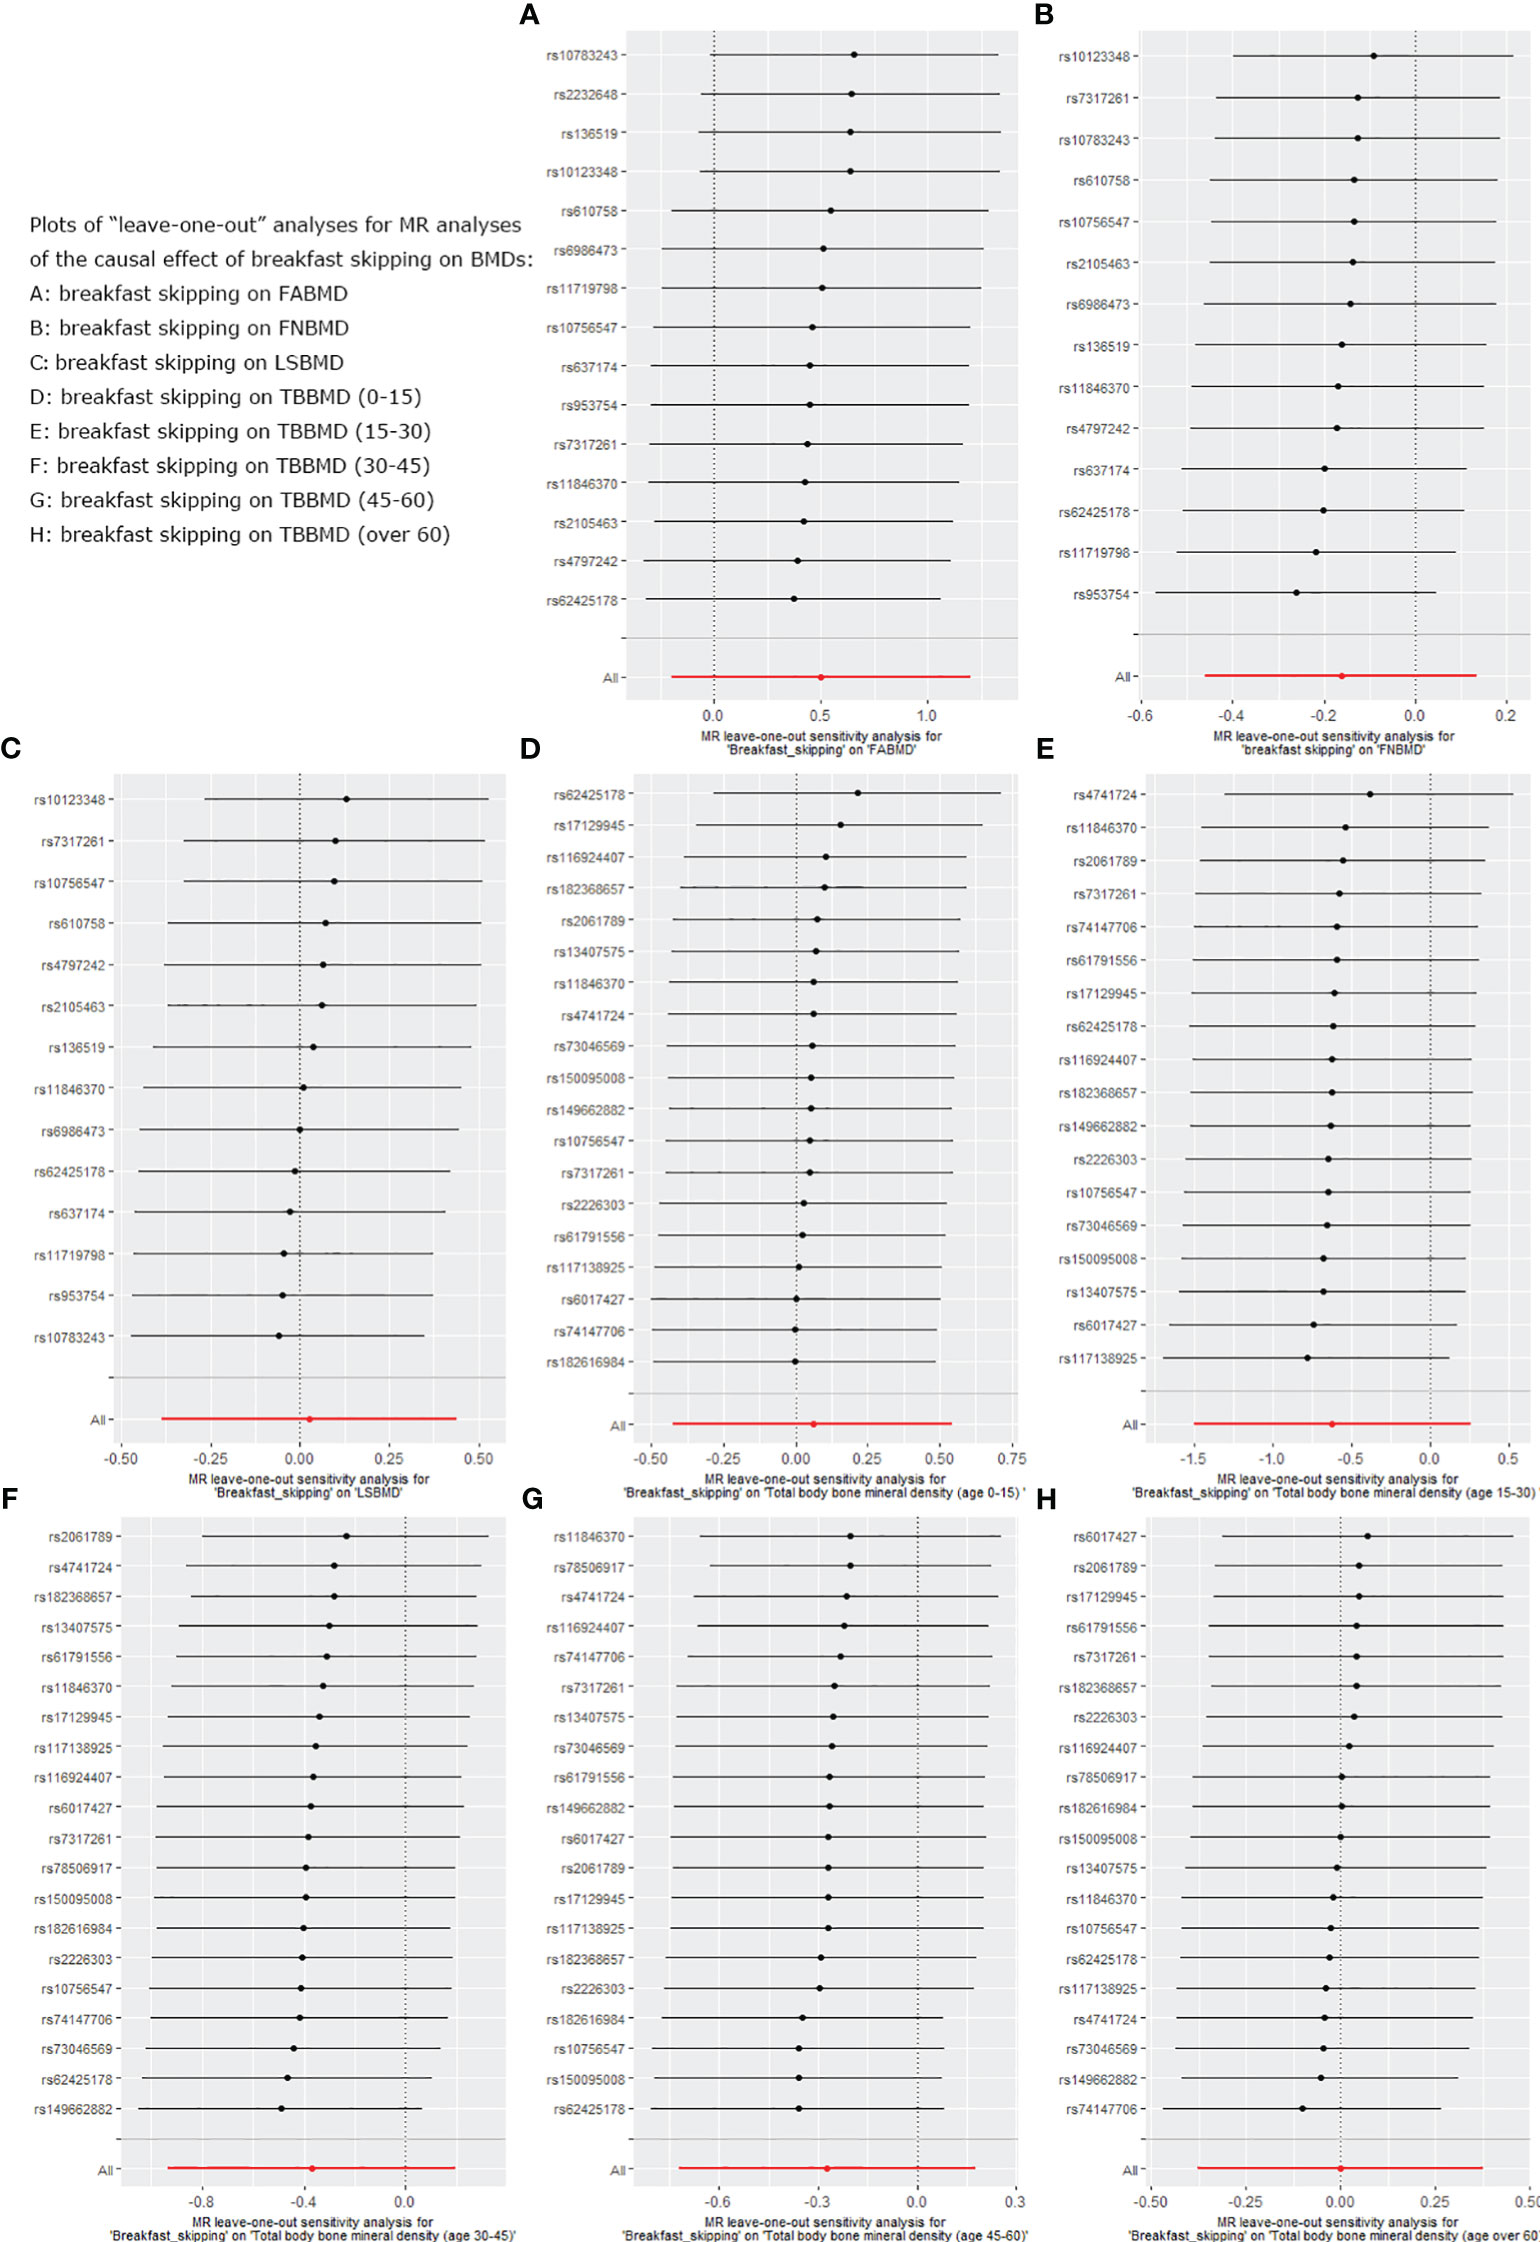
Figure 4 Leave-one-out plot for sensitivity analysis of single SNP effect on “breakfast skipping” to “BMDs” MR results. (A): The “leave-one-out” sensitivity test for breakfast skipping on FABMD. (B): The “leave-one-out” sensitivity test for breakfast skipping on FNBMD. (C): The “leave-one-out” sensitivity test for breakfast skipping on LSBMD. (D): The “leave-one-out” sensitivity test for breakfast skipping on TBBMD (0-15). (E): The “leave-one-out” sensitivity test for breakfast skipping on TBBMD (15-30). (F): The “leave-one-out” sensitivity test for breakfast skipping on TBBMD (30-45). (G): The “leave-one-out” sensitivity test for breakfast skipping on TBBMD (45-60). (H): The “leave-one-out” sensitivity test for breakfast skipping on TBBMD (over 60).
In the causal analysis of breakfast skipping and age-stratified BMDs, no significant causal relationship was found between breakfast skipping and BMD in five different age groups. The IVW method, as the primary analytical approach, yielded the following results (TBBMD 0–15 years: β = 0.060, Se = 0.246, P = 0.806; TBBMD 15–30 years: β = −0.622, Se = 0.450, P = 0.166; TBBMD 30–45 years: β = −0.369, Se = 0.288, P = 0.200; TBBMD 45–60 years: β = −0.272, Se = 0.228, P = 0.232; TBBMD over 60 years: β = −0.001, Se = 0.191, P = 0.994). The results from the remaining four supplementary analysis methods supported the findings of the IVW method. In Figures 2D–H, scatter plots are provided for the causal analysis of breakfast skipping and age-stratified BMDs. Figures 3D–H present forest plots for individual SNP effect analysis. Similarly, in the leave-one-out analysis, as shown in Figures 4D–H, no SNP with a strong driving force effect on the overall outcome was found.
As shown in Table 3, no significant pleiotropy and heterogeneity were found in the analysis: breakfast skipping−FABMD: IVW, p = 0.130; MR-Egger, p = 0.105; MR-Egger intercept = 0.032, p = 0.627; breakfast skipping−FNBMD: IVW, p = 0.434; MR-Egger, p = 0.368; MR-Egger intercept = −0.010, p = 0.705; breakfast skipping−LSBMD: IVW, p = 0.129; MR-Egger, p = 0.120; MR-Egger intercept = −0.030, p = 0.434; breakfast skipping−TBBMD 0–15 years: IVW, p = 0.617; MR-Egger, p = 0.698; MR-Egger intercept = −0.016, p = 0.166; breakfast skipping−TBBMD 15–30 years: IVW, p = 0.975; MR-Egger, p = 0.972; MR-Egger intercept = −0.014, p = 0.500; breakfast skipping−TBBMD 30–45 years: IVW, p = 0.381; MR-Egger, p = 0.355; MR-Egger intercept = −0.009, p = 0.461; breakfast skipping−TBBMD 45–60 years: IVW, p = 0.188; MR-Egger, p = 0.193; MR-Egger intercept = 0.010, p = 0.329; breakfast skipping−TBBMD over 60 years: IVW, p = 0.348; MR-Egger, p = 0.413; and MR-Egger intercept = 0.012, p = 0.168.
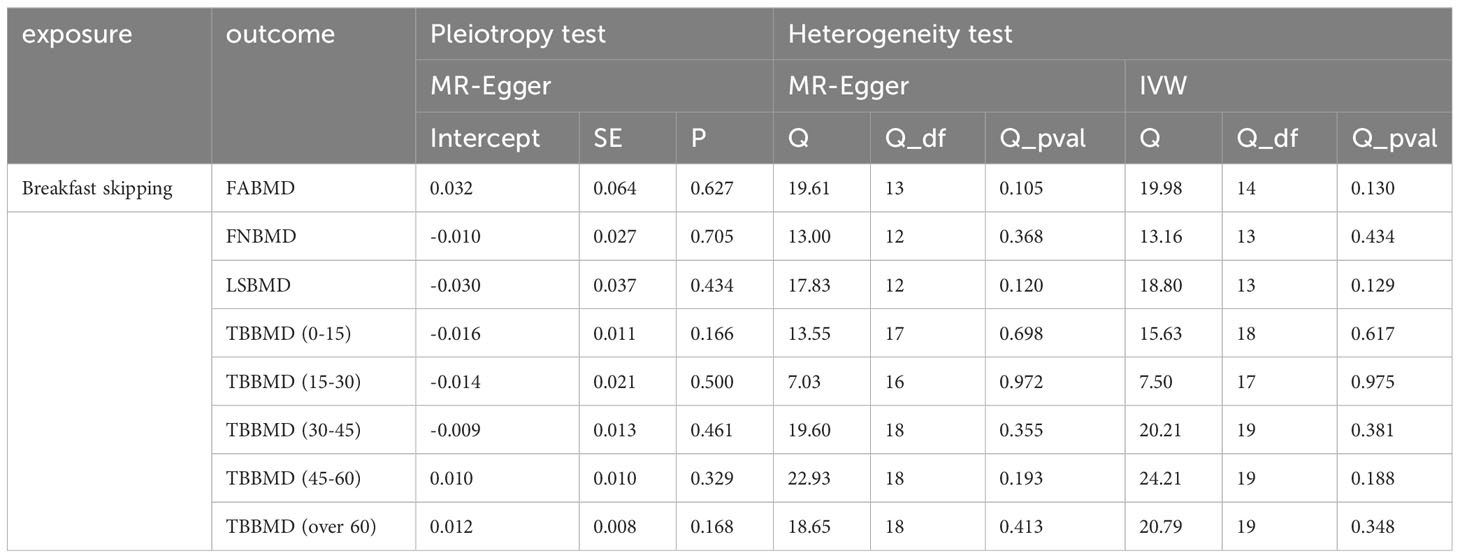
Table 3 Pleiotropy and heterogeneity test of the breakfast skipping from BMDs GWAS.
To the best of our knowledge, this is the first MR study on the causal relationship between breakfast skipping and BMDs. We utilised data from large GWAS and the UK Biobank to assess the potential causal effect between the two. Our study did not observe a causal effect of breakfast skipping on BMDs in the forearm, femoral neck, and lumbar spine. Subsequently, we conducted further analyses stratified by age groups, and the results indicated that there was no significant causal effect of breakfast skipping on BMDs across the five age groups.
Breakfast is an indicator of a health-promoting lifestyle and behaviour, and breakfast skipping is considered a subclinical eating disorder (46). It is frequently evaluated in certain epidemiological studies (47, 48). The heritability of this behaviour as a genetic trait ranges from 41% to 66% (49). Moreover, it is a risk factor for a range of diseases, such as obesity, type 2 diabetes, cardiovascular disease, and metabolic syndrome (50–52). Behavioural studies related to this indicate that smokers are more prevalent among breakfast skippers, and the likelihood of smoking increases with the frequency of breakfast skipping during the week (53). Additionally, breakfast skippers tend to consume higher alcohol levels, with an average daily alcohol intake of 20.5 grams for breakfast skippers compared with 8.6 grams for breakfast eaters (54, 55).
In a study related to the correlation between breakfast skipping and BMDs, Kuroda et al. (56) conducted an observational study comparing the relationship between breakfast frequency and BMDs. The results showed that individuals who skipped breakfast 1–2 times a week had lower hip BMD than those who ate breakfast every day, but the results were not statistically significant. However, individuals who skipped breakfast at least three times a week had significantly lower hip BMD than those who skipped breakfast 1–2 times a week and those who ate breakfast every day (p=0.071, p=0.007, respectively). However, these differences were not significant in the comparison of lumbar spine BMD. It is noteworthy that all the participants involved in this study were female. In another study regarding the relationship between skipping breakfast and bone density, Nagata et al. (13) found a significant association between breakfast skipping and reduced lumbar spine BMD in men. At the same time, this study supports the viewpoint of Kuroda et al., indicating that in the female population, breakfast skipping is not significantly associated with lumbar spine BMD.
There are several potential mechanisms that can explain why breakfast skipping may lead to a decrease in BMD. Firstly, breakfast skipping is associated with reduced satiety and changes in appetite, which may result in overeating during the next meal and affect insulin sensitivity (51, 57, 58). By contrast, having breakfast is beneficial for appetite regulation, stabilising blood sugar levels, and increasing insulin sensitivity (59). The skeletal system plays a crucial role in glucose and energy metabolism as an important component of the endocrine system. Among them, osteocalcin is a specific non-collagenous protein that is abundant in osteoblasts and a key determinant of bone formation. Research has shown that there is a significant positive correlation between insulin sensitivity and osteocalcin (60), i indicating that reduced insulin sensitivity can affect bone formation, leading to bone loss. Secondly, breakfast skipping is associated with the overactivity of the hypothalamic–pituitary–adrenal axis, often leading to elevated blood pressure in the morning (61). Research suggests a significant association between elevated blood pressure and alterations in calcium metabolism, involving increased movement of calcium from the bones, accelerated calcium loss, and compensatory activation of the parathyroid gland. Furthermore, the detrimental effects of elevated blood pressure on calcium balance are persistent, leading to further reductions in BMD (62). Conversely, eating breakfast has been shown to help lower blood pressure (63), thus reducing the adverse effects associated with elevated blood pressure. Finally, skipping breakfast may also have adverse effects on lipid levels, such as elevated total cholesterol and low-density lipoprotein cholesterol concentrations (11, 52). This has been confirmed as a risk factor for low BMD (18, 64).
However, in our study, we did not find any correlation between breakfast skipping and decreased BMDs. The disparities in inconsistent results can primarily be attributed to the type and design of the research. Previous study conclusions were based on the outcomes of observational studies, and establishing causality is a limitation of observational research. Observational studies are weaker in controlling confounding factors compared with MR analysis. In observational studies, confounding factors cannot be entirely eliminated even when rigorous normalisation processes have been implemented (16). Furthermore, our study used a greater number of instruments, offering enhanced robustness while analysing data, under the assumption of meeting the three core MR assumptions. This methodology enabled a more precise assessment of the relationship between breakfast skipping and BMDs. Lastly, differences in the study populations must be taken into account. Previous reports regarding the correlation between breakfast skipping and BMD mainly focused on Asian populations, in which racial and lifestyle differences from the populations studied here may have produced different findings.
This study had several important strengths. To the best of our knowledge, our study is the first MR study to investigate the causal relationship between breakfast skipping and BMD using GWAS data. Undoubtedly, our MR analysis surpasses previous observational studies as we used summary data from GWAS, providing a significantly larger sample size and a substantial number of SNPs. Importantly, our study yielded robust and reliable results, as there was no evidence of heterogeneity or pleiotropic effects. However, this study still had some limitations. Firstly, the study included populations from Europe and the Americas, so our conclusions should be cautiously extrapolated to other populations. Secondly, our study did not include data from indigenous populations. In future research, it would be necessary to further enhance the availability of GWAS databases for smaller regional areas to provide richer data for comparisons.
We investigated the causal relationship between skipping breakfast and BMD using MR. The study showed that there was no causal effect of breakfast skipping on BMD at the forearm, femoral neck, or lumbar spine. Further analysis of age-stratified BMD data did not reveal any causal effect of breakfast skipping on BMD. These findings are inconsistent with many previously published studies. When larger-scale GWAS data are available or more advanced methods are proposed, we will reanalyse the data to confirm our research findings, thereby reducing bias and providing more accurate results.
Publicly available datasets were analyzed in this study. This data can be found here: https://msk.hugeamp.org/datasets.html http://www.gefos.org/.
JY: writing-original draft. KT, CZ and WG: conceptualization: project administration: and writing review and editing. XZ, YC and LW: data curation and methodology. RZ and KT: formal analysis: validation: visualization. WL and YZ: software. All authors contributed to the article and approved the submitted version.
This work was supported by the national administration of traditional Chinese medicine, science and technology department and Zhejiang administration of traditional Chinese medicine, Jointly-funded program (Grant number: GZY-ZJ-KJ-23040).
The authors declare that the research was conducted in the absence of any commercial or financial relationships that could be construed as a potential conflict of interest.
All claims expressed in this article are solely those of the authors and do not necessarily represent those of their affiliated organizations, or those of the publisher, the editors and the reviewers. Any product that may be evaluated in this article, or claim that may be made by its manufacturer, is not guaranteed or endorsed by the publisher.
The Supplementary Material for this article can be found online at: https://www.frontiersin.org/articles/10.3389/fendo.2023.1200892/full#supplementary-material
1. Lorentzon M, Cummings SR. Osteoporosis: the evolution of a diagnosis. J Intern Med (2015) 277(6):650–61. doi: 10.1111/joim.12369
2. Ayers C, Kansagara D, Lazur B, Fu R, Kwon A, Harrod C. Effectiveness and safety of treatments to prevent fractures in people with low bone mass or primary osteoporosis: A living systematic review and network meta-analysis for the American college of physicians. Ann Intern Med (2023) 176(2):182–95. doi: 10.7326/M22-0684
3. Lane NE. Epidemiology, etiology, and diagnosis of osteoporosis. Am J Obstet Gynecol. (2006) 194(2 Suppl):S3–11. doi: 10.1016/j.ajog.2005.08.047
4. Wright NC, Saag KG, Dawson-Hughes B, Khosla S, Siris ES. The impact of the new National Bone Health Alliance (NBHA) diagnostic criteria on the prevalence of osteoporosis in the USA. Osteoporos Int (2017) 28(4):1225–32. doi: 10.1007/s00198-016-3865-3
5. Burge R, Dawson-Hughes B, Solomon DH, Wong JB, King A, Tosteson A. Incidence and economic burden of osteoporosis-related fractures in the United States, 2005-2025. J Bone Miner Res (2007) 22(3):465–75. doi: 10.1359/jbmr.061113
6. Chandran T, Venkatachalam I. Efficacy and safety of denosumab compared to bisphosphonates in improving bone strength in postmenopausal osteoporosis: a systematic review. Singapore Med J (2019) 60(7):364–78. doi: 10.11622/smedj.2019028
7. Rachner TD, Khosla S, Hofbauer LC. Osteoporosis: now and the future. Lancet. (2011) 377(9773):1276–87. doi: 10.1016/S0140-6736(10)62349-5
8. Morris JA, Kemp JP, Youlten SE, Laurent L, Logan JG, Chai RC, et al. An atlas of genetic influences on osteoporosis in humans and mice. Nat Genet (2019) 51(2):258–66. doi: 10.1038/s41588-018-0302-x
9. St-Onge MP, Ard J, Baskin ML, Chiuve SE, Johnson HM, Kris-Etherton P, et al. Meal timing and frequency: implications for cardiovascular disease prevention: A scientific statement from the american heart association. Circulation. (2017) 135(9):e96–e121. doi: 10.1161/CIR.0000000000000476
10. Mattson MP, Allison DB, Fontana L, Harvie M, Longo VD, Malaisse WJ, et al. Meal frequency and timing in health and disease. Proc Natl Acad Sci U S A. (2014) 111(47):16647–53. doi: 10.1073/pnas.1413965111
11. Smith KJ, Gall SL, McNaughton SA, Blizzard L, Dwyer T, Venn AJ. Skipping breakfast: longitudinal associations with cardiometabolic risk factors in the Childhood Determinants of Adult Health Study. Am J Clin Nutr (2010) 92(6):1316–25. doi: 10.3945/ajcn.2010.30101
12. Ishimoto Y, Yoshida M, Nagata K, Yamada H, Hashizume H, Yoshimura N. Consuming breakfast and exercising longer during high school increases bone mineral density in young adult men. J Bone Miner Metab (2013) 31(3):329–36. doi: 10.1007/s00774-012-0415-8
13. Nagata K, Yoshida M, Ishimoto Y, Hashizume H, Yamada H, Yoshimura N. Skipping breakfast and less exercise are risk factors for bone loss in young Japanese adults: a 3-year follow-up study. J Bone Miner Metab (2014) 32(4):420–7. doi: 10.1007/s00774-013-0510-5
14. Davey Smith G, Hemani G. Mendelian randomization: genetic anchors for causal inference in epidemiological studies. Hum Mol Genet (2014) 23(R1):R89–98. doi: 10.1093/hmg/ddu328
15. Burgess S, Labrecque JA. Mendelian randomization with a binary exposure variable: interpretation and presentation of causal estimates. Eur J Epidemiol. (2018) 33(10):947–52. doi: 10.1007/s10654-018-0424-6
16. Zhao SS, Mackie SL, Zheng J. Why clinicians should know about Mendelian randomization. Rheumatol (Oxford). (2021) 60(4):1577–9. doi: 10.1093/rheumatology/keab007
17. Ahmad OS, Leong A, Miller JA, Morris JA, Forgetta V, Mujammami M, et al. A mendelian randomization study of the effect of type-2 diabetes and glycemic traits on bone mineral density. J Bone Miner Res (2017) 32(5):1072–81. doi: 10.1002/jbmr.3063
18. Li GH, Cheung CL, Au PC, Tan KC, Wong IC, Sham PC. Positive effects of low LDL-C and statins on bone mineral density: an integrated epidemiological observation analysis and Mendelian randomization study. Int J Epidemiol. (2020) 49(4):1221–35. doi: 10.1093/ije/dyz145
19. Du D, Jing Z, Zhang G, Dang X, Liu R, Song J. The relationship between central obesity and bone mineral density: a Mendelian randomization study. Diabetol Metab Syndr (2022) 14(1):63. doi: 10.1186/s13098-022-00840-x
20. Dashti HS, Merino J, Lane JM, Song Y, Smith CE, Tanaka T, et al. Genome-wide association study of breakfast skipping links clock regulation with food timing. Am J Clin Nutr (2019) 110(2):473–84. doi: 10.1093/ajcn/nqz076
21. Liu B, Young H, Crowe FL, Benson VS, Spencer EA, Key TJ, et al. Development and evaluation of the Oxford WebQ, a low-cost, web-based method for assessment of previous 24 h dietary intakes in large-scale prospective studies. Public Health Nutr (2011) 14(11):1998–2005. doi: 10.1017/S1368980011000942
22. Zheng HF, Forgetta V, Hsu YH, Estrada K, Rosello-Diez A, Leo PJ, et al. Whole-genome sequencing identifies EN1 as a determinant of bone density and fracture. Nature. (2015) 526(7571):112–7. doi: 10.1038/nature14878
23. Medina-Gomez C, Kemp JP, Trajanoska K, Luan J, Chesi A, Ahluwalia TS, et al. Life-course genome-wide association study meta-analysis of total body BMD and assessment of age-specific effects. Am J Hum Genet (2018) 102(1):88–102. doi: 10.1016/j.ajhg.2017.12.005
24. Davies NM, Holmes MV, Davey Smith G. Reading Mendelian randomisation studies: a guide, glossary, and checklist for clinicians. BMJ (2018) 362:k601. doi: 10.1136/bmj.k601
25. Clarke L, Zheng-Bradley X, Smith R, Kulesha E, Xiao C, Toneva I, et al. The 1000 Genomes Project: data management and community access. Nat Methods (2012) 9(5):459–62. doi: 10.1038/nmeth.1974
26. Nakamura T, Imai Y, Matsumoto T, Sato S, Takeuchi K, Igarashi K, et al. Estrogen prevents bone loss via estrogen receptor alpha and induction of Fas ligand in osteoclasts. Cell. (2007) 130(5):811–23. doi: 10.1016/j.cell.2007.07.025
27. Sinnesael M, Claessens F, Laurent M, Dubois V, Boonen S, Deboel L, et al. Androgen receptor (AR) in osteocytes is important for the maintenance of male skeletal integrity: evidence from targeted AR disruption in mouse osteocytes. J Bone Miner Res (2012) 27(12):2535–43. doi: 10.1002/jbmr.1713
28. Bonjour JP, Kraenzlin M, Levasseur R, Warren M, Whiting S. Dairy in adulthood: from foods to nutrient interactions on bone and skeletal muscle health. J Am Coll Nutr (2013) 32(4):251–63. doi: 10.1080/07315724.2013.816604
29. Christodoulou S, Goula T, Ververidis A, Drosos G. Vitamin D and bone disease. BioMed Res Int (2013) 2013:396541. doi: 10.1155/2013/396541
30. Leeuwenburgh C, Heinecke JW. Oxidative stress and antioxidants in exercise. Curr Med Chem (2001) 8(7):829–38. doi: 10.2174/0929867013372896
31. Maurel DB, Boisseau N, Benhamou CL, Jaffre C. Alcohol and bone: review of dose effects and mechanisms. Osteoporos Int (2012) 23(1):1–16. doi: 10.1007/s00198-011-1787-7
32. Ronis MJ, Mercer K, Chen JR. Effects of nutrition and alcohol consumption on bone loss. Curr Osteoporos Rep (2011) 9(2):53–9. doi: 10.1007/s11914-011-0049-0
33. Yoon V, Maalouf NM, Sakhaee K. The effects of smoking on bone metabolism. Osteoporos Int (2012) 23(8):2081–92. doi: 10.1007/s00198-012-1940-y
34. Caplan A, Fett N, Rosenbach M, Werth VP, Micheletti RG. Prevention and management of glucocorticoid-induced side effects: A comprehensive review: A review of glucocorticoid pharmacology and bone health. J Am Acad Dermatol (2017) 76(1):1–9. doi: 10.1016/j.jaad.2016.01.062
35. Cui Z, Hou G, Meng X, Feng H, He B, Tian Y. Bidirectional causal associations between inflammatory bowel disease and ankylosing spondylitis: A two-sample mendelian randomization analysis. Front Genet (2020) 11:587876. doi: 10.3389/fgene.2020.587876
36. Hartwig FP, Davies NM, Hemani G, Davey Smith G. Two-sample Mendelian randomization: avoiding the downsides of a powerful, widely applicable but potentially fallible technique. Int J Epidemiol. (2016) 45(6):1717–26. doi: 10.1093/ije/dyx028
37. Burgess S, Thompson SG, Collaboration CCG. Avoiding bias from weak instruments in Mendelian randomization studies. Int J Epidemiol. (2011) 40(3):755–64. doi: 10.1093/ije/dyr036
38. Yuan S, Larsson S. Causal associations of iron status with gout and rheumatoid arthritis, but not with inflammatory bowel disease. Clin Nutr (2020) 39(10):3119–24. doi: 10.1016/j.clnu.2020.01.019
39. Yin KJ, Huang JX, Wang P, Yang XK, Tao SS, Li HM, et al. No genetic causal association between periodontitis and arthritis: A bidirectional two-sample mendelian randomization analysis. Front Immunol (2022) 13:808832. doi: 10.3389/fimmu.2022.808832
40. Burgess S, Thompson SG. Interpreting findings from Mendelian randomization using the MR-Egger method. Eur J Epidemiol. (2017) 32(5):377–89. doi: 10.1007/s10654-017-0255-x
41. Bowden J, Davey Smith G, Haycock PC, Burgess S. Consistent estimation in mendelian randomization with some invalid instruments using a weighted median estimator. Genet Epidemiol. (2016) 40(4):304–14. doi: 10.1002/gepi.21965
42. Milne RL, Kuchenbaecker KB, Michailidou K, Beesley J, Kar S, Lindstrom S, et al. Identification of ten variants associated with risk of estrogen-receptor-negative breast cancer. Nat Genet (2017) 49(12):1767–78. doi: 10.1038/ng.3785
43. Hartwig FP, Davey Smith G, Bowden J. Robust inference in summary data Mendelian randomization via the zero modal pleiotropy assumption. Int J Epidemiol. (2017) 46(6):1985–98. doi: 10.1093/ije/dyx102
44. Greco MF, Minelli C, Sheehan NA, Thompson JR. Detecting pleiotropy in Mendelian randomisation studies with summary data and a continuous outcome. Stat Med (2015) 34(21):2926–40. doi: 10.1002/sim.6522
45. Verbanck M, Chen CY, Neale B, Do R. Detection of widespread horizontal pleiotropy in causal relationships inferred from Mendelian randomization between complex traits and diseases. Nat Genet (2018) 50(5):693–8. doi: 10.1038/s41588-018-0099-7
46. Melve KK, Baerheim A. Signs of subclinical eating disorders in teenage girls. Scand J Prim Health Care (1994) 12(3):197–203. doi: 10.3109/02813439409003699
47. de Castro JM. The time of day of food intake influences overall intake in humans. J Nutr (2004) 134(1):104–11. doi: 10.1093/jn/134.1.104
48. Gill S, Panda S. A smartphone app reveals erratic diurnal eating patterns in humans that can be modulated for health benefits. Cell Metab (2015) 22(5):789–98. doi: 10.1016/j.cmet.2015.09.005
49. Keski-Rahkonen A, Viken RJ, Kaprio J, Rissanen A, Rose RJ. Genetic and environmental factors in breakfast eating patterns. Behav Genet (2004) 34(5):503–14. doi: 10.1023/B:BEGE.0000038488.22974.b1
50. Mekary RA, Giovannucci E, Willett WC, van Dam RM, Hu FB. Eating patterns and type 2 diabetes risk in men: breakfast omission, eating frequency, and snacking. Am J Clin Nutr (2012) 95(5):1182–9. doi: 10.3945/ajcn.111.028209
51. Reutrakul S, Hood MM, Crowley SJ, Morgan MK, Teodori M, Knutson KL. The relationship between breakfast skipping, chronotype, and glycemic control in type 2 diabetes. Chronobiol Int (2014) 31(1):64–71. doi: 10.3109/07420528.2013.821614
52. Uzhova I, Fuster V, Fernandez-Ortiz A, Ordovas JM, Sanz J, Fernandez-Friera L, et al. The importance of breakfast in atherosclerosis disease: insights from the PESA study. J Am Coll Cardiol (2017) 70(15):1833–42. doi: 10.1016/j.jacc.2017.08.027
53. Mansouri M, Hasani-Ranjbar S, Yaghubi H, Rahmani J, Tabrizi YM, Keshtkar A, et al. Breakfast consumption pattern and its association with overweight and obesity among university students: a population-based study. Eat Weight Disord (2020) 25(2):379–87. doi: 10.1007/s40519-018-0609-8
54. Keski-Rahkonen A, Kaprio J, Rissanen A, Virkkunen M, Rose RJ. Breakfast skipping and health-compromising behaviors in adolescents and adults. Eur J Clin Nutr (2003) 57(7):842–53. doi: 10.1038/sj.ejcn.1601618
55. Carels RA, Young KM, Coit C, Clayton AM, Spencer A, Wagner M. Skipping meals and alcohol consumption. The regulation of energy intake and expenditure among weight loss participants. Appetite. (2008) 51(3):538–45. doi: 10.1016/j.appet.2008.04.006
56. Kuroda T, Onoe Y, Yoshikata R, Ohta H. Relationship between skipping breakfast and bone mineral density in young Japanese women. Asia Pac J Clin Nutr (2013) 22(4):583–9. doi: 10.6133/apjcn.2013.22.4.10
57. Alwattar AY, Thyfault JP, Leidy HJ. The effect of breakfast type and frequency of consumption on glycemic response in overweight/obese late adolescent girls. Eur J Clin Nutr (2015) 69(8):885–90. doi: 10.1038/ejcn.2015.12
58. Astbury NM, Taylor MA, Macdonald IA. Breakfast consumption affects appetite, energy intake, and the metabolic and endocrine responses to foods consumed later in the day in male habitual breakfast eaters. J Nutr (2011) 141(7):1381–9. doi: 10.3945/jn.110.128645
59. Jovanovic A, Gerrard J, Taylor R. The second-meal phenomenon in type 2 diabetes. Diabetes Care (2009) 32(7):1199–201. doi: 10.2337/dc08-2196
60. Wei J, Ferron M, Clarke CJ, Hannun YA, Jiang H, Blaner WS, et al. Bone-specific insulin resistance disrupts whole-body glucose homeostasis via decreased osteocalcin activation. J Clin Invest. (2014) 124(4):1–13. doi: 10.1172/JCI72323
61. Witbracht M, Keim NL, Forester S, Widaman A, Laugero K. Female breakfast skippers display a disrupted cortisol rhythm and elevated blood pressure. Physiol Behav (2015) 140:215–21. doi: 10.1016/j.physbeh.2014.12.044
62. Cappuccio FP, Meilahn E, Zmuda JM, Cauley JA. High blood pressure and bone-mineral loss in elderly white women: a prospective study. Study of Osteoporotic Fractures Research Group. Lancet (1999) 354(9183):971–5. doi: 10.1016/S0140-6736(99)01437-3
63. Ahuja KD, Robertson IK, Ball MJ. Acute effects of food on postprandial blood pressure and measures of arterial stiffness in healthy humans. Am J Clin Nutr (2009) 90(2):298–303. doi: 10.3945/ajcn.2009.27771
Keywords: genetics, Mendelian randomization, causal relationship, bone mineral density, breakfast skipping
Citation: Yu J, Zhuang C, Guo W, Zhou X, Chen Y, Wang L, Li W, Zhu Y, Zhuang R and Tian K (2023) Causal relationship between breakfast skipping and bone mineral density: a two-sample Mendelian randomized study. Front. Endocrinol. 14:1200892. doi: 10.3389/fendo.2023.1200892
Received: 05 April 2023; Accepted: 11 October 2023;
Published: 07 November 2023.
Edited by:
Giacomina Brunetti, University of Bari Aldo Moro, ItalyReviewed by:
Sisi Cao, San Diego State University, United StatesCopyright © 2023 Yu, Zhuang, Guo, Zhou, Chen, Wang, Li, Zhu, Zhuang and Tian. This is an open-access article distributed under the terms of the Creative Commons Attribution License (CC BY). The use, distribution or reproduction in other forums is permitted, provided the original author(s) and the copyright owner(s) are credited and that the original publication in this journal is cited, in accordance with accepted academic practice. No use, distribution or reproduction is permitted which does not comply with these terms.
*Correspondence: Kun Tian, bWF4NjEyQDE2My5jb20=; Rujie Zhuang, cnVqaWV6aHVhbmdAMTYzLmNvbQ==
†Present address: Rujie Zhuang, Orthopedic Department, Quzhou Traditional Chinese Medicine (TCM) Hospital at the Junction of Four Provinces Affiliated to Zhejiang Chinese Medical University, Quzhou, China
‡These authors have contributed equally to this work and share first authorship
§These authors have contributed equally to this work and share senior authorship
Disclaimer: All claims expressed in this article are solely those of the authors and do not necessarily represent those of their affiliated organizations, or those of the publisher, the editors and the reviewers. Any product that may be evaluated in this article or claim that may be made by its manufacturer is not guaranteed or endorsed by the publisher.
Research integrity at Frontiers
Learn more about the work of our research integrity team to safeguard the quality of each article we publish.