 Xiaojie He1†
 Ting Sun
- 1Department of Health Management Center, The Second Affiliated Hospital, Zhejiang University School of Medicine, Hangzhou, Zhejiang, China
- 2School & Hospital of Stomatology, Wuhan University, Wuhan, China
Introduction: Nonalcoholic fatty liver disease (NAFLD) is a common metabolic disorder associated with insulin resistance (IR). Triglyceride glucose waist circumference (TyG-WC) is a novel index of IR that reflects both visceral fat and hepatic steatosis. However, it is not known whether TyG-WC and NAFLD exhibit a nonlinear relationship in Japanese subjects with normal plasma glucose level. Thus, we examined the relationship between TyG-WC and NAFLD, in addition to determining the threshold level of TyG-WC associated with NAFLD.
Methods: A secondary analysis was performed based on a previous study that extracted medical examination records from Murakami Memorial Hospital between 2004 and 2015 in order to detect chronic diseases and their risk factors. TyG-WC was determined at baseline. NAFLD is the dependent variable. Univariate and multivariate logistic regression models were used to evaluate the risk of NAFLD incidence. Based on the smoothing plot, a two-piecewise linear regression model was used to examine the threshold effect of TyG-WC on NAFLD. A subgroup analysis was carried out in order to study other factors that may influence the association between TyG-WC and NAFLD.
Results: 14,280 met the criteria for inclusion in the current secondary analysis. The adjusted OR (95% CI) for NAFLD in all subjects was 1.007 (95% CI 1.006–1.009, P < 0.001). The relationship between TyG-WC and NAFLD in Japanese subjects with normal plasma glucose level is nonlinear. TyG-WC is positively associated with NAFLD when TyG-WC is ranged between 480 and 800. In subgroup analyses, there was a significant interaction between BMI and TyG-WC associated NAFLD risk (P for interaction <0.001).
Discussion: The relationship between TyG-WC and NAFLD is nonlinear. TyG-WC is positively associated with NAFLD when TyG-WC is ranged between 480 and 800. There is potential clinical significance for the TyG-WC in identifying groups at high risk for NAFLD in subjects with normal plasma glucose level.
1 Introduction
NAFLD is characterized by a variety of histopathologic findings, ranging from steatosis to steatohepatitis, fibrosis, and cirrhosis (1). A number of factors contribute to NAFLD, including metabolic syndrome, obesity, insulin resistance, and hyperlipidaemia (2, 3). Along with the global obesity-related metabolic syndrome epidemic, NAFLD prevalence is increasing (4). Approximately 25% of the population worldwide suffers from NAFLD, ranging from 13% in Africa to 42% in southeast Asia (5, 6). Metabolic dysfunction-associated liver disease (MAFLD) is characterized by metabolic dysregulation and overlaps with other liver diseases, according to an expert panel recently (7). There has, however, been a lack of widespread adoption of the new definition. In order to predict and diagnose NAFLD early, accurate non-invasive methods must be investigated, as it is normally asymptomatic until the advanced stages (8, 9).
Regardless of whether metabolic syndrome is present or absent, there is evidence that IR contributes significantly to the development of NAFLD (10, 11). The triglyceride and glucose index (TyG) has been proposed as an effective alternative to IR. This combines fasting plasma glucose (FPG) with fasting triglyceride (TG) (12). TyG levels have been associated with NAFLD incidence in many studies (13). The combination of TyG-related parameters and obesity indices may be more reliable for identifying patients than TyG alone, according to emerging research (14–17). Evidence indicates TyG-waist circumference (TyG-WC) is a superior predictor of insulin resistance than TyG alone (14, 18, 19). TyG-WC has been shown to be related to NAFLD among Iranians in a cross-sectional study (20).
In Japanese people, however, it is not known whether TyG-WC is associated with NAFLD. Further, it is not clear whether TyG-WC and NAFLD exhibit a nonlinear relationship. In this study, we examined the relationship between TyG-WC and NAFLD in Japanese subjects with normal plasma glucose level, in addition to determining the threshold level of TyG-WC associated with NAFLD.
2 Materials and methods
2.1 Data source
A public database called Datadryad.org, where investigators can reanalyse data from previous studies, was used for this study. The research cites Okamura et al.’s data packets (21). A second analysis was performed based on previous research that aims to detect chronic diseases and their risk factors. Previous study extracted cases from Murakami Memorial Hospital’s medical examination program between 2004 and 2015, then, a follow-up study was carried out on incident type 2 diabetes and fatty liver.
This study adopted a cross-sectional design and its exclusion criteria are as follows: 1) viral hepatitis (determined by hepatitis B antigen and hepatitis C antibody measurements)(N=416); 2) drinking excessively: males 210 grams per week or females 140 grams per week (N=1923) (22); 3) data with incomplete covariables (N = 873); 4) T2DM or fasting plasma glucose over 6.1 mmol/L at baseline-examination (N = 1131); 5) any medication usage (N = 2,321). Informed consent was not required because the data had been de-identified. Murakami Memorial Hospital’s ethics committee approved the previous study (21). As a result, there was no need for an additional ethical approval for this study. It followed the Declaration of Helsinki.
2.2 Collection of data
As mentioned previously, a self-administered questionnaire was adopted to collect clinical baseline information (21). A comprehensive list of demographic information, anthropometric and clinical measurements or lifestyle characteristics, including sex, age, height, weight, WC, systolic blood pressure (SBP), diastolic blood pressure (DBP), drinking habit, and smoking habit. Exercise habit is defined as exercising more than once a week; Smoking status was divided into nonsmokers, former smokers, and current smokers based on smoking history. Drinking status was classified into three groups based on alcohol consumption: minimal or no consumption, 40 grams or less per week; light, 40-140 grams per week; moderate, 140-210 grams per week. Haematological indicators were tested after fasting, including haemoglobin A1c (HBA1c), total cholesterol (TC), triglyceride (TG), FPG, gamma-glutamyl transferase (GGT), aspartate aminotransferase (AST), alanine aminotransferase (ALT), and high-density lipoprotein cholesterol (HDL-C). According to previous studies (14, 23), TyG = Ln [TG (mg/dL) × FPG (mg/dL)/2], TyG-WC = TyG × WC (cm).
2.3 NAFLD diagnosis by abdominal ultrasound
A trained technician performed abdominal ultrasonography to diagnose fatty liver. Without consulting any other information about the participants, the gastroenterologist diagnosed fatty liver based on the images. Among the four known criteria (vascular blurring, hepatorenal echo contrast, deep attenuation and liver brightness), participants with hepatorenal echo contrast and liver brightness were diagnosed with fatty liver (24).
2.4 Statistical analysis
For all statistical analyses, EmpowerStats (www.empowerstats.com , X&Y Solutions, Inc., Boston, MA) and R (http://www.R-project.org, The R Foundation) platforms were used. Categorical variables were expressed as the frequency (percentage).
Normal distribution continuous variables were expressed as mean ± standard deviation (SD), and unnormal distribution continuous variables as median (quartile 1-quartile 3). By using Kruskal Wallis H (variables with non-normal distribution) or one-way ANOVA (variables with normal distribution) or chi-squared(categorical) tests, differences among TyG-WC groups were evaluated. A two-tailed P value of 0.05 was used to determine statistical significance. NAFLD risk factors were determined using multivariate and univariate logistic regression models. We also explored the relationship between TyG-WC and NAFLD according to gender. Initially, all variables were analysed using univariate analysis.
Afterwards, variables with clinical significance and variables with statistical significance in univariate analysis (P < 0.05) were included in the multivariate analyses. In order to evaluate the collinearity of all explanatory variables, a correlation matrix was used. Variance inflation factor (VIF) based multiple regression model was used to assess collinearity (25). The Additional File Table S1 illustrates the presence of collinearity when the VIF is greater than 5. Four different models were built: Model 1, without covariate adjustment; Model 2, adjusted for age, smoking status, habit of exercise, SBP; Model 3, adjusted for Model 2+HbA1C, FPG, TG, TC, HDL, GGT, ALT, AST, and Model 4, adjusted for Model 3+BMI. We selected these confounders on the basis of their associations with the NAFLD or a change in effect estimate of more than 10% (26).
The data analysis results were verified by converting TyG-WC according to triquantiles and examining the possibility of nonlinearity, and calculation of the P value for the trend was carried out. The threshold effect of TyG-WC on NAFLD was examined using a two-piecewise linear regression model based on the smoothing plot. In order to determine the threshold level of TyG-WC at which the association between TyG-WC and NAFLD changed and became noticeable, a recurrence method was employed. Detecting the maximum model likelihood was based on moving the inflection point along a predefined interval. Logistic regression model was used for subgroup analysis. To test the subgroup effect modification, interaction terms were used between subgroup indicators, followed by likelihood ratio tests.
3 Results
3.1 Subjects description
In the previous study, 20,944 subjects were recruited. Only 14,280 met the criteria for inclusion in the current secondary analysis (Figure 1). The average age of the subjects was 44 ± 9 years, and 54.51% were men. Subject baseline characteristics are listed in Table 1. TyG-WC group (T3) individuals were usually older and had higher BMI, WC, SBP, DBP, ALT, AST, GGT, TG, TC, HbA1C, TyG values than TyG-WC group (T1). Comparatively, HDL-C values for T3 groups were lower than those for T1 groups. Additionally, the prevalence of NAFLD gradually increases as the value of TyG-WC increases (T1: 0.626% vs. T2: 9.226% vs. T3: 44.864%).
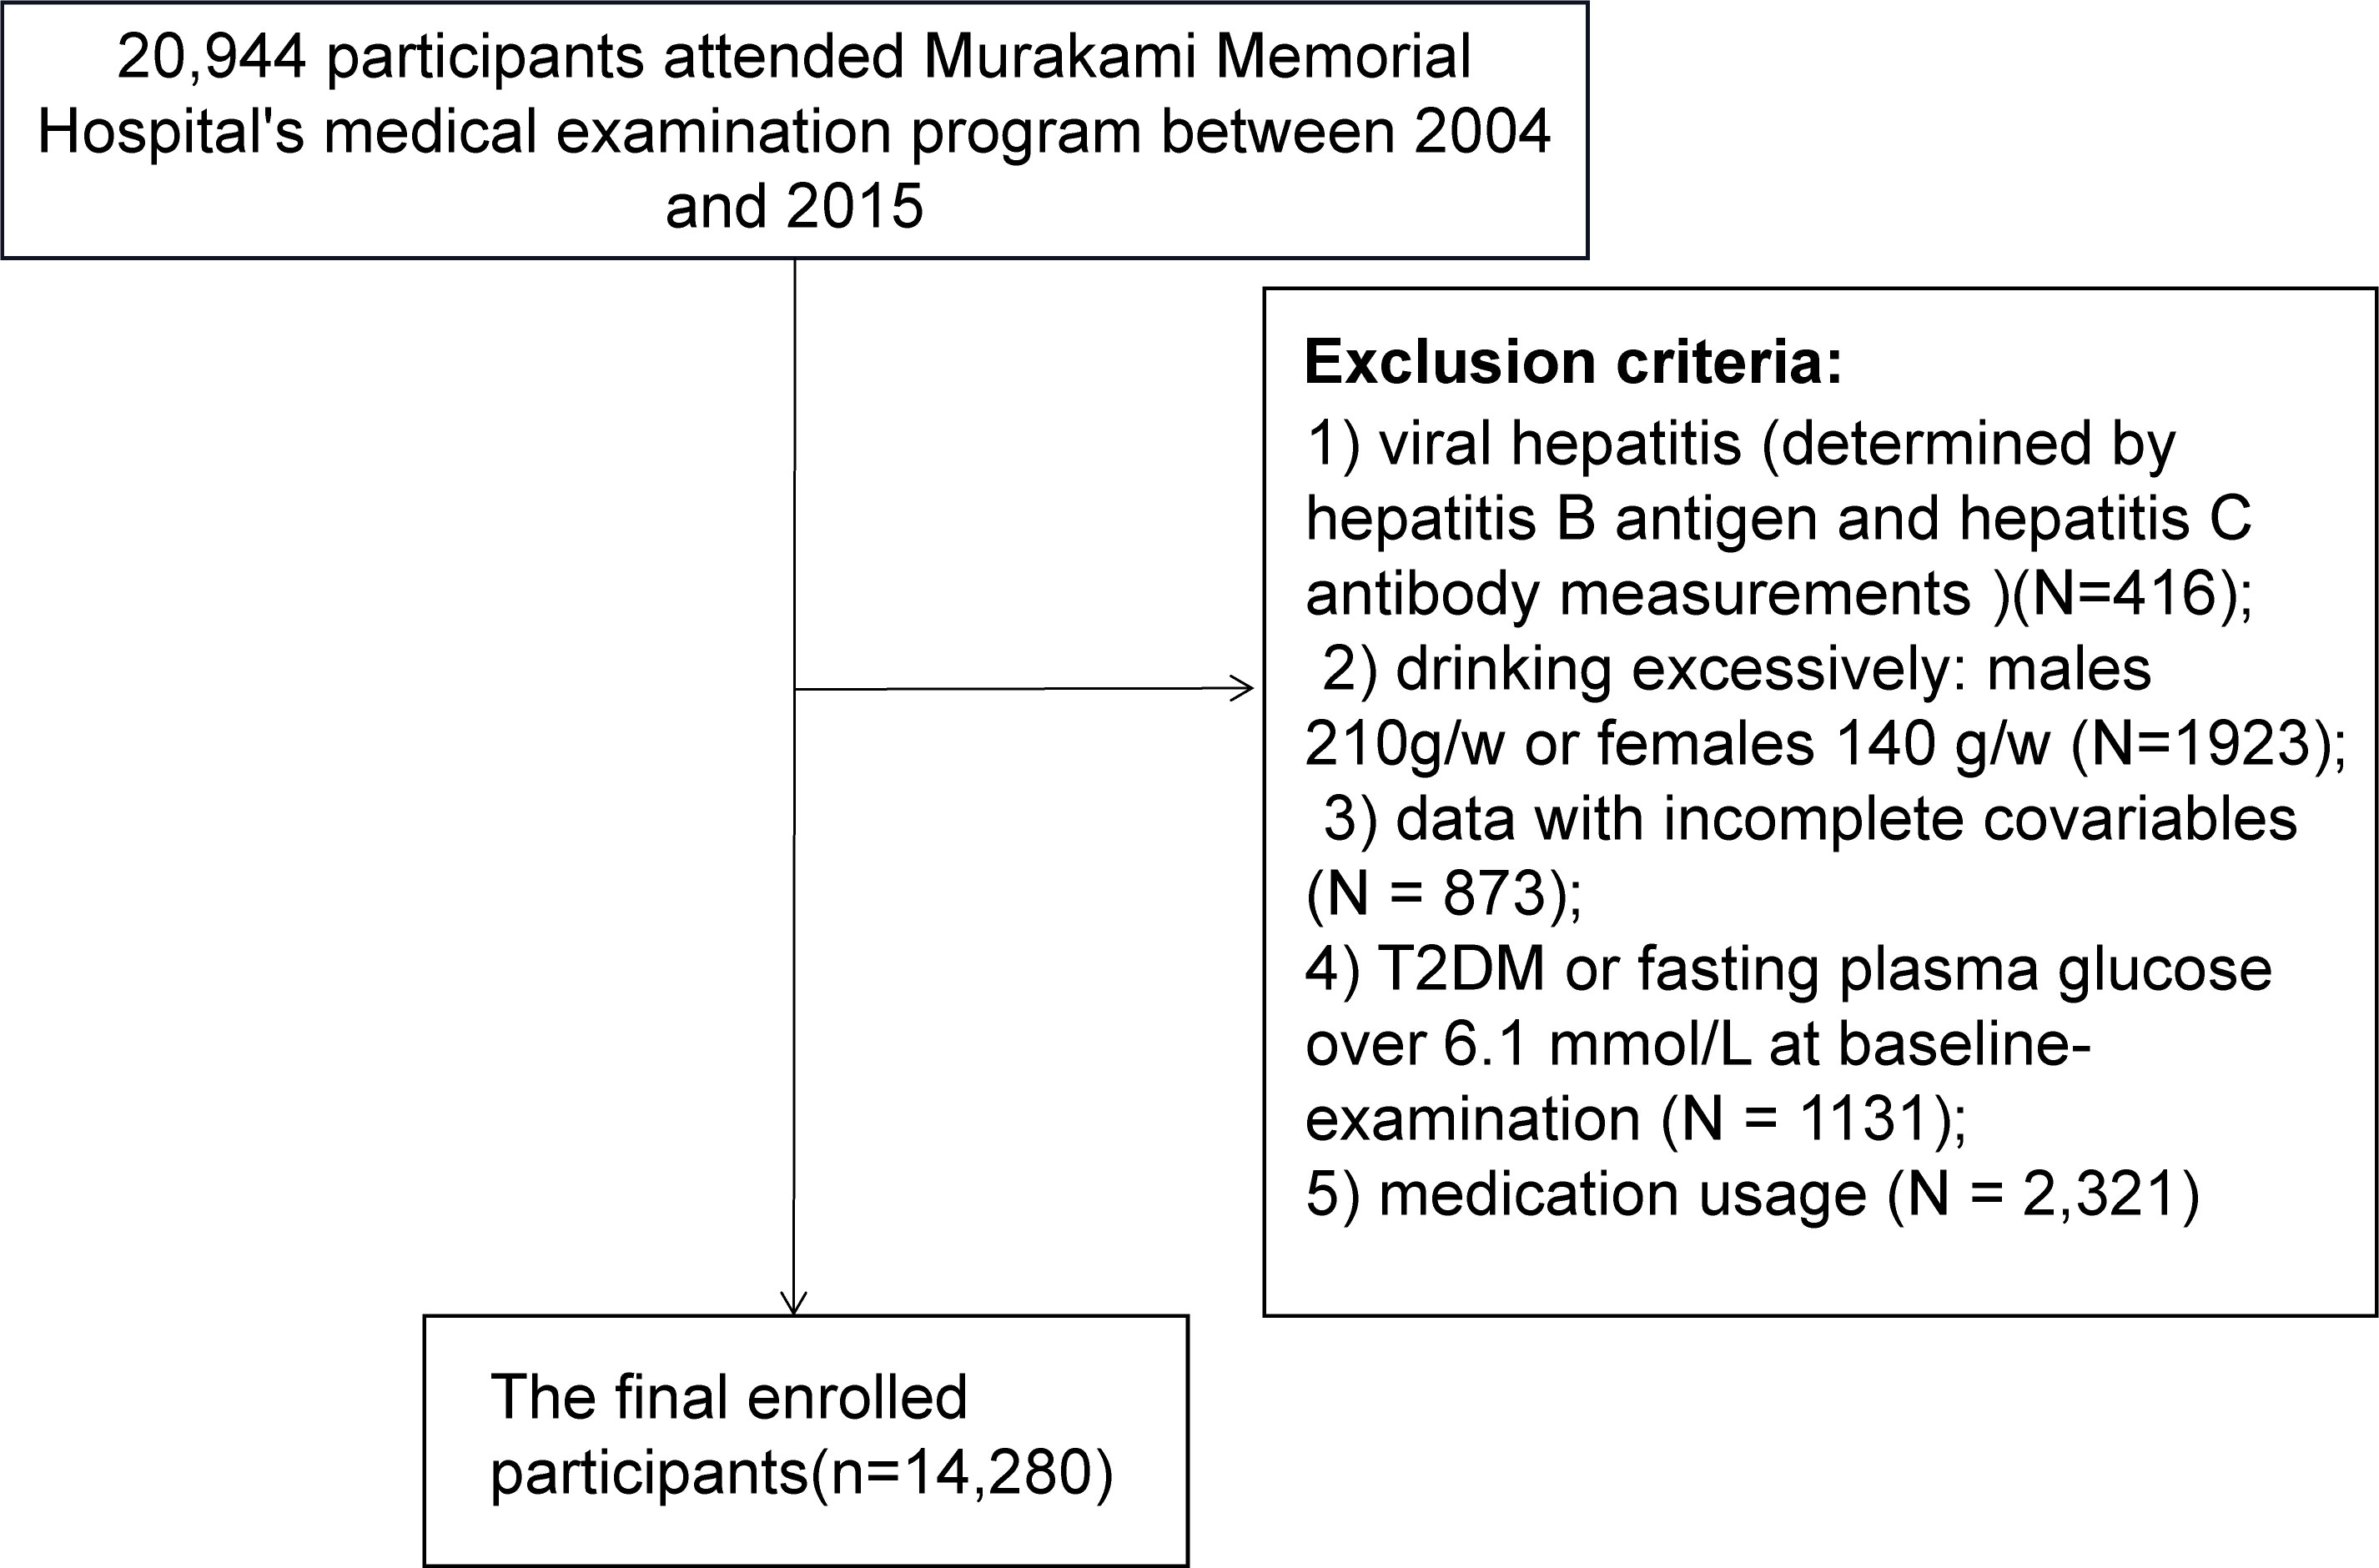
Figure 1 Flow chart.
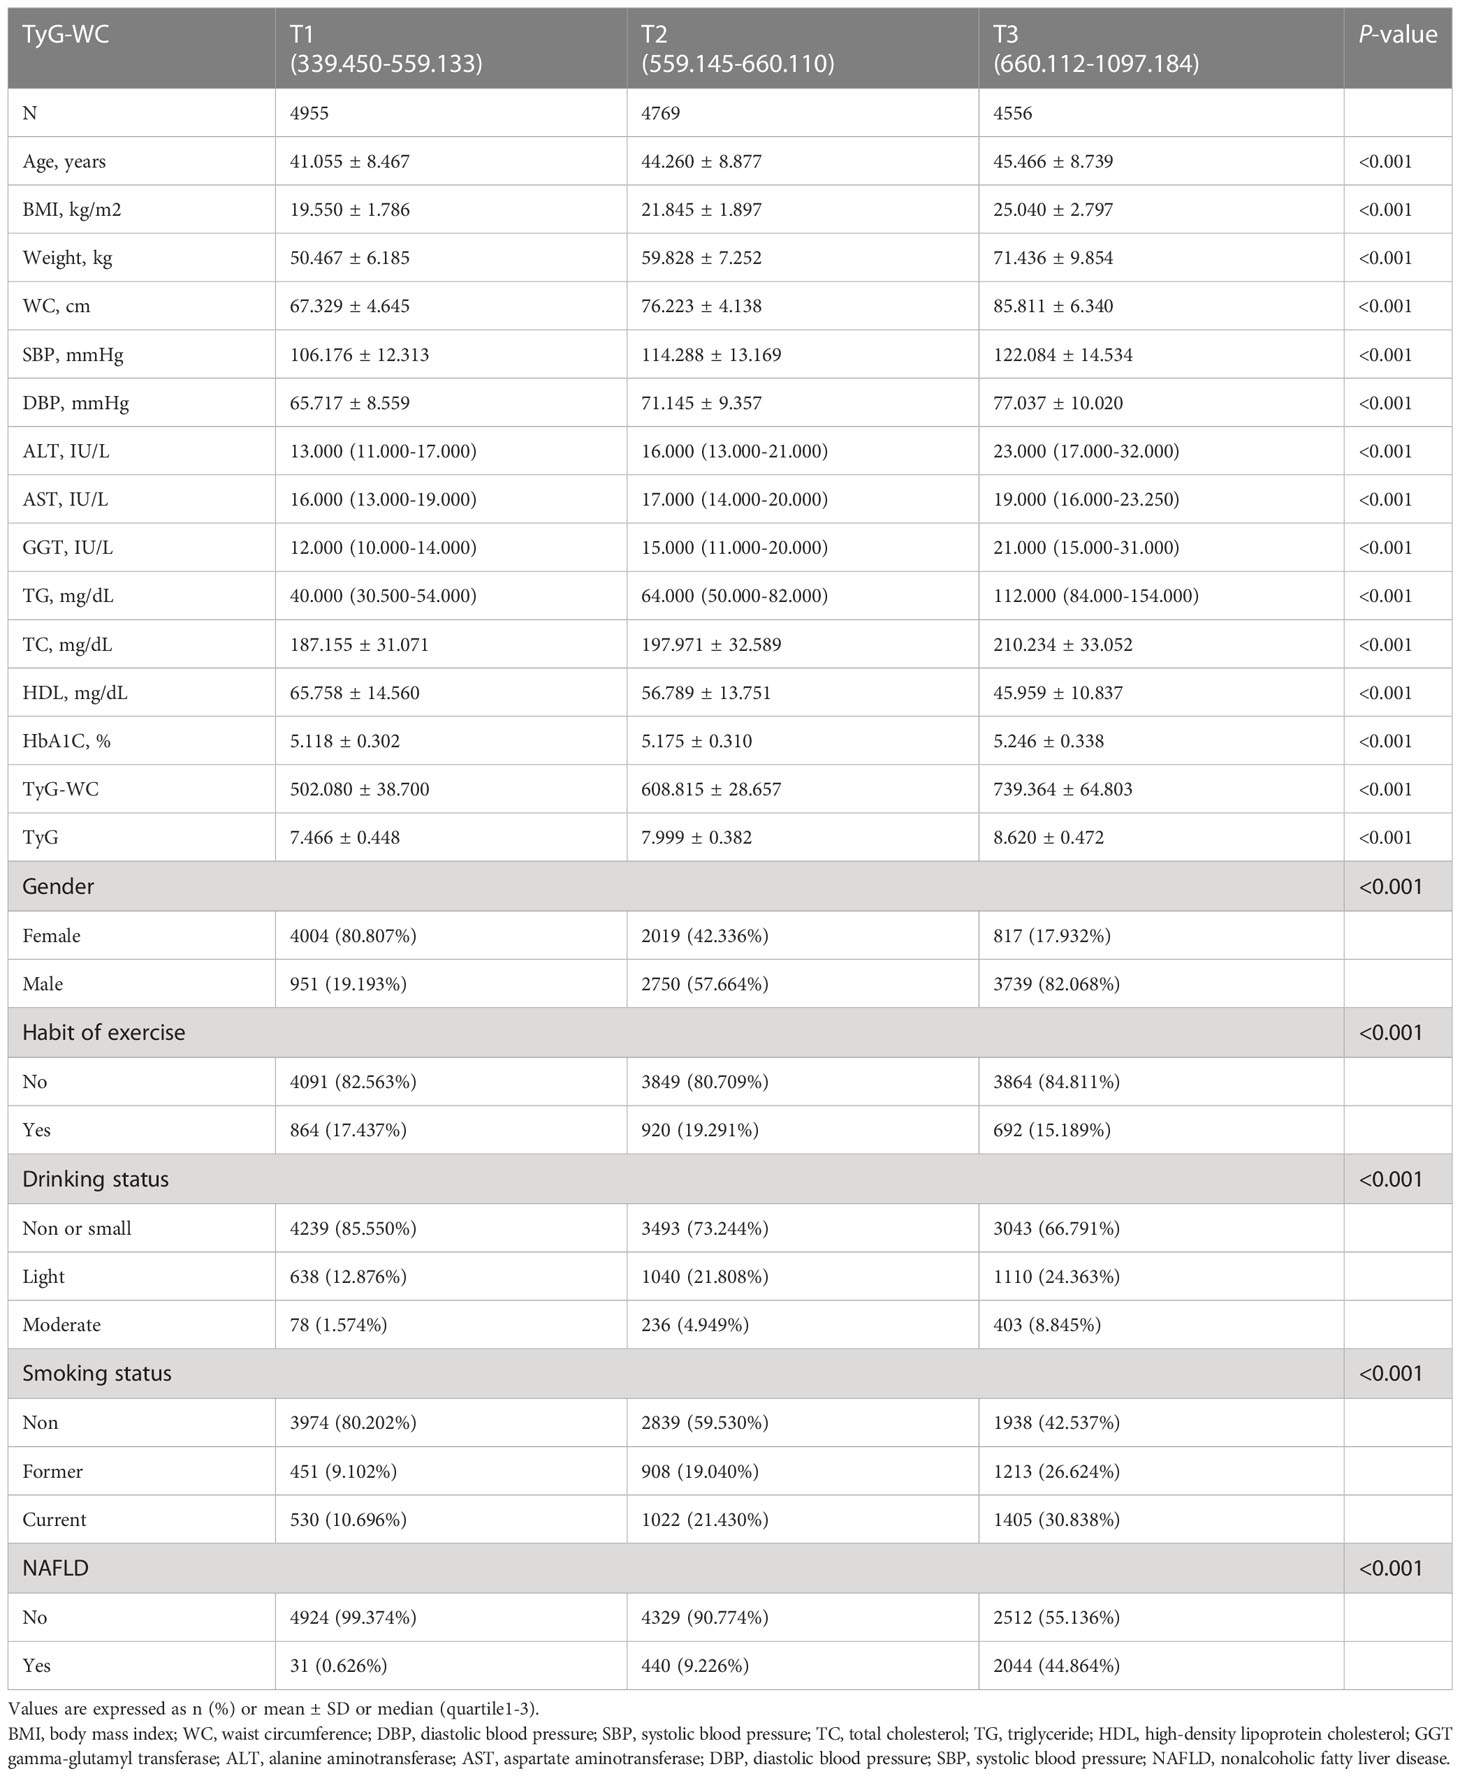
Table 1 Characteristics of the participants by triquartile grouping of TyG-WC.
3.2 Association between TyG-WC and NAFLD
Male, age, BMI, weight, WC, SBP, DBP, ALT, AST, GGT, TC, TG, HbA1C, TyG, were found to be risk factors for NAFLD in the univariate analysis (Table 2). A comparison of the effect sizes of TyG-WC on NAFLD in among male, female and all participants is shown in Table 3. The Model 1 shows TyG-WC to be positively associated with NAFLD in total participants. According to Model 2, NAFLD risk increased by 1.7% for every unit increase in TyG-WC (OR = 1.017, 95% CI 1.016-1.017, P<0.001) in total participants after accounting for age, habit of exercise, smoking status, and SBP. In Model 3, after adjusting for Model 2+ALT, AST, GGT, HDL, TC, TG, FPG, HbA1C, for each unit increase in TyG-WC, the risk of NAFLD increased 1.4% (OR = 1.014, 95% CI 1.013-1.015, P < 0.001) in total participants. The fully adjusted OR (95% CI) for NAFLD in total participants was 1.007 (95% CI 1.006–1.009, P < 0.001) for every 1-unit increase in TyG-WC.
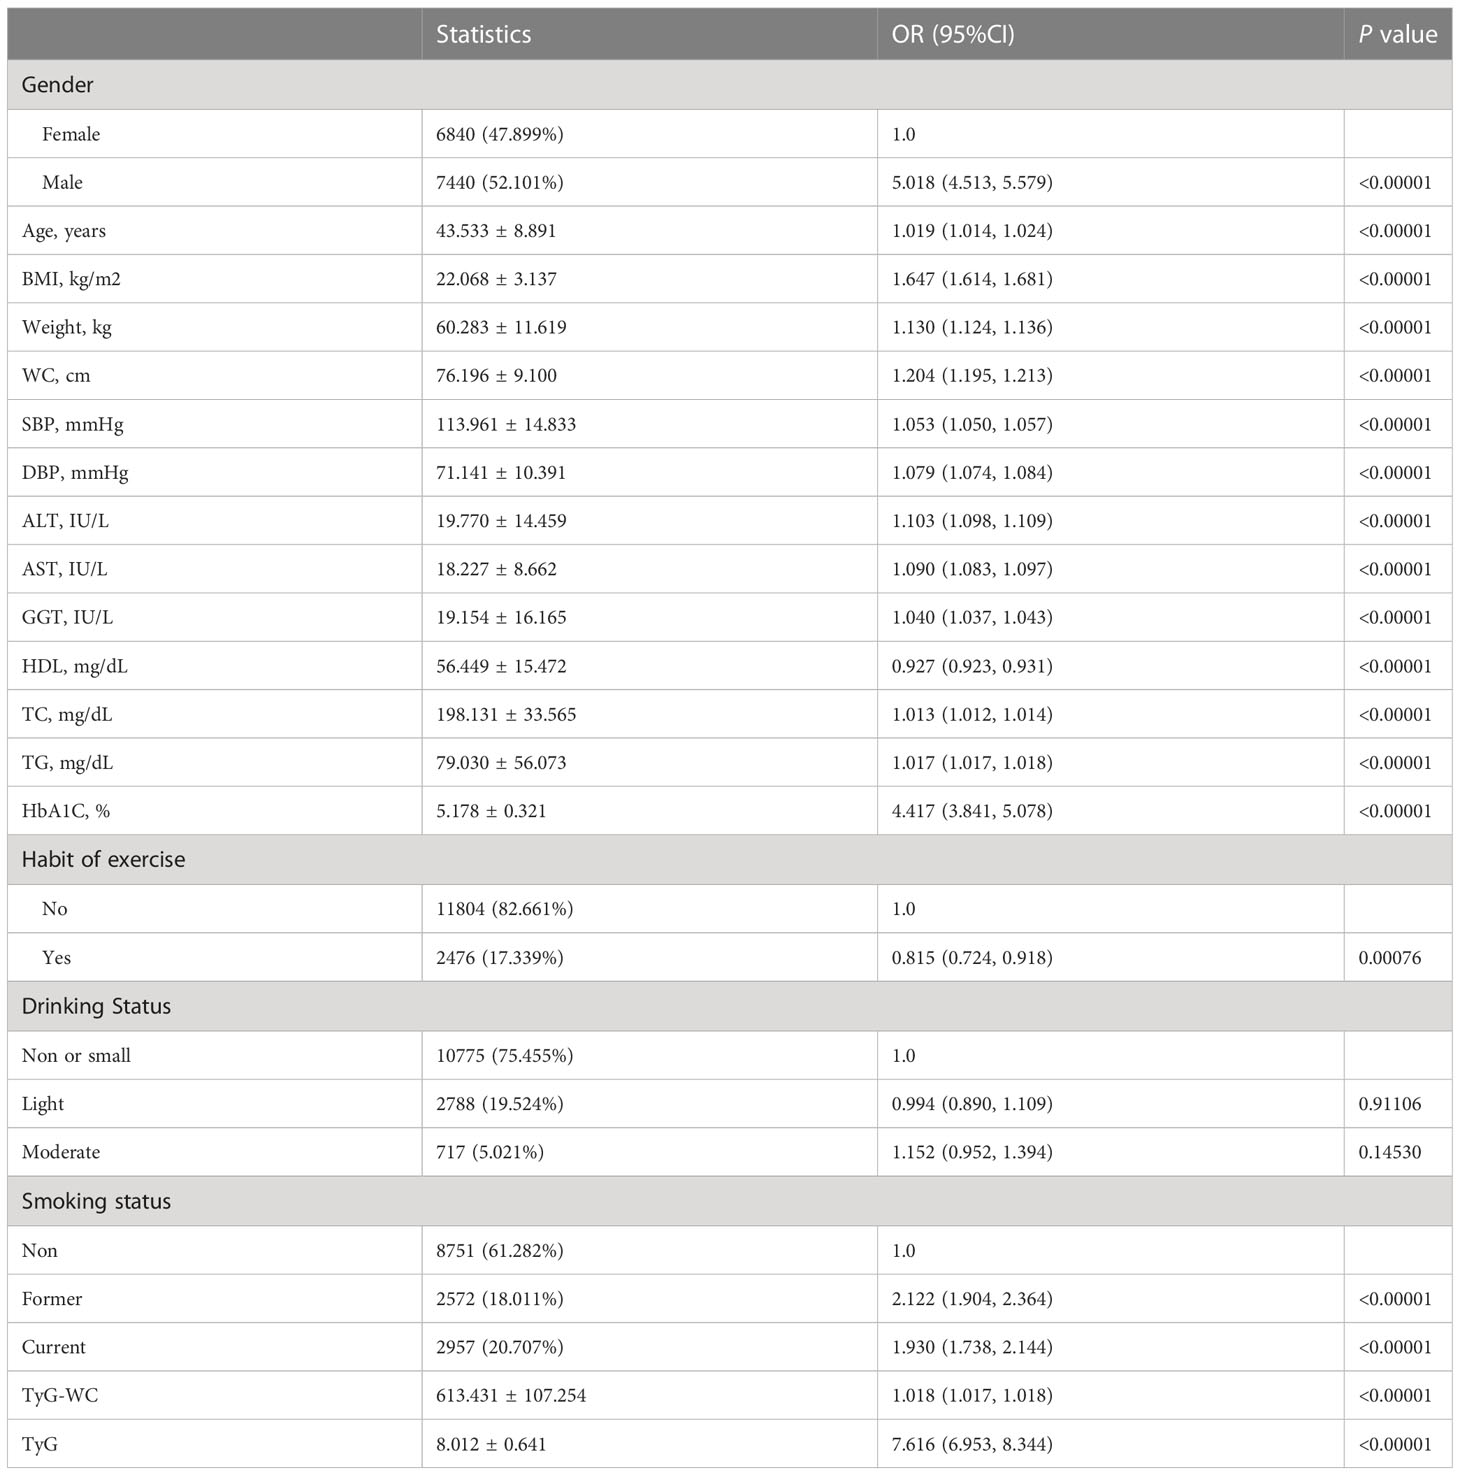
Table 2 Univariate logistics regression model showing variables associated with NAFLD.
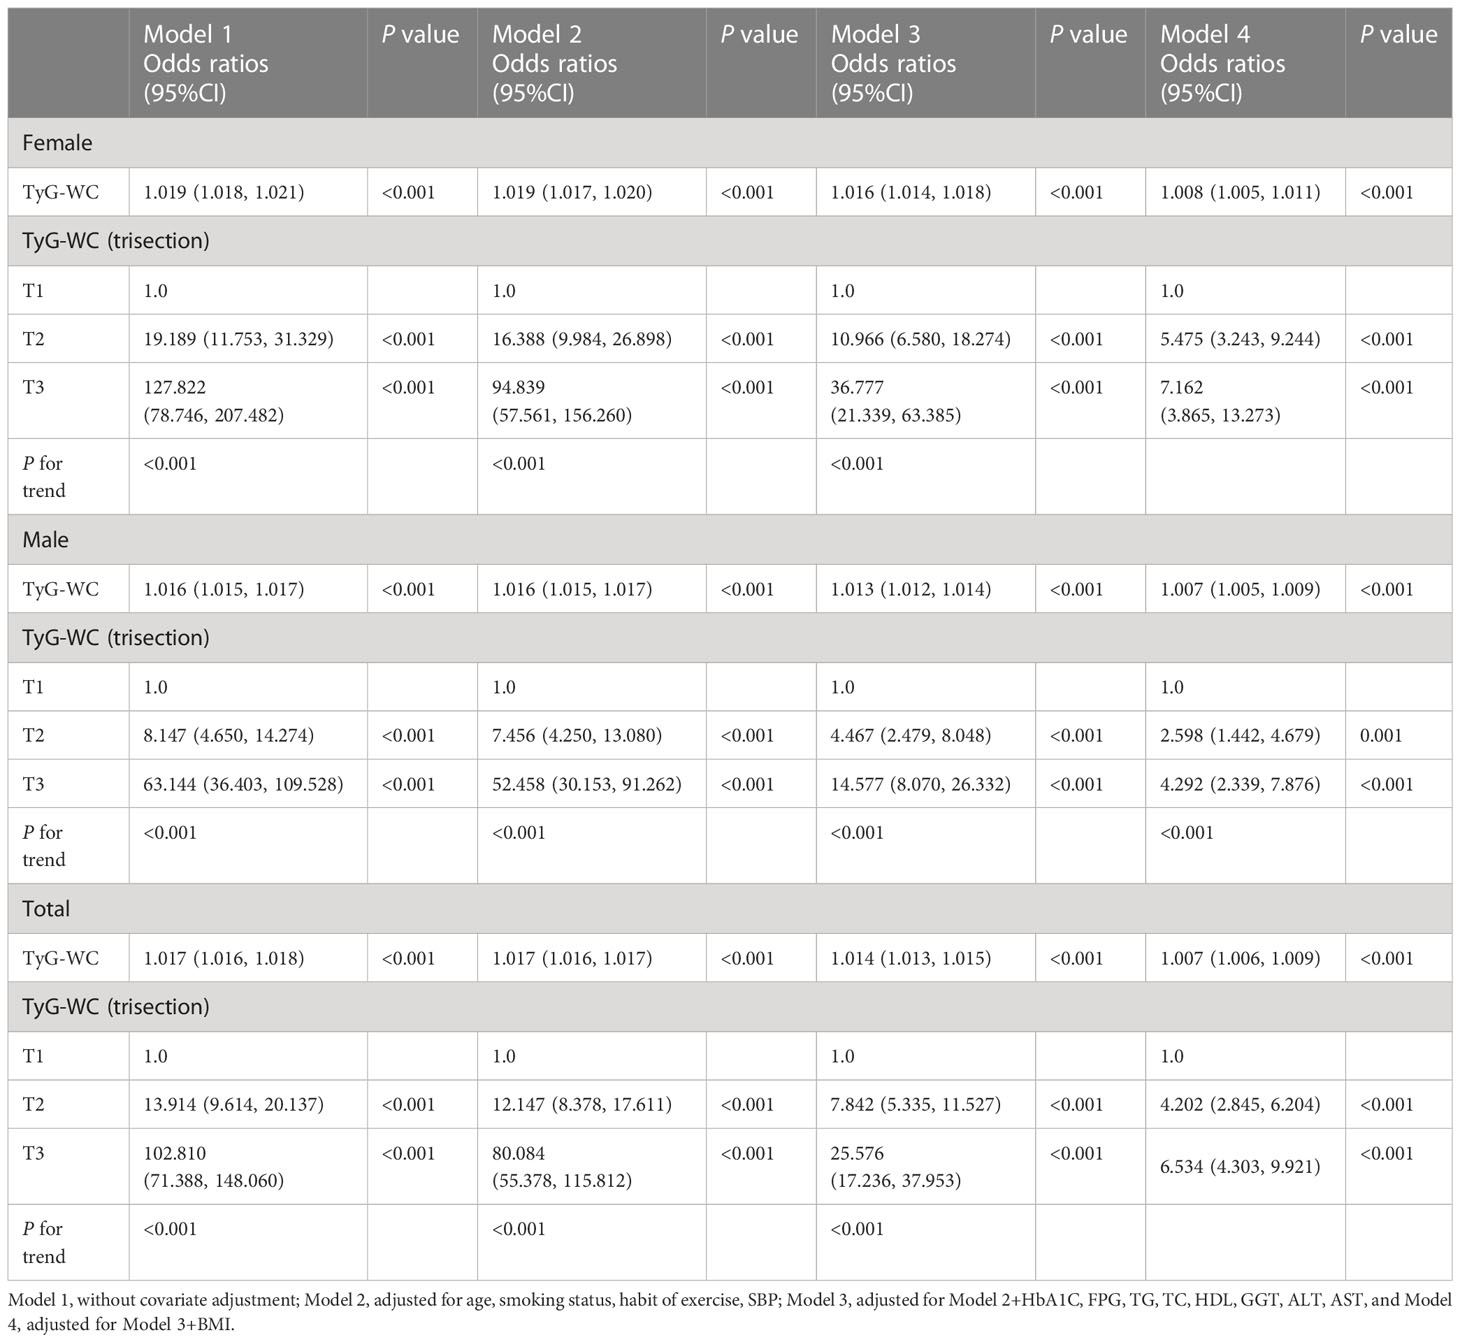
Table 3 Relationship between TyG-WC and NAFLD risk in different models.
Female and male had fully adjusted ORs (95% CI) of 1.008 (1.005, 1.011) and 1.007 (1.005, 1.009), respectively. We also conducted the sensitivity analysis using TyG-WC as a categorical variable (triquantile), and the same trend was observed (P for trend was P < 0.001).
3.3 Results of two-piecewise linear regression model
TyG-WC ranging between 480 and 800 showed a significant association between TyG-WC and NAFLD (OR1.009, 95% CI:1.007, 1.010, P< 0.001). The risk of NAFLD increased 9% for each additional unit of TyG-WC (Table 4; Figure 2).
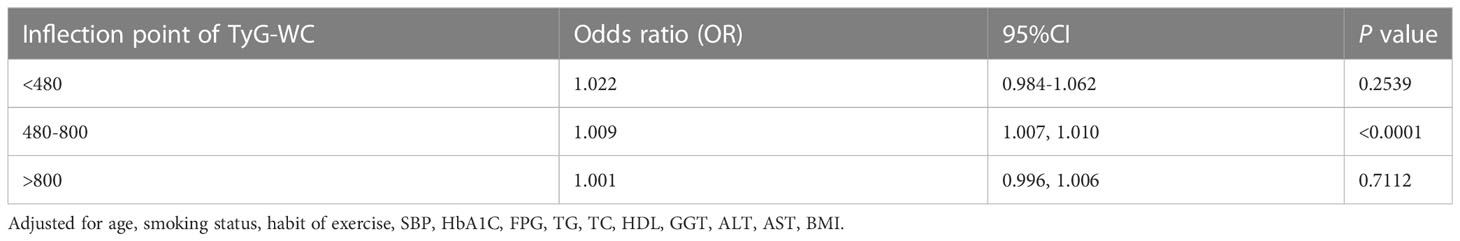
Table 4 The results of the two-piecewise linear regression model.
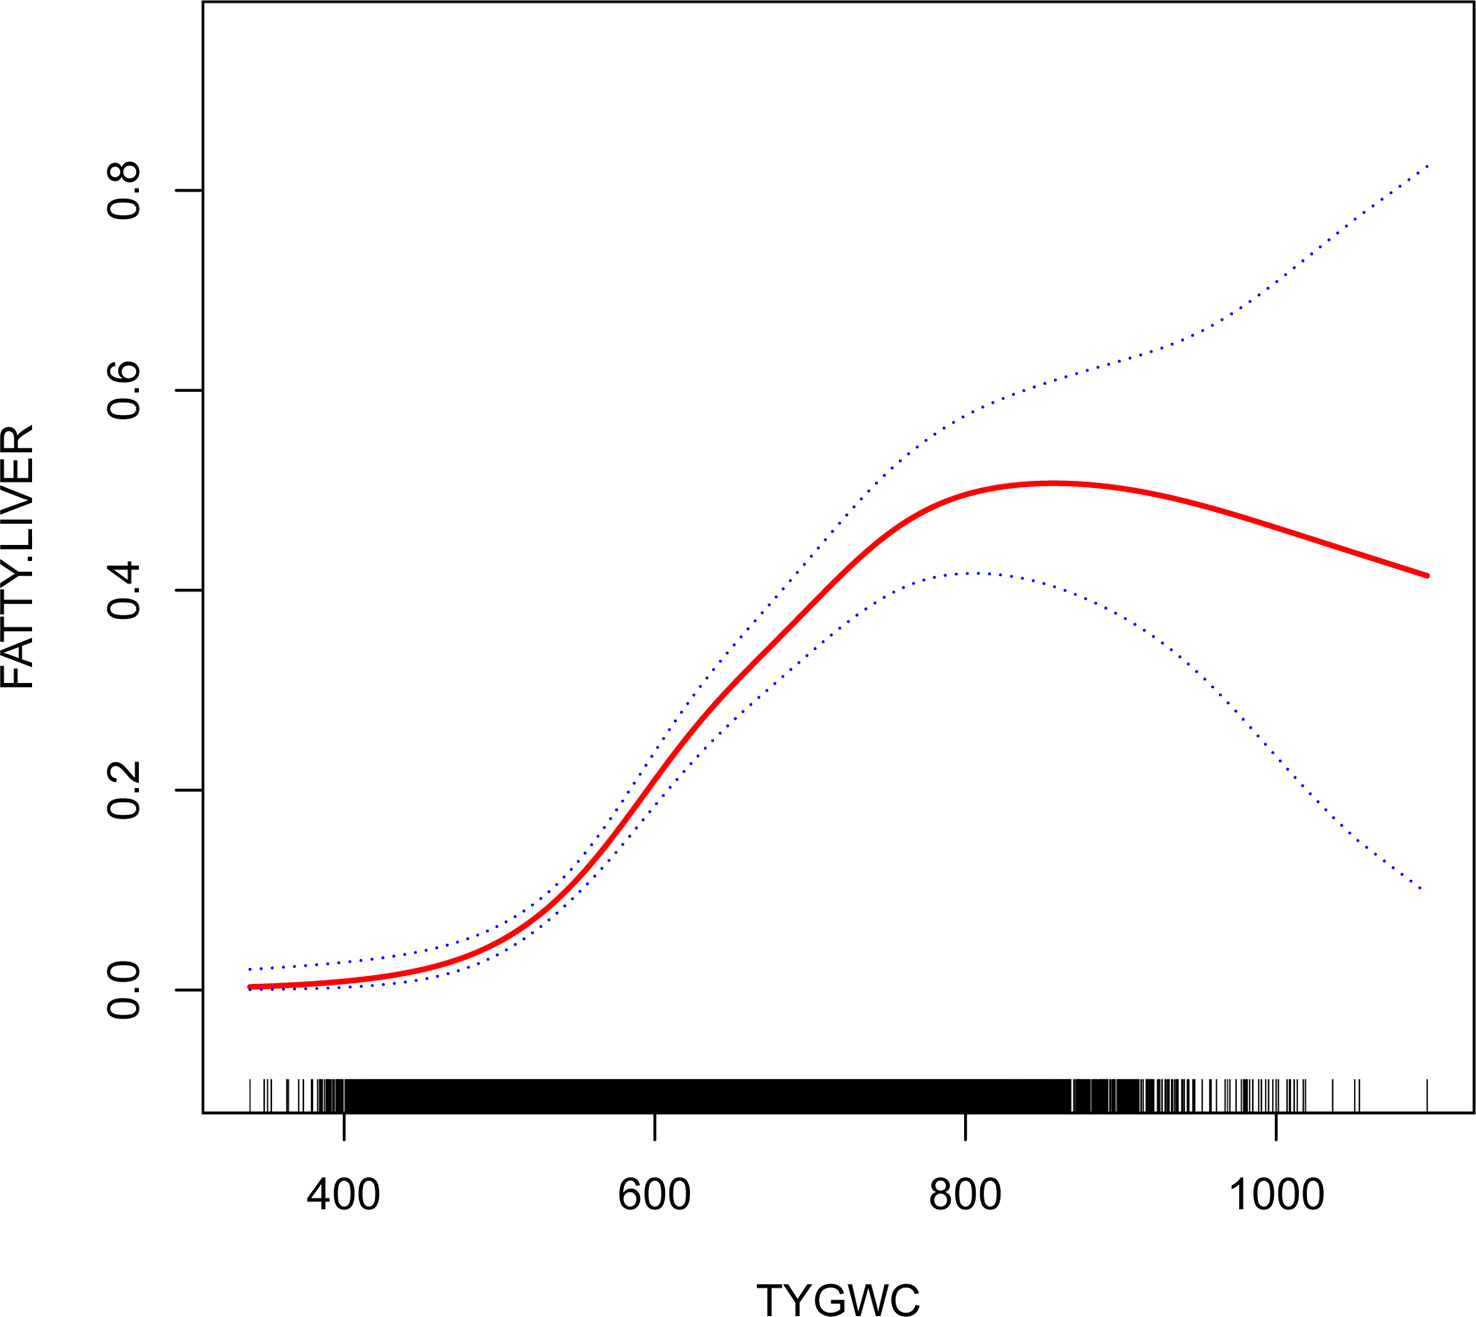
Figure 2 The relationship between triglyceride glucose waist circumference and nonalcoholic fatty liver disease. The graph shows the relationship between TyG-WC and NAFLD. The 95%CI is represented by the area between two dotted lines. When the TyG-WC value is ≤480 or ≥800, there is no correlation with NAFLD. However, when the TyG-WC value is between 480 and 800, there is a significant correlation with NAFLD. As the TyG-WC value increases, so does the risk of NAFLD.
3.4 Subgroup analysis
In subgroup analyses, there was a significant interaction between BMI and TyG-WC associated NAFLD risk (Table 5) (P for interaction< 0.001), while the interaction between age, gender, smoking status, drinking status, habit of exercise and TyG-WC was not significant. The results of BMI stratification showed that non-obese people had a higher risk of NAFLD than overweight and obese people.
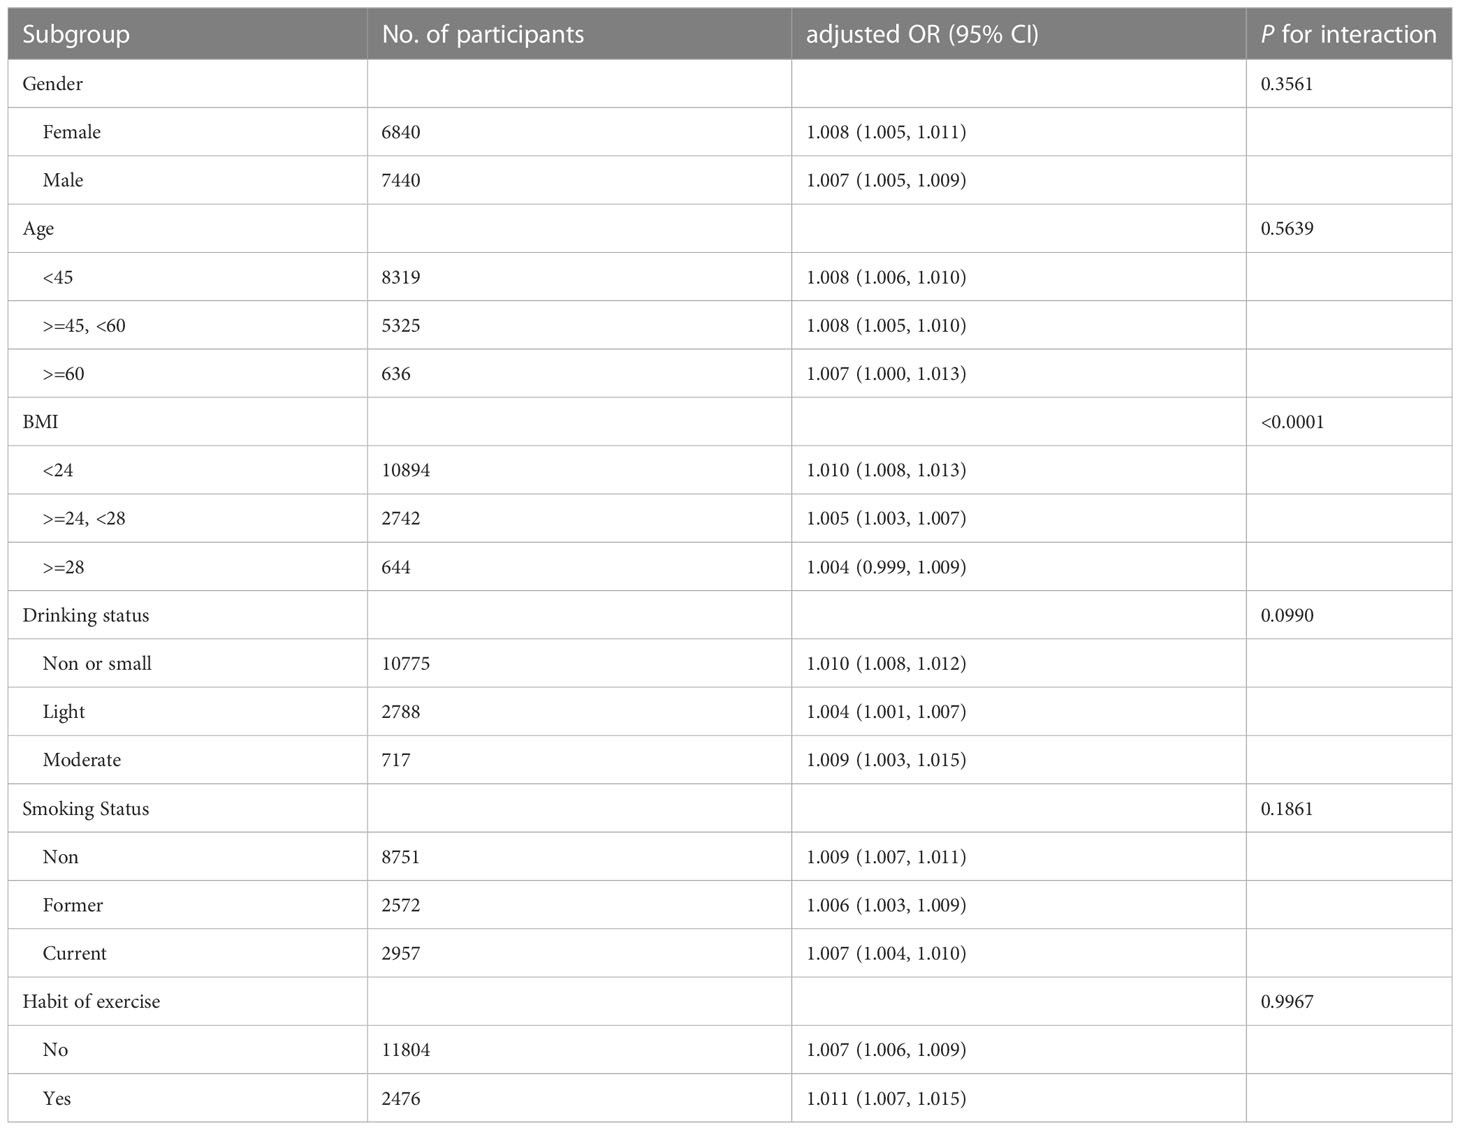
Table 5 Subgroup analysis of the association between TyG-WC on NAFLD risk.
4 Discussion
The present study assessed the relationship between TyG-WC and NAFLD among Japanese subjects with normal plasma glucose level. Despite adjusting for other covariates, TyG-WC remained associated with NAFLD in the Japanese population (OR = 1.007, 95% CI 1.006, 1.009). Furthermore, we revealed a threshold effect of TyG-WC and NAFLD, that both low and high levels of TyG-WC had no significant association with NAFLD, but in the range of 480 to 800, TyG-WC was strongly associated with NAFLD. In addition, TyG-WC and BMI interacted to affect NAFLD in subgroup analysis (P value for interaction <0.001).
In spite of the complexity of NAFLD’s mechanism, IR plays a crucial role in its progression. The identification of IR, however, is not straightforward. In the current state of IR detection, the gold standard is still the HEC test (27). Due to its complexity and time-consuming nature, HEC is limited in clinical applications. In consequence, the homeostasis model assessment of IR (HOMA-IR) has become a globally recognized alternative indicator of IR. Studies have found an independent relationship between HOMA-IR and NAFLD (28). It is, however, difficult in many laboratories to detect insulin concentrations, which is needed for HOMA-IR to be calculated. As a result, new indicators are needed to identify IR and NAFLD.
There is a growing body of research confirming that TyG can be used for IR assessment, and it has the advantage that it requires just two simple haematological indices (FPG and TG) to calculate. TyG can be used to identify IR through its association with HOMA-IR and HEC (29). It was concluded by Lim et al. that TyG had superior prediction ability over insulin resistance when it came to NAFLD (30). More and more evidence show that obesity is closely related to insulin resistance, and because TyG is universally accepted as a promising surrogate marker of IR, the combination of obesity and TyG may be more powerful than other surrogate markers in identifying IR (14). It has been claimed by Cho et al. that the TyG-WC is an indicator of coronary artery disease that can be used to predict the progression of coronary atherosclerosis better than other indices (31). Khamseh et al. performed a cross sectional study to analyse the association between TyG-WC and NAFLD in individuals with overweight/obesity (20). They concluded that TyG-WC was significant associated with NAFLD in individuals with overweight/obesity. The current study results are similar to theirs. Nevertheless, their study limited its participants to obese and overweight people. Furthermore, the non-linear relationship between TyG-WC and NAFLD was not considered. It was clearly observed in the current study that TyG-WC and NAFLD are not linearly related. NAFLD and TyG-WC ranging between 480 and 800 showed a statistically significant association. The magnitude of the TyG-WC was not associated with NAFLD when it was ≤ 480 or ≥ 800.
Interestingly, our current study found that people with lower BMI had a higher OR value.(BMI <24kg/m^2,OR:1.010, 95%CI:1.008, 1.013)than those with higher BMI(24kg/m^2≤BMI<28kg/m^2,OR:1.005,95%CI:1.003,1.007;BMI≥28,OR:1.004,95%CI:0.999, 1.009). Some studies suggest that the relationship between TyG index and NAFLD risk is significantly stronger in non-obese subjects than in obese subjects (13, 32). It is unclear how BMI influences TyG-WC and NAFLD, but it may be related to relatively lean people’s significantly reduced skeletal muscle mass. Relevant studies have shown that when body mass index decreased, skeletal muscle weight, skeletal muscle index and limb fat decreased significantly, and low muscle mass was positively correlated with NAFLD (33, 34). Further research is needed on the specific mechanism.
4.1 Strengths and limitation
The following are some of the strengths of this study (1): A strict adjustment was made for confounding factors in this study (2). Sensitivity analysis was conducted, the continuous independent variables were converted to categorical variables for analysis to improve the reliability of the results (3). It was investigated whether TyG-WC and NAFLD have a nonlinear relationship (4). Different populations were considered when calculating effect sizes.
In spite of this, there are a few limitations to consider (1): The diagnosis of NAFLD in this study was made by ultrasonography rather than liver biopsy. A further limitation of ultrasonography is its inability to distinguish between steatohepatitis and steatosis. Nevertheless, ultrasound examinations have been widely applied in epidemiological studies to diagnose NAFLD (35) (2). Raw data did not include HOMA-IR and waist-to-hip ratio that were associated with NAFLD and IR (3). In this study, nutritional habits and energy intake were not recorded, but covariates associated with dietary habits, such as TG and HDL-C were adjusted (4). The conclusion cannot be generalized to other races since only Japanese subjects were included in the study.
In short, TyG-WC value between 480 and 800 was positively correlated with NAFLD. The magnitude of the TyG-WC was not associated with NAFLD when it was ≤ 480 or ≥ 800. In addition, the effect size was higher in people with lower BMI(BMI <24 kg/m^2) than those with higher BMI (BMI≥24 kg/m^2). Therefore, when TyG-WC≥480 is worthy of attention, especially when TyG-WC is in the range of 480-800, TyG-WC has a strong positive association with NAFLD.
5 Conclusions
The relationship between TyG-WC and NAFLD in Japanese subjects with normal plasma glucose level is nonlinear. TyG-WC is positively associated with NAFLD when TyG-WC is ranged between 480 and 800. The magnitude of the TyG-WC is not associated with NAFLD when it is ≤ 480 or ≥ 800. There is potential clinical significance for the TyG-WC in identifying groups at high risk for NAFLD. It is a low-cost and simple and biochemical measurement that can be used to screen and assess NAFLD risk in large populations. Furthermore, these findings could be useful for establishing diagnostic or predictive models of incident NAFLD in the future.
Data availability statement
The original contributions presented in the study are included in the article. Further inquiries can be directed to the corresponding author.
Ethics statement
The studies involving human participants were reviewed and approved by Murakami Memorial Hospital’s ethics committee. The patients/participants provided their written informed consent to participate in this study.
Author contributions
Conceptualization: XJH and XYH. Methodology: XJH. Software: XYH. Validation: YQ. Formal analysis: XYH. Writing—original draft preparation: XYH. Writing—review and editing: YQ and TS. All authors have read and agreed to the published version of the manuscript. All authors contributed to the article.
Acknowledgments
We appreciate Okamura et al. for sharing their data.
Conflict of interest
The authors declare that the research was conducted in the absence of any commercial or financial relationships that could be construed as a potential conflict of interest.
Publisher’s note
All claims expressed in this article are solely those of the authors and do not necessarily represent those of their affiliated organizations, or those of the publisher, the editors and the reviewers. Any product that may be evaluated in this article, or claim that may be made by its manufacturer, is not guaranteed or endorsed by the publisher.
Supplementary material
The Supplementary Material for this article can be found online at: https://www.frontiersin.org/articles/10.3389/fendo.2023.1188214/full#supplementary-material
References
1. Chalasani N, Younossi Z, Lavine JE, Diehl AM, Brunt EM, Cusi K, et al. The diagnosis and management of non-alcoholic fatty liver disease: practice guideline by the American association for the study of liver diseases, American college of gastroenterology, and the American gastroenterological association. Hepatology (2012) 55(6):2005–23. doi: 10.1002/hep.25762
2. Xia C, Li R, Zhang S, Gong L, Ren W, Wang Z, et al. Lipid accumulation product is a powerful index for recognizing insulin resistance in non-diabetic individuals. Eur J Clin Nutr (2012) 66(9):1035–8. doi: 10.1038/ejcn.2012.83
3. Khashab MA, Liangpunsakul S, Chalasani N. Nonalcoholic fatty liver disease as a component of the metabolic syndrome. Curr Gastroenterol Rep (2008) 10(1):73–80. doi: 10.1007/s11894-008-0012-0
4. Bernstein DE. Nonalcoholic fatty liver disease: an expanding health care epidemic. Clin Liver Dis (2018) 22(1):xiii–xiv. doi: 10.1016/j.cld.2017.10.001
5. Vernon G, Baranova A, Younossi ZM. Systematic review: the epidemiology and natural history of non-alcoholic fatty liver disease and non-alcoholic steatohepatitis in adults. Aliment Pharmacol Ther (2011) 34(3):274–85. doi: 10.1111/j.1365-2036.2011.04724.x
6. Younossi ZM, Koenig AB, Abdelatif D, Fazel Y, Henry L, Wymer M. Global epidemiology of nonalcoholic fatty liver disease-meta-analytic assessment of prevalence, incidence, and outcomes. Hepatology (2016) 64(1):73–84. doi: 10.1002/hep.28431
7. Eslam M, Newsome PN, Sarin SK, Anstee QM, Targher G, Romero-Gomez M, et al. A new definition for metabolic dysfunction-associated fatty liver disease: an international expert consensus statement. J Hepatol (2020) 73(1):202–9. doi: 10.1016/j.jhep.2020.03.039
8. Alba LM, Lindor K. Review article: non-alcoholic fatty liver disease. Aliment Pharmacol Ther (2003) 17(8):977–86. doi: 10.1046/j.1365-2036.2003.01493.x
9. Xue Y, Xu J, Li M, Gao Y. Potential screening indicators for early diagnosis of NAFLD/MAFLD and liver fibrosis: triglyceride glucose index-related parameters. Front Endocrinol (Lausanne) (2022) 13:951689. doi: 10.3389/fendo.2022.951689
10. Sinn DH, Gwak GY, Park HN, Kim JE, Min YW, Kim KM, et al. Ultrasonographically detected non-alcoholic fatty liver disease is an independent predictor for identifying patients with insulin resistance in non-obese, non-diabetic middle-aged Asian adults. Am J Gastroenterol (2012) 107(4):561–7. doi: 10.1038/ajg.2011.400
11. Machado M, Cortez-Pinto H. Non-alcoholic fatty liver disease and insulin resistance. Eur J Gastroenterol Hepatol (2005) 17(8):823–6. doi: 10.1097/00042737-200508000-00008
12. Er LK, Wu S, Chou HH, Hsu LA, Teng MS, Sun YC, et al. Triglyceride glucose-body mass index is a simple and clinically useful surrogate marker for insulin resistance in nondiabetic individuals. PloS One (2016) 11(3):e0149731. doi: 10.1371/journal.pone.0149731
13. Li Y, Zheng R, Li J, Feng S, Wang L, Huang Z. Association between triglyceride glucose-body mass index and non-alcoholic fatty liver disease in the non-obese Chinese population with normal blood lipid levels: a secondary analysis based on a prospective cohort study. Lipids Health Dis (2020) 19(1):229. doi: 10.1186/s12944-020-01409-1
14. Sheng G, Lu S, Xie Q, Peng N, Kuang M, Zou Y. The usefulness of obesity and lipid-related indices to predict the presence of non-alcoholic fatty liver disease. Lipids Health Dis (2021) 20(1):134. doi: 10.1186/s12944-021-01561-2
15. Zhang S, Du T M, Jia J, Lu H, X. Lin and X. Yu: triglyceride glucose-body mass index is effective in identifying nonalcoholic fatty liver disease in nonobese subjects. Med (Baltimore) (2017) 96(22):e7041. doi: 10.1097/MD.0000000000007041
16. Li N, Tan H, Xie A, Li C, Fu X, Xang W, et al. Value of the triglyceride glucose index combined with body mass index in identifying non-alcoholic fatty liver disease in patients with type 2 diabetes. BMC Endocr Disord (2022) 22(1):101. doi: 10.1186/s12902-022-00993-w
17. Hu H, Han Y, Cao C, He Y. The triglyceride glucose-body mass index: a non-invasive index that identifies non-alcoholic fatty liver disease in the general Japanese population. J Transl Med (2022) 20(1):398. doi: 10.1186/s12967-022-03611-4
18. Song S, Son DH, Baik SJ, Cho WJ, Lee YJ. Triglyceride glucose-waist circumference (TyG-WC) is a reliable marker to predict non-alcoholic fatty liver disease. Biomedicines (2022) 10(9):2251. doi: 10.3390/biomedicines10092251
19. Kim HS, Cho YK, Kim EH, Lee MJ, Jung CH, Park JY, et al. Triglyceride glucose-waist circumference is superior to the homeostasis model assessment of insulin resistance in identifying nonalcoholic fatty liver disease in healthy subjects. J Clin Med (2021) 11(1):41. doi: 10.3390/jcm11010041
20. Khamseh ME, Malek M, Abbasi R, Taheri H, Lahouti M, Alaei-Shahmiri F. Triglyceride glucose index and related parameters (Triglyceride glucose-body mass index and triglyceride glucose-waist circumference) identify nonalcoholic fatty liver and liver fibrosis in individuals with Overweight/Obesity. Metab Syndr Relat Disord (2021) 19(3):167–73. doi: 10.1089/met.2020.0109
21. Okamura T, Hashimoto Y, Hamaguchi M, Obora A, Kojima T, Fukui M. Ectopic fat obesity presents the greatest risk for incident type 2 diabetes: a population-based longitudinal study. Int J Obes (Lond) (2019) 43(1):139–48. doi: 10.1038/s41366-018-0076-3
22. Choi JH, Sohn W, Cho YK. The effect of moderate alcohol drinking in nonalcoholic fatty liver disease. Clin Mol Hepatol (2020) 26(4):662–9. doi: 10.3350/cmh.2020.0163
23. Simental-Mendia LE, Rodriguez-Moran M, Guerrero-Romero F. The product of fasting glucose and triglycerides as surrogate for identifying insulin resistance in apparently healthy subjects. Metab Syndr Relat Disord (2008) 6(4):299–304. doi: 10.1089/met.2008.0034
24. Hamaguchi M, Kojima T, Itoh Y, Harano Y, Fujii K, Nakajima T, et al. The severity of ultrasonographic findings in nonalcoholic fatty liver disease reflects the metabolic syndrome and visceral fat accumulation. Am J Gastroenterol (2007) 102(12):2708–15. doi: 10.1111/j.1572-0241.2007.01526.x
25. Wax Y. Collinearity diagnosis for a relative risk regression analysis: an application to assessment of diet-cancer relationship in epidemiological studies. Stat Med (1992) 11(10):1273–87. doi: 10.1002/sim.4780111003
26. Jaddoe VW, de Jonge LL, Hofman A, Franco OH, Steegers EA, Gaillard R. First trimester fetal growth restriction and cardiovascular risk factors in school age children: population based cohort study. BMJ (2014) 348:g14. doi: 10.1136/bmj.g14
27. DeFronzo RA, Tobin JD, Andres R. Glucose clamp technique: a method for quantifying insulin secretion and resistance. Am J Physiol (1979) 237(3):E214–23. doi: 10.1152/ajpendo.1979.237.3.E214
28. Lee SB, Kim MK, Kang S, Park K, Kim JH, Baik SJ, et al. Triglyceride glucose index is superior to the homeostasis model assessment of insulin resistance for predicting nonalcoholic fatty liver disease in Korean adults. Endocrinol Metab (Seoul) (2019) 34(2):179–86. doi: 10.3803/EnM.2019.34.2.179
29. Guerrero-Romero F, Simental-Mendia LE, Gonzalez-Ortiz M, Martinez-Abundis E, Ramos-Zavala MG, Hernandez-Gonzalez SO, et al. The product of triglycerides and glucose, a simple measure of insulin sensitivity. Comparison euglycemic-hyperinsulinemic clamp. J Clin Endocrinol Metab (2010) 95(7):3347–51. doi: 10.1210/jc.2010-0288
30. Lim J, Kim J, Koo SH, Kwon GC. Comparison of triglyceride glucose index, and related parameters to predict insulin resistance in Korean adults: an analysis of the 2007-2010 Korean national health and nutrition examination survey. PloS One (2019) 14(3):e0212963. doi: 10.1371/journal.pone.0212963
31. Cho YK, Lee J, Kim HS, Kim EH, Lee MJ, Yang DH, et al. Triglyceride glucose-waist circumference better predicts coronary calcium progression compared with other indices of insulin resistance: a longitudinal observational study. J Clin Med (2020) 10(1):92. doi: 10.3390/jcm10010092
32. Li W, Wang Y, He F, Liu Z, Dong J, Zhang Y, et al. Association between triglyceride-glucose index and nonalcoholic fatty liver disease in type 2 diabetes mellitus. BMC Endocr Disord (2022) 22(1):261. doi: 10.1186/s12902-022-01172-7
33. Tobari M, Hashimoto E. Characteristic features of nonalcoholic fatty liver disease in Japan with a focus on the roles of age, sex and body mass index. Gut Liver (2020) 14(5):537–45. doi: 10.5009/gnl19236
34. Gan D, Wang L, Jia M, Ru Y, Ma Y, Zheng W, et al. Low muscle mass and low muscle strength associate with nonalcoholic fatty liver disease. Clin Nutr (2020) 39(4):1124–30. doi: 10.1016/j.clnu.2019.04.023
Keywords: nonalcoholic fatty liver disease, insulin resistance, triglyceride, fasting blood glucose, triglyceride glucose waist circumference
Citation: He X, Huang X, Qian Y and Sun T (2023) A non-linear relationship between triglyceride glucose waist circumference and nonalcoholic fatty liver disease in a Japanese population: a secondary analysis. Front. Endocrinol. 14:1188214. doi: 10.3389/fendo.2023.1188214
Received: 17 March 2023; Accepted: 08 June 2023;
Published: 07 July 2023.
Edited by:
Takefumi Kimura, Shinshu University, JapanReviewed by:
Marija Takic, University of Belgrade, SerbiaIan James Martins, University of Western Australia, Australia
Mitra Darbandi, Kermanshah University of Medical Sciences, Iran
Mohammad Reza Mahmoodi, Kerman University of Medical Sciences, Iran
Copyright © 2023 He, Huang, Qian and Sun. This is an open-access article distributed under the terms of the Creative Commons Attribution License (CC BY). The use, distribution or reproduction in other forums is permitted, provided the original author(s) and the copyright owner(s) are credited and that the original publication in this journal is cited, in accordance with accepted academic practice. No use, distribution or reproduction is permitted which does not comply with these terms.
*Correspondence: Ting Sun, MTE5NTAzN0B6anUuZWR1LmNu
†These authors have contributed equally to this work