 Yong Guo
 Cui Liu
 Jie-Ling Wu
- Department of Children’s Health Care, Guangdong Women and Children Hospital, Guangzhou Medical University, Guangzhou, China
Background: Although there is evidence linking Bisphenol A (BPA) exposure to obesity, research examining its relationship with body composition parameters in young children is limited.
Methods: A cross-sectional investigation was conducted on 200 preschool children aged between 4 and 6 years in Guangzhou, China. BPA exposure was assessed through urine samples using ultra-high performance liquid chromatography- tandem mass spectrometry, and body composition parameters were measured through bioelectrical impedance analysis (InBody770).
Results: The median urinary BPA concentration was 0.556 μg/L (IQR: 0.301 - 1.031 μg/L) and creatinine-adjusted BPA concentration was 0.930 μg/g (IQR: 0.551 - 1.586 μg/g). BPA levels were significantly associated with body mass index (β= 1.15; 95%CI: 0.47, 1.83), body fat mass (β= 1.14; 95%CI: 0.39, 1.89), fat free mass (β= 0.92; 95%CI: 0.26, 1.58), and percent body fat (β= 3.44; 95%CI: 1.17, 5.71) after adjusting for potential confounding factors. Similarly, adjusted models with log10-transformed creatinine-adjusted BPA concentrations as a continuous variable showed similar trends. Positive linear associations were observed between quartiles of BPA concentrations and body composition parameters, with the highest coefficients in the fourth quartile.
Conclusion: Our study provides further evidence of positive correlations between BPA exposure and body composition parameters in children aged 4 to 6 years. These findings highlight the potential health risks associated with obesity-related body composition parameters in young children. Further investigations are needed to confirm this association and explore the underlying mechanisms.
Introduction
Bisphenol A (BPA), a chemical compound, finds broad application in the manufacturing of polycarbonate plastics and epoxy resins (1). BPA exposure has been associated with multiple adverse health effects, such as obesity, insulin resistance, cardiovascular disease, reproductive disorders, and neurobehavioral disorders (2–4). Infants and young children may be exposed to BPA through various pathways, including the utilization of polycarbonate feeding bottles and drinking cups, canned provisions, thermal paper goods, and maternal exposure during pregnancy and breastfeeding (5–7). In addition, exposure to BPA may also occur through dust particles in indoor environments and personal care products such as shampoos, lotions, and cleaning products (8, 9). There is growing concern regarding BPA exposure during critical early developmental periods, as it can disrupt hormonal regulation and cause long-lasting effects. Numerous studies have explored the potential link between BPA exposure and childhood obesity, potentially due to its ability to mimic estrogen and disrupt normal hormonal balance, interfere with insulin signaling, stimulate the differentiation of preadipocytes, alter the gut microbiome, induce inflammation, and affect energy metabolism (10–13). Recent research has also suggested that BPA exposure may contribute to childhood obesity by influencing epigenetic modifications of genes involved in metabolism and energy balance (14, 15). These findings highlight the potential for environmental factors such as BPA exposure to contribute to the obesity epidemic, and underscore the importance of reducing exposure to BPA, particularly in children. Although there is growing research on the relationship between BPA exposure and childhood obesity, studies on the relationship between BPA exposure and body composition parameters remain scarce. Understanding the impact of BPA on body composition parameters is critical for a better understanding of the link between BPA and childhood obesity, as well as for implementing more effective measures to prevent childhood obesity. Additionally, as body composition parameters are closely related to the risk of cardiovascular disease, metabolic disorders, and other health issues, investigating the relationship between BPA exposure and body composition parameters can help shed light on the health effects of BPA and its related mechanisms (16–18). Therefore, further investigations are required to examine the association between BPA exposure and body composition parameters to further understand the potential harm. The purpose of this study is to investigate the potential correlation between exposure to BPA and alterations in body composition parameters, with the intention of elucidating the potential impact of BPA on the development of obesity and related health issues.
Materials and methods
Study population
The cross-sectional study was conducted on a sample of 200 preschool children aged 4 to 6 years in Guangzhou, China, during the period between September and November of 2020. Specifically, we selected one preschool and used a stratified sampling method to randomly select three classes from each age group. Parents were then informed of the study and gave their consent for their child to participate. Inclusion criteria: participants must be older than 3 years of age, have a height greater than 95 cm, and weight more than 10 kg. Children with implanted cardiac pacemakers or other electronic devices, as well as those with limb deficiencies that prevented adequate electrode contact, were excluded from the study. Information on the children’s sociodemographic characteristics and health status was gathered by structured questionnaires.
Ethical statement
This study was approved by the Medical Research Ethics Board of Guangdong Women and Children Hospital. Participants were fully informed of the study procedures and objectives, and informed written parental consent was obtained prior to enrollment in the study.
BPA exposure assessment
Urine samples were collected from participants using 10 ml polypropylene tubes and stored at -20°C for subsequent BPA concentration analysis. BPA was detected using ultra-high performance liquid chromatography- tandem mass spectrometry, following established protocols (19) and prior studies (20, 21). Briefly, 4 mL of urine was mixed with 0.50 mL of phosphate buffer (pH=7.0) and 40 μL of β-glucuronidase, and underwent hydrolysis. The hydrolyzed urine samples were extracted twice with ethyl acetate:n-hexane (1:1) and the upper organic phase was dissolved in 40% acetonitrile-water solution for analysis. BPA concentration was calibrated against creatinine, which was measured using an automatic biochemical instrument. BPA concentrations in the 25th, 50th, and 75th percentiles were utilized as dividing points, given the potential non-monotonic dose response effects of BPA (22). Urine samples were processed and stored under controlled conditions, with background error from laboratory vessels being below the instrument’s detection limit. The precision recoveries of BPA in urine were within acceptable limits, with inter-batch and intra-batch precision recoveries ranging from 92.6%-120.0% and 3.54%-7.02%, respectively.
Measurements of body composition
All study participants underwent anthropometric measurements. Participants’ heights were measured to the nearest 0.1 cm, and weights were measured to the nearest 0.1 kg, with minimal clothing. The body composition was assessed via bioelectrical impedance analysis, employing the InBody770 device. The test body composition parameters included body mass index (BMI), body fat mass (BFM), soft lean mass (SLM), fat free mass (FFM), skeletal muscle mass (SMM), percent body fat (PBF), waist-hip ratio (WHR), visceral fat area (VFA), arm circumference (AC), arm muscle circumference (AMC), fat free mass index (FFMI), fat mass index (FMI) and skeletal muscle index (SMI). The age and sex standardized BMI z-score was calculated based on the reference of Chinese children under 7 years in 2015 (23). Children were categorized as non-overweight (BMI z-score ≤ 1) and overweight/obesity (BMI z-score > 1) according to the BMI z-score.
Statistical analyses
The Kolmogorov-Smirnov test was utilized to assess the normal distribution of data presented as mean ± standard deviation (SD), while non-normally distributed data were expressed as medians (quartiles). For BPA concentrations (μg/L), the median value and interquartile range (IQR) were determined. Urinary BPA concentrations were measured in both volume-based (μg/L) and creatinine-adjusted formats (μg/g) to assess the level of exposure to BPA in the participants (24), and log10-transformation was performed to account for non-normal distribution. The Pearson correlation coefficient was used to analyze the relationship between log-transformed BPA concentrations and body composition parameters. We utilized linear regression models to assess the relationship between body composition parameters and BPA concentrations. Beta coefficients indicated the average change in body composition parameters per unit increase in log-transformed BPA concentrations, or the mean variation in body composition parameters between the first quartile of BPA exposure and subsequent three quartiles, together with corresponding 95% Confidence Intervals (CIs). The models were adjusted for children’s age, sex, primary caregiver, caregiver education, gestational age at birth, birth weight, and duration of breastfeeding. Statistical analyses were performed using R software version 4.2.1 (www.R-project.org) and the SPSS statistical software package (V26, IBM Statistics, Chicago, IL, USA). Statistical significance was set at P <0.05 for all analyses.
Results
Of the 200 children aged 4 to 6 years who enrolled in our study, 120 were male. The mean (± SD) age of the children was 5.22 ( ± 0.67) years. 76.0% of participants reported the primary caregivers were mothers. BPA exposure was detected in all urine samples. The median (IQR) urinary BPA concentrations and creatinine-adjusted BPA concentrations were 0.556 μg/L (0.301 - 1.031 μg/L) and 0.930 μg/g (0.551 - 1.586 μg/g), respectively. The other demographic characteristics and measurement indicators are presented in Table 1.
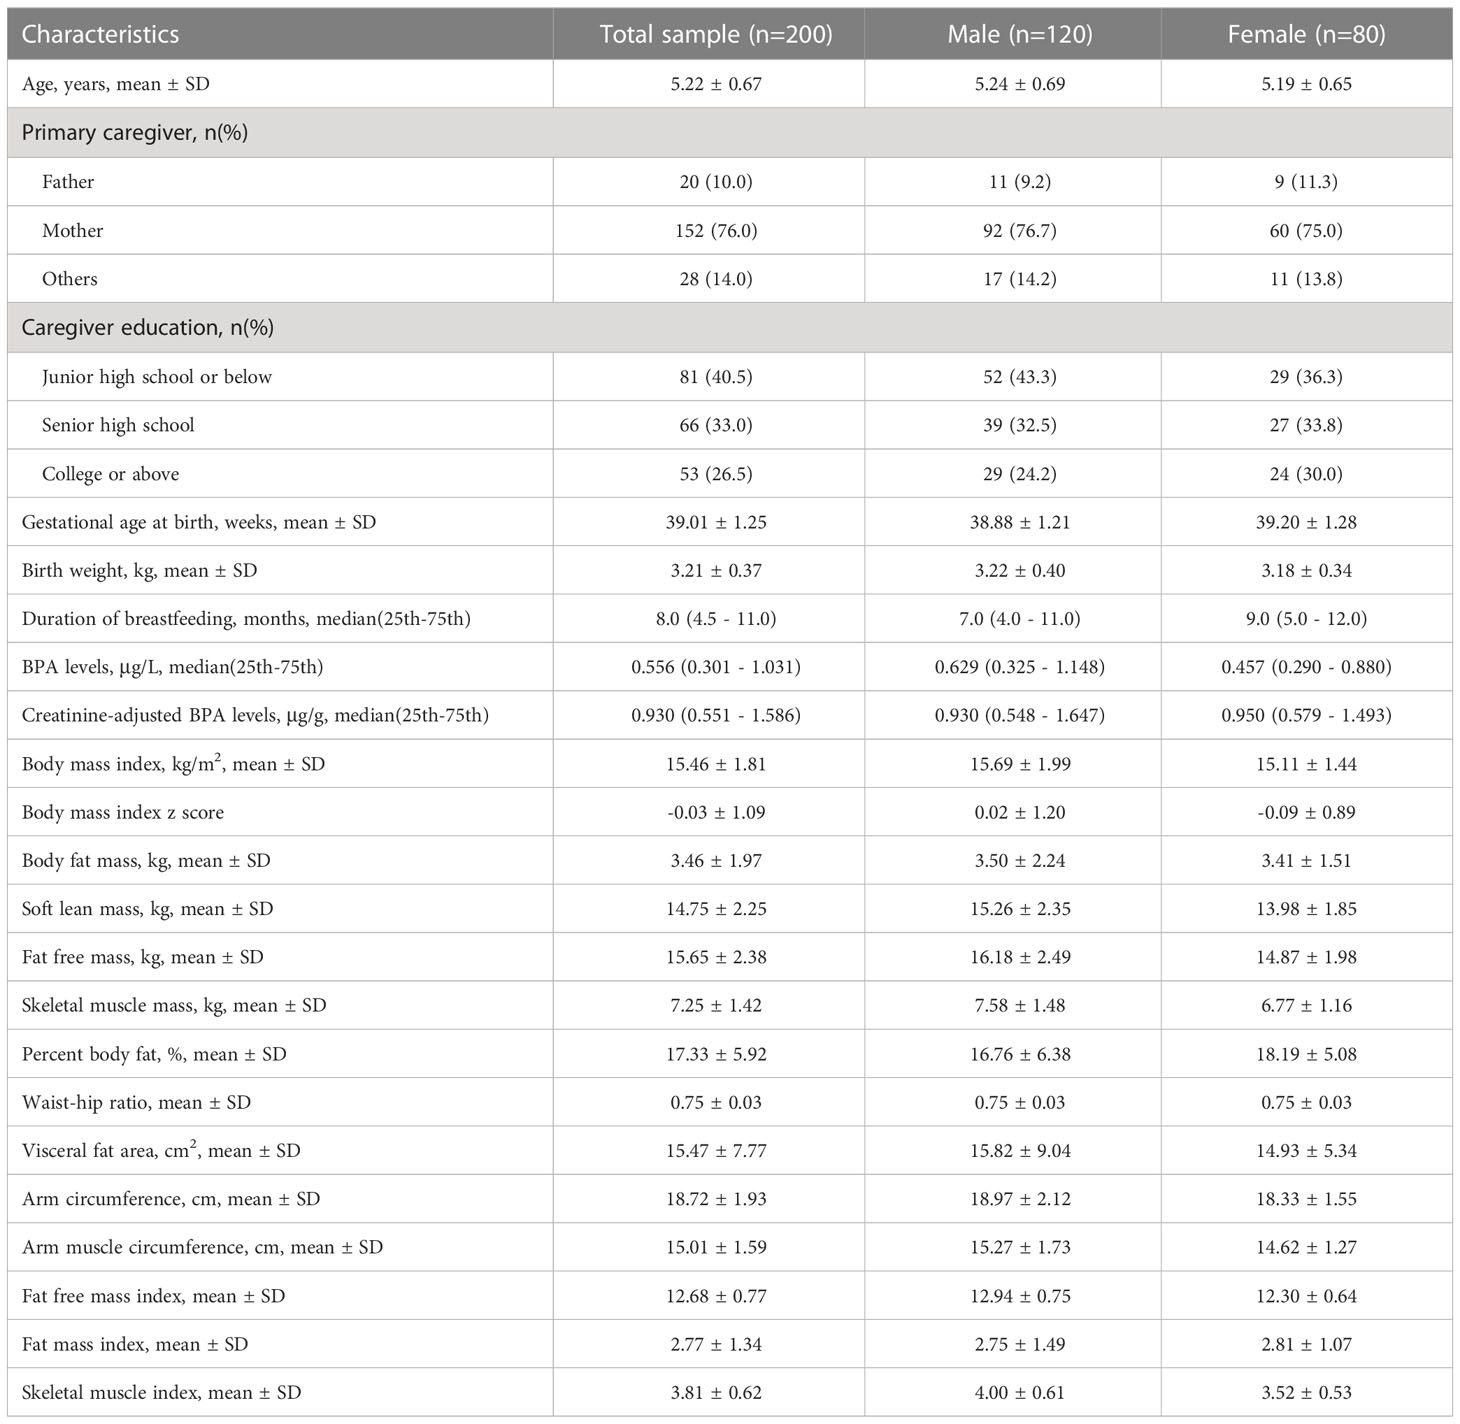
Table 1 Characteristics and measurement indicators of the participants.
Figures 1, 2 showed the correlation between log-transformed BPA levels and body composition parameters. Log10-transformed BPA levels were found to have positive correlations with BMI, BPF, SLM, FFM, SMM, PBF, AC, AMC, FFMI, FMI and SMI. In general, higher BPA levels were found to be associated with higher body composition parameters. The adjusted models revealed significant correlations between elevated BPA concentrations and increased BMI (β= 1.15; 95%CI: 0.47, 1.83), BFM (β= 1.14; 95%CI: 0.39, 1.89), FFM (β= 0.92; 95%CI: 0.26, 1.58), and PBF (β= 3.44; 95%CI: 1.17, 5.71). Similarly, adjusted models with log10-transformed creatinine-adjusted BPA concentrations as a continuous variable showed similar trends in the results, as presented in Table 2.
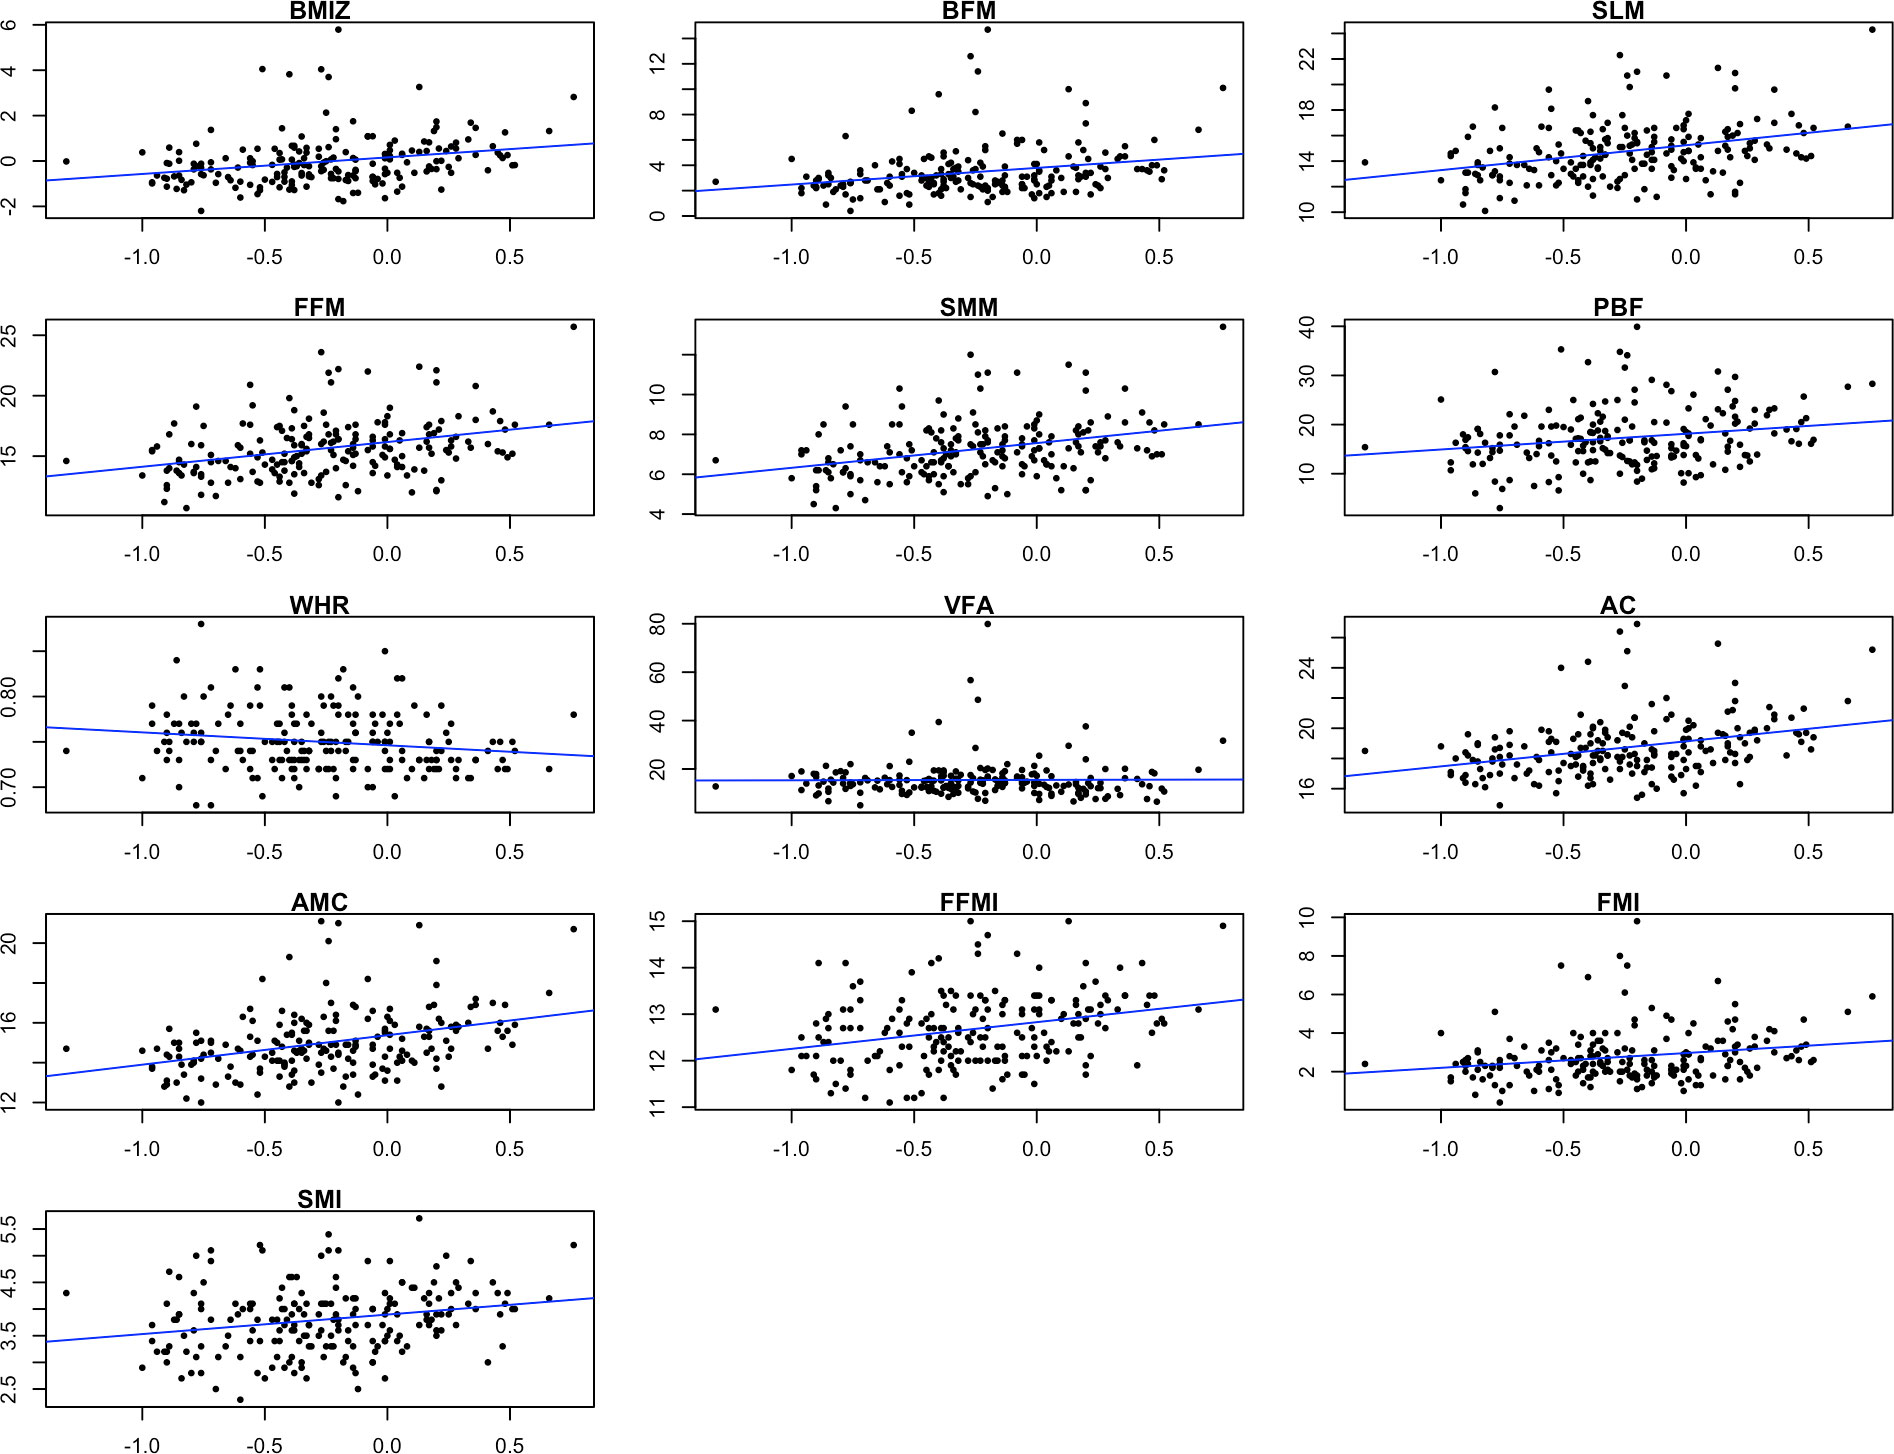
Figure 1 Scatter plots showing the correlation between log-transformed BPA levels and body composition parameters. BMIZ, body mass index z score; BFM, body fat mass; SLM, soft lean mass; FFM, fat free mass; SMM, skeletal muscle mass; PBF, percent body fat; WHR, waist-hip ratio; VFA, visceral fat area; AC, arm circumference; AMC, arm muscle circumference; FFMI, fat free mass index; FMI, fat mass index; SMI, skeletal muscle index.
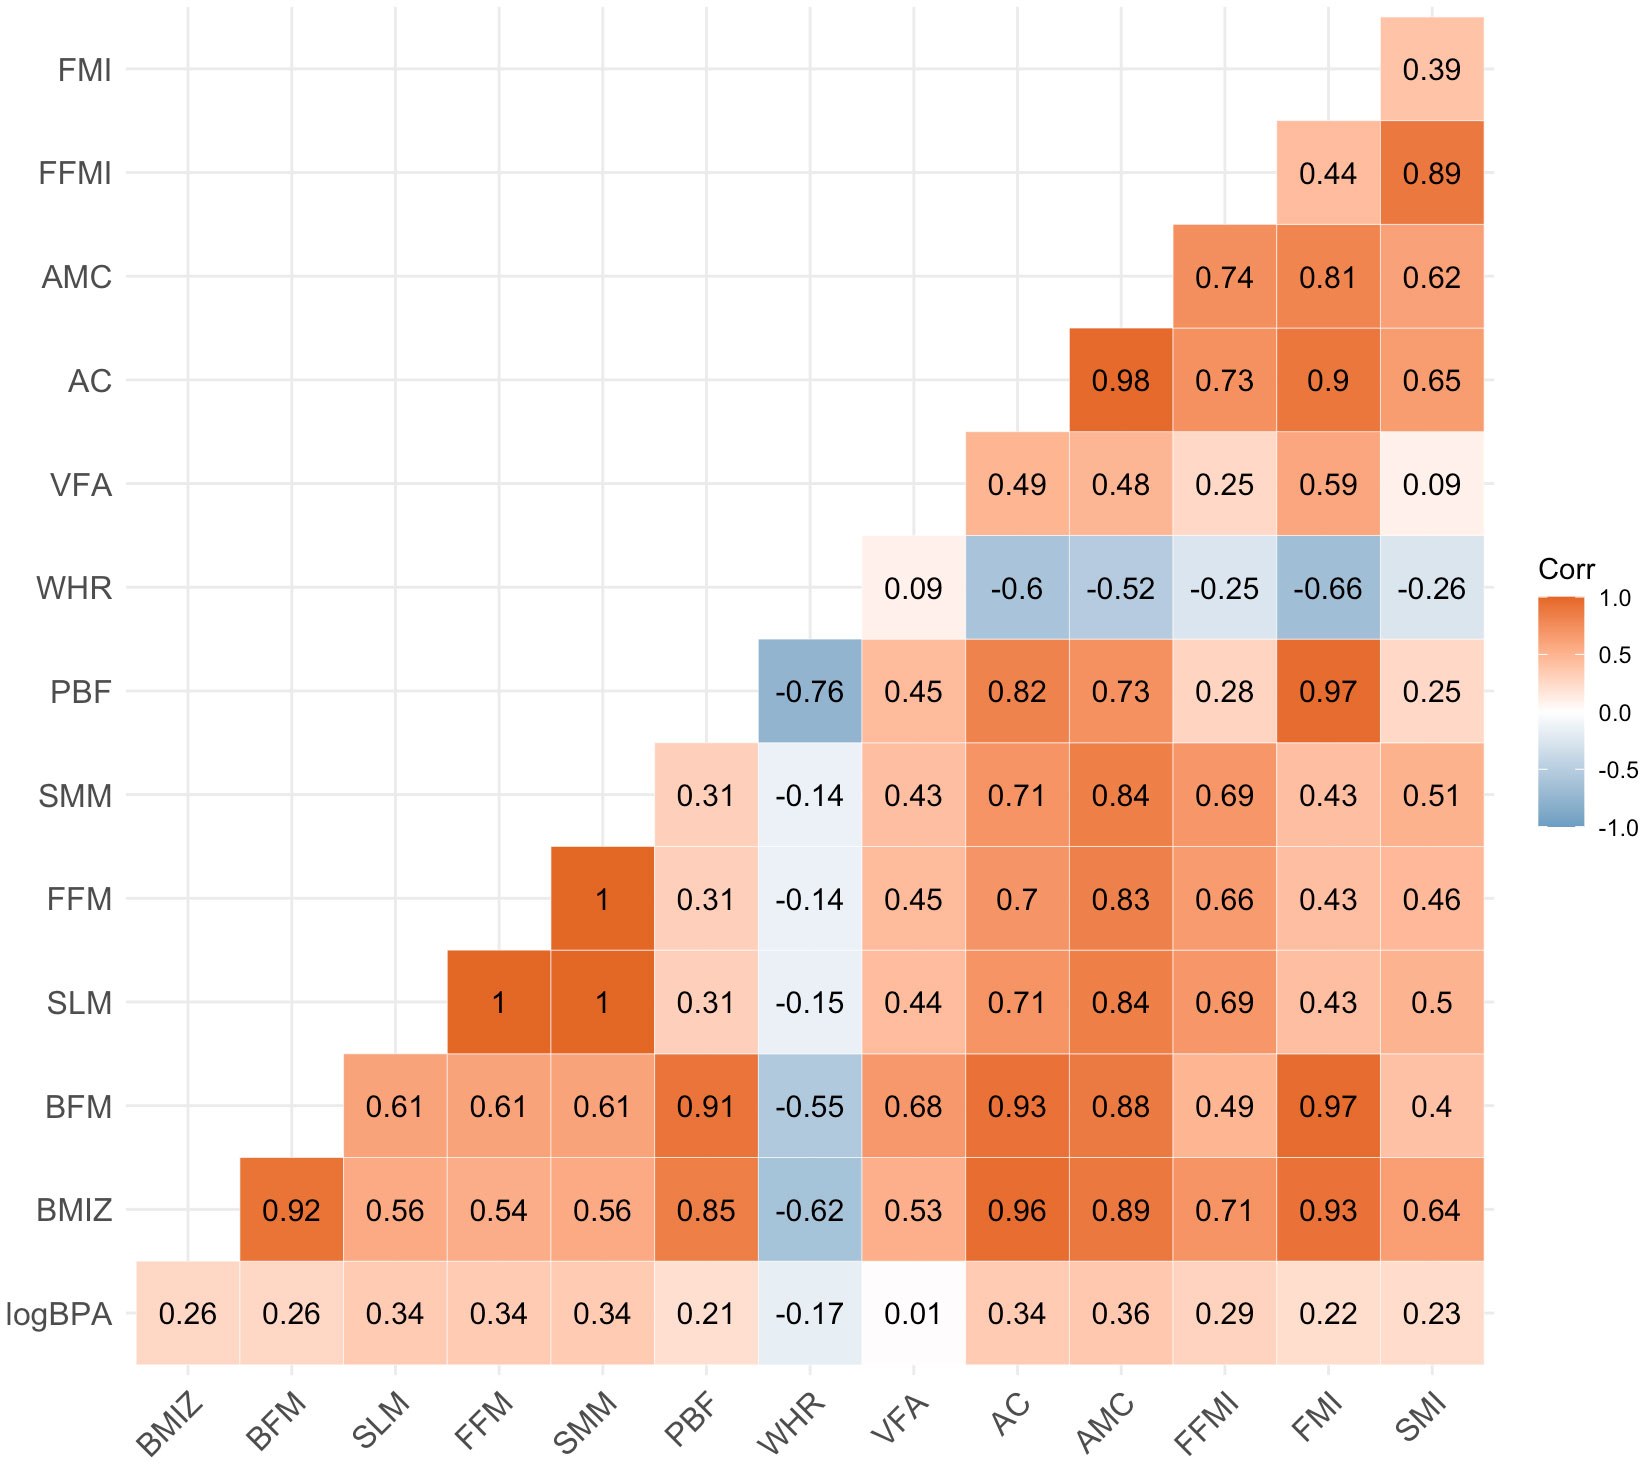
Figure 2 Heat map on the correlation between log-transformed BPA levels and body composition parameters. Values represent Pearson’s correlation coefficient. BPA, bisphenol A; BMIZ, body mass index z score; BFM, body fat mass; SLM, soft lean mass; FFM, fat free mass; SMM, skeletal muscle mass; PBF, percent body fat; WHR, waist-hip ratio; VFA, visceral fat area; AC, arm circumference; AMC, arm muscle circumference; FFMI, fat free mass index; FMI, fat mass index; SMI, skeletal muscle index.
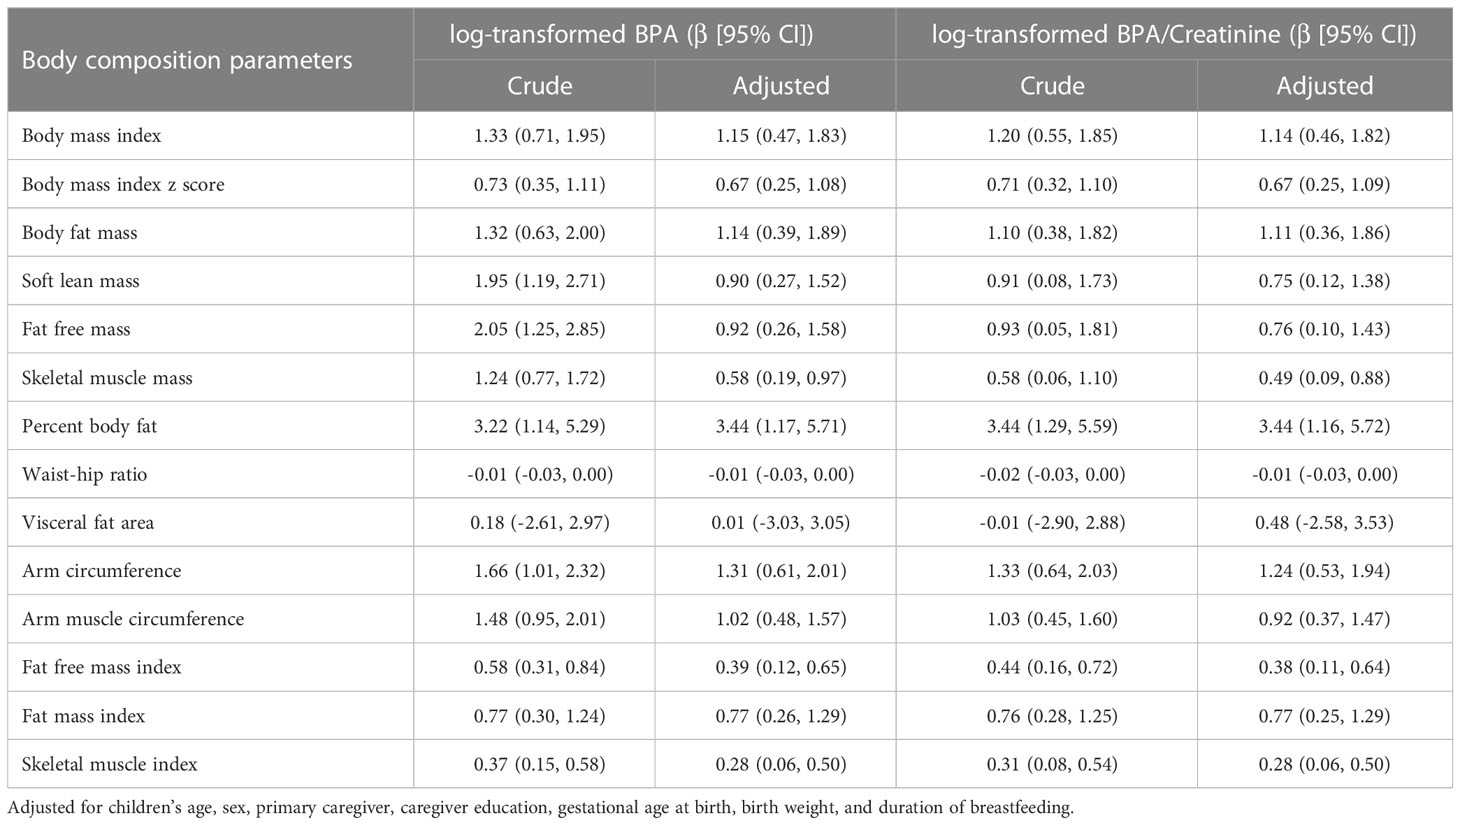
Table 2 Association of BPA levels and body composition parameters.
Our results revealed that BPA exposure was more strongly associated with increases in BMI, BFM, PBF, and FMI in males compared to females (Table 3). The linear regression analysis employing quartiles of BPA concentrations as predictor variables, with the first quartile used as the reference group, indicated positive linear associations between BPA concentrations and BMI, BPF, SLM, FFM, SMM, PBF, AC, AMC, FFMI, FMI, and SMI. The coefficients of these associations between BPA concentrations and body composition parameters were considerably greater in the fourth quartile of BPA exposure as compared to those in the first quartile. However, when quartiles of creatinine-adjusted BPA concentrations were considered, all these associations were attenuated, as shown in Table 4. There were 23 children identified as overweight/obesity. The results showed increased odds of overweight/obesity (OR = 4.81; 95% CI: 1.19, 19.49) among children with log-transformed BPA concentrations after controlling for confounders.
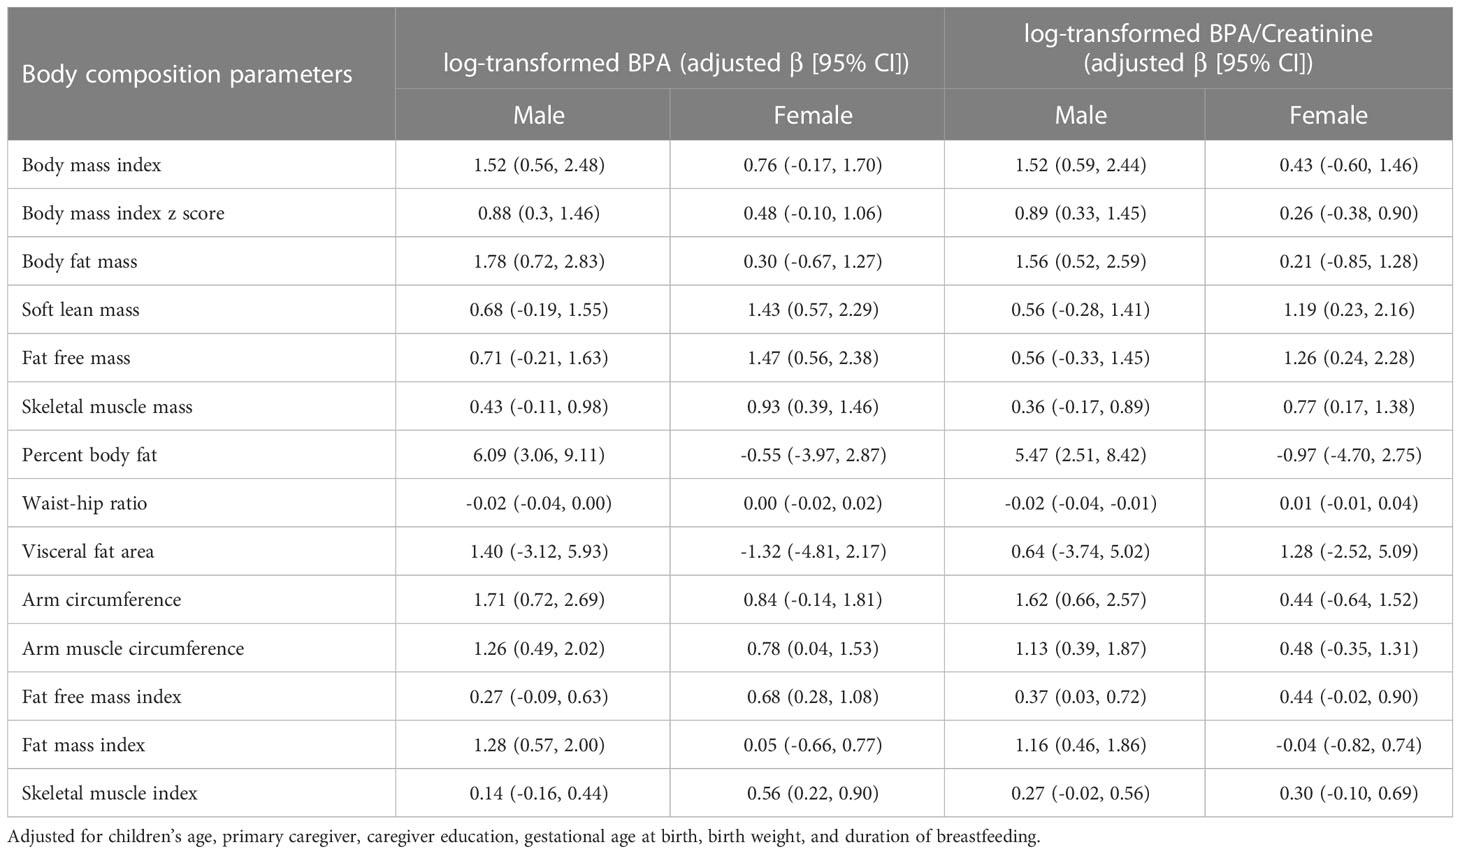
Table 3 Association of BPA levels and body composition parameters by sex.
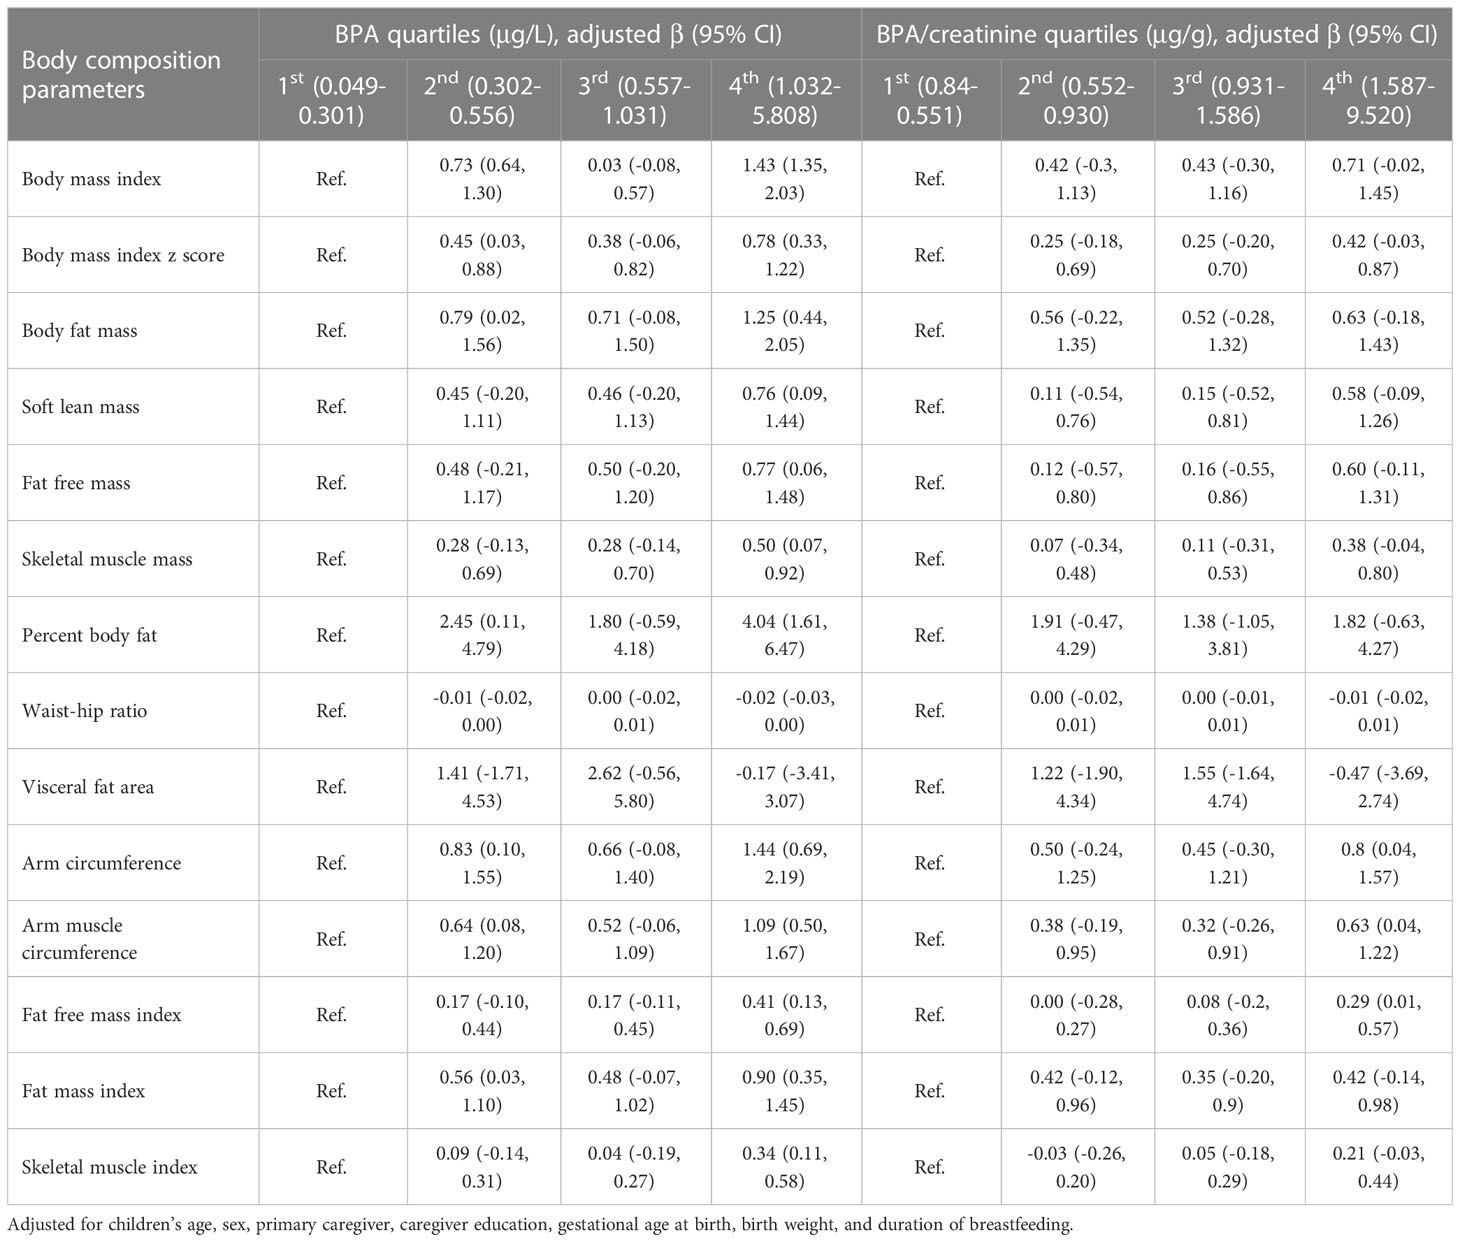
Table 4 Association of BPA quartiles and body composition parameters.
Discussion
The prevalence of childhood and adolescent obesity has become a major public health issue in China (25). In addition to being a risk factor for multiple chronic non-communicable diseases in adults, childhood and adolescent obesity can have detrimental effects on various aspects of health, including cardiovascular, endocrine, respiratory, liver, skeletal, psychological, behavioral, and cognitive health (26, 27). In this study, we investigated the relationship between BPA exposure and body composition parameters in children aged 4 to 6 years. Our results indicated that higher BPA levels were associated with higher body composition parameters related to obesity in young children, including BMI, BFM, FFM, and PBF, after adjusting for potential confounding factors.
Our results are in line with prior research that has also reported positive correlations between BPA exposure and obesity-related outcomes in both children and adults. The study conducted by Trasande et al. found that urinary BPA concentrations were positively associated with BMI and AC in children aged 6-19 years (28). Similarly, Carwile et al. reported positive associations between BPA exposure and BMI and waist circumference in adults (29), and Shankar et al. demonstrated positive associations between BPA exposure and BMI and waist circumference in adults aged 18-74 years (30). However, the mechanisms underlying the relationship between BPA exposure and obesity are not fully understood. BPA is a known endocrine disruptor that can alter the body’s hormonal balance and interfere with metabolic pathways, which may contribute to changes in body composition and the development of obesity by moderating inflammation and insulin resistance (31). It has been suggested that BPA may interact with estrogen and G-protein coupled receptors to promote adipogenesis and impair cellular homeostasis (32). BPA is also related to induce epigenetic alterations in specific genes such as Fto, which is involved in appetite control, and alterations at two cis-regulatory elements correlate with transmission of obesity (33). Moreover, BPA exposure has been linked to altered gut microbiota, which may also play a role in the development of obesity and related health issues (34). Further studies are needed to elucidate the underlying mechanisms of the relationship between BPA exposure and obesity-related outcomes in early childhood.
Sex differences in the effects of BPA exposure on obesity-related outcomes have been reported in previous studies, and our study has also showed such differences. Specifically, our results revealed that BPA exposure was more strongly associated with increases in BMI, BFM, PBF, and FMI in males compared to females. However, the results from previous studies have yielded conflicting findings. Liu et al. reported that BPA exposure was more strongly associated with obesity in boys than in girls, despite no significant difference in the median urinary BPA concentrations observed between sexes (35). This suggests that differences in hormone levels may alter the susceptibility to adverse effects related to BPA exposure. However, Gajjar et al. reported conflicting results, did not find compelling evidence that child sex modified the association between urinary BPA concentrations and adiposity outcomes at 8 years of age (36). Additionally, a longitudinal cohort study conducted in California reported that prenatal urinary BPA concentrations were associated with reduced BMI in females at 9 years of age, but not in males (37). In contrast, another study found that elevated BMI levels were observed exclusively in females consuming highly BPA-exposed food (38).
Our study has several strengths, including the use of a well-established method for BPA detection, and the inclusion of a wide range of body composition parameters, which provide a comprehensive picture of the association between BPA exposure and obesity-related outcomes. While our study demonstrated significant positive associations between BPA exposure and body composition parameters in children, with weak effect sizes, it is essential to recognize that even small increases in these parameters may have adverse health consequences over time, particularly in young children whose bodies are still developing. Considering the widespread exposure of BPA in consumer products, our study adds to the growing body of evidence highlighting the need to further examine the health effects of BPA exposure, particularly in vulnerable populations such as infants and children. However, our study is limited by its cross-sectional design, which precludes the establishment of a causal relationship between BPA exposure and changes in body composition parameters. We also recognize that the small sample size may affect the interpretation and generalizability of our findings. Future longitudinal studies with larger sample sizes and more robust study designs are needed to examine the long-term effects of BPA exposure on body composition and obesity-related health outcomes.
Conclusions
Our study provides further evidence of positive correlations between BPA exposure and body composition parameters in children aged 4 to 6 years. These findings highlight the potential health risks associated with obesity-related body composition parameters in young children. Further investigations are warranted to confirm this association and explore the underlying mechanisms.
Data availability statement
The raw data supporting the conclusions of this article will be made available by the authors, without undue reservation.
Ethics statement
The studies involving human participants were reviewed and approved by Medical Research Ethics Board of Guangdong Women and Children Hospital. Written informed consent to participate in this study was provided by the participants’ legal guardian/next of kin.
Author contributions
Conception and design of this study: YG and J-LW. Data collection and analysis: CL, Y-HD, JN, LY and YG. The first draft of the manuscript was written by YG and all authors commented on previous versions of the manuscript. All authors contributed to the article and approved the submitted version.
Funding
This work was supported in part by the Guangzhou Municipal Science and Technology Bureau (202002030361).
Conflict of interest
The authors declare that the research was conducted in the absence of any commercial or financial relationships that could be construed as a potential conflict of interest.
Publisher’s note
All claims expressed in this article are solely those of the authors and do not necessarily represent those of their affiliated organizations, or those of the publisher, the editors and the reviewers. Any product that may be evaluated in this article, or claim that may be made by its manufacturer, is not guaranteed or endorsed by the publisher.
Supplementary material
The Supplementary Material for this article can be found online at: https://www.frontiersin.org/articles/10.3389/fendo.2023.1180505/full#supplementary-material
References
1. Rochester JR. Bisphenol A. And human health: a review of the literature. Reprod Toxicol (2013) 42:132–55. doi: 10.1016/j.reprotox.2013.08.008
2. Rochester JR, Bolden AL. Bisphenol s and f: a systematic review and comparison of the hormonal activity of bisphenol a substitutes. Environ Health Perspect (2015) 123(7):643–50. doi: 10.1289/ehp.1408989
3. Heindel JJ, Blumberg B, Cave M, Machtinger R, Mantovani A, Mendez MA, et al. Metabolism disrupting chemicals and metabolic disorders. Reprod Toxicol (2017) 68:3–33. doi: 10.1016/j.reprotox.2016.10.001
4. Kahn LG, Philippat C, Nakayama SF, Slama R, Trasande L. Endocrine-disrupting chemicals: implications for human health. Lancet Diabetes Endocrinol (2020) 8(8):703–18. doi: 10.1016/S2213-8587(20)30129-7
5. Iribarne-Duran LM, Serrano L, Peinado FM, Pena-Caballero M, Hurtado JA, Vela-Soria F, et al. Biomonitoring bisphenols, parabens, and benzophenones in breast milk from a human milk bank in southern Spain. Sci Total Environ (2022) 830:154737. doi: 10.1016/j.scitotenv.2022.154737
6. Yang CZ, Yaniger SI, Jordan VC, Klein DJ, Bittner GD. Most plastic products release estrogenic chemicals: a potential health problem that can be solved. Environ Health Perspect (2011) 119(7):989–96. doi: 10.1289/ehp.1003220
7. Wang X, Nag R, Brunton NP, Siddique MAB, Harrison SM, Monahan FJ, et al. Human health risk assessment of bisphenol a (BPA) through meat products. Environ Res (2022) 213:113734. doi: 10.1016/j.envres.2022.113734
8. Vasiljevic T, Harner T. Bisphenol a and its analogues in outdoor and indoor air: properties, sources and global levels. Sci Total Environ (2021) 789:148013. doi: 10.1016/j.scitotenv.2021.148013
9. Fisher M, Arbuckle TE, MacPherson S, Braun JM, Feeley M, Gaudreau E. Phthalate and BPA exposure in women and newborns through personal care product use and food packaging. Environ Sci Technol (2019) 53(18):10813–26. doi: 10.1021/acs.est.9b02372
10. Liu B, Lehmler HJ, Sun Y, Xu G, Liu Y, Zong G, et al. Bisphenol a substitutes and obesity in US adults: analysis of a population-based, cross-sectional study. Lancet Planet Health (2017) 1(3):e114–e22. doi: 10.1016/S2542-5196(17)30049-9
11. Wu F, Hu M, Qu WD, Zhou Y. [The association between bisphenol a exposure and obesity/overweight in children and adolescents: dose-response meta analysis]. Zhonghua Yu Fang Yi Xue Za Zhi (2022) 56(4):519–24. doi: 10.3760/cma.j.cn112150-20210924-00922
12. Tang-Peronard JL, Andersen HR, Jensen TK, Heitmann BL. Endocrine-disrupting chemicals and obesity development in humans: a review. Obes Rev (2011) 12(8):622–36. doi: 10.1111/j.1467-789X.2011.00871.x
13. Newbold RR, Padilla-Banks E, Snyder RJ, Jefferson WN. Perinatal exposure to environmental estrogens and the development of obesity. Mol Nutr Food Res (2007) 51(7):912–7. doi: 10.1002/mnfr.200600259
14. Susiarjo M, Xin F, Bansal A, Stefaniak M, Li C, Simmons RA, et al. Bisphenol a exposure disrupts metabolic health across multiple generations in the mouse. Endocrinology (2015) 156(6):2049–58. doi: 10.1210/en.2014-2027
15. McCabe CF, Padmanabhan V, Dolinoy DC, Domino SE, Jones TR, Bakulski KM, et al. Maternal environmental exposure to bisphenols and epigenome-wide DNA methylation in infant cord blood. Environ Epigenet (2020) 6(1):dvaa021. doi: 10.1093/eep/dvaa021
16. Li J, Lai H, Chen S, Zhu H, Lai S. Gender differences in the associations between urinary bisphenol a and body composition among American children: the national health and nutrition examination survey, 2003-2006. J Epidemiol (2017) 27(5):228–34. doi: 10.1016/j.je.2016.12.001
17. Chevalier N, Fenichel P. Endocrine disruptors: new players in the pathophysiology of type 2 diabetes? Diabetes Metab (2015) 41(2):107–15. doi: 10.1016/j.diabet.2014.09.005
18. Janesick A, Blumberg B. Endocrine disrupting chemicals and the developmental programming of adipogenesis and obesity. Birth Defects Res C Embryo Today (2011) 93(1):34–50. doi: 10.1002/bdrc.20197
19. Yang M, Kim SY, Lee SM, Chang SS, Kawamoto T, Jang JY, et al. Biological monitoring of bisphenol a in a Korean population. Arch Environ Contam Toxicol (2003) 44(4):546–51. doi: 10.1007/s00244-002-2124-0
20. Li DK, Miao M, Zhou Z, Wu C, Shi H, Liu X, et al. Urine bisphenol-a level in relation to obesity and overweight in school-age children. PLoS One (2013) 8(6):e65399. doi: 10.1371/journal.pone.0065399
21. He Y, Miao M, Herrinton LJ, Wu C, Yuan W, Zhou Z, et al. Bisphenol a levels in blood and urine in a Chinese population and the personal factors affecting the levels. Environ Res (2009) 109(5):629–33. doi: 10.1016/j.envres.2009.04.003
22. Vandenberg LN, Maffini MV, Sonnenschein C, Rubin BS, Soto AM. Bisphenol-a and the great divide: a review of controversies in the field of endocrine disruption. Endocr Rev (2009) 30(1):75–95. doi: 10.1210/er.2008-0021
23. Zhang YQ, Li H, Wu HH, Zong XN, Zhu ZH, Pan Y, et al. The 5th national survey on the physical growth and development of children in the nine cities of China: anthropometric measurements of Chinese children under 7 years in 2015. Am J Phys Anthropol (2017) 163(3):497–509. doi: 10.1002/ajpa.23224
24. LaKind JS, Naiman DQ. Temporal trends in bisphenol a exposure in the united states from 2003-2012 and factors associated with BPA exposure: spot samples and urine dilution complicate data interpretation. Environ Res (2015) 142:84–95. doi: 10.1016/j.envres.2015.06.013
25. Pan XF, Wang L, Pan A. Epidemiology and determinants of obesity in China. Lancet Diabetes Endocrinol (2021) 9(6):373–92. doi: 10.1016/S2213-8587(21)00045-0
26. Wang W, Cheng J, Song W, Shen Y. The effectiveness of wearable devices as physical activity interventions for preventing and treating obesity in children and adolescents: systematic review and meta-analysis. JMIR Mhealth Uhealth (2022) 10(4):e32435. doi: 10.2196/32435
27. Gunaratne N, Deplewski D. Metabolic consequences of pediatric obesity: a review of pathophysiology, screening, and treatment. Pediatr Ann (2023) 52(2):e62–7. doi: 10.3928/19382359-20230102-06
28. Trasande L, Attina TM, Blustein J. Association between urinary bisphenol a concentration and obesity prevalence in children and adolescents. JAMA (2012) 308(11):1113–21. doi: 10.1001/2012.jama.11461
29. Carwile JL, Michels KB. Urinary bisphenol a and obesity: NHANES 2003-2006. Environ Res (2011) 111(6):825–30. doi: 10.1016/j.envres.2011.05.014
30. Shankar A, Teppala S, Sabanayagam C. Urinary bisphenol a levels and measures of obesity: results from the national health and nutrition examination survey 2003-2008. ISRN Endocrinol (2012) 2012:965243. doi: 10.5402/2012/965243
31. Hong X, Zhou Y, Zhu Z, Li Y, Li Z, Zhang Y, et al. Environmental endocrine disruptor bisphenol a induces metabolic derailment and obesity via upregulating IL-17A in adipocytes. Environ Int (2023) 172:107759. doi: 10.1016/j.envint.2023.107759
32. Maniradhan M, Calivarathan L. Bisphenol a-induced endocrine dysfunction and its associated metabolic disorders. Endocr Metab Immune Disord Drug Targets (2022) 23(4):515–29. doi: 10.2174/1871530322666220928144043
33. Jung YH, Wang HV, Ruiz D, Bixler BJ, Linsenbaum H, Xiang JF, et al. Recruitment of CTCF to an fto enhancer is responsible for transgenerational inheritance of BPA-induced obesity. Proc Natl Acad Sci USA (2022) 119(50):e2214988119. doi: 10.1073/pnas.2214988119
34. Charitos IA, Topi S, Gagliano-Candela R, De Nitto E, Polimeno L, Montagnani M, et al. The toxic effects of endocrine disrupting chemicals (EDCs) on gut microbiota: bisphenol a (BPA) a review. Endocr Metab Immune Disord Drug Targets. (2022) 22(7):716–27. doi: 10.2174/1871530322666220325114045
35. Liu B, Lehmler HJ, Sun Y, Xu G, Sun Q, Snetselaar LG, et al. Association of bisphenol a and its substitutes, bisphenol f and bisphenol s, with obesity in united states children and adolescents. Diabetes Metab J (2019) 43(1):59–75. doi: 10.4093/dmj.2018.0045
36. Gajjar P, Liu Y, Li N, Buckley JP, Chen A, Lanphear BP, et al. Associations of mid-childhood bisphenol a and bisphenol s exposure with mid-childhood and adolescent obesity. Environ Epidemiol (2022) 6(1):e187. doi: 10.1097/EE9.0000000000000187
37. Harley KG, Aguilar Schall R, Chevrier J, Tyler K, Aguirre H, Bradman A, et al. Prenatal and postnatal bisphenol a exposure and body mass index in childhood in the CHAMACOS cohort. Environ Health Perspect (2013) 121(4):514–20. doi: 10.1289/ehp.1205548
Keywords: Bisphenol (BPA), body composition parameter, children, obesity, bioelectrical impedance analysis
Citation: Guo Y, Liu C, Deng Y-H, Ning J, Yu L and Wu J-L (2023) Association between Bisphenol A exposure and body composition parameters in children. Front. Endocrinol. 14:1180505. doi: 10.3389/fendo.2023.1180505
Received: 06 March 2023; Accepted: 04 May 2023;
Published: 18 May 2023.
Edited by:
Wanzhu Jin, Chinese Academy of Sciences (CAS), ChinaReviewed by:
Wu Yan, Children’s Hospital of Nanjing Medical University, ChinaAshutosh Kumar Pandey, The State University of New Jersey, United States
Wilson C. J. Chung, Kent State University, United States
Copyright © 2023 Guo, Liu, Deng, Ning, Yu and Wu. This is an open-access article distributed under the terms of the Creative Commons Attribution License (CC BY). The use, distribution or reproduction in other forums is permitted, provided the original author(s) and the copyright owner(s) are credited and that the original publication in this journal is cited, in accordance with accepted academic practice. No use, distribution or reproduction is permitted which does not comply with these terms.
*Correspondence: Yong Guo, Z2V5b25nMDg0QDE2My5jb20=; Jie-Ling Wu, amllbGluZzM4NjFAMTYzLmNvbQ==