 Qiyang Xie
 Maobin Kuang
 Song Lu
 Xin Huang1
 Shuhua Zhang
 Guotai Sheng
 Yang Zou
94% of researchers rate our articles as excellent or good
Learn more about the work of our research integrity team to safeguard the quality of each article we publish.
Find out more
ORIGINAL RESEARCH article
Front. Endocrinol., 15 May 2023
Sec. Clinical Diabetes
Volume 14 - 2023 | https://doi.org/10.3389/fendo.2023.1175988
This article is part of the Research TopicSex Dimorphism in Endocrine Regulation of MetabolismView all 7 articles
Objective: The metabolic score for insulin resistance (MetS-IR) is an emerging surrogate marker for insulin resistance (IR). This study aimed to investigate the association and sex differences between MetS-IR and prediabetes risk in a Chinese population.
Methods: This cohort study included 100,309 adults with normoglycemia at baseline and had followed longitudinally for 5 years, and with prediabetes, defined according to the 2018 American Diabetes Association (ADA) recommended diagnostic criteria, as the outcome of interest. Multivariate Cox proportional hazards regression and restricted cubic spline (RCS) regression models were used to assess the association between MetS-IR and prediabetes risk.
Results: During an observation period of 312,843 person-years, 7,735 (14.84%) men and 4,617 (9.57%) women with pre-diabetes onset were recorded. After fully adjusting for confounders, we found an independent and positive correlation between MetS-IR and the risk of prediabetes in the Chinese population, and the degree of correlation was stronger in women than in men (HR: 1.24 vs 1.16, P-interaction<0.05). Furthermore, using RCS nested in the Cox regression model, we found that there was a nonlinear correlation between MetS-IR and prediabetes risk in both sexes with an obvious saturation effect point, and when the MetS-IR was greater than the value of the saturation effect point, the risk of prediabetes was gradually leveling off. We further calculated the saturation effect points of MetS-IR used to evaluate the risk of prediabetes which in men was 42.82, and in women was 41.78.
Conclusion: In this large cohort study, our results supported that MetS-IR was independently and positively associated with the risk of prediabetes in the Chinese population, with the association being stronger in women than in men.
Prediabetes is a transitional state in which the body’s glucose metabolism is between normal and diabetic, including impaired glucose tolerance and impaired fasting glucose (1). The prevalence of prediabetes varies widely worldwide, with recent epidemiological surveys showing a prevalence of approximately 10.0%-40.4% in adults (2–5), and among them, the prevalence of prediabetes in China is about 35.7% (6). It is well known that prediabetes is considered a precursor to diabetes (7), and up to 70% of prediabetes will eventually develop into diabetes (1). In addition, like diabetes, prediabetes can cause damage to multiple organ systems throughout the body (8), including cardiovascular and cerebrovascular, renal, hepatic, and pulmonary systems, and can trigger and exacerbate the risk of developing many chronic diseases (9–12), causing a great economic burden to society and families (13, 14). It is therefore essential to find reliable predictors to identify high-risk groups of prediabetes for early intervention to prevent the progression of abnormal glucose metabolism and the development of complications.
IR is clinically defined as the impaired ability of insulin to uptake and utilize glucose (15) and is an important predisposing factor in many chronic diseases (8). The gold standard for assessing IR is the hyperinsulinemic-euglycemic clamp (16), a complex, time-consuming, and resource-consuming method making it a great challenge for daily clinical application. MetS-IR, a new index for assessing IR, has recently been widely accepted by researchers as a cost-effective predictor of diabetes due to its simple, reliable, and reproducible properties (16). Additionally, observational studies have shown that MetS-IR is not only useful for assessing the risk of diabetes (16–19), but also has excellent risk assessment ability for a variety of metabolism-related diseases such as nonalcoholic fatty liver disease (NAFLD), hyperuricemia, prehypertension, hypertension, and metabolic syndrome (20–25). However, current evidence for the association between MetS-IR and prediabetes risk is still very limited; previous experience suggested that the associations between prediabetes risk and IR was significantly different between the sexes (26, 27). Therefore, this study aimed to retrospectively analyze the association and sex differences between MetS-IR and the risk of prediabetes based on a large cohort of the Chinese population.
The data of this retrospective cohort study comes from the database established by Rich Healthcare Group in China. The available study dataset has been shared in the Dryad public database by Chen et al. (https://datadryad.org/stash/dataset/doi:10.5061%2Fdryad.ft8750v). Under the Dryad public database service rules, all researchers can use the data set in the database for in-depth analysis and to provide new and useful research evidence without infringing on the rights of the dataset’s contributing authors. The retrospective cohort study design has been described in detail previously (28). Overall, subjects were adults recruited at 32 health examination centers in 11 Chinese cities between 2010 and 2016 who received at least two health check-ups during this period. In the original study, Chen et al. analyzed the relationship between body mass index (BMI) and diabetes. They excluded subjects diagnosed with diabetes at baseline, subjects who did not record height, weight, fasting plasma glucose (FPG), and sex information at baseline, subjects with extreme BMI, subjects with a follow-up interval of fewer than 2 years, and subjects whose diabetes status could not be determined during follow-up. This study aimed to further analyze the association between MetS-IR and prediabetes, and based on the previous study design by Chen et al., subjects with the following characteristics were further excluded: (1) FPG ≥ 5.6 mmol/L (ADA criteria) or 6.1 mmol/L (WHO criteria) at baseline (29, 30); (2) missing data for lipid-related parameters; (3) diagnosed diabetes mellitus or FPG > 6.9 mmol/L or missing FPG data during the observation period. Finally, 100,309 and 110,838 subjects were included in this study according to the ADA and WHO recommended diagnostic criteria for prediabetes (Figure 1), respectively. The main results of this study were obtained by analyzing the data of subjects screened by the ADA diagnostic criteria, while the data of subjects screened by the WHO diagnostic criteria was used as a sensitivity analysis to verify the reliability of the main analysis results. Given that this study was a secondary analysis of a previous study and that subject-identifying information was anonymized, the Ethics Committee of Jiangxi Provincial People’s Hospital waived informed consent from the subjects and also reviewed and approved the design of this study.
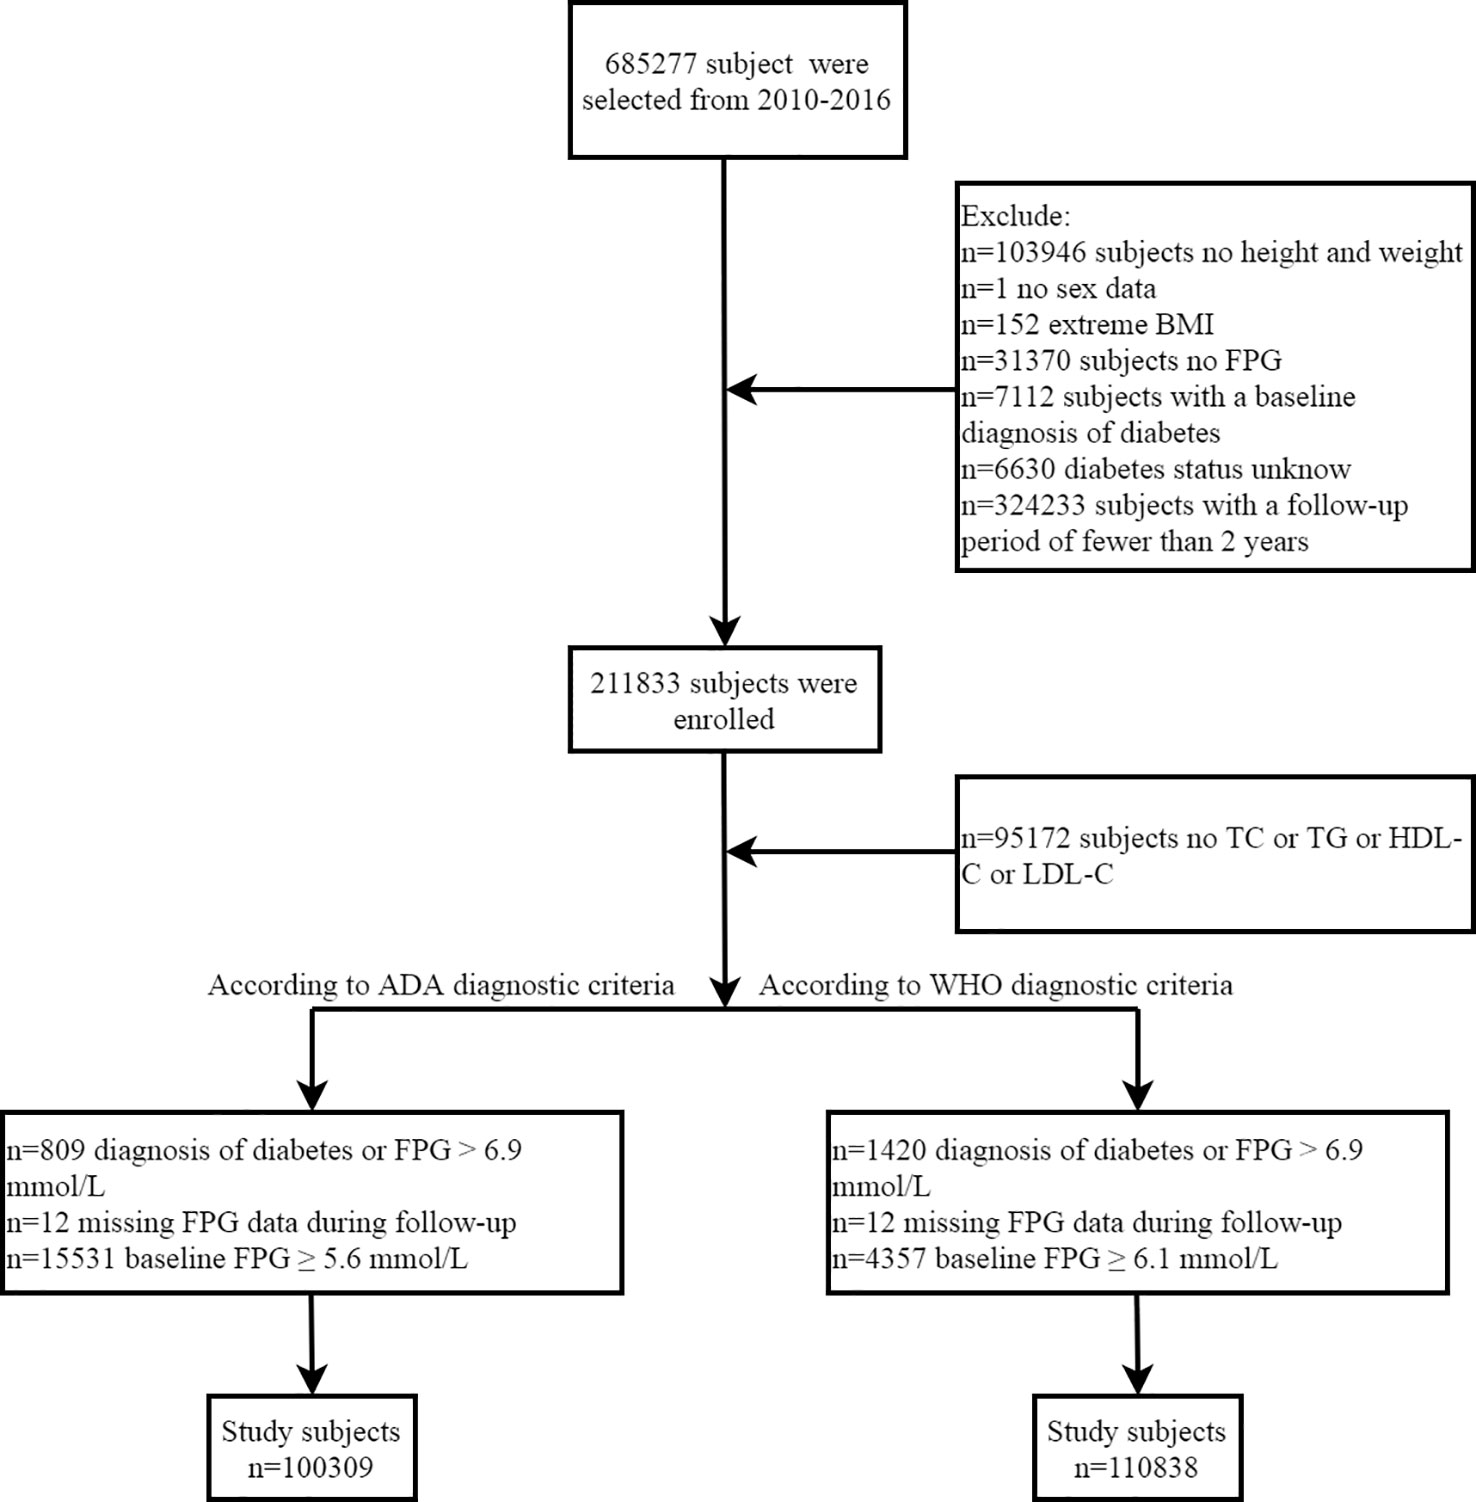
Figure 1 Flowchart of the selection process of study subjects.
When the subjects were interviewed, they were required to fill out a detailed questionnaire, which was used to record relevant demographic data, smoking and drinking information, past medical history, and family history of diabetes. Professional staff measured the subject’s height, weight, and blood pressure (BP) in a quiet environment; when measuring height and weight, participants were required to wear light clothing and take off their shoes and BP was measured with a standard mercury cuff sphygmomanometer. BMI was calculated by dividing the weight (kg) by the height (m) squared. Subjects were required to fast for at least 10 hours before collecting venous blood. After the blood samples were collected and sent for inspection, the medical staff measured the laboratory indicators of the participants on the automatic analyzer (Beckman 5800), including serum triglyceride (TG), total cholesterol (TC), low-density lipoprotein cholesterol (LDL-C), high-density lipoprotein cholesterol (HDL-C), FPG, alanine aminotransferase (ALT), aspartate aminotransferase (AST), blood urea nitrogen (BUN) and creatinine (Cr).
During the follow-up, according to the 2018 ADA diagnostic criteria for prediabetes, patients with prediabetes were defined as having an FPG between 5.6 and 6.9 mmol/L (29). Similarly, according to the WHO diagnostic criteria for prediabetes, prediabetes patients were defined as having an FPG between 6.1 and 6.9 mmol/L (30). The calculation formula of MetS-IR is as follows: (ln ((2 × FPG) + TG) × BMI)/(ln (HDL-C)) (16).
We summarized the baseline characteristics of subjects according to MetS-IR quintiles and whether they were diagnosed with prediabetes. Differences between groups for continuous variables were compared by the Kruskal-Wallis H test or one-way ANOVA, and the chi-square test was chosen for categorical variables.
Before building the Cox proportional hazards regression models, we assessed the feasibility of the modeling. (1) Collinearity diagnosis: the variance inflation factor (VIF) of covariates was calculated by multiple linear regression, and covariates with VIF greater than 5 were considered collinear covariates (Supplementary Table 1). (2) Proportional hazards assumption test: to determine whether the proportional hazards assumption was violated by observing whether the Kaplan-Meier curves of prediabetes corresponding to the MetS-IR quintiles constructed in both sexes are crossed.
According to the STROBE statement (31), we established 4 Cox regression models based on a stepwise adjustment strategy, calculated hazard ratios (HR) and 95% confidence intervals (CI) for the associations between MetS-IR and prediabetes in both sexes, and compare whether there were differences in MetS-IR related prediabetes risks in both sexes through likelihood ratio test, and judged whether there was interaction. Among the 4 models, the crude model did not adjust for any confounding factors; model I adjusted for age, height, family history of diabetes, smoking status and drinking status; model II further considered the influence of blood glucose, blood lipids, and BP based on model I; model III further adjusted for ALT, BUN, and Cr based on model II. In addition, we used the RCS (based on model III, with 5 nodes) nested in the Cox regression model for fitting the shape of the dose-response relationship between MetS-IR and the risk of prediabetes. If the RCS analysis shows that there is a nonlinear association between MetS-IR and prediabetes, the potential threshold or saturation effect point of the nonlinear association will be further calculated by the recursive method through segmental Cox regression.
In addition to performing the same association analysis in subjects included according to WHO criteria, we further considered the effects of BP, lipids, and family history of diabetes on prediabetes (32–34) and performed the same analysis in a population with normal BP, no family history of diabetes, and no hypertriglyceridemia.
The study included 100,309 Chinese adults (mean age 42.9 years, 51.97% men and 48.03% women) with normal blood glucose at baseline according to ADA prediabetes diagnostic criteria. Table 1 shows the baseline characteristics of the subjects grouped by MetS-IR quintiles of both sexes, where the intervals of the men MetS-IR quintiles were Q1 (22.36-37.48), Q2 (37.48-41.79), Q3 (41.79-45.78), Q4 (45.78-50.93) and Q5 (50.93-103.75); while the intervals of women MetS-IR quintiles were Q1 (20.97-32.01), Q2 (32.01-35.14), Q3 (35.14-38.39), Q4 (38.39-43.05), and Q5 (43.05-100.44), respectively. Compared with women, the values corresponding to the MetS-IR quintile intervals were relatively larger in men. In addition, we also found that with increasing MetS-IR quintiles in both sexes, the subjects’ age, height, weight, BMI, SBP, DBP, FPG, TC, TG, LDL-C, ALT, AST, Cr levels and the number with a family history of diabetes gradually increases, while the HDL-C levels gradually decreased (all P <0.05).
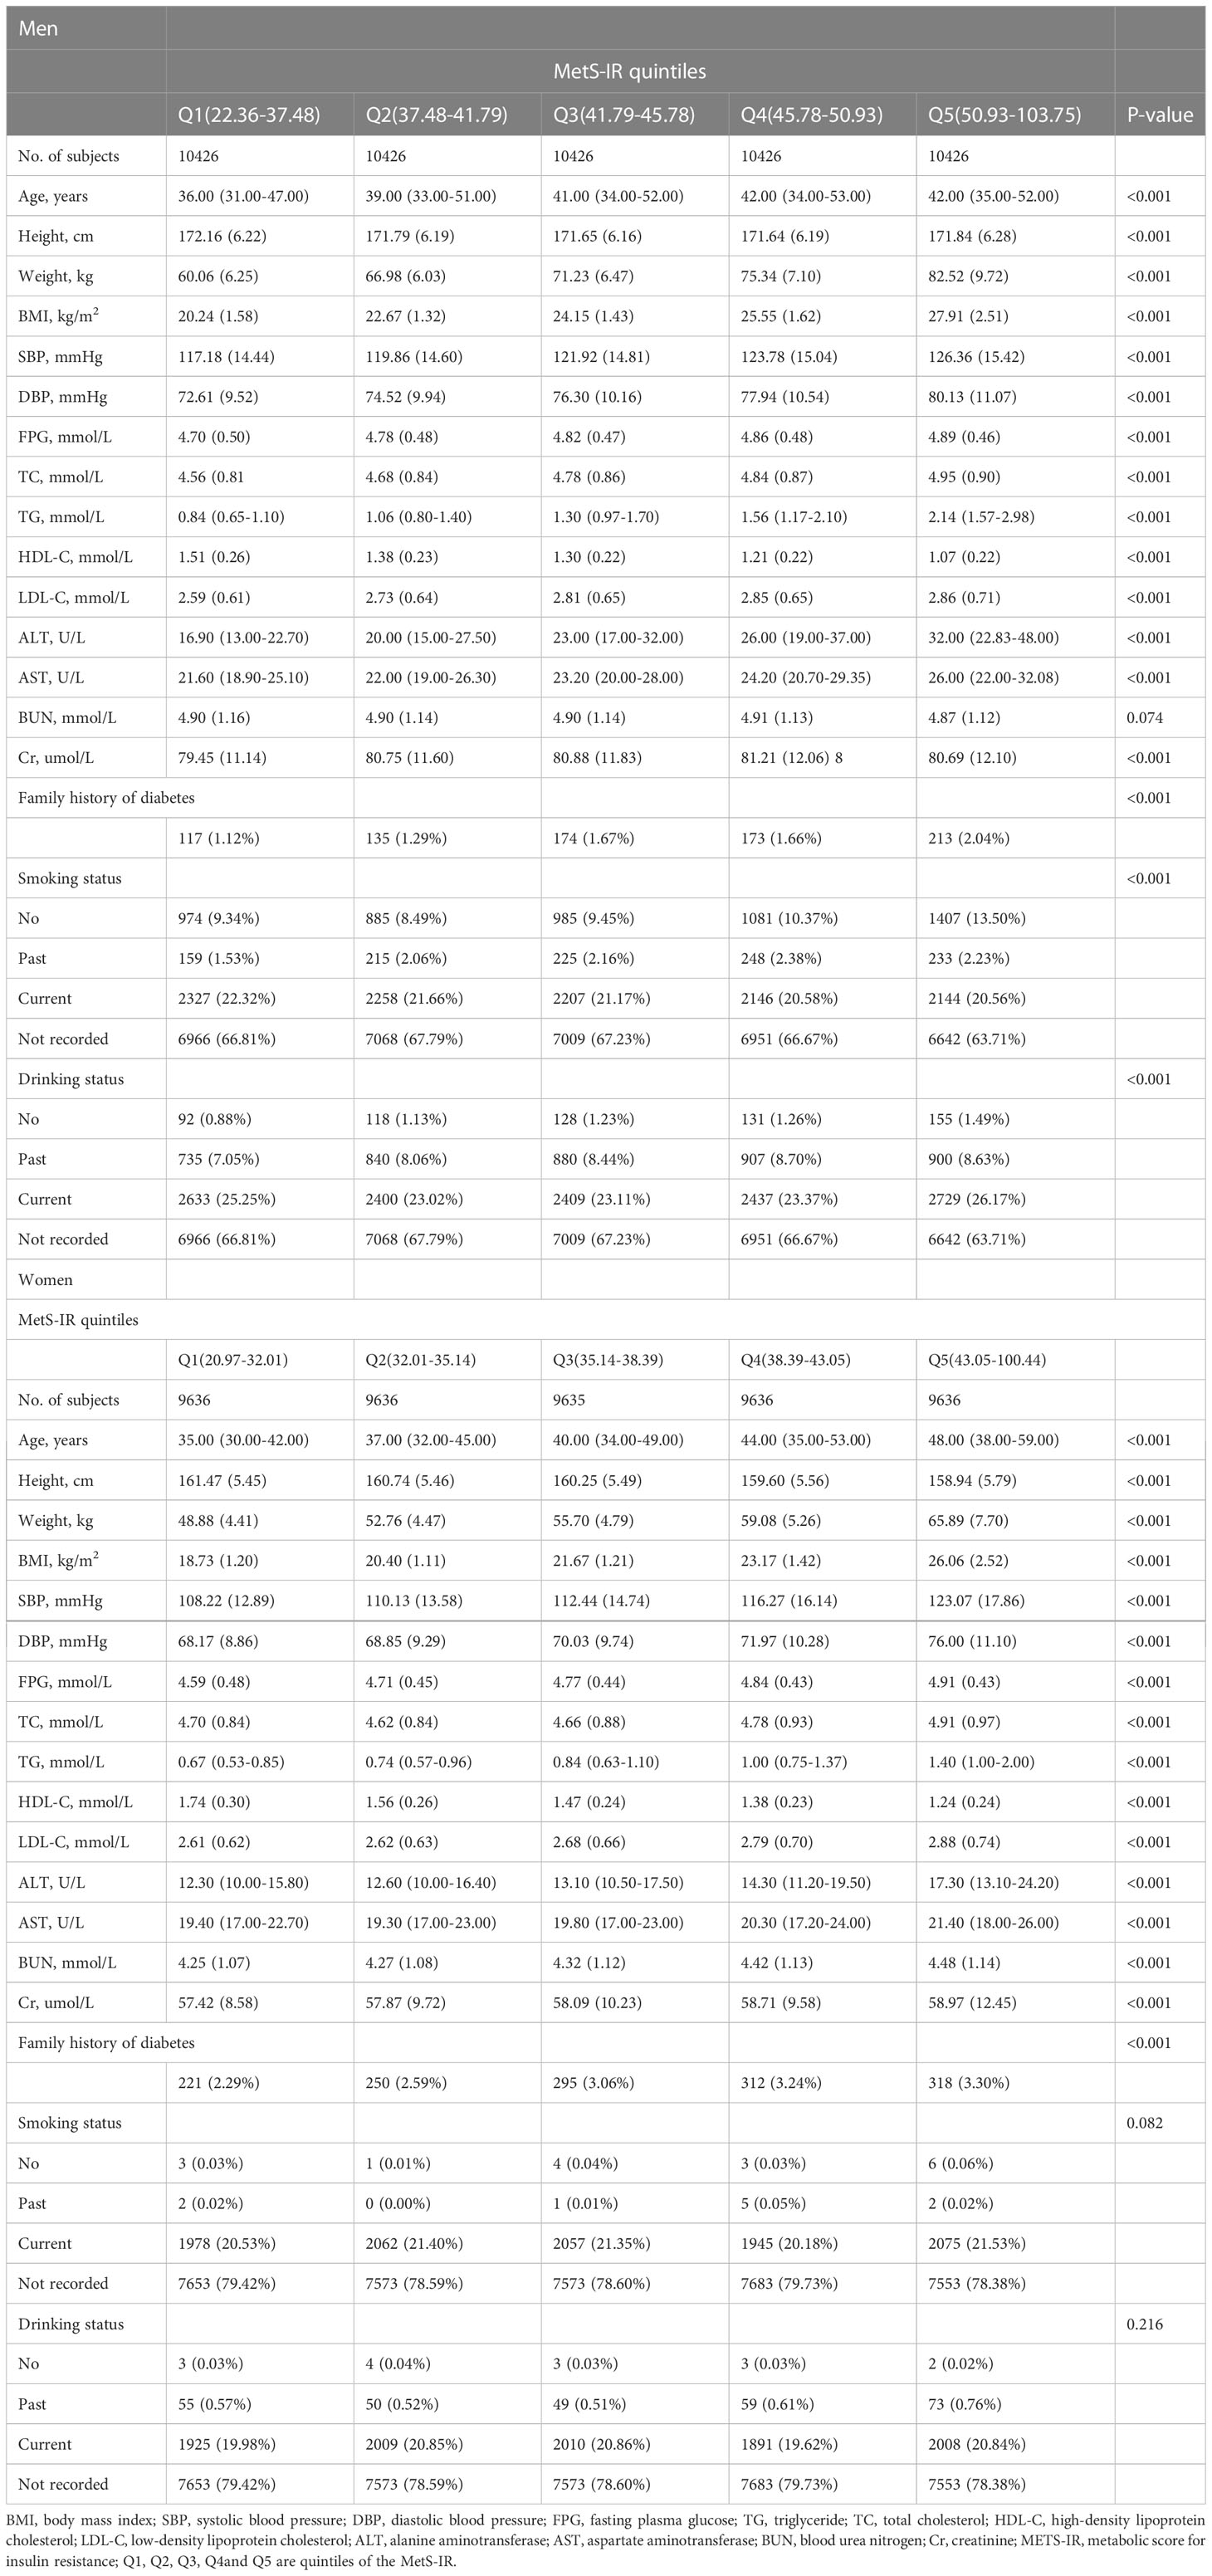
Table 1 Baseline characteristics of subjects grouped according to MetS-IR quintiles for both sexes.
During the observation period of 312,843 person-years, the incidence rate of prediabetes was 3948.31/100000 person-years, and the incidence rates of prediabetes in men and women were 4752.84/100000 person-years and 3073.24/100000 person-years, respectively. The Kaplan-Meier curves showed (Figure 2) that the cumulative hazard of prediabetes among the MetS-IR quintiles increased gradually without crossing each other, which was consistent with the proportional hazard assumption. Additionally, the covariates weight, BMI, and TC will not be included in the multivariate Cox regression models based on the requirement of VIF for the covariates.
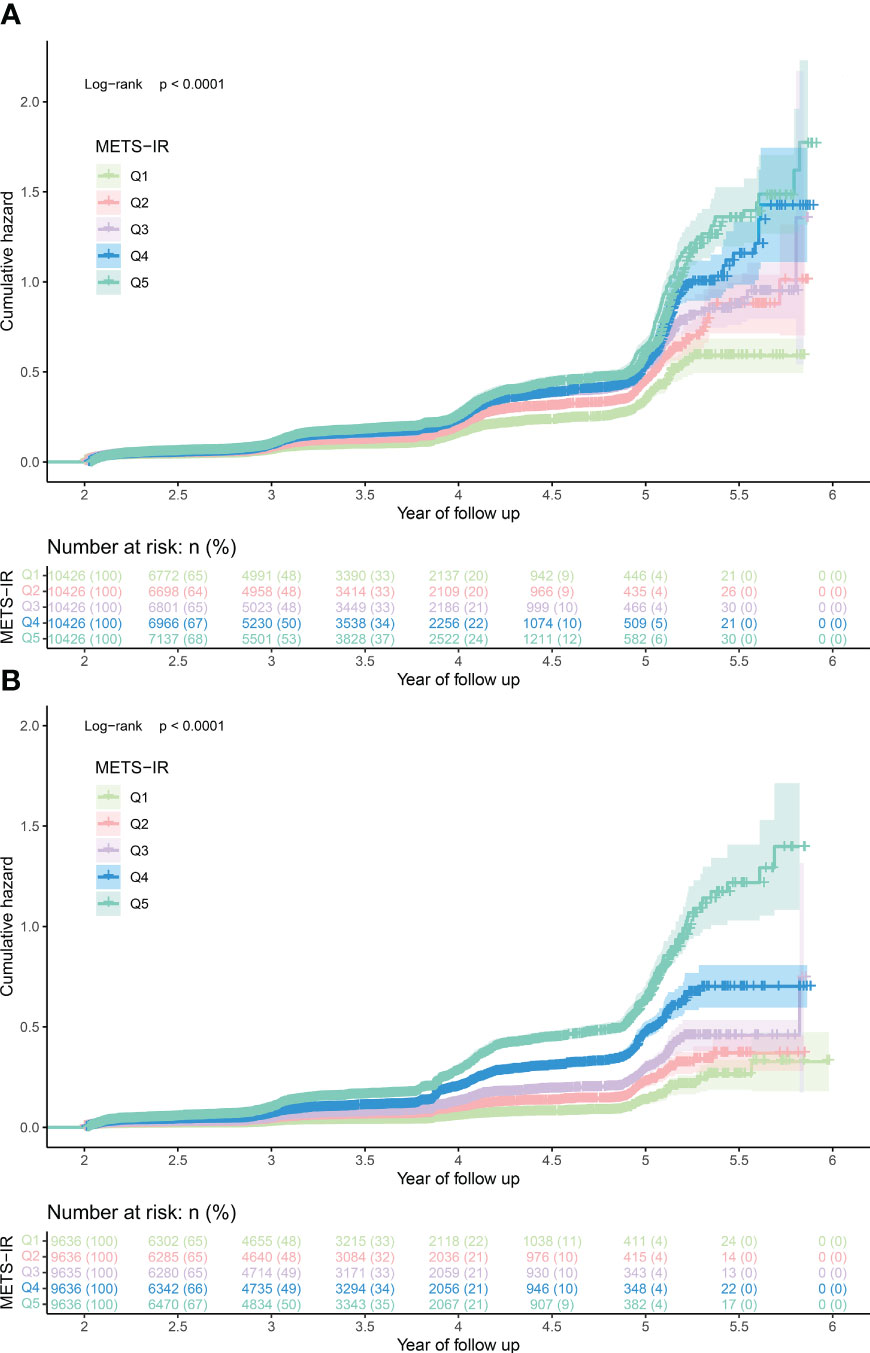
Figure 2 The cumulative hazard of prediabetes among the MetS-IR quintiles in men (A) and women (B). MetS-IR, metabolic score for insulin resistance.
Table 2 describes the clinical baseline characteristics of both sexes grouped according to whether they developed prediabetes during the observation period. In both sexes, people with prediabetes typically had higher levels of age, weight, BMI, SBP, DBP, Cr, BUN, AST, ALT, LDL-C, TG, TC, and MetS-IR, and a higher proportion of people with a family history of diabetes. In addition, women patients had relatively higher age, TC, and HDL-C, and relatively lower height, weight, BMI, ALT, AST, BUN, and Cr levels compared to men with prediabetes.
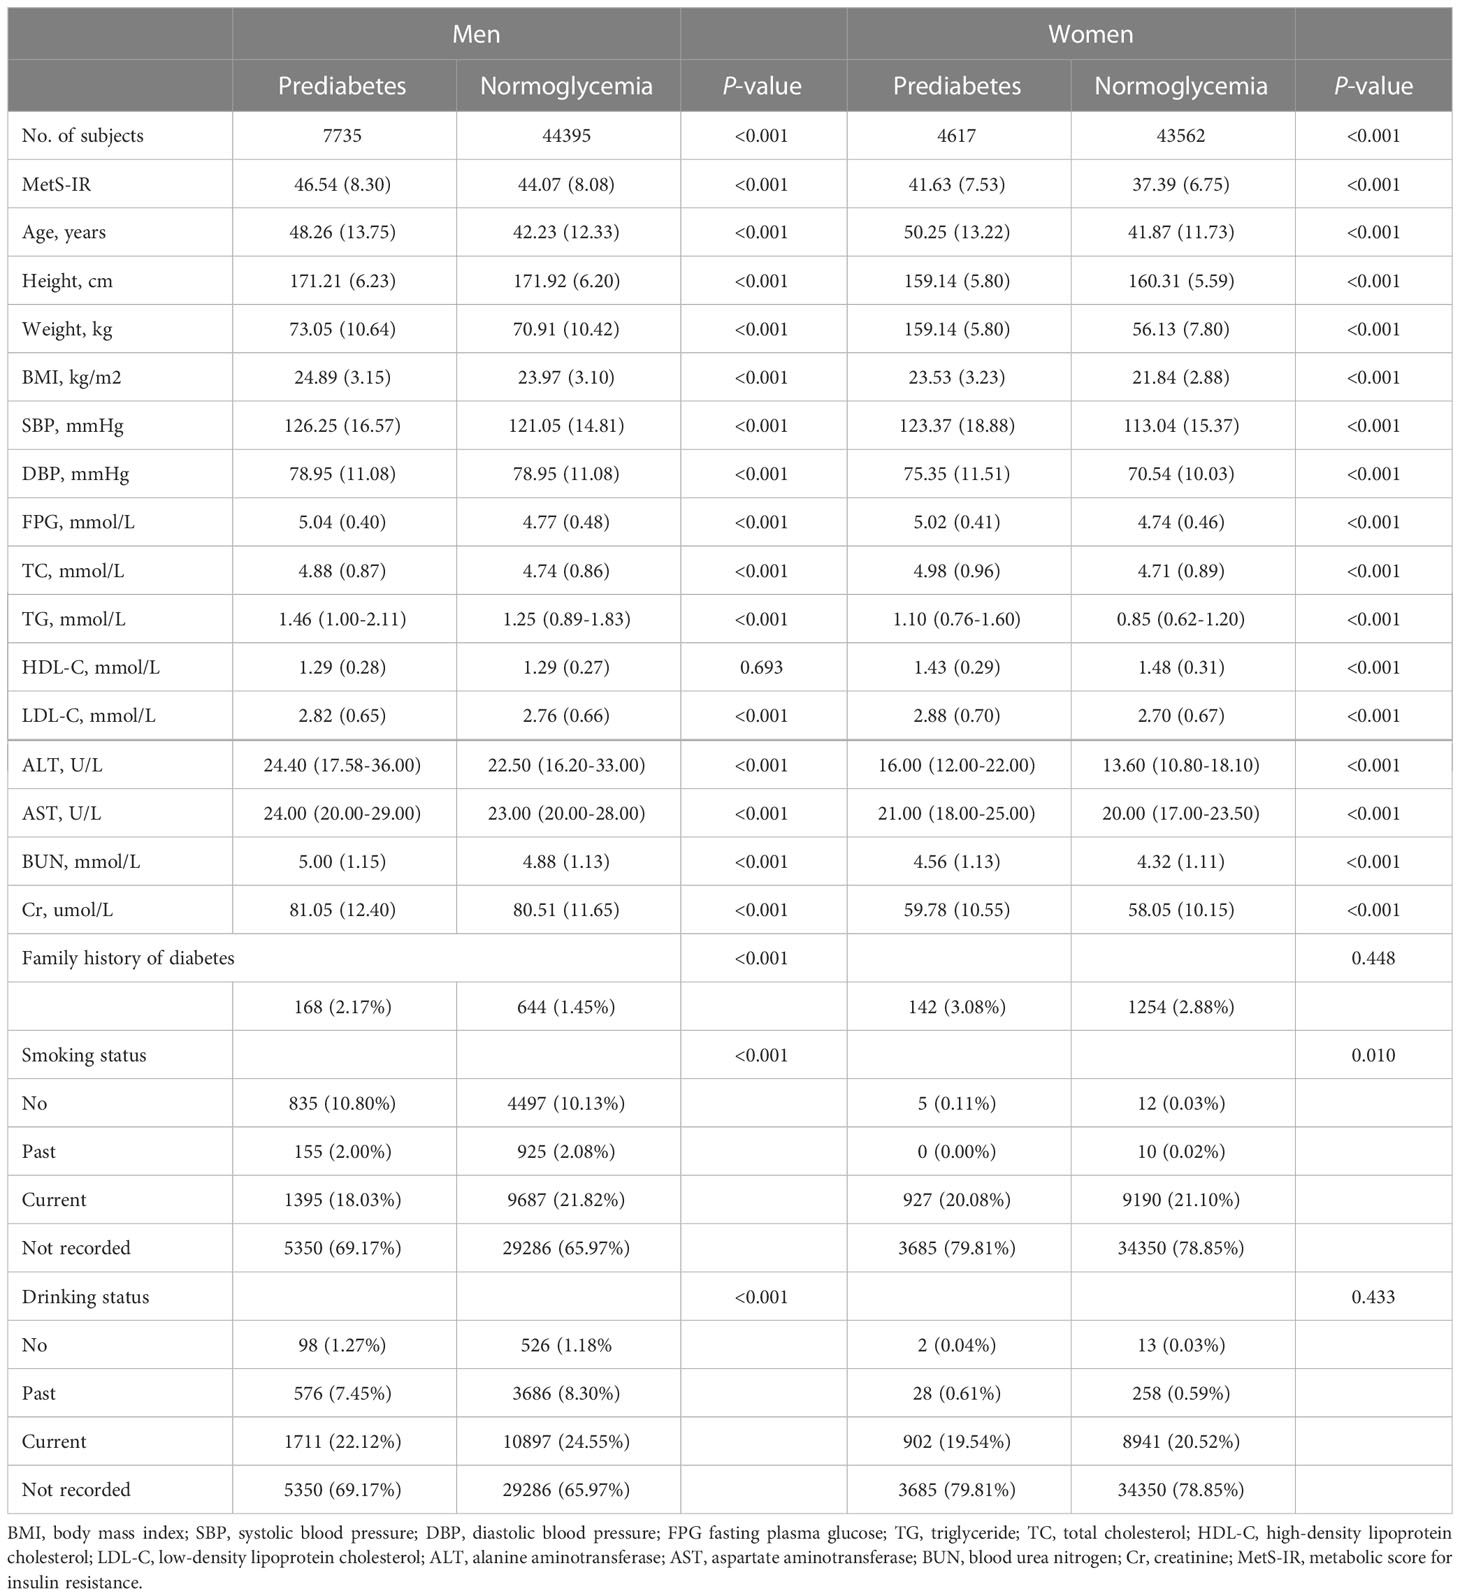
Table 2 Characteristics of the study participants with and without prediabetes.
Four Cox regression models were developed to investigate the association of MetS-IR with prediabetes and sex differences (Table 3). In the crude model, MetS-IR was positively associated with prediabetes in both sexes. However, in the models further adjusted for confounding factors (models I-III), the positive association between MetS-IR and prediabetes remained unchanged, and the degree of association was slightly weakened. In model III, each standard deviation increase in MetS-IR was associated with a 16% increased risk of prediabetes in men (HR: 1.16, 95%CI 1.12, 1.20, P-trend < 0.001), and each increase in MetS-IR standard deviation in women, the risk of prediabetes increased by 24% (HR: 1.24, 95%CI 1.19, 1.35, P-trend < 0.001). Additionally, the interaction test suggested that the risk of prediabetes associated with MetS-IR in women was higher than that in men (P-interaction < 0.0001).
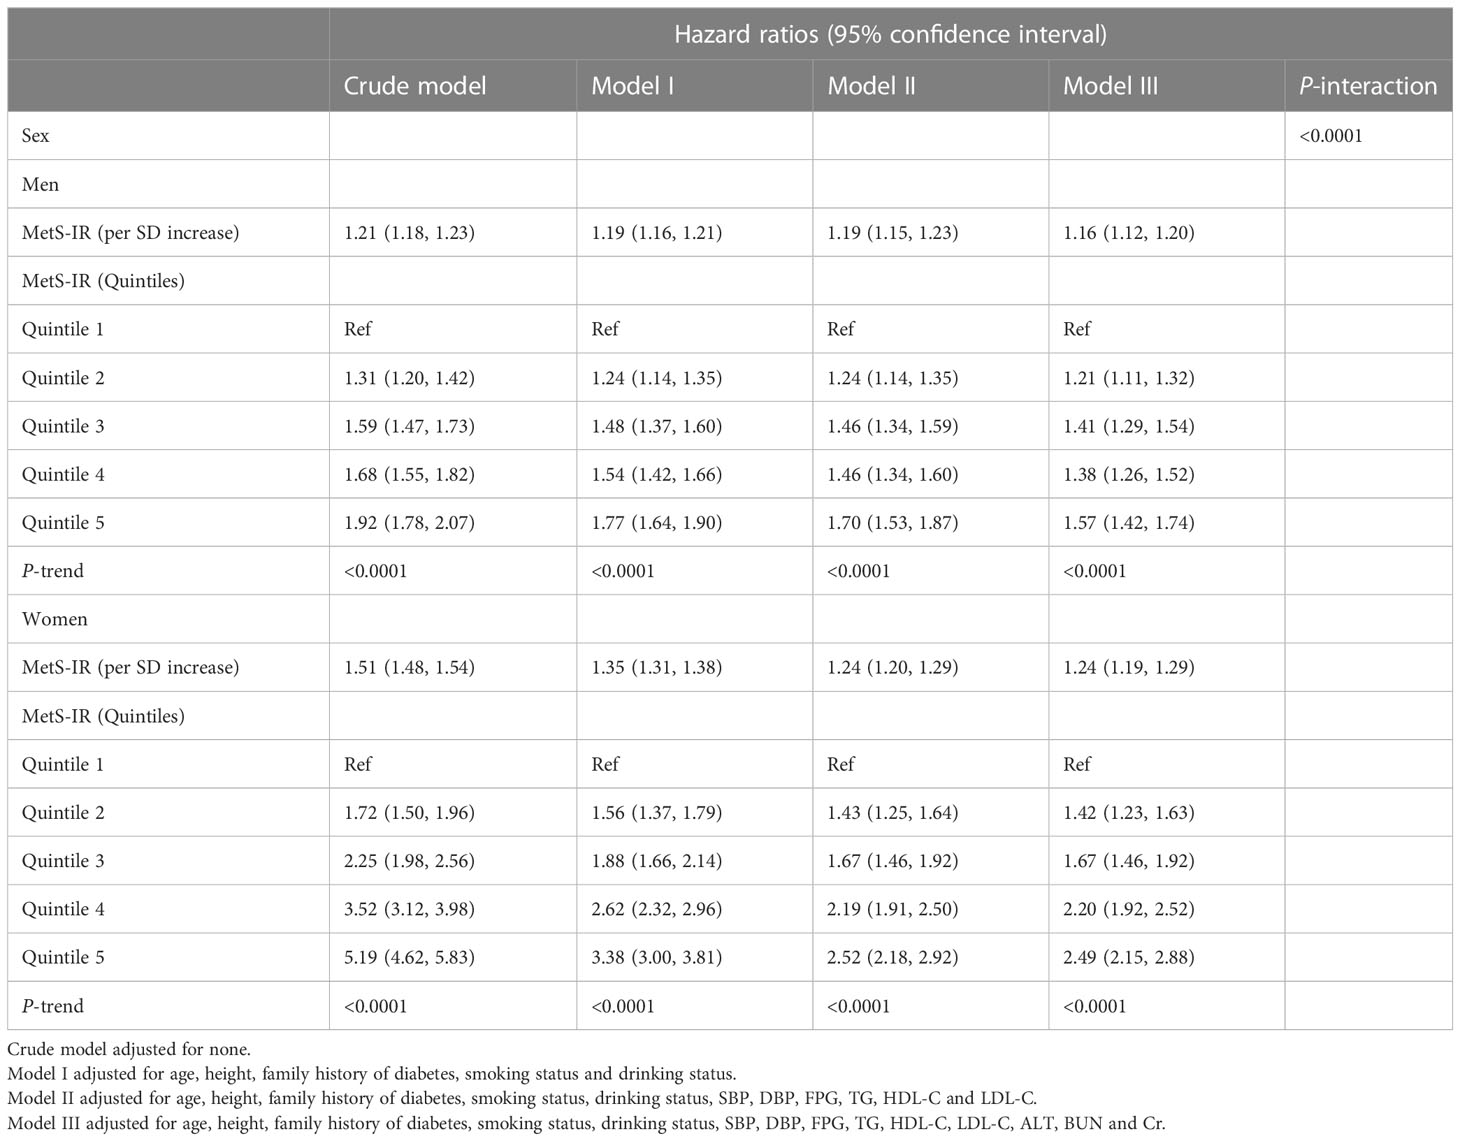
Table 3 Cox regression analyses for the association between MetS-IR and the incidence of prediabetes.
To further analyze the association between MetS-IR and the risk of prediabetes in both sexes, we fitted dose-response relationship curves for the association using RCS. As shown in Figure 3, the correlation between MetS-IR and prediabetes risk of both sexes was positive and nonlinear with an obvious saturation effect point, and when the MetS-IR was greater than the value of the saturation effect point, the risk of prediabetes was gradually leveling off. We further calculated the saturation effect points of MetS-IR used to evaluate the risk of prediabetes which in men was 42.82, and in women was 41.78 (Table 4).
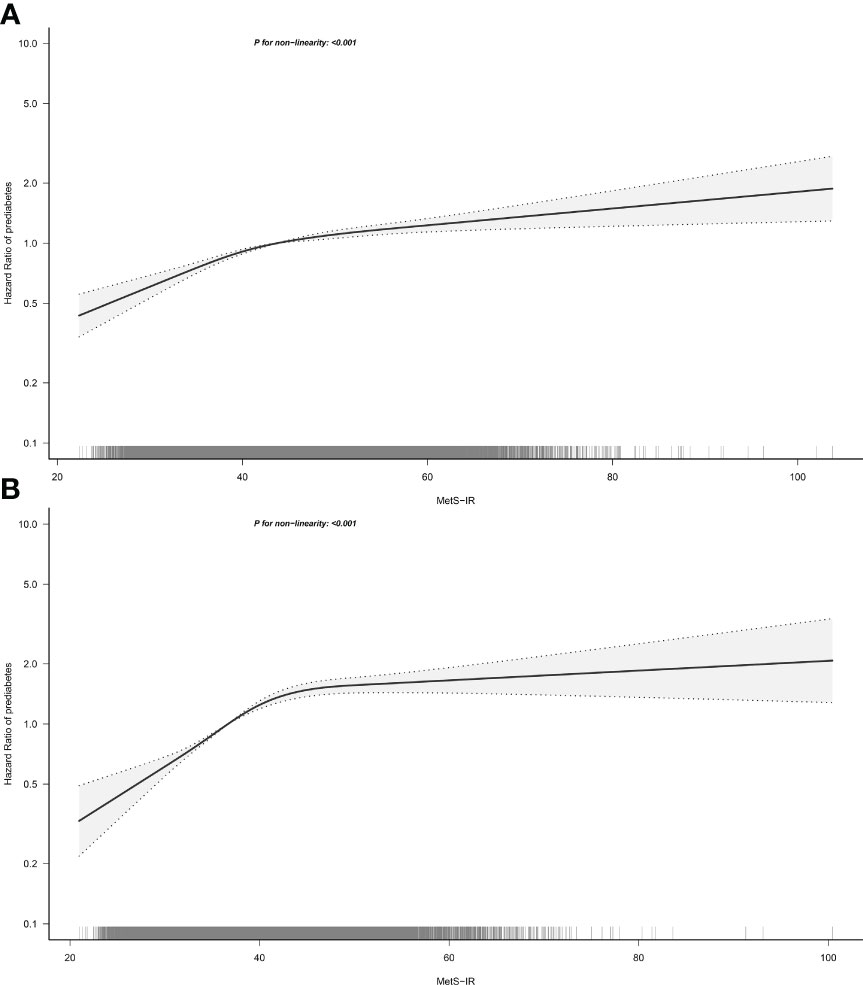
Figure 3 Hazard ratios for the nonlinear relationship between MetS-IR and the risk of prediabetes in men (A) and women (B). MetS-IR, metabolic score for insulin resistance. Adjusted for age, height, family history of diabetes, smoking status, drinking status, SBP, DBP, FPG, TG, HDL-C, LDL-C, ALT, BUN and Cr.
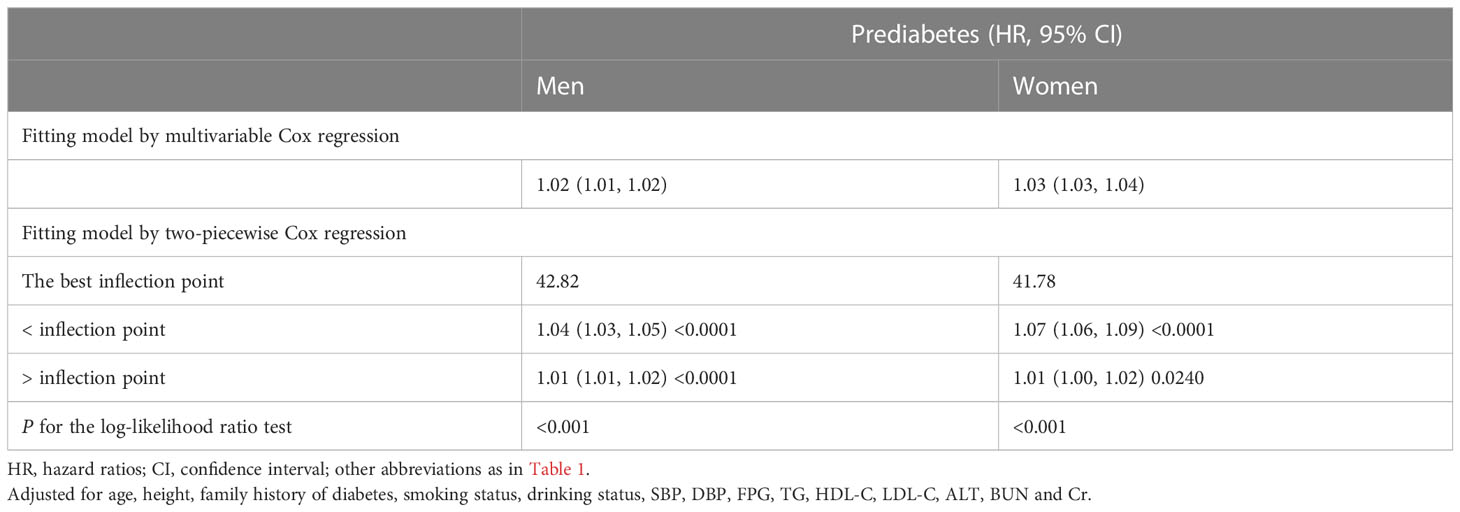
Table 4 Thresholds for predicted MetS-IR-related prediabetes risk.
To further demonstrate the stability of the results, we performed the following four sensitivity analyses: Sensitivity-1: subjects included under the standard definition according to WHO. Sensitivity-2: subjects with no family history of diabetes were retained. Sensitivity-3: excluded subjects with abnormal BP levels. Sensitivity-4: excluded subjects with abnormal TG levels. In the multiple sensitivity analysis (Table 5), all results were in general agreement with the main analysis, indicating the strong robustness of our results.
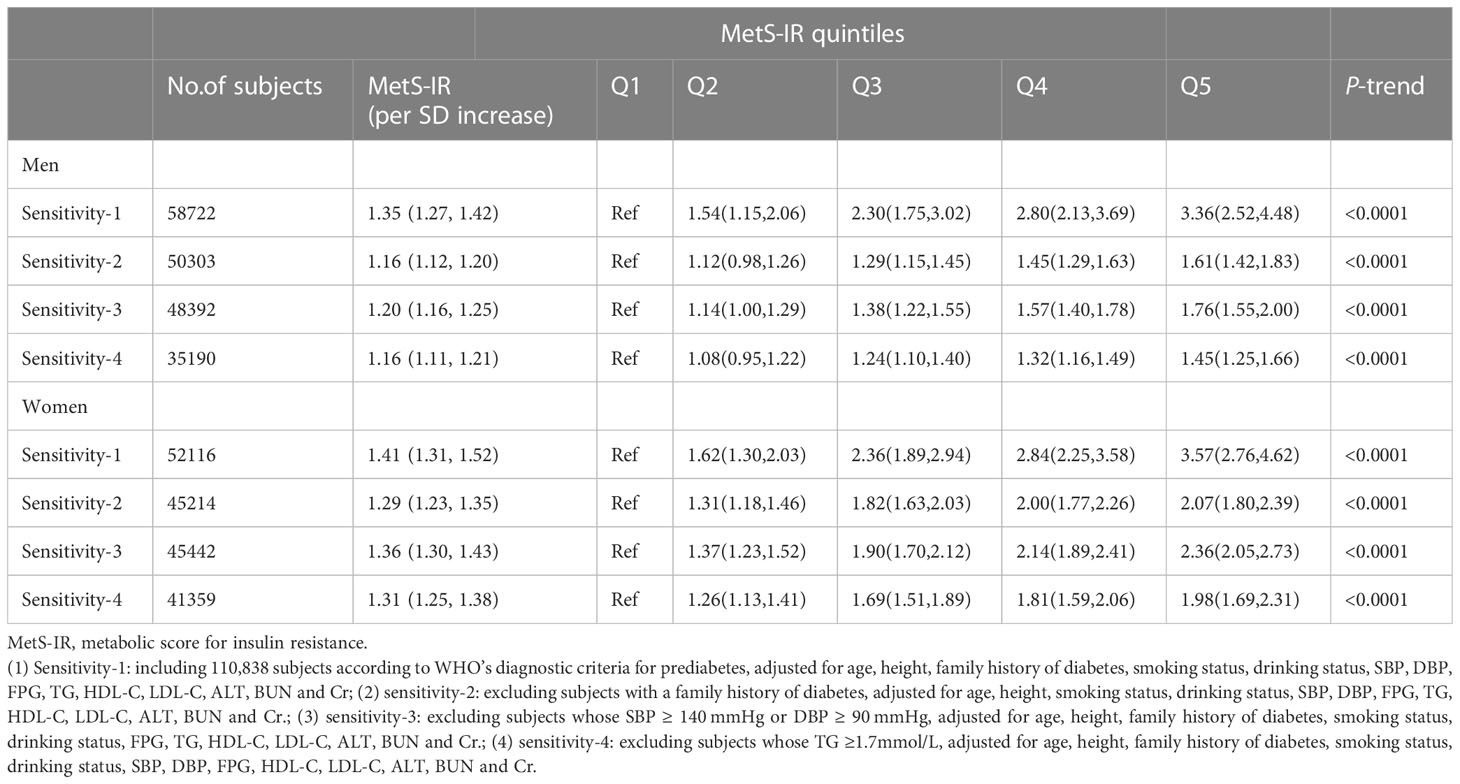
Table 5 Adjusted hazard ratios and 95% confidence intervals for prediabetes risk associated with the MetS-IR in different test populations: sensitivity analysis.
In this large longitudinal cohort study based on a Chinese population, our results supported an independently positive association between MetS-IR and the risk of prediabetes, with the magnitude of association stronger in women than in men. To our knowledge, this study is the first to discover a positive correlation between MetS-IR and prediabetes risk in Chinese adults.
The main pathophysiological changes in prediabetes are IR and early beta-cell failure (35). Like diabetes, prediabetes can also cause a variety of microvascular, macrovascular, and internal organ complications (1, 8–12). It is well known that cardiovascular disease is the main cause of fatal events in patients with diabetes (36), and related studies have reported that the risk of future cardiovascular disease can be predicted already in the pre-diabetic period (37, 38). The impact of prediabetes on the health of the general population is significant and, more disturbingly, and there is still a lack of adequate public awareness of prediabetes (39), which represents a huge challenge for the public health of society.
The hyperinsulinemic-euglycemic clamp is recognized as the gold standard for evaluating IR, but due to the relatively complicated measurement method, it cannot be widely used in large-scale epidemiological investigations; While MetS-IR, as a simple IR surrogate indicator, is considered to be widely used (16). The MetS-IR is a new score to assess cardiometabolic risk in healthy and high-risk subjects and a promising tool to screen for insulin sensitivity, as described by Bello-ChavollaOY et al. The value of this parameter has been confirmed in a large number of subsequent epidemiological investigations, including risk assessment and prediction of diabetes, NAFLD, hyperuricemia, prehypertension, and hypertension, hypertension combined with hyperuricemia, metabolic syndrome, and various chronic disease-related complications (16–25, 40). Also, it is worth noting that in a recent study by Li et al., who included 1,205 baseline normoglycemic subjects and evaluated the association between MetS-IR and prediabetes for the first time, their results showed that, MetS-IR was not significantly associated with prediabetes (17). And in the current study, based on a longitudinal cohort of more than 100, 000 ordinary people, we found that there was a positive correlation between MetS-IR and prediabetes. After fully controlling the influence of covariates, this correlation was still stable even in different populations. In addition to this, we found that the risk of prediabetes associated with MetS-IR was significantly higher in women than in men. Compared with the research results of Li et al. (17), the current study believed that there was a longitudinal correlation between MetS-IR and prediabetes, and there were obvious sex differences. For the results of Li et al. who did not find an association between MetS-IR and prediabetes, we consider the following reasons: (1) The relatively small sample size resulted in insufficient statistical power. (2) Combined with some results of the current study, TC and BMI were collinear variables of MetS-IR and should not be directly included in the multivariate Cox regression models for analysis. Therefore, based on the large sample size and strict statistical adjustment strategy of the current study, the relationship between MetS-IR and prediabetes can be considered to be longitudinally relevant.
The sex differences regarding the association between MetS-IR and prediabetes found in this study may be partially explained by the following two reasons. First, the main reason may be related to the fact that the majority of women diagnosed with prediabetes in this study were postmenopausal women (about 70% of women were over 50 years old). It is well known that estrogen is an important regulator of IR, and postmenopausal women are more prone to lipid disorders due to the lack of estrogen (41, 42), which in turn causes central fat deposition and abdominal obesity in postmenopausal women (43–45), and harmful lipid deposition promotes the development of prediabetes. Additionally, the literature reported that women are inherently more prone to IR, but sex hormones, environment, and good lifestyle factors can improve the “genetic disadvantage” of women (46). However, with aging, these “protective factors” gradually lose their effect, and the exposed “genetic disadvantage” makes women more likely to develop IR and develop prediabetes. Second, there are differences in body composition and physical activity levels between the sexes; women generally have higher fat mass and are less physically active than men (47, 48). Fat accumulation is known to cause deleterious effects on glucose metabolism and promote the development of IR in non-adipose tissue organs (49), and women generally have a relatively higher fat mass which may increase the risk of prediabetes. Furthermore, physical activity can promote the process of glucose metabolism, including increasing capillary perfusion to promote muscle glucose uptake, and increasing GLUT4 content in cell membranes to promote glucose transport from interstitium to muscle sarcolemma and t-tubules (50). Therefore, the relative lack of physical activity in women may inhibit the active process of glucose metabolism, thereby increasing the risk of prediabetes.
In the current study, we have identified a linear association between MetS-IR and prediabetes based on multivariate Cox regression models, a finding that was consistent with previous epidemiological studies (17). It should be noted, however, that the linear relationship assessed by Cox regression is more indicative of an overall positive relationship between MetS-IR and prediabetes, while some subtle changes cannot be judged. Therefore, we further fitted the dose-response relationship curves by RCS. As can be seen from Figure 3, there was indeed a positive correlation between MetS-IR and prediabetes and a saturation effect point for the correlation. When the MetS-IR in men was greater than 42.82 or the MetS-IR in women was greater than 41.78, the risk of prediabetes almost did not increase. Similar findings were also reported in the previous study by Cai et al. (20), who studied the relationship between MetS-IR and NAFLD in non-obese people and finally found that there was an obvious saturation effect point between MetS-IR and NAFLD, which was calculated to be 36. These new findings based on nonlinear analysis may more accurately show the actual relationship between MetS-IR and prediabetes, and nonlinear analysis should be applied in more association analyses.
The findings of this study provided new evidence for the prevention of prediabetes. Previous experience suggested that a good lifestyle and appropriate use of lipid-lowering drugs are effective strategies to regulate lipid metabolism disorders (51), while the treatment of obesity mainly relies on lifestyle changes, anti-obesity drugs and even bariatric surgery (52). Additionally, the consumption of low-energy foods (such as fresh vegetables, fruits, seaweed, etc.) has a protective effect on lipid metabolism disorders, especially for postmenopausal women (44). Therefore, the present study may provide some suggestions for the prevention of prediabetes: (1) Based on the present findings, a simple indicator, MetS-IR, may be selected to screen people at high risk of prediabetes, especially women. (2) Individuals with high MetS-IR calculated in clinical or physical examinations can be appropriately intervened. We recommend that they should change their irrational lifestyle and try to choose a low-energy diet as well as take the necessary medications to prevent the development of prediabetes (53).
Strengths of this study: (1) This study is the first to discover a positive association between MetS-IR and prediabetes and to confirm that there were sex differences in the association, findings that further enriched the understanding of risk factors for prediabetes. (2) The study population covers different regions and age groups in China and has a large sample size, with a good representation of the Chinese population. (3) A series of sensitivity analyses were conducted in this study to emphasize the robustness of the main results. (4) In this study, a nonlinear relationship between MetS-IR and prediabetes was found for the first time, and the potential saturation effect points were calculated. These findings may provide useful evidence for the prevention of prediabetes.
Limitations: (1) The present study relied only on FPG for the diagnosis of prediabetes, which may have underestimated the true prevalence of prediabetes; however, the present study still found a correlation between MetS-IR and the risk of prediabetes, which in fact rather further confirms the reliability of the findings of the present study. (2) Due to this study is a retrospective observational study, the covariates collected are relatively limited, so some important risk/protective factors may have not been evaluated, and there is a certain residual confounding. (3) Although the subjects in the current study come from different cities (Beijing, Shanghai, Nanjing, Suzhou, Changzhou, Nantong, Hefei, Wuhan, Chengdu, Guangzhou, and Shenzhen), all of these cities are relatively developed regions and are southern cities except for Beijing. Therefore, further studies on the applicability of MetS-IR in northern and rural populations may be needed. (4) The follow-up time of this study is short, and prospective studies with a longer follow-up time are needed to verify the stability of the current research results. (5) It should be noted that the smoking and drinking status of many subjects in the current study was not recorded. Since smoking and drinking are potential confounding factors, the missing data on these two variables may affect the control of confounding bias, which may have some influence on the research results.
In this longitudinal study based on a large sample population in China, we found that MetS-IR was positively and independently associated with the risk of prediabetes; furthermore, women were at higher risk of MetS-IR-related prediabetes compared to men. These new insights may provide a useful reference for the primary prevention of prediabetes and can guide individuals at high risk for abnormal blood glucose metabolism to reduce the risk of developing prediabetes by improving behavior and lifestyle at an early stage.
The datasets presented in this study can be found in online repositories. The names of the repository/repositories and accession number(s) can be found in the article/Supplementary Material.
The studies involving human participants were reviewed and approved by the Ethics Committee of Jiangxi Provincial People’s Hospital. Written informed consent for participation was not required for this study in accordance with the national legislation and the institutional requirements.
YZ made the study design. All authors conducted the study. QX, MK and SL analyzed the data and wrote the manuscript. YZ attended the manuscript revision. All authors agreed with the final manuscript.
This study was supported by the Natural Science Foundation of Jiangxi Province (No. 20192BAB205007) and Jiangxi Provincial Education Department foundation Project (No. GJJ218911) and Applied Research and Cultivation Program of Jiangxi Provincial Department of Science and Technology (No. 20212BAG70036) and Shanghai Hutchison Pharmaceuticals Research Fund (No. 2019009) and National Key Research and Development Program “Modernization Research of Traditional Chinese Medicine”, (No.2017YFC1700500).
We thank all participants in this study.
The authors declare that the research was conducted in the absence of any commercial or financial relationships that could be construed as a potential conflict of interest.
All claims expressed in this article are solely those of the authors and do not necessarily represent those of their affiliated organizations, or those of the publisher, the editors and the reviewers. Any product that may be evaluated in this article, or claim that may be made by its manufacturer, is not guaranteed or endorsed by the publisher.
The Supplementary Material for this article can be found online at: https://www.frontiersin.org/articles/10.3389/fendo.2023.1175988/full#supplementary-material
1. Tabák AG, Herder C, Rathmann W, Brunner EJ, Kivimäki M. Prediabetes: a high-risk state for diabetes development. Lancet (2012) 379(9833):2279–90. doi: 10.1016/S0140-6736(12)60283-9
2. Mainous AG 3rd, Tanner RJ, Baker R, Zayas CE, Harle CA. Prevalence of prediabetes in England from 2003 to 2011: population-based, cross-sectional study. BMJ Open (2014) 4(6):e005002. doi: 10.1136/bmjopen-2014-005002
3. Anjana RM, Deepa M, Pradeepa R, Mahanta J, Narain K, Das HK, et al. Prevalence of diabetes and prediabetes in 15 states of India: results from the ICMR-INDIAB population-based cross-sectional study. Lancet Diabetes Endocrinol (2017) 5(8):585–96. doi: 10.1016/S2213-8587(17)30174-2
4. Basit A, Fawwad A, Qureshi H, Shera AS, NDSP Members. Prevalence of diabetes, pre-diabetes and associated risk factors: second national diabetes survey of Pakistan (NDSP), 2016-2017. BMJ Open (2018) 8(8):e020961. doi: 10.1136/bmjopen-2017-020961
5. Hilawe EH, Chiang C, Yatsuya H, Wang C, Ikerdeu E, Honjo K, et al. Prevalence and predictors of prediabetes and diabetes among adults in Palau: population-based national STEPS survey. Nagoya J Med Sci (2016) 78(4):475–83. doi: 10.18999/nagjms.78.4.475
6. Wang L, Gao P, Zhang M, Huang Z, Zhang D, Deng Q, et al. Prevalence and ethnic pattern of diabetes and prediabetes in China in 2013. JAMA (2017) 317(24):2515–23. doi: 10.1001/jama.2017.7596
7. Khan RMM, Chua ZJY, Tan JC, Yang Y, Liao Z, Zhao Y. From pre-diabetes to diabetes: diagnosis, treatments and translational research. Med (Kaunas) (2019) 55(9):546. doi: 10.3390/medicina55090546
8. Artunc F, Schleicher E, Weigert C, Fritsche A, Stefan N, Häring HU. The impact of insulin resistance on the kidney and vasculature. Nat Rev Nephrol (2016) 12(12):721–37. doi: 10.1038/nrneph.2016.145
9. Blázquez E, Velázquez E, Hurtado-Carneiro V, Ruiz-Albusac JM. Insulin in the brain: its pathophysiological implications for states related with central insulin resistance, type 2 diabetes and alzheimer’s disease. Front Endocrinol (Lausanne) (2014) 5:161. doi: 10.3389/fendo.2014.00161
10. Forno E, Han YY, Muzumdar RH, Celedón JC. Insulin resistance, metabolic syndrome, and lung function in US adolescents with and without asthma. J Allergy Clin Immunol (2015) 136(2):304–11.e8. doi: 10.1016/j.jaci.2015.01.010
11. de la Monte SM. Insulin resistance and neurodegeneration: progress towards the development of new therapeutics for alzheimer’s disease. Drugs (2017) 77(1):47–65. doi: 10.1007/s40265-016-0674-0
12. Hill MA, Yang Y, Zhang L, Sun Z, Jia G, Parrish AR, et al. Insulin resistance, cardiovascular stiffening and cardiovascular disease. Metabolism (2021) 119:154766. doi: 10.1016/j.metabol.2021.154766
13. Feldman EL, Nave KA, Jensen TS, Bennett DLH. New horizons in diabetic neuropathy: mechanisms, bioenergetics, and pain. Neuron (2017) 93(6):1296–313. doi: 10.1016/j.neuron.2017.02.005
14. Dall TM, Yang W, Gillespie K, Mocarski M, Byrne E, Cintina I, et al. The economic burden of elevated blood glucose levels in 2017: diagnosed and undiagnosed diabetes, gestational diabetes mellitus, and prediabetes. Diabetes Care (2019) 42(9):1661–8. doi: 10.2337/dc18-1226
15. Ormazabal V, Nair S, Elfeky O, Aguayo C, Salomon C, Zuñiga FA. Association between insulin resistance and the development of cardiovascular disease. Cardiovasc Diabetol (2018) 17(1):122. doi: 10.1186/s12933-018-0762-4
16. Bello-Chavolla OY, Almeda-Valdes P, Gomez-Velasco D, Viveros-Ruiz T, Cruz-Bautista I, Romo-Romo A, et al. METS-IR, a novel score to evaluate insulin sensitivity, is predictive of visceral adiposity and incident type 2 diabetes. Eur J Endocrinol (2018) 178(5):533–44. doi: 10.1530/EJE-17-0883
17. Li X, Xue Y, Dang Y, Liu W, Wang Q, Zhao Y, et al. Association of non-Insulin-Based insulin resistance indices with risk of incident prediabetes and diabetes in a Chinese rural population: a 12-year prospective study. Diabetes Metab Syndr Obes (2022) 15:3809–19. doi: 10.2147/DMSO.S385906
18. Cai XT, Zhu Q, Liu SS, Wang MR, Wu T, Hong J, et al. Associations between the metabolic score for insulin resistance index and the risk of type 2 diabetes mellitus among non-obese adults: insights from a population-based cohort study. Int J Gen Med (2021) 14:7729–40. doi: 10.2147/IJGM.S336990
19. Zhang M, Liu D, Qin P, Liu Y, Sun X, Li H, et al. Association of metabolic score for insulin resistance and its 6-year change with incident type 2 diabetes mellitus. J Diabetes (2021) 13(9):725–34. doi: 10.1111/1753-0407.13161
20. Cai X, Gao J, Hu J, Wen W, Zhu Q, Wang M, et al. Dose-response associations of metabolic score for insulin resistance index with nonalcoholic fatty liver disease among a nonobese Chinese population: retrospective evidence from a population-based cohort study. Dis Markers (2022) 2022:4930355. doi: 10.1155/2022/4930355
21. Lee JH, Park K, Lee HS, Park HK, Han JH, Ahn SB. The usefulness of metabolic score for insulin resistance for the prediction of incident non-alcoholic fatty liver disease in Korean adults. Clin Mol Hepatol (2022) 28(4):814–26. doi: 10.3350/cmh.2022.0099
22. Liu XZ, Xu X, Zhu JQ, Zhao DB. Association between three non-insulin-based indexes of insulin resistance and hyperuricemia. Clin Rheumatol (2019) 38(11):3227–33. doi: 10.1007/s10067-019-04671-6
23. Han KY, Gu J, Wang Z, Liu J, Zou S, Yang CX, et al. Association between METS-IR and prehypertension or hypertension among normoglycemia subjects in Japan: a retrospective study. Front Endocrinol (Lausanne) (2022) 13:851338. doi: 10.3389/fendo.2022.851338
24. Li Y, You A, Tomlinson B, Yue L, Zhao K, Fan H, et al. Insulin resistance surrogates predict hypertension plus hyperuricemia. J Diabetes Investig (2021) 12(11):2046–53. doi: 10.1111/jdi.13573
25. Mirr M, Skrypnik D, Bogdański P, Owecki M. Newly proposed insulin resistance indexes called TyG-NC and TyG-NHtR show efficacy in diagnosing the metabolic syndrome. J Endocrinol Invest (2021) 44(12):2831–43. doi: 10.1007/s40618-021-01608-2
26. Geer EB, Shen W. Gender differences in insulin resistance, body composition, and energy balance. Gend Med (2009) 6 Suppl 1(Suppl 1):60–75. doi: 10.1016/j.genm.2009.02.002
27. Mauvais-Jarvis F. Gender differences in glucose homeostasis and diabetes. Physiol Behav (2018) 187:20–3. doi: 10.1016/j.physbeh.2017.08.016
28. Chen Y, Zhang XP, Yuan J, Cai B, Wang XL, Wu XL, et al. Association of body mass index and age with incident diabetes in Chinese adults: a population-based cohort study. BMJ Open (2018) 8(9):e021768. doi: 10.1136/bmjopen-2018-021768
29. American Diabetes Association. Classification and diagnosis of diabetes: standards of medical care in diabetes-2018. Diabetes Care (2018) 41(Suppl 1):S13–27. doi: 10.2337/dc18-S002
30. Alberti KG, Zimmet PZ. Definition, diagnosis and classification of diabetes mellitus and its complications. part 1: diagnosis and classification of diabetes mellitus provisional report of a WHO consultation. Diabetes Med (1998) 15(7):539–53. doi: 10.1002/(SICI)1096-9136(199807)15:7<539::AID-DIA668>3.0.CO;2-S
31. Fitchett EJA, Seale AC, Vergnano S, Sharland M, Heath PT, Saha SK, et al. Strengthening the reporting of observational studies in epidemiology for newborn infection (STROBE-NI): an extension of the STROBE statement for neonatal infection research. Lancet Infect Dis (2016) 16(10):e202–13. doi: 10.1016/S1473-3099(16)30082-2
32. Buysschaert M, Medina JL, Bergman M, Shah A, Lonier J. Prediabetes and associated disorders. Endocrine (2015) 48(2):371–93. doi: 10.1007/s12020-014-0436-2
33. Zhao M, Lin H, Yuan Y, Wang F, Xi Y, Wen LM, et al. Prevalence of pre-diabetes and its associated risk factors in rural areas of ningbo, China. Int J Environ Res Public Health (2016) 13(8):808. doi: 10.3390/ijerph13080808
34. Ustulin M, Rhee SY, Chon S, Ahn KK, Lim JE, Oh B, et al. Importance of family history of diabetes in computing a diabetes risk score in Korean prediabetic population. Sci Rep (2018) 8(1):15958. doi: 10.1038/s41598-018-34411-w
36. Baum A, Scarpa J, Bruzelius E, Tamler R, Basu S, Faghmous J. Targeting weight loss interventions to reduce cardiovascular complications of type 2 diabetes: a machine learning-based post-hoc analysis of heterogeneous treatment effects in the look AHEAD trial. Lancet Diabetes Endocrinol (2017) 5(10):808–15. doi: 10.1016/S2213-8587(17)30176-6
37. Zand A, Ibrahim K, Patham B. Prediabetes: why should we care? Methodist Debakey Cardiovasc J (2018) 14(4):289–97. doi: 10.14797/mdcj-14-4-289
38. Haffner SM, Stern MP, Hazuda HP, Mitchell BD, Patterson JK. Cardiovascular risk factors in confirmed prediabetic individuals. does the clock for coronary heart disease start ticking before the onset of clinical diabetes? JAMA (1990) 263(21):2893–8. doi: 10.1001/jama.263.21.2893
39. Cefalu WT. “Prediabetes”: are there problems with this label? no, we need heightened awareness of this condition! Diabetes Care (2016) 39(8):1472–7. doi: 10.2337/dc16-1143
40. Wang Z, Xie J, Wang J, Feng W, Liu N, Liu Y. Association between a novel metabolic score for insulin resistance and mortality in people with diabetes. Front Cardiovasc Med (2022) 9:895609. doi: 10.3389/fcvm.2022.895609
41. Meyer MR, Clegg DJ, Prossnitz ER, Barton M. Obesity, insulin resistance and diabetes: sex differences and role of oestrogen receptors. Acta Physiol (Oxf) (2011) 203(1):259–69. doi: 10.1111/j.1748-1716.2010.02237.x
42. Li S, Ma L, Song Y, Zheng J, Cai Y, Xu H, et al. Effects of hormone replacement therapy on glucose and lipid metabolism in peri- and postmenopausal women with a history of menstrual disorders. BMC Endocr Disord (2021) 21(1):121. doi: 10.1186/s12902-021-00784-9
43. Ko SH, Jung Y. Energy metabolism changes and dysregulated lipid metabolism in postmenopausal women. Nutrients (2021) 13(12):4556. doi: 10.3390/nu13124556
44. Ko SH, Kim HS. Menopause-associated lipid metabolic disorders and foods beneficial for postmenopausal women. Nutrients (2020) 12(1):202. doi: 10.3390/nu12010202
45. Toth MJ, Tchernof A, Sites CK, Poehlman ET. Effect of menopausal status on body composition and abdominal fat distribution. Int J Obes Relat Metab Disord (2000) 24(2):226–31. doi: 10.1038/sj.ijo.0801118
46. Mittendorfer B. Insulin resistance: sex matters. Curr Opin Clin Nutr Metab Care (2005) 8(4):367–72. doi: 10.1097/01.mco.0000172574.64019.98
47. Kautzky-Willer A, Harreiter J, Abrahamian H, Weitgasser R, Fasching P, Hoppichler F, et al. Geschlechtsspezifische aspekte bei prädiabetes und diabetes mellitus – klinische empfehlungen (Update 2019) [Sex and gender-specific aspects in prediabetes and diabetes mellitus-clinical recommendations (Update 2019)]. Wien Klin Wochenschr (2019) 131(Suppl 1):221–8. doi: 10.1007/s00508-018-1421-1
48. Bredella MA. Sex differences in body composition. Adv Exp Med Biol (2017) 1043:9–27. doi: 10.1007/978-3-319-70178-3_2
49. Yazıcı D, Sezer H. Insulin resistance, obesity and lipotoxicity. Adv Exp Med Biol (2017) 960:277–304. doi: 10.1007/978-3-319-48382-5_12
50. Imierska M, Kurianiuk A, Błachnio-Zabielska A. The influence of physical activity on the bioactive lipids metabolism in obesity-induced muscle insulin resistance. Biomolecules (2020) 10(12):1665. doi: 10.3390/biom10121665
51. Santos-Baez LS, Ginsberg HN. Hypertriglyceridemia-causes, significance, and approaches to therapy. Front Endocrinol (Lausanne) (2020) 11:616. doi: 10.3389/fendo.2020.00616
52. Lin X, Li H. Obesity: epidemiology, pathophysiology, and therapeutics. Front Endocrinol (Lausanne) (2021) 12:706978. doi: 10.3389/fendo.2021.706978
Keywords: prediabetes, metabolic score for insulin resistance, Chinese, cohort study, METS-IR
Citation: Xie Q, Kuang M, Lu S, Huang X, Wang C, Zhang S, Sheng G and Zou Y (2023) Association between MetS-IR and prediabetes risk and sex differences: a cohort study based on the Chinese population. Front. Endocrinol. 14:1175988. doi: 10.3389/fendo.2023.1175988
Received: 28 February 2023; Accepted: 04 May 2023;
Published: 15 May 2023.
Edited by:
Yingyun Gong, Nanjing Medical University, ChinaReviewed by:
Aleksandra Jotic, University of Belgrade, SerbiaCopyright © 2023 Xie, Kuang, Lu, Huang, Wang, Zhang, Sheng and Zou. This is an open-access article distributed under the terms of the Creative Commons Attribution License (CC BY). The use, distribution or reproduction in other forums is permitted, provided the original author(s) and the copyright owner(s) are credited and that the original publication in this journal is cited, in accordance with accepted academic practice. No use, distribution or reproduction is permitted which does not comply with these terms.
*Correspondence: Yang Zou, anh5eHl6eUAxNjMuY29t
†These authors have contributed equally to this work and share first authorship
Disclaimer: All claims expressed in this article are solely those of the authors and do not necessarily represent those of their affiliated organizations, or those of the publisher, the editors and the reviewers. Any product that may be evaluated in this article or claim that may be made by its manufacturer is not guaranteed or endorsed by the publisher.
Research integrity at Frontiers
Learn more about the work of our research integrity team to safeguard the quality of each article we publish.