 Yue Ma1
 Yanhua Zhen1
 Min Wang1Lingfeng Gao1
 Yuxue Dang1Jin Shang1Xujiao Chen1
 Shaowei Ma2Ke Zhou3Kai Feng1Yang Xin1
 Yang Hou1*
 Chuanji Guo1*
- 1Department of Radiology, Shengjing Hospital of China Medical University, Shenyang, China
- 2Department of Cardiology, Shengjing Hospital of China Medical University, Shenyang, China
- 3Department of Cardiac Surgery, Shengjing Hospital of China Medical University, Shenyang, China
Background and aims: The triglyceride-glucose (TyG) index is a reliable alternative marker for insulin resistance (IR). Pericoronary adipose tissue (PCAT) can indirectly reflect coronary inflammation. IR and coronary inflammation play a key role in the development and progression of coronary atherosclerosis. Therefore, this study investigated the relationships between the TyG index, PCAT and atherosclerotic plaque characteristics to explore whether IR might lead to coronary artery atherosclerosis progression by inducing coronary inflammation.
Methods: We retrospectively collected data on patients with chest pain who underwent coronary computed tomography angiography using spectral detector computed tomography at our institution from June to December 2021. The patients were grouped based on their TyG index levels: T1 (low), T2 (medium), and T3 (high). Each patient was assessed for total plaque volume, plaque load, maximum stenosis, the plaque component volume proportion, high-risk plaques(HRPs), and plaque characteristics (including low attenuation plaques, positive remodeling, a napkin ring sign, and spot calcification). PCAT quantification was performed on the proximal right coronary artery using the fat attenuation index (FAI) measured from a conventional multicolor computed tomography image (FAI120kVp), a spectral virtual single-energy image (FAI40keV), and the slope of the spectral HU curve (λHU).
Results: We enrolled 201 patients. The proportion of patients with maximum plaque stenosis, positive remodeling, low-density plaques, and HRPs increased as the TyG index level increased. Moreover, the FAI40keV and λHU significantly differed among the three groups, and we identified good positive correlations between FAI40keV and λHU and the TyG index (r = 0.319, P <0.01 and r = 0.325, P <0.01, respectively). FAI120kVp did not significantly differ among the groups. FAI40keV had the highest area under the curve, with an optimal cutoff value of −130.5 HU for predicting a TyG index value of ≥9.13. The multivariate linear regression analysis demonstrated that FAI40keV and λHU were independently positively related to a high TyG index level (standardized regression coefficients: 0.117 [P <0.001] and 0.134 [P <0.001], respectively).
Conclusions: Patients with chest pain and a higher TyG index level were more likely to have severe stenosis and HRPs. Moreover, FAI40keV and λHU had good correlations with the serum TyG index, which may noninvasively reflect PCAT inflammation under insulin resistance. These results could help explain the mechanism of plaque progression and instability in patients with insulin resistance might be related to IR-induced coronary inflammation.
Introduction
Insulin resistance (IR) is a considerable risk factor for coronary artery disease (CAD) (1), which is a major cause of death worldwide (2). IR plays a key role in the development and progression of coronary atherosclerosis. For example, IR may cause vascular inflammation (3), which is the driving force of plaque formation and a typical feature of plaque rupture, leading to acute coronary syndrome (4). The triglyceride-glucose (TyG) index is a reliable alternative marker for IR, with better predictive ability than the homeostatic model (5), and previous studies have identified a relationship between the TyG index level and adverse events in cardiovascular disease (CVD) (6–8).
Previous studies identified associations between a higher pericoronary fat attenuation index (FAI) quantified by computed tomography angiography (CTA) and coronary artery inflammation and increased CVD risk (9, 10). Additionally, coronary CTA can comprehensively assess plaque load, morphology, and composition (11). Plaque load and high-risk plaque characteristics (HRPCs), such as low attenuation plaques (LAPs), positive remodeling (PR), napkin ring signs (NRS), and spot calcification, have been identified as independent predictors of disease progression and major adverse cardiovascular events (12–14). However, the relationships between the serum TyG index and pericoronary FAI and traditional plaque characteristics have not been explored.
Double-layer spectral detector computed tomography (SDCT) is a relatively newer dual-energy CT technology that utilizes two layers of detectors to simultaneously collect low-energy and high-energy data from all patients in the same spatial and angular location, using standard CT protocols. It enables comprehensive tissue characterization by providing spectral and quantitative virtual mono-energy images (VMI) results at a wide range of energy levels, including λHU and Eff-Z (15–17). In addition to the values obtained from conventional multienergy images, the CT values from a single energy source can more accurately reflect the X-ray absorption characteristics of materials (18), which greatly improve the resolution of soft tissues and can be exploited to separate tissues with similar attenuation in conventional images (19). Recently, a study demonstrated that SDCT is suitable for coronary CTAs (20), especially using VMI reconstruction at a low-energy level (40 keV), which significantly increases the contrast of soft tissue (21–23). Moreover, other studies have shown that SDCT is more sensitive and accurate for quantifying pericoronary adipose tissue (PCAT) than conventional CT (24, 25). Therefore, we hypothesized that the PCAT index assessed by SDCT might be more helpful for distinguishing PCAT inflammation in patients with IR.
Thus, we aimed to investigate the associations between the pericoronary FAI and plaque features derived from SDCT and the serum TyG index level in patients to explore whether IR might lead to coronary artery therosclerosis progression by inducing coronary artery inflammation. The results could facilitate clinical risk stratification of patients with atypical chest pain.
Materials and methods
Study population
This retrospective study was approved by the Institutional Review Board of the Shengjing Hospital of China Medical University (No. 2021PS834K), and the requirement for informed consent was waived. From June to December 2021, we identified 523 consecutive patients with chest pain and suspected CAD who underwent coronary CTA using SDCT. The exclusion criteria were as follows: age <18 years (n = 13), incomplete clinical data (n = 125), no imaging evidence of plaques (n = 60), known malignancies or infectious diseases (n = 39), previous myocardial infarction or surgery (n = 23), poor CT image quality (n = 16), and the use of lipid-lowering or antidiabetic drugs (n = 46). Thus, we enrolled 201 patients in this study (Figure 1).
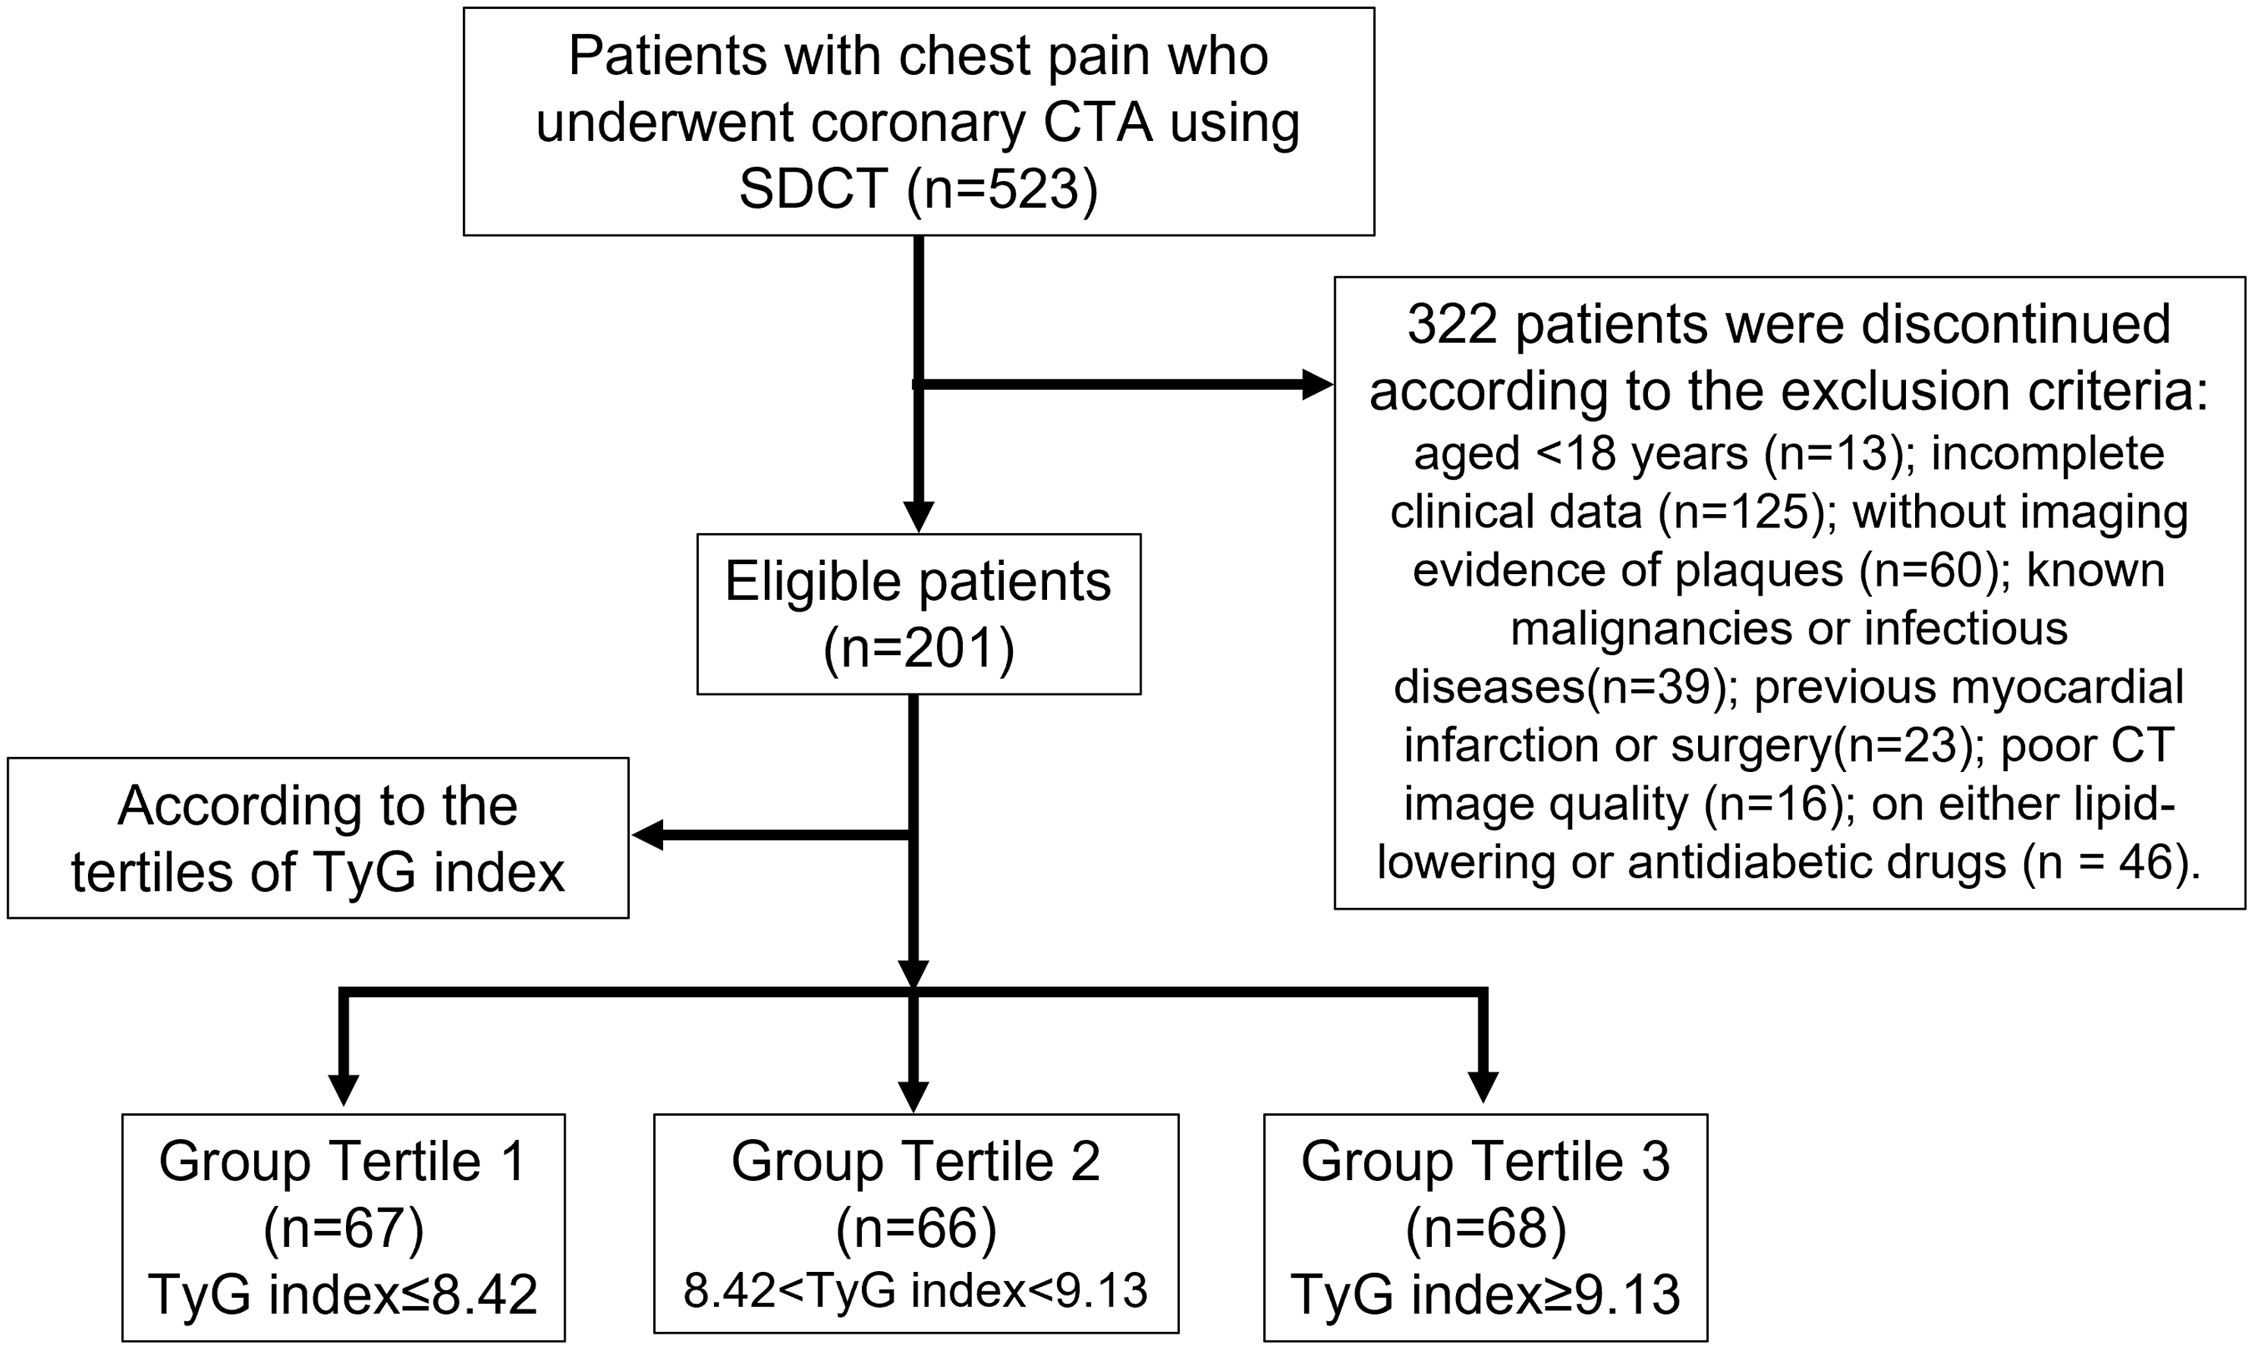
Figure 1 Flowchart of patient recruitment and grouping.
Coronary CTA and reconstruction imaging protocol
All scans were performed on 64-slice SDCT (IQon Spectral CT, Philips Healthcare, Best, The Netherlands) with a prospective electrocardiogram-gated protocol (‘Step & Shoot Cardiac’). A bolus of iodinated contrast 0.8 mL/kg (iodixanol, 270 mg/mL, GE Healthcare, Ireland) was used, and flushing was performed with 20–40 mL of saline at a 4.5–5 mL/s flow rate based on the patient’s body weight. The scan parameters were as follows: 120 kVp; dose right index of 13; tube rotation time of 0.27 s; detector collimation of 64 × 0.625 mm; and slice thickness of 0.9 mm in 0.45 mm increments. The scan trigger was centered around 78% of the R-R interval, with a ±3% buffer (see the Additional Material for detailed information).
The raw data were reconstructed using a spectral iterative reconstruction algorithm. The spectral reconstruction level was set to 4 (Philips Healthcare). Next, the resulting spectral base image datasets were reconstructed into conventional polychromatic (120 kVp) images by iterative model reconstruction (Cardiac Routine Level 1, Philips Healthcare) and VMI (energy level: 40 keV and 70 keV) by spectral iterative reconstruction (Spectral Level 4, Philips Healthcare). Finally, the reconstructed images were transferred to processing workstations.
Plaque analyses
Plaque characteristics were analyzed on polychromatic images using the IntelliSpace Portal software (version 6.5, Philips Healthcare). All coronary segments with a lumen diameter of ≥2 mm were analyzed (26). The software automatically determined the total plaque volume, total plaque burden (quantified as total plaque volume × 100%/vessel volume) (27), low-attenuation volume (≤30 HU) and percentage of plaque, intermediate-attenuation volume (31–130 HU) and percentage of plaque, high-attenuation volume (≥131 HU) and percentage of plaque (26), maximum diameter stenosis, and HRPCs. Corrections were made manually if necessary. HRPCs were assessed as follows: PR (≥1.1); low density plaque (LDP; <30 HU); spotty calcification (<3.0 mm); or an NRS (28). Plaques fulfilling at least two of these criteria were classified as high-risk plaques (HRPs).
Two cardiovascular radiologists (with 13 and 5 years of experience in cardiac imaging, respectively) were blinded to the results and independently analyzed the above parameters. The mean values of the quantitative parameters measured by the two observers were used for further analyses.
PCAT quantification
Previous studies have used the proximal right coronary artery (RCA) in PCAT analyses; thus, it represents a standardized PCAT analysis model (9, 10). Consequently, we focused on the proximal RCA (10–50 mm from the RCA opening) to standardize the PCAT analysis and perform equivalent PCAT analyses in the CTA series (Figure 2).
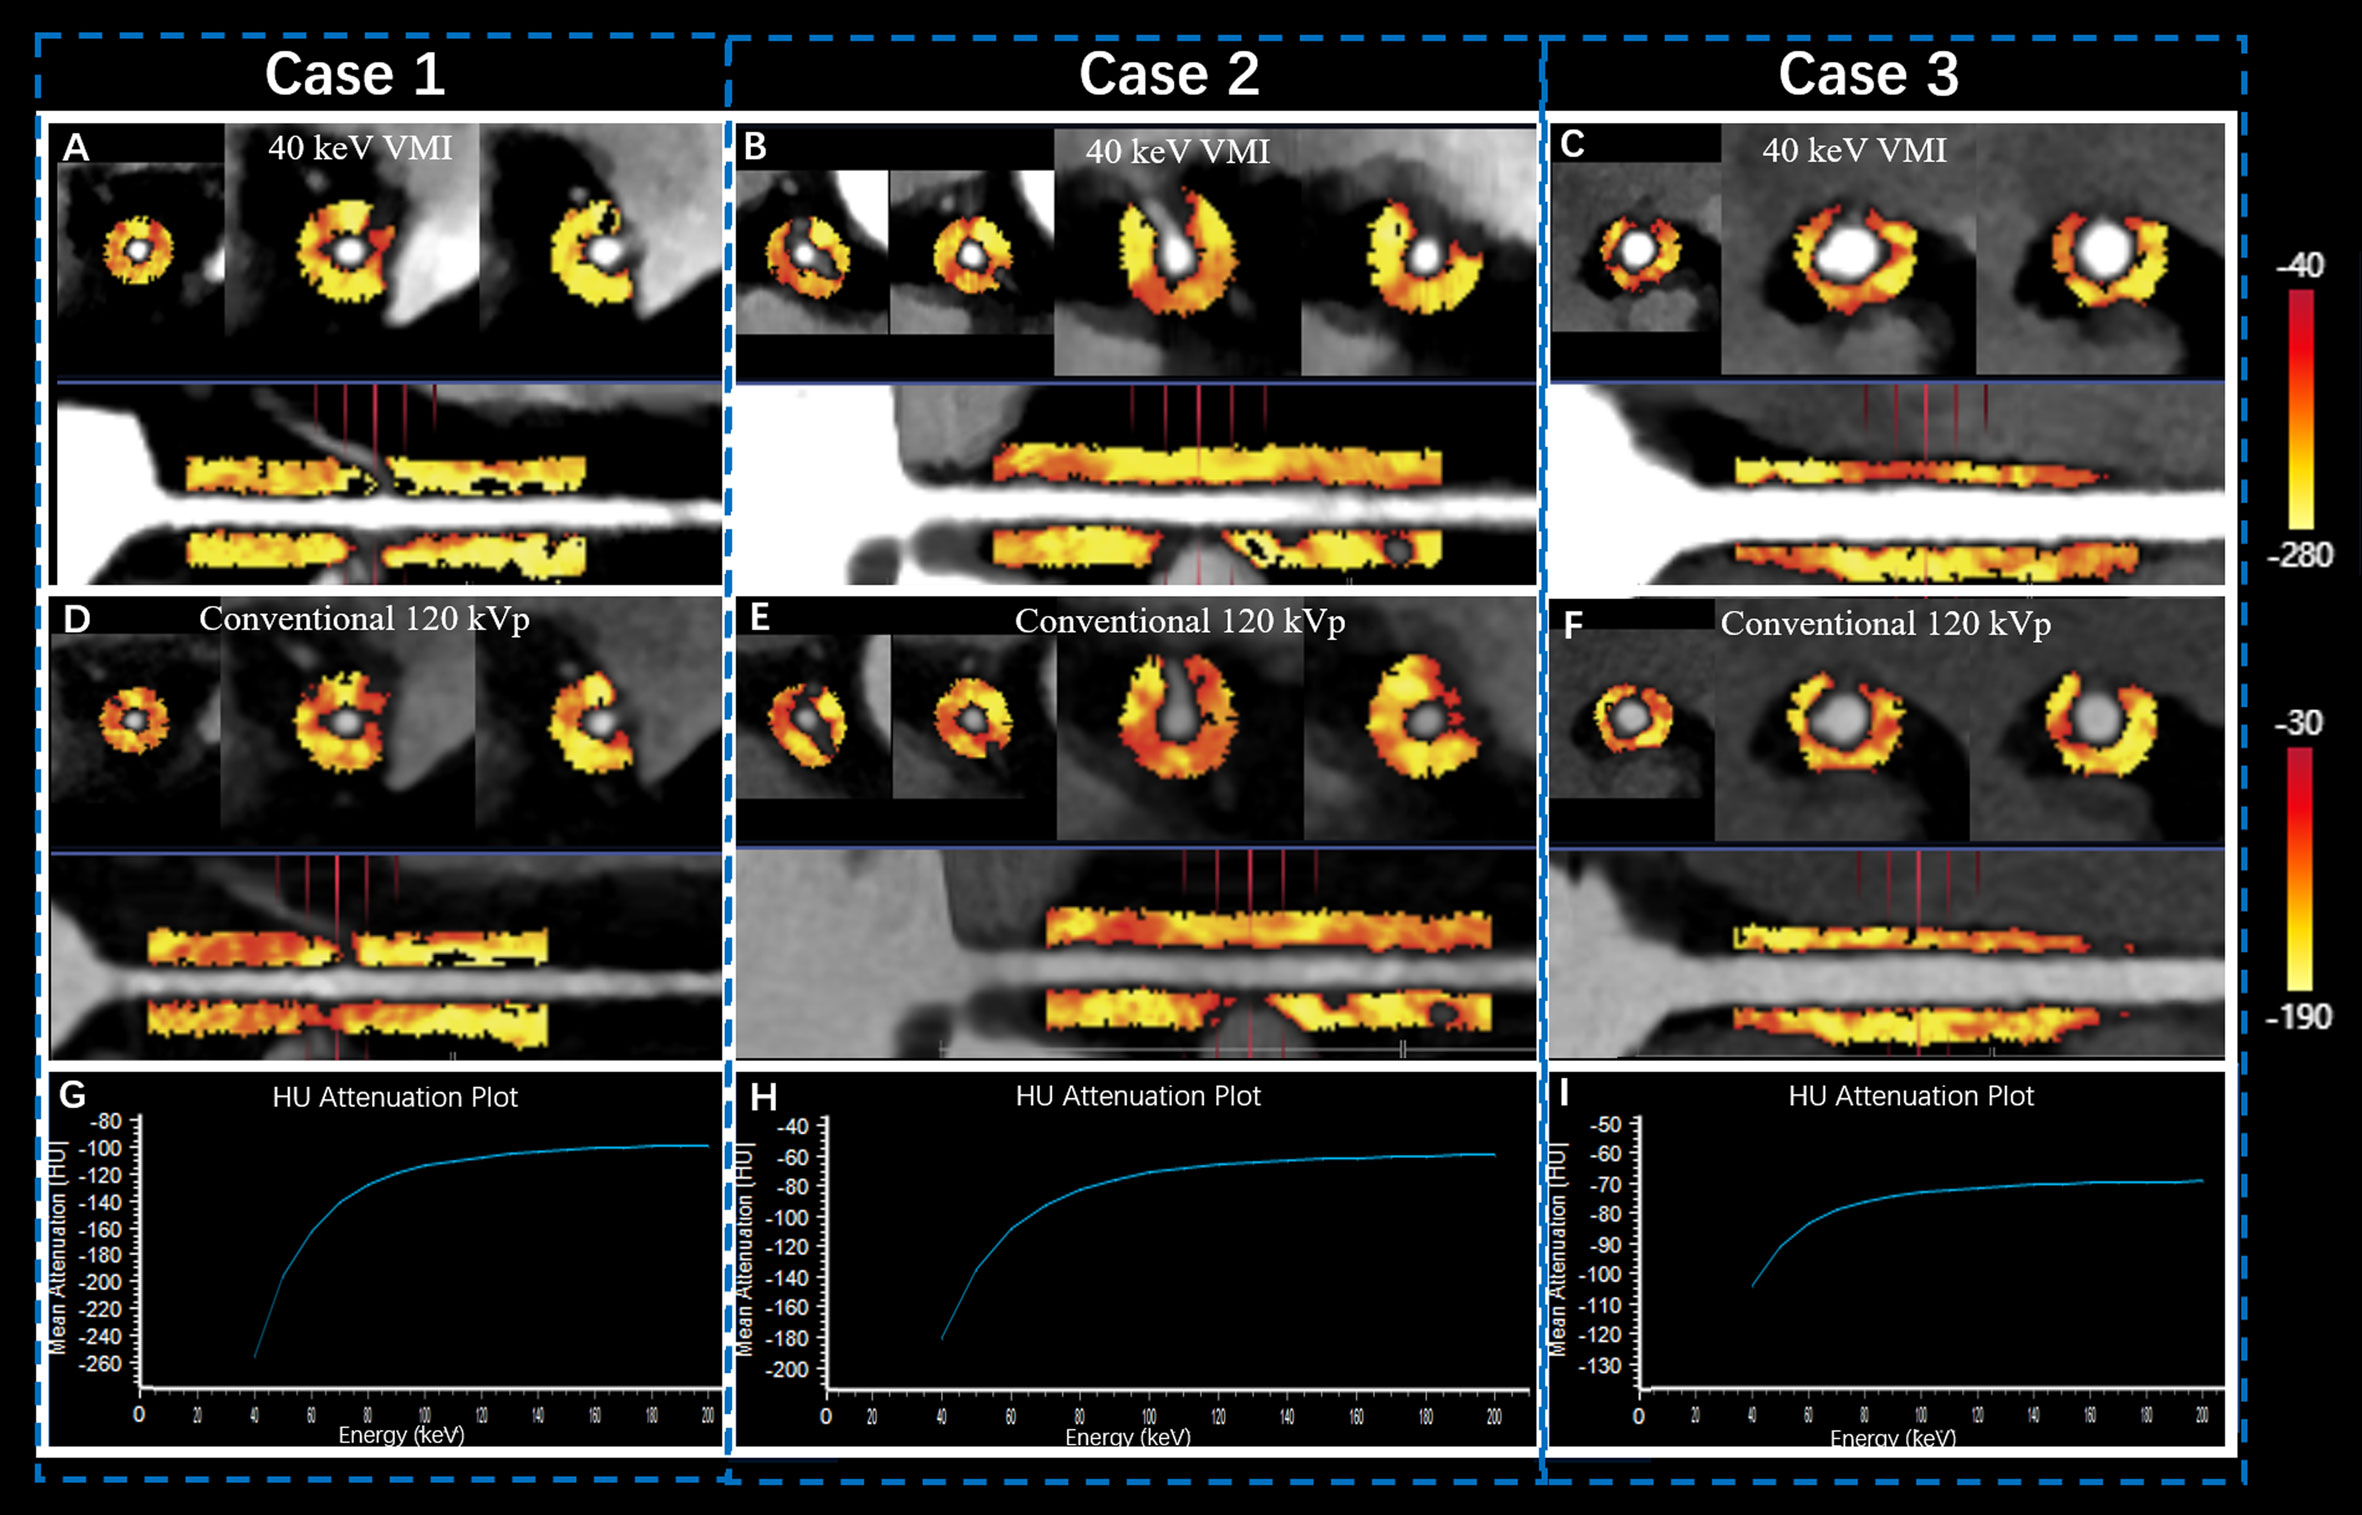
Figure 2 Quantitative PCAT analysis of SDCT in proximal RCA. Case 1 was a 57-year old female patient in Group T1 (A, D, G) with FAI40keV = −159 HU, FAI120kVp = −95 HU, and λHU = −2.1. Case 2 was a 67-year old male patient in Group T2 (B, E, H) with FAI40 keV = −147 HU, FAI120kvp = −94 HU, and λHU = −1.9. Case 3 was a 52-year old female patient in Group T3 (C, F, I) with FAI40 keV = −118 HU, FAI120kVp = −83 HU, and λHU = −1.37. The straightened view of PCAT of the proximal RCA in the 40 keV virtual monochromatic images (A, B, C) and conventional120 kVp (D, E, F). G, H, I represented the corresponding spectral attenuation curve, respectively. FAI: fat attenuation index; PCAT: pericoronary adipose tissue; RCA: right coronary artery; SDCT: spectral detector computed tomography; T1-3: TyG tertile 1-3; λHU: the slope of the spectral attenuation curve.
Dedicated FAI analysis software (Dr. Wise® Coronary Artery CT Aided Diagnosis Software V200831, Deepwise Healthcare, Beijing, China) was used to quantify the conventional images and the 40 keV and 70 keV VMIs. Adipose tissue was identified as all voxels with attenuation thresholds of −190 to −30 HU in conventional polychromatic energy imaging, −280 to −40 HU in 40 keV VMIs, and −220 to −30 HU in 70 keV VMIs (24, 25, 29). The slope of the spectral attenuation curve (λHU) was calculated as follows: λHU = (FAI40 keV – FAI70 keV)/30. Finally, we recorded the FAIs in the proximal RCA assessed by polychromatic images (FAI120kVp), 40 keV VMIs (FAI40 keV), and 70 keV VMIs (FAI70 keV), as well as the λHU.
Triglyceride glucose index and other serum biomarkers
We collected data on the patients’ blood biochemical parameters, including serum total cholesterol, triglycerides (TG), high-density lipoprotein cholesterol, low-density lipoprotein cholesterol, fasting blood glucose (FBG), creatinine, and C-reactive protein (CRP) levels, within 48 h before and after the CTA examination. Per clinical practice, all blood samples were collected from the cubital vein after fasting for at least 8 h.
We calculated the TyG index as ln[TG (mg/dL) × FBG (mg/dL)/2] based on previous studies (6, 30). Then, we divided the patients into three groups based on our cohort’s TyG index tertiles (6): T1 (TyG index tertile 1: ≤8.42), T2 (TyG index tertile 2: 8.43–9.12), and T3 (TyG index tertile 3: ≥9.13).
Statistical analyses
Datasets were analyzed using SPSS (version 23.0, IBM Corp., Armonk, NY, USA) and MedCalc version 15.2.2 (MedCalc Software Bvba, Ostend, Belgium). Continuous data were tested for a normal distribution using the Kolmogorov-Smirnov test. Normally distributed data are expressed as means ± standard deviations and were compared using analysis of variance. Nonparametric data are expressed as medians (interquartile ranges) and were compared using the Kruskal-Wallis test, and the least significant difference was used for paired comparisons. Categorical variables are expressed as percentages and were compared using the chi-squared or Fisher’s exact test, where appropriate. Correlations between the PCAT and TyG index levels were evaluated using Pearson’s correlation coefficient. The areas under the receiver operating characteristic (ROC) curve, sensitivity, and specificity were calculated to evaluate the predictive ability of FAI parameters (FAI120kVp, FAI40keV, and λHU) for a high TyG index level. ROC comparisons were performed using the Delong test. Univariate and multivariate linear regressions were performed to identify independent predictors of a TyG index increase. Unstandardized regression coefficients (β, with a 95% confidence interval) and standardized regression coefficients (β) were recorded. A two-sided P-value of <0.05 was considered statistically significant.
Results
Clinical characteristics
A total of 201 patients were enrolled; Table 1 summarizes the clinical characteristics of the study cohort. Among the three groups (T1, T2, and T3), body mass index, serum lipid markers, and the FBG, creatinine, and CRP levels significantly differed (P <0.05). However, age, sex, smoking history, drinking history, or the proportion of patients with hypertension did not significantly differ (Table 2).

Table 1 Demographic data.
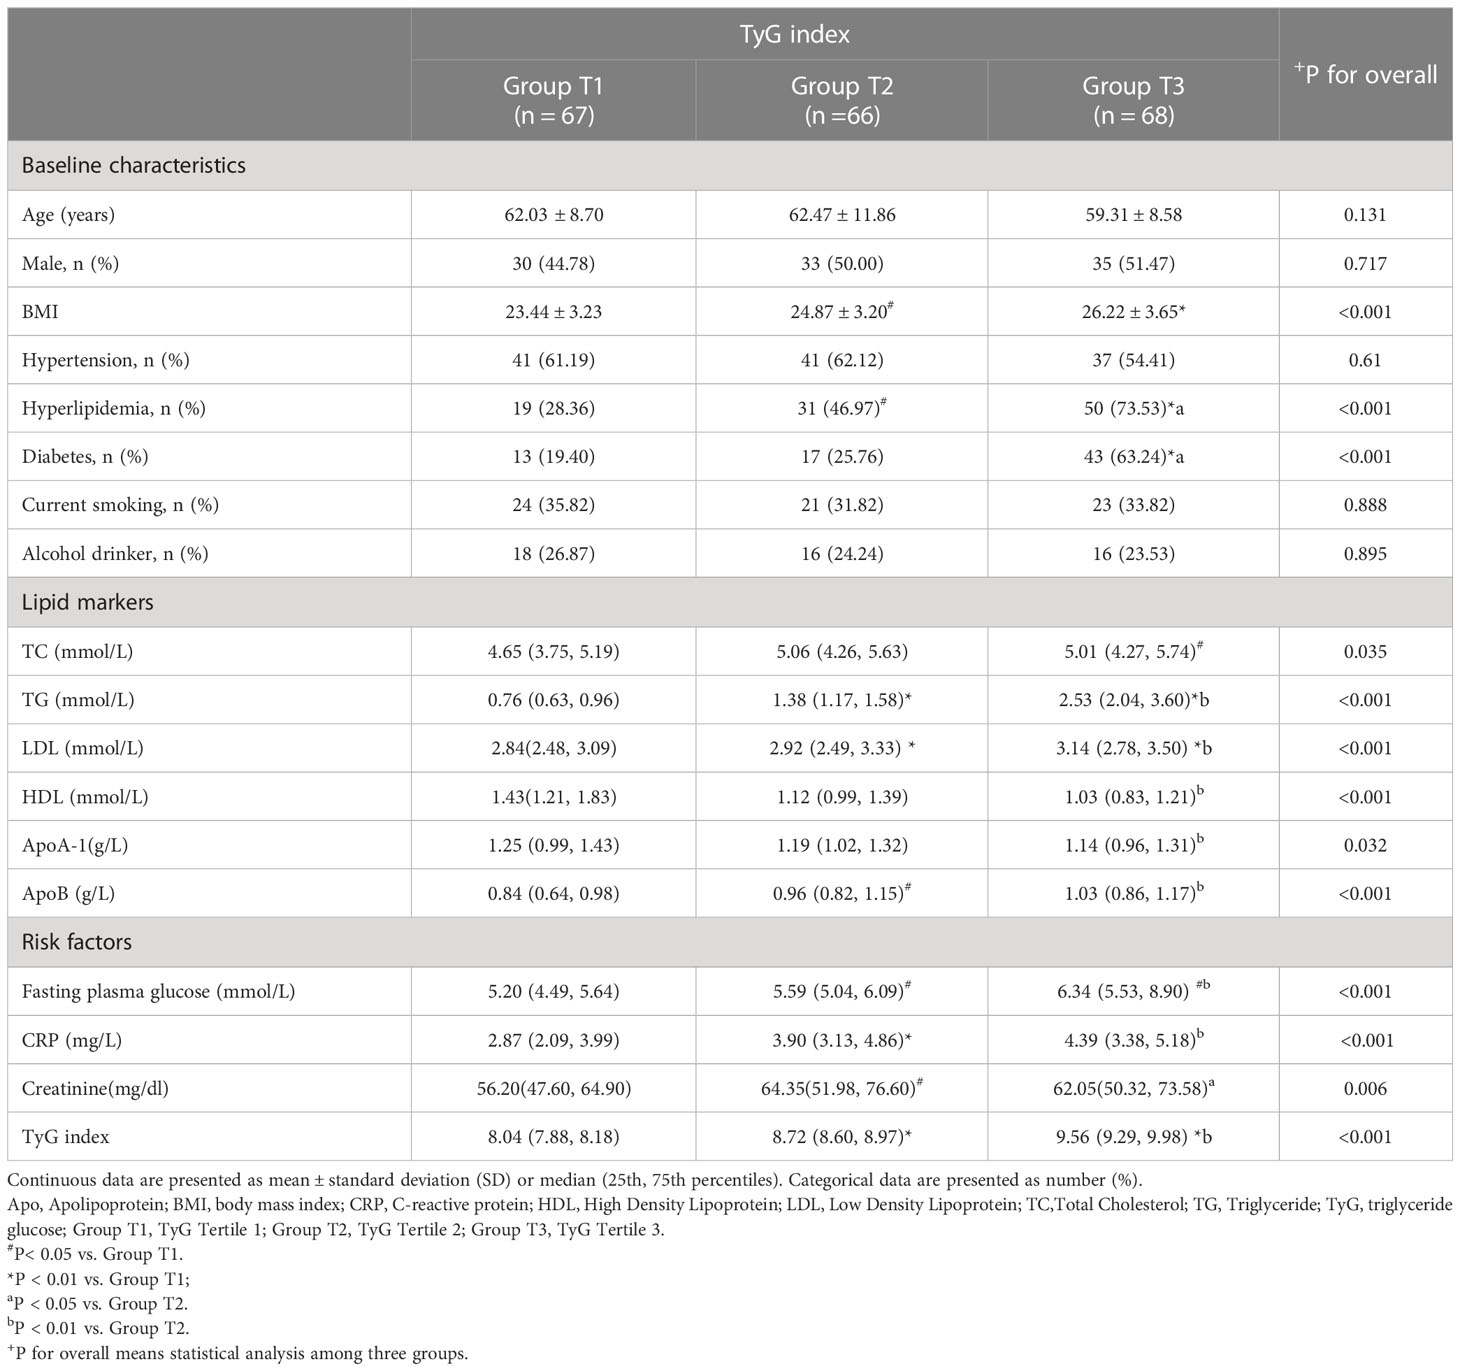
Table 2 Clinical characteristics of patients stratified according to TyG index.
Plaque features and the TyG index
HRPs and high-risk features of PR and LAP were more likely to occur in group T3 than in groups T1 or T2. The maximum luminal stenosis severity was also higher in group T3 than in groups T1 or T2 (Table 3). Moreover, the number of HRPCs increased as the TyG index level increased (Additional Table 1). We also compared the number of HRPCs based on the TyG index categories, finding significant differences in the number of HRPCs among the three groups (P = 0.003; Additional Figure 1). In groups T1, T2, and T3, 13.43%, 16.67%, and 30.88% of lesions had ≥2 HRPCs, respectively (Additional Table 1, Additional Figure 1). However, the total plaque volume and load, calcification score, proportions of various plaque components, spot calcification, and NRS did not significantly differ between the group T3 and groups T1 and T2 (Table 3).
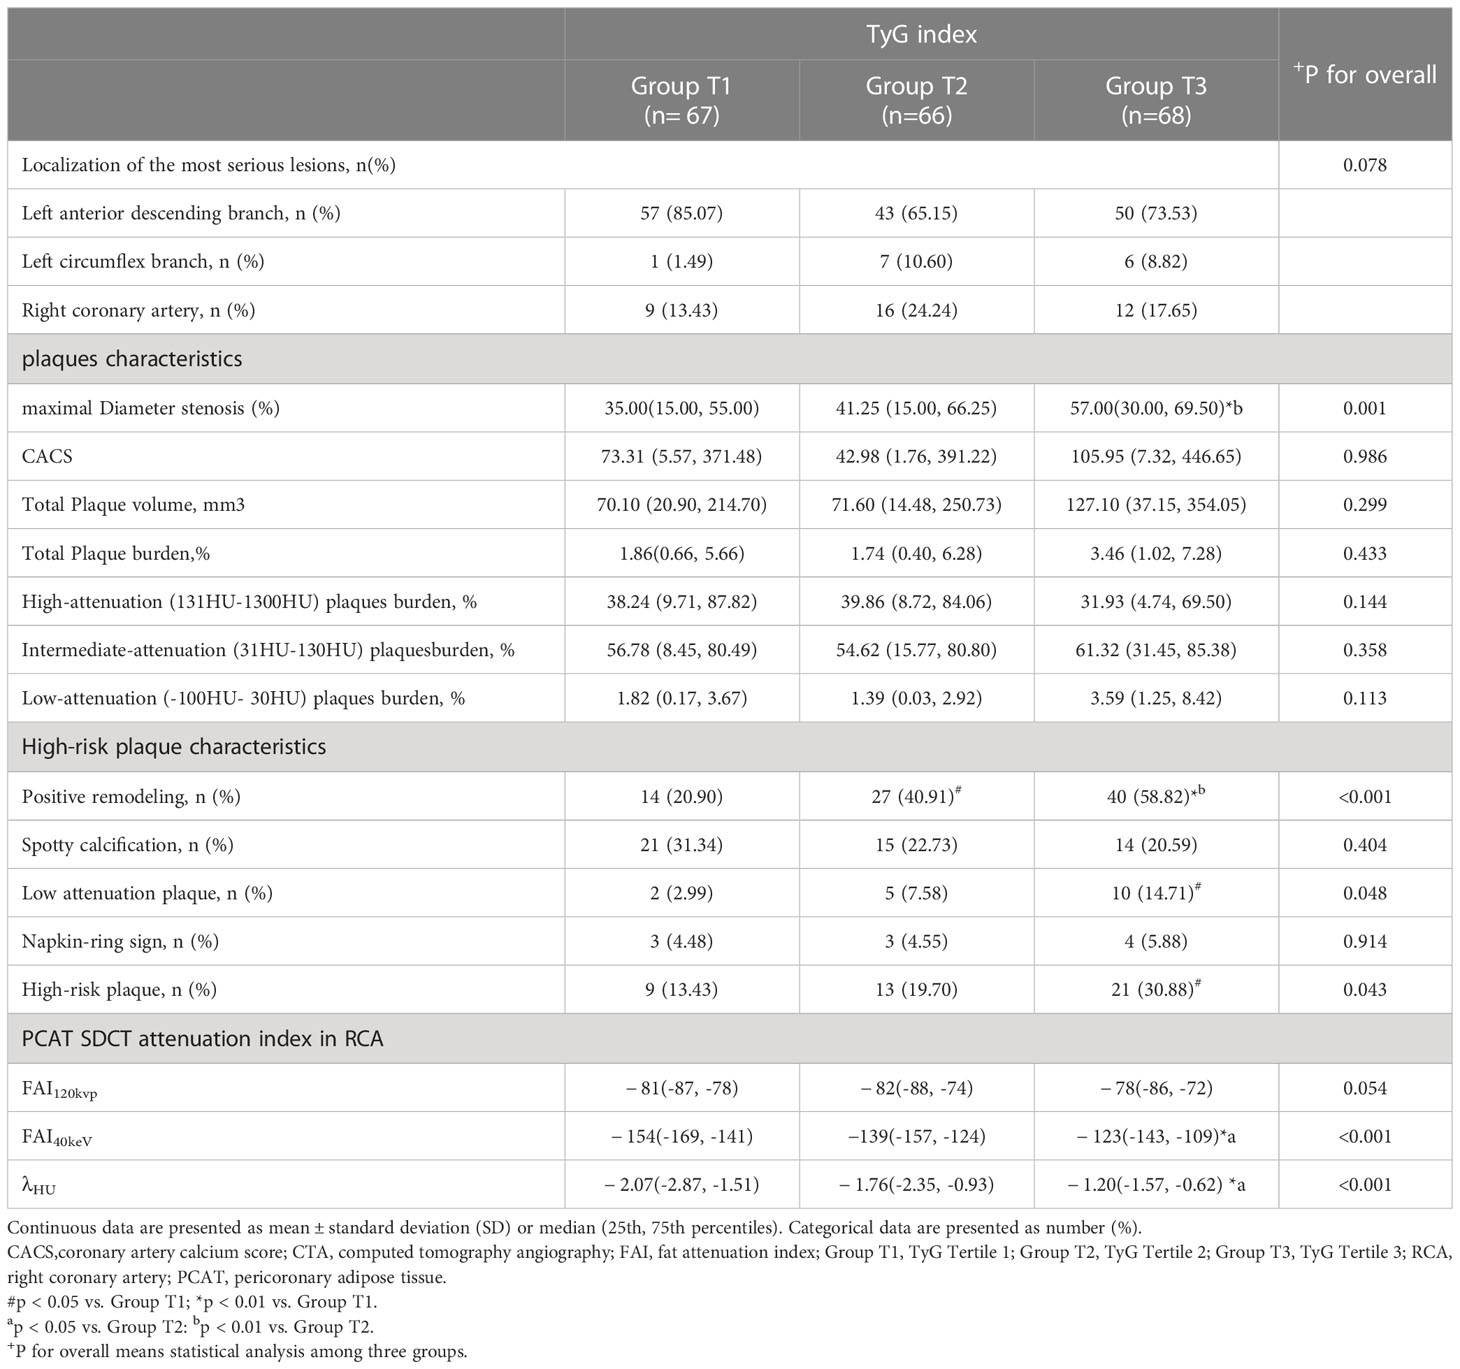
Table 3 Coronary CTA imaging parameters of patients stratified according to TyG index.
Pericoronary FAI and the TyG index
FAI40keV and λHU increased as the TyG index value increased, which significantly differed among the three groups. Specifically, in group T3, FAI40keV and λHU levels were higher than those in groups T1 and T2 (Table 3). Furthermore, the correlation analysis identified significant positive correlations between FAI40keV and λHU and the TyG index (r = 0.319, P <0.01; r = 0.325, P <0.01, respectively; Figure 3). FAI120kVp slightly increased among the three groups, but the difference was statistically insignificant, and there was no correlation with the TyG index (Table 3; Figure 3).
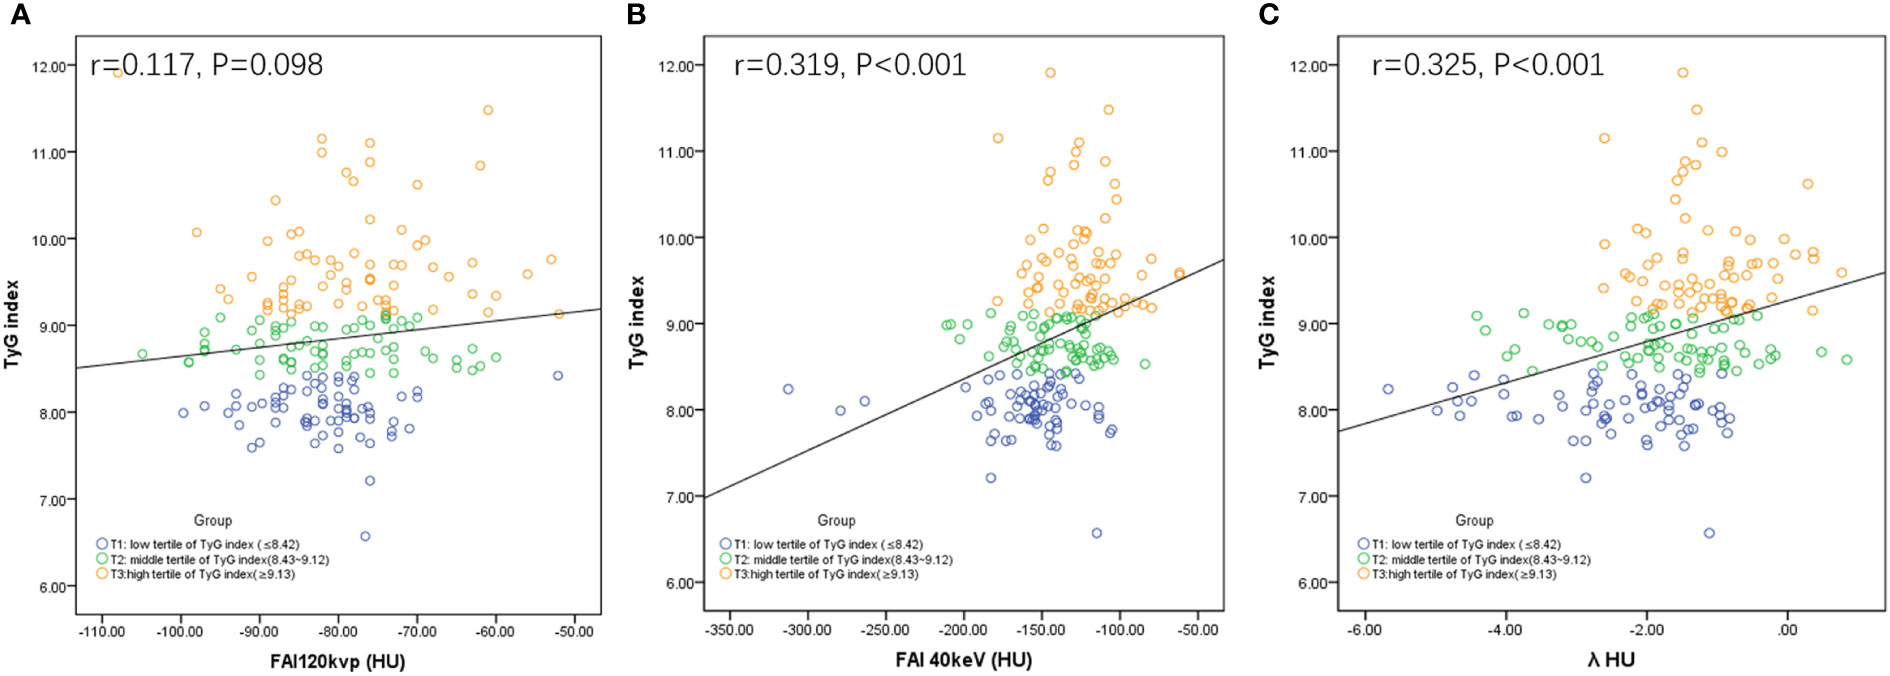
Figure 3 Correlations between FAI120kVp (A), FAI40keV (B) or λHU (C) and TyG index. FAI: fat attenuation index; TyG, Triglyceride glucose; λHU: the slope of the spectral attenuation curve.
FAI imaging parameters associated with a high TyG index level
The ROC curve analyses for FAI40keV and λHU indicated that these parameters were superior predictors of a high TyG index level compared to FAI120kVp (areas under the curve [AUCs]: FAI40keV: 0.758, λHU: 0.745, FAI120kVp: 0.591; all P <0.05; Figure 4; Table 4). FAI40keV had the highest AUC, with an optimal cutoff value of −130.5 HU for predicting a TyG index ≥9.13. The AUC of λHU was slightly lower than FAI40keV, but the two did not differ significantly.
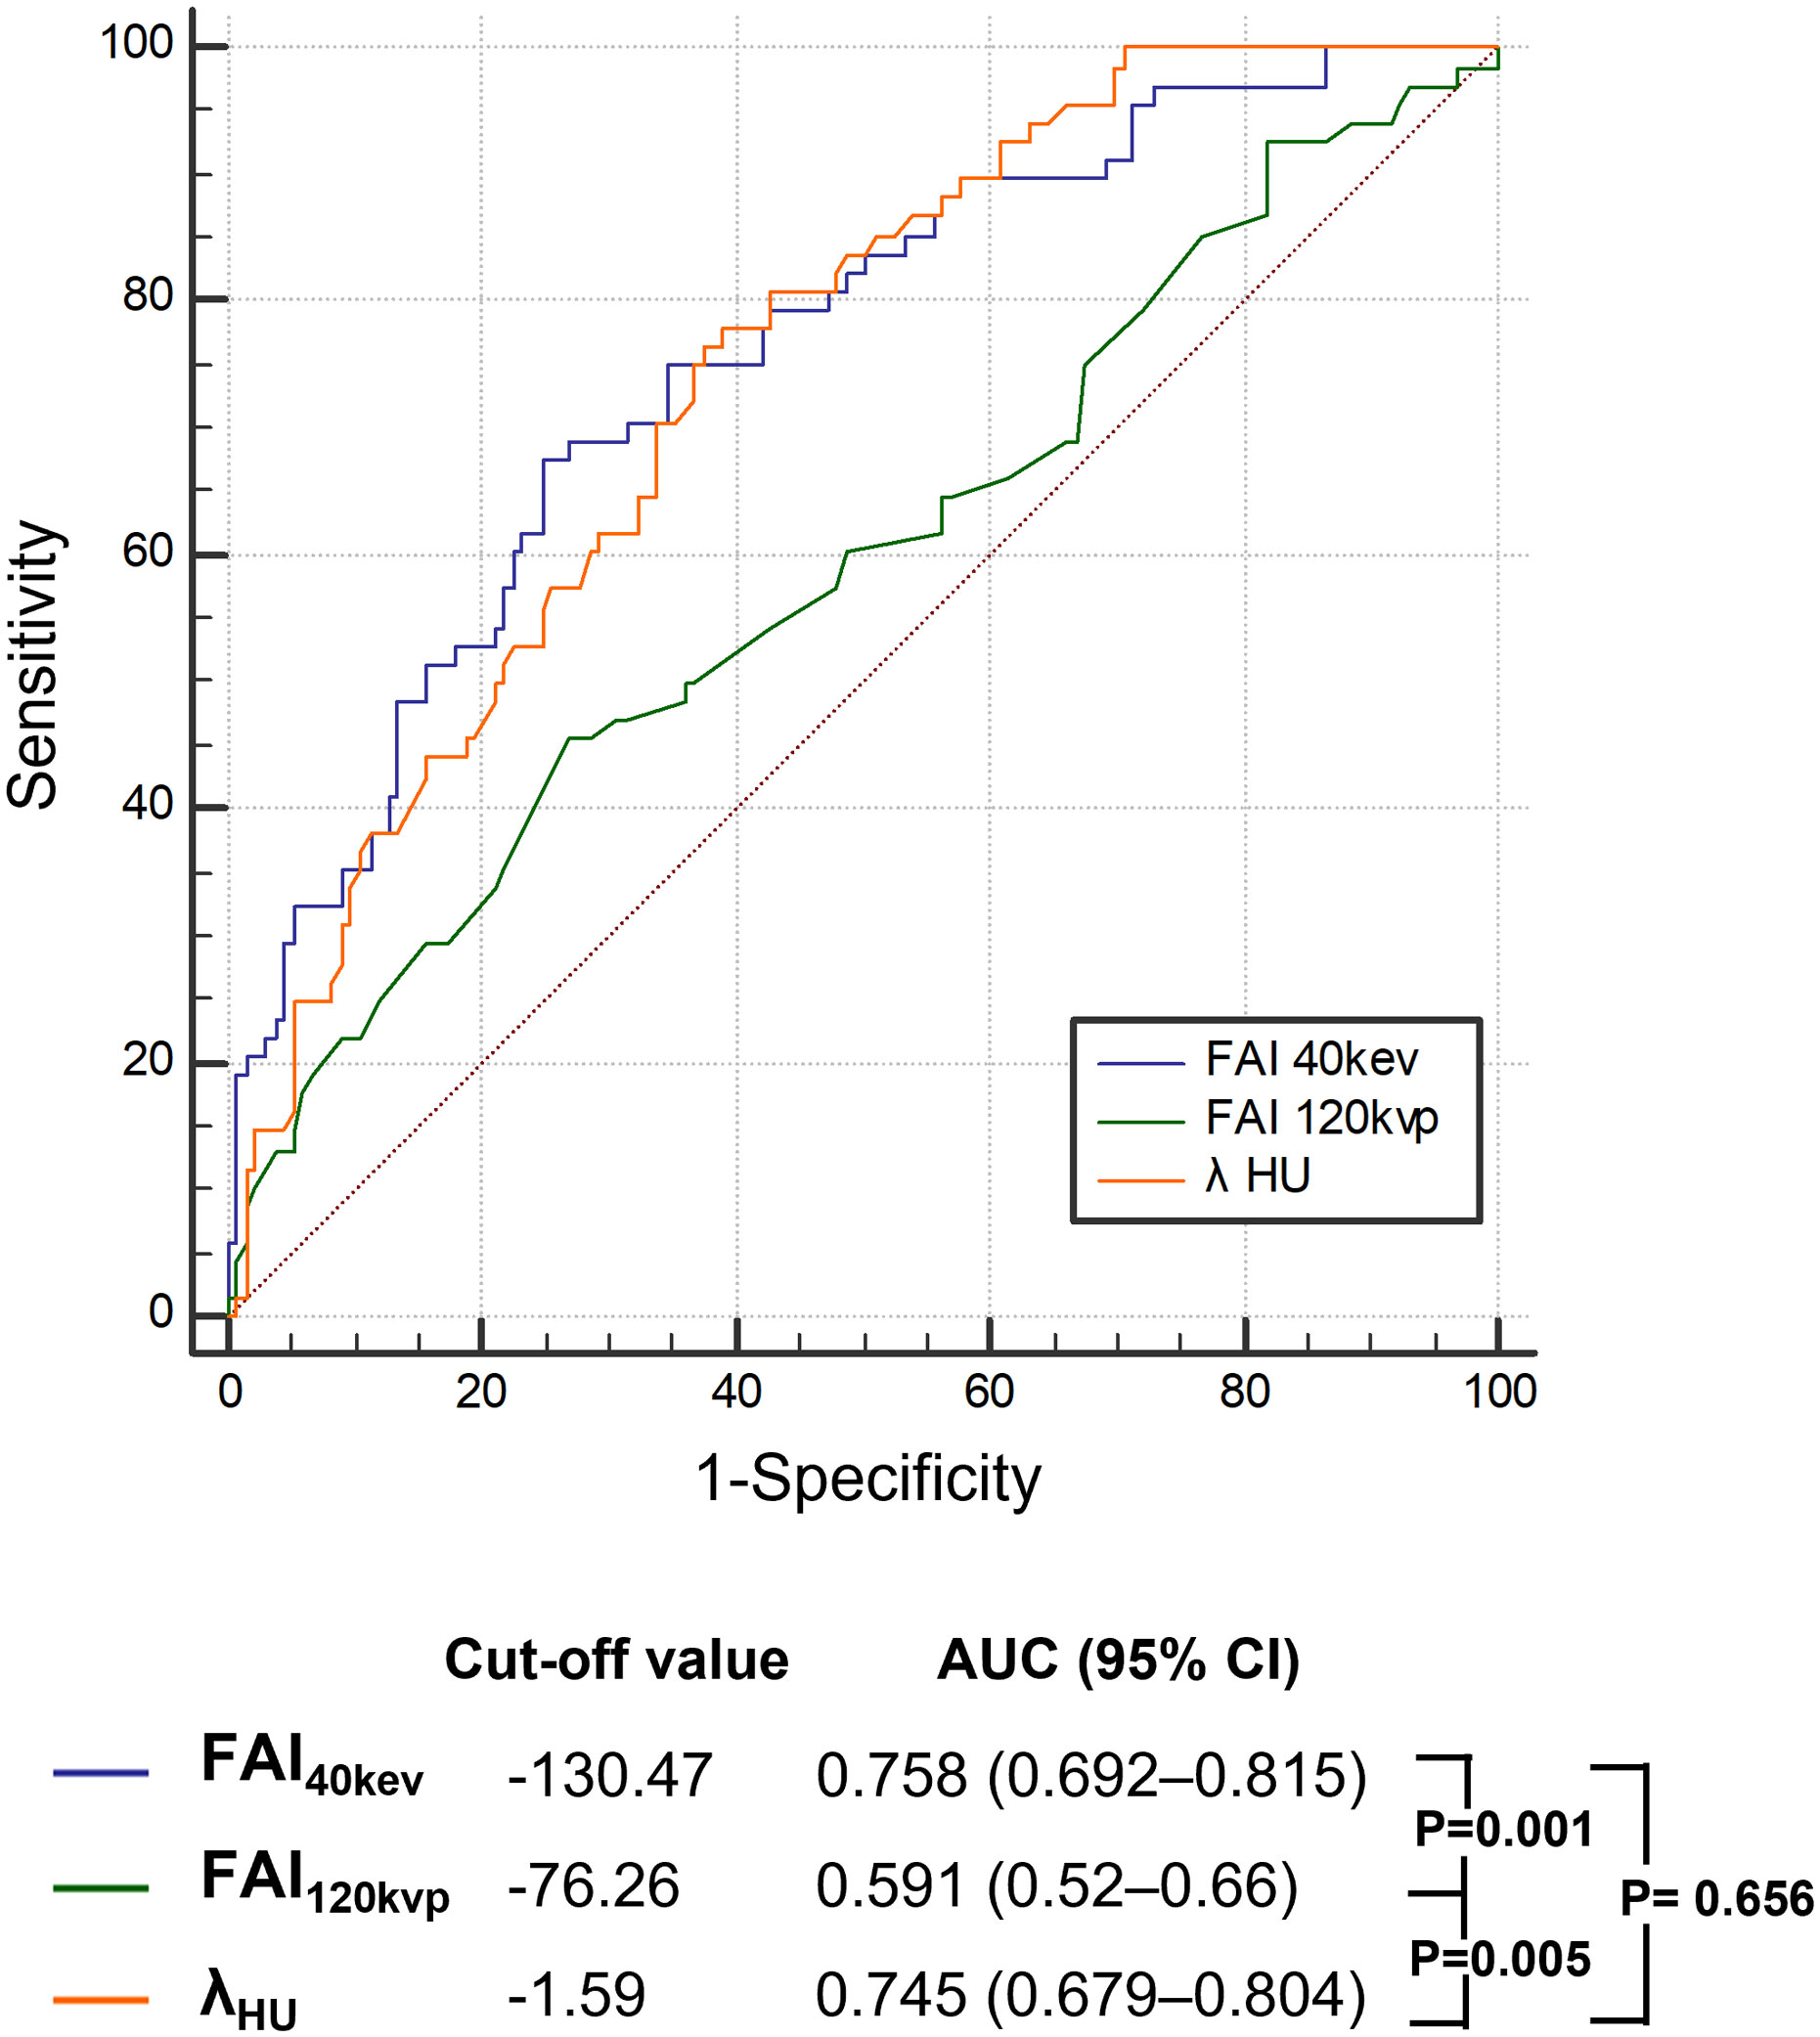
Figure 4 Receiver operating characteristic curve analysis showed that compared with other parameters, the FAI40keV had the highest the area under curve. FAI, fat attenuation index.
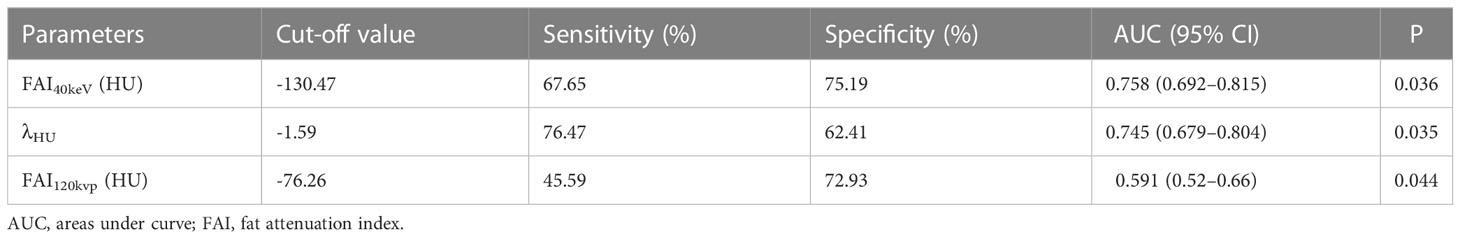
Table 4 Cut-off values of FAI indices for the detection of the higher tertile of TyG index.
Univariate and multivariate analyses were performed to identify factors associated with a high TyG index level (Table 5). In the univariate analysis, maximal diameter stenosis, PR, low attenuation, HRPs, FAI40keV, and λHU were positively associated with an increased TyG index, whereas FAI120kVp was not associated. In the multivariate analysis, FAI40keV and λHU were independently and positively associated with an increased TyG index level (standardized regression coefficients: 0.117 [P <0.001] and 0.134 [P < 0.001], respectively).
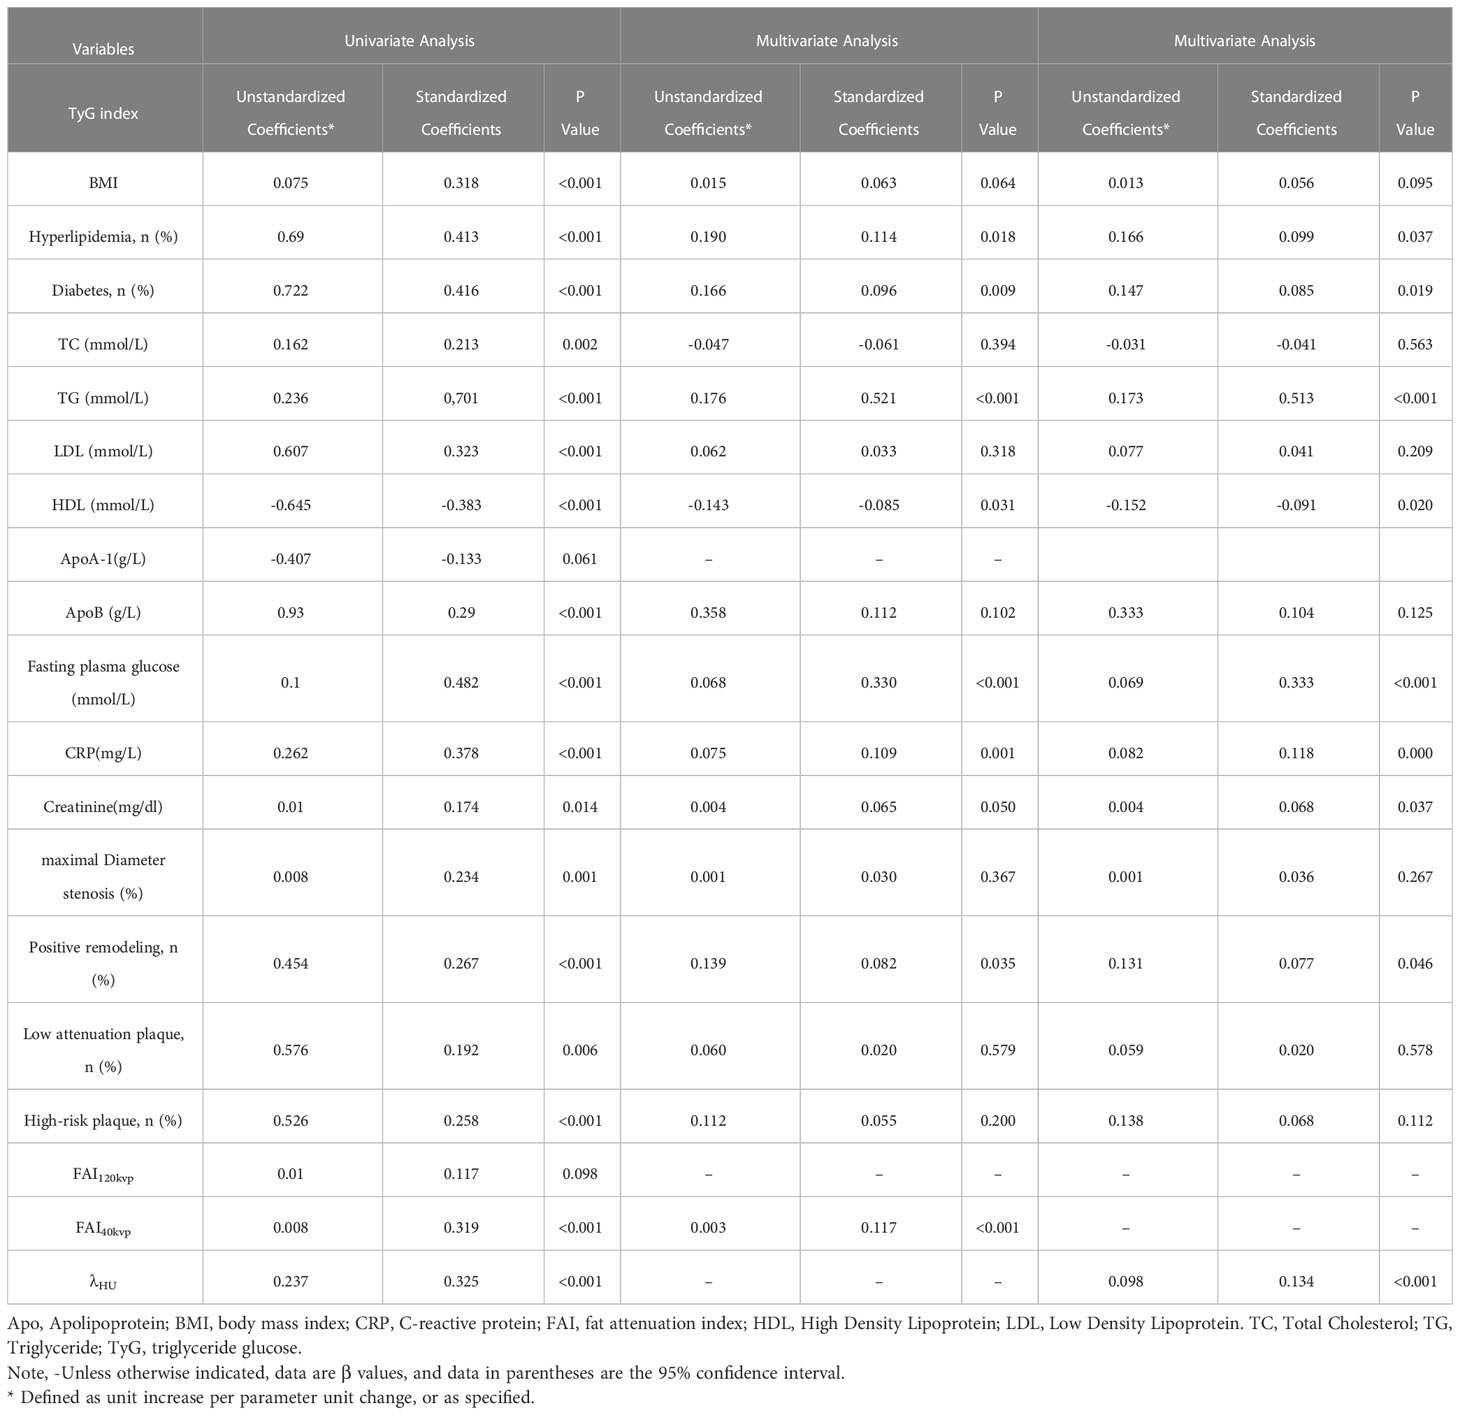
Table 5 Uni- and Multivariate Linear Regression Analysis for the increased TyG index level.
Discussion
This study’s primary finding was that an increase in the TyG index level was significantly correlated with FAI40keV and λHU (represented by SDCT), and FAI40keV and λHU were independently positively associated with the TyG index. Compared with the FAI obtained by conventional CT, the SDCT index may better predict a high TyG index level. Furthermore, the serum TyG index was associated with the maximum luminal stenosis severity, HRPs, PR, and LAPs.
TyG index and PCAT FAI
IR is a potential mechanism for CAD progression (31). Therefore, measuring IR biomarkers, such as the TyG index, is valuable for stratifying risk in patients with CAD (7). Furthermore, the TyG index is a strong independent predictor of adverse clinical outcomes in patients and healthy subjects (6, 32), which may be related to vascular endothelial cell damage in an insulin-resistant state, resulting in an inflammatory response (33). Recently, FAI was proposed as a parameter reflecting vascular inflammation (9). In short, pro-inflammatory cytokines released by the inflamed artery wall can prevent lipid accumulation in perivascular adipose tissue (10). These changes and accompanying perivascular edema lead to increased perivascular adipose tissue density. Therefore, in theory, FAI would increase if blood vessel inflammation occurred. Interestingly, our results suggest a correlation between PCAT FAI and TyG index. Another possible reason for increased FAI in patients in a state of IR is related to visceral fat and small fat cells; as they become smaller, the proportion of cells increases (34), leading to higher CT attenuation and a further increase in the FAI CT value. This may explain why FAI increased more significantly at higher TyG levels.
FAI imaging parameters by SDCT
This is the first time the relationship between TyG and PCAT indicators has been analyzed using SDCT. This study also identified significant differences in FAI40keV and λHU values between groups T3 and T2 and between groups T3 and T1. More interestingly, FAI40keV had a good predictive value for a high serum TyG index level. However, FAI120kVp did not significantly differ among the three groups. The findings showed that discrimination between pericoronary adipose tissue was improved using SDCT at low-energy end of the spectrum (40 keV) compared to conventional polychromatic at 120 kV. It might be related to the fact that the higher attenuation differences at 40 keV gradually decreasing with increasing energy levels, and polychromatic single-energy acquisitions obtained at 120 kV (usually equivalent to monoenergy images at 70–77 keV) would yield smaller differences between tissues (35). Furthermore, conventional CT is a mixed-energy scan, meaning that the 120kVp X-ray is composed of different keV mono-energy rays. The mixed-energy attenuated images have limited ability to identify substances with high noise and beam hardening artifacts (23). Accordingly, FAI40keV and λHU were significantly correlated with the TyG index. Consequently, we speculate that SDCT spectral information is superior to traditional multicolor CT in detecting and monitor subtle changes in adipose tissue composition caused by PCAT remodeling. This result is consistent with the results of Rodriguez-Granillo et al. (29) and our team (24, 25), they all found that differences of PCAT were better displayed using monochromatic imaging at low energy levels. We also observed similarities between λHU and FAI40keV, which may be a marker that reflects the inflammatory state of PCAT when the TyG index is elevated. These findings emphasize that SDCT-derived FAI40keV and λHU may be novel sensitive imaging markers reflecting the remodeling of PCAT in the insulin-resistant state. Therefore, the relationship between vascular inflammation and IR can be preliminarily reflected by the correlation between FAI40keV and the serum TyG index.
TyG index and plaque features
Similar to pericoronary FAI, this study showed that the stenosis severity, HRP, and typical HRPCs - positive remodeling and LDP were also common in patients with an elevated serum TyG index level. Moreover, the number of HRPCs significantly increased as the TyG index level increased. This finding is consistent with previous studies (8, 36) demonstrating that the TyG index is related to the severity of coronary lesions and plaque stability. Therefore, we speculate that the degree of coronary stenosis and plaque instability may be related to the serum TyG index level.
Clinical implications
This study verified that FAI40keV and λHU by SDCT were the best CT imaging biomarkers for predicting active vascular inflammation in CAD patients with insulin-resistant state. The Cardiovascular Risk Prediction using CT (CRISP-CT) study (10) previously showed that pericoronary FAI was a prognostic index of CAD. Therefore, our results might be helpful in predicting the prognosis of CAD patients with IR. Furthermore, we found that elevated TyG index levels were more likely to have severe stenosis and HRPs, which suggested that TyG index could be used as a parameter to initiate lipid-lowering therapy in apparently healthy patients and as a selection criterion before SDCT examination to help risk stratification by coronary wall inflammation and plaque stability. In addition, these indices could help to explain the mechanism of plaque instability and atherosclerosis progression in IR patients related to IR-induced coronary wall inflammation. However, more evidence from prospective large sample studies is needed before this method can be widely used in clinical practice.
Limitations
Despite these findings, our study had some limitations. First, this was a single-center retrospective study with a limited sample size; these results require validation in larger prospective cohorts. Second, this was a cross-sectional study, and the initial status of the participants was unknown. A longitudinal study would help reveal the relationship between the TyG index, atherosclerotic plaque characteristics, and PCAT. Finally, no other inflammatory imaging modalities (e.g., positron emission tomography) were used in this study to verify the presence of plaque inflammation. However, previous studies showed that the FAI is an effective way to detect coronary inflammation (9, 10).
Conclusions
Chest-pain patients with elevated TyG index levels were more likely to have severe stenosis and HRPs. SDCT-based pericoronary FAI40keV and λHU were independently correlated with the serum TyG index level. Therefore, FAI40keV and λHU may be novel alternative imaging markers for vascular inflammation in patients with IR. These results may help explain the mechanisms related to plaque progression and instability in patients with IR, but validation in more extensive clinical trials is required.
Data availability statement
The raw data supporting the conclusions of this article will be made available by the authors, without undue reservation.
Ethics statement
The studies involving human participants were reviewed and approved by This study was reviewed and approved by the Shengjing Hospital of China Medical University Research Ethics Committee (No. 2021PS834K). Written informed consent for participation was not required for this study in accordance with the national legislation and the institutional requirements.
Author contributions
YM, YH, and CG contributed to conception and design of the study. SM, KZ, MW, KF, YX, and LG conducted the data collection. YZ, YD, XC, JS, and MW conducted the image analyzing and statistical analysis. YM wrote the first draft of the manuscript. All authors contributed to manuscript revision, read, and approved the submitted version.
Funding
This study was granted by the National Natural Science Foundation of China (Grant Nos. of 81901741, 82071920, and 82102035); The Key Research & Development Plan of Liaoning Province (No. 2020JH2/10300037); 345 Talent Project in Shengjing Hospital of China Medical University.
Acknowledgments
We thank all of the investigators and patients who participated in this project.
Conflict of interest
The authors declare that the research was conducted in the absence of any commercial or financial relationships that could be construed as a potential conflict of interest.
Publisher’s note
All claims expressed in this article are solely those of the authors and do not necessarily represent those of their affiliated organizations, or those of the publisher, the editors and the reviewers. Any product that may be evaluated in this article, or claim that may be made by its manufacturer, is not guaranteed or endorsed by the publisher.
Supplementary material
The Supplementary Material for this article can be found online at: https://www.frontiersin.org/articles/10.3389/fendo.2023.1166117/full#supplementary-material
References
1. Adeva-Andany MM, Martínez-Rodríguez J, González-Lucán M, Fernández-Fernández C, Castro-Quintela E. Insulin resistance is a cardiovascular risk factor in humans. Diabetes Metab Syndr (2019) 13(2):1449–55. doi: 10.1016/j.dsx.2019.02.023
2. Roth GA, Mensah GA, Johnson CO, Addolorato G, Ammirati E, Baddour LM, et al. Global burden of cardiovascular diseases and risk factors, 1990–2019: update from the GBD 2019 study. J Am Coll Cardiol (2020) 76(25):2982–3021. doi: 10.1016/j.jacc.2020.11.010
3. Love KM, Liu Z. DPP4 activity, hyperinsulinemia, and atherosclerosis. J Clin Endocrinol Metab (2021) 106(6):1553–65. doi: 10.1210/clinem/dgab078
4. Falk E, Nakano M, Bentzon JF, Finn AV, Virmani R. Update on acute coronary syndromes: the pathologists' view. Eur Heart J (2013) 34(10):719–28. doi: 10.1093/eurheartj/ehs411
5. Locateli JC, Lopes WA, Simões CF, de Oliveira GH, Oltramari K, Bim RH, et al. Triglyceride/glucose index is a reliable alternative marker for insulin resistance in south American overweight and obese children and adolescents. J Pediatr Endocrinol Metab (2019) 32(10):1163–70. doi: 10.1515/jpem-2019-0037
6. Li H, Zuo Y, Qian F, Chen S, Tian X, Wang P, et al. Triglyceride-glucose index variability and incident cardiovascular disease: a prospective cohort study. Cardiovasc Diabetol (2022) 21(1):105. doi: 10.1186/s12933-022-01541-5
7. Zhao X, Wang Y, Chen R, Li J, Zhou J, Liu C, et al. Triglyceride glucose index combined with plaque characteristics as a novel biomarker for cardiovascular outcomes after percutaneous coronary intervention in ST-elevated myocardial infarction patients: an intravascular optical coherence tomography study. Cardiovasc Diabetol (2021) 20(1):131. doi: 10.1186/s12933-021-01321-7
8. Park GM, Cho YR, Won KB, Yang YJ, Park S, Ann SH, et al. Triglyceride glucose index is a useful marker for predicting subclinical coronary artery disease in the absence of traditional risk factors. Lipids Health Dis (2020) 19(1):7. doi: 10.1186/s12944-020-1187-0
9. Antonopoulos AS, Sanna F, Sabharwal N, Thomas S, Oikonomou EK, Herdman L, et al. Detecting human coronary inflammation by imaging perivascular fat. Sci Transl Med (2017) 9(398):eaal2658. doi: 10.1126/scitranslmed.aal2658
10. Oikonomou EK, Marwan M, Desai MY, Mancio J, Alashi A, Hutt Centeno E, et al. Non-invasive detection of coronary inflammation using computed tomography and prediction of residual cardiovascular risk (the CRISP CT study): a post-hoc analysis of prospective outcome data. Lancet (2018) 392(10151):929–39. doi: 10.1016/S0140-6736(18)31114-0
11. Serruys PW, Hara H, Garg S, Kawashima H, Nørgaard BL, Dweck MR, et al. Coronary computed tomographic angiography for complete assessment of coronary artery disease: JACC state-of-the-Art review. J Am Coll Cardiol (2021) 78(7):713–36. doi: 10.1016/j.jacc.2021.06.019
12. Motoyama S, Ito H, Sarai M, Kondo T, Kawai H, Nagahara Y, et al. Plaque characterization by coronary computed tomography angiography and the likelihood of acute coronary events in mid-term follow-up. J Am Coll Cardiol (2015) 66(4):337–46. doi: 10.1016/j.jacc.2015.05.069
13. Halon DA, Lavi I, Barnett-Griness O, Rubinshtein R, Zafrir B, Azencot M, et al. Plaque morphology as predictor of late plaque events in patients with asymptomatic type 2 diabetes: a long-term observational study. JACC Cardiovasc Imaging (2019) 12(7 Pt 2):1353–63. doi: 10.1016/j.jcmg.2018.02.025
14. Nerlekar N, Ha FJ, Cheshire C, Rashid H, Cameron JD, Wong DT, et al. Computed tomographic coronary angiography-derived plaque characteristics predict major adverse cardiovascular events: a systematic review and meta-analysis. Circ Cardiovasc Imaging (2018) 11(1):e006973. doi: 10.1161/CIRCIMAGING.117.006973
15. Marin D, Fananapazir G, Mileto A, Choudhury KR, Wilson JM, Nelson RC. Dual-energy multi-detector row CT with virtual monochromatic imaging for improving patient-to-patient uniformity of aortic enhancement during CT angiography: an in vitro and in vivo study. Radiology (2014) 272:895–902. doi: 10.1148/radiol.14132857
16. Jia Y, Xiao X, Sun Q, Jiang H. CT spectral parameters and serum tumour markers to differentiate histological types of cancer histology. Clin Radiol (2018) 73:1033–40. doi: 10.1016/j.crad.2018.07.104
17. Goo HW, Goo JM. Dual-energy CT: new horizon in medical imaging. Korean J Radiol (2017) 18:555–69. doi: 10.3348/kjr.2017.18.4.555
18. Matsumoto K, Jinzaki M, Tanami Y, Ueno A, Yamada M, Kuribayashi S. Virtual monochromatic spectral imaging with fast kilovoltage switching: improved image quality as compared with that obtained with conventional 120-kVp CT. Radiology (2011) 259:257–62. doi: 10.1148/radiol.11100978
19. Rassouli N, Etesami M, Dhanantwari A, Rajiah P. Detector-based spectral CT with a novel dual-layer technology: principles and applications. Insights Imaging (2017) 8(6):589–98. doi: 10.1007/s13244-017-0571-4
20. Huang X, Gao S, Ma Y, Lu X, Jia Z, Hou Y. The optimal monoenergetic spectral image level of coronary computed tomography (CT) angiography on a dual-layer spectral detector CT with half-dose contrast media. Quant Imaging Med Surg (2020) 10:592–603. doi: 10.21037/qims.2020.02.17
21. Yi Y, Zhao XM, Wu RZ, Wang Y, Vembar M, Jin ZY, et al. Low dose and low contrast medium coronary CT angiography using dual-layer spectral detector CT. Int Heart J (2019) 60(3):608–17. doi: 10.1536/ihj.18-340
22. Zopfs D, Lennartz S, Laukamp K, Grosse Hokamp N, Mpotsaris A, Maintz D, et al. Improved depiction of atherosclerotic carotid artery stenosis in virtual monoenergetic reconstructions of venous phase dual-layer computed tomography in comparison to polyenergetic reconstructions. Eur J Radiol (2018) 100:36–42. doi: 10.1016/j.ejrad.2018.01.008
23. Neuhaus V, Abdullayev N, Grosse Hokamp N, Pahn G, Kabbasch C, Mpotsaris A, et al. Improvement of image quality in unenhanced dual-layer CT of the head using virtual monoenergetic images compared with polyenergetic single-energy CT. Invest Radiol (2017) 52:470–6. doi: 10.1097/RLI.0000000000000367
24. Chen X, Dang Y, Hu H, Ma S, Ma Y, Wang K, et al. Pericoronary adipose tissue attenuation assessed by dual-layer spectral detector computed tomography is a sensitive imaging marker of high-risk plaques. Quant Imaging Med Surg (2021) 11:2093–103. doi: 10.21037/qims-20-860
25. Dang Y, Chen X, Ma S, Ma Y, Ma Q, Zhou K, et al. Association of pericoronary adipose tissue quality determined by dual-layer spectral detector CT with severity of coronary artery disease: a preliminary study. Front Cardiovasc Med (2021) 8:720127. doi: 10.3389/fcvm.2021.720127
26. Goeller M, Achenbach S, Cadet S, Kwan AC, Commandeur F, Slomka PJ, et al. Pericoronary adipose tissue computed tomography attenuation and high-risk plaque characteristics in acute coronary syndrome compared with stable coronary artery disease. JAMA Cardiol (2018) 3(9):858–63. doi: 10.1001/jamacardio.2018.1997
27. Goeller M, Tamarappoo BK, Kwan AC, Cadet S, Commandeur F, Razipour A, et al. Relationship between changes in pericoronary adipose tissue attenuation and coronary plaque burden quantified from coronary computed tomography angiography. Eur Heart J Cardiovasc Imaging (2019) 20(6):636–43. doi: 10.1093/ehjci/jez013
28. Lu MT, Park J, Ghemigian K, Mayrhofer T, Puchner SB, Liu T, et al. Epicardial and paracardial adipose tissue volume and attenuation - association with high-risk coronary plaque on computed tomographic angiography in the ROMICAT II trial. Atherosclerosis (2016) 251:47–54. doi: 10.1016/j.atherosclerosis.2016.05.033
29. Rodriguez-Granillo GA, Capunay C, Deviggiano A, De Zan M, Carrascosa P. Regional differences of fat depot attenuation using non-contrast, contrast-enhanced, and delayed-enhanced cardiac CT. Acta Radiol (2019) 60:459–67. doi: 10.1177/0284185118787356
30. Tian X, Zuo Y, Chen S, Liu Q, Tao B, Wu S, et al. Triglyceride-glucose index is associated with the risk of myocardial infarction: an 11-year prospective study in the kailuan cohort. Cardiovasc Diabetol (2021) 20(1):19. doi: 10.1186/s12933-020-01210-5
31. Hari Kumar KVS. The good, the bad, and the ugly facets of insulin resistance. Med J Armed Forces India (2020) 76(1):4–7. doi: 10.1016/j.mjafi.2019.07.001
32. Zhang F, Kadierding R, Zhang S, Yang H, Ren L, Ren M, et al. Triglyceride glucose index for predicting major adverse cardiovascular events in Chinese patients with hypertension. Angiology (2023) 74(3):259–67. doi: 10.1177/00033197221104559
33. Del Turco S, Gaggini M, Daniele G, Basta G, Folli F, Sicari R, et al. Insulin resistance and endothelial dysfunction: a mutual relationship in cardiometabolic risk. Curr Pharm Des (2013) 19(13):2420–31. doi: 10.2174/1381612811319130010
34. McLaughlin T, Sherman A, Tsao P, Gonzalez O, Yee G, Lamendola C, et al. Enhanced proportion of small adipose cells in insulin-resistant vs insulin-sensitive obese individuals implicates impaired adipogenesis. Diabetologia (2007) 50(8):1707–15. doi: 10.1007/s00125-007-0708-y
35. Pessis E, Campagna R, Sverzut JM, Bach F, Rodallec M, Guerini H, et al. Virtual monochromatic spectral imaging with fast kilovoltage switching: reduction of metal artifacts at CT. Radiographics (2013) 33(2):573–83. doi: 10.1148/rg.332125124
Keywords: pericoronary adipose tissue, dual-layer spectral detector computed tomography, coronary artery disease, fat attenuation index, triglyceride-glucose index, insulin resistance
Citation: Ma Y, Zhen Y, Wang M, Gao L, Dang Y, Shang J, Chen X, Ma S, Zhou K, Feng K, Xin Y, Hou Y and Guo C (2023) Associations between the serum triglyceride-glucose index and pericoronary adipose tissue attenuation and plaque features using dual-layer spectral detector computed tomography: a cross-sectional study. Front. Endocrinol. 14:1166117. doi: 10.3389/fendo.2023.1166117
Received: 14 February 2023; Accepted: 28 April 2023;
Published: 10 May 2023.
Edited by:
Gaetano Santulli, Albert Einstein College of Medicine, United StatesReviewed by:
Federico Bernardini, Campus Bio-Medico University Hospital, ItalyJennifer Mancio, Guy’s and St Thomas’ NHS Foundation Trust, United Kingdom
Copyright © 2023 Ma, Zhen, Wang, Gao, Dang, Shang, Chen, Ma, Zhou, Feng, Xin, Hou and Guo. This is an open-access article distributed under the terms of the Creative Commons Attribution License (CC BY). The use, distribution or reproduction in other forums is permitted, provided the original author(s) and the copyright owner(s) are credited and that the original publication in this journal is cited, in accordance with accepted academic practice. No use, distribution or reproduction is permitted which does not comply with these terms.
*Correspondence: Yang Hou, aG91eWFuZzE5NzNAMTYzLmNvbQ==; Chuanji Guo, Z3VvY2pAc2otaG9zcGl0YWwub3Jn