
94% of researchers rate our articles as excellent or good
Learn more about the work of our research integrity team to safeguard the quality of each article we publish.
Find out more
ORIGINAL RESEARCH article
Front. Endocrinol. , 13 June 2023
Sec. Adrenal Endocrinology
Volume 14 - 2023 | https://doi.org/10.3389/fendo.2023.1162725
This article is part of the Research Topic Advances in Diagnostics and Management of Adrenal Tumors View all 24 articles
 Jose María Enguita1†
 Ignacio Díaz1†
 Diego García1
 Tamara Cubiella2,3,4
 María-Dolores Chiara2,3,4*‡Nuria Valdés2,5*‡
Introduction: Paragangliomas (PGL), a type of neuroendocrine tumor, pose a significant diagnostic challenge due to their potential for unpredictable locations and asymptomatic presentation. Misdiagnosis of peripancreatic PGLs, particularly as pancreatic neuroendocrine tumors (PANNETs), is a pressing issue as it can negatively impact both pre- and post-treatment decision-making. The aim of our study was to identify microRNA markers for the reliable differential diagnosis of peripancreatic PGLs and PANNETs, addressing a crucial unmet need in the field and advancing the standard of care for these patients.
Methods: Morphing projections tool was used to analyze miRNA data from PGL and PANNET tumors present in the TCGA database. The findings were validated using two additional databases: GSE29742 and GSE73367.
Results: Our research uncovered substantial differences in the miRNA expression profiles of PGL and PANNET, leading to the identification of 6 key miRNAs (miR-10b-3p, miR-10b-5p, and the miRNA families miR-200c/141 and miR-194/192) that can effectively differentiate between the two types of tumors.
Discussion: These miRNA levels hold potential as biomarkers for improved diagnosis, offering a solution to the diagnostic challenge posed by these tumors and potentially improving the standard of care for patients.
Paragangliomas (PGLs) are neuroendocrine tumors with high genetic predisposition. They originate from catecholamine-secreting paraganglionic cells that have a widespread distribution in humans. PGL can have or not a hypersecretory phenotype. They are categorized based in their origin as either parasympathetic or sympathetic. Parasympathetic PGLs are typically found near the aortic arch, neck, and skull base, while sympathetic PGLs arise along the paravertebral axis, retroperitoneum, in the abdomen and pelvis, with the largest forming the adrenal medulla. The term “pheochromocytoma” specifically refers to intra-adrenal sympathetic PGLs according to the latest WHO guidelines (1). PGLs are highly heritable, with approximately 50% of cases associated with a germline mutation in one of at least 15 genes, making them the most heritable tumours in humans. They can occur as part of well-established hereditary syndromes, including multiple endocrine neoplasia type 2A and 2B, von Hippel–Lindau syndrome, neurofibromatosis type 1 and familial paraganglioma syndromes, caused by pathogenic variants in genes encoding Ret Proto-Oncogene (RET), Von Hippel Lindau protein (VHL), Neurofibromin 1 (NF1), or components of the succinate dehydrogenase (SDH) complex, respectively.
Given the widespread distribution of paraganglia, PGL can occur at virtually all locations in the body except the brain and bones. The emergence of PGL in atypical locations can cause confusion and result in missed diagnoses (2). The histopathologic diagnosis is straightforward for PGLs that present in an expected location with classic catecholamine excess symptoms. However, missed diagnoses can occur when the PGLs are in unusual locations, the patient is asymptomatic, or the PGLs do not secrete catecholamines.
Diagnosing peripancreatic PGLs that resemble primary pancreatic lesions can be difficult as they often lack typical PGL symptoms (3, 4). This can be further complicated by the fact that around 10% of pancreatic neuroendocrine tumors are associated with hereditary syndromes like multiple endocrine neoplasia type I (MEN1), von Hippel–Lindau syndrome, neurofibromatosis type 1, and tuberous sclerosis complex (TSC). Preoperative diagnosis can be done through fine-needle aspiration and biopsy, but PGLs and PANNET can have similar morphologic characteristics, leading to misdiagnosis (5–8). Accurate diagnosis is crucial for proper pre- and post-treatment decision-making (9). Therefore, differentiating peripancreatic PGLs from PANNETs is a crucial aspect of clinical practice. Our previous study revealed similarities in genetic profiles but differences in microRNA profiles between the two neoplasms (10). The goal of the present study was to identify microRNA markers that enable differential diagnosis of peripancreatic PGL and PANNET.
The Cancer Genome Atlas (TCGA) provides gene expression measurements and other transcription data, including more than 20,000 mRNA and hundreds of miRNA expression levels for more than 10,000 tumors from 33 different cancer types. In this study we consider gene expression RNAseq data of cancer cohorts identified as primary paraganglioma (abbreviated here as PGL: pheochromocytoma and paraganglioma, n=149) and pancreatic neuroendocrine tumors (PANNET; 7 samples) (11) from the TCGA Hub. Data were downloaded from the Xenabrowser portal https://xenabrowser.net/datapages/. For every cohort we merged: (a) data containing experimental measurements using the Illumina HiSeq 2000 RNA Sequencing platform and mean-normalized per gene across all cohorts; and (b) data with miRNA mature strand expression RNAseq. The resulting table including gene and miRNA expression levels in units of log2(RPM+1) (RPM=Reads per million), was curated by dropping genes and miRNA with invalid values, and later merged with clinical metadata (downloadable from https://portal.gdc.cancer.gov). This allowed for the analysis of 294 miRNAs.
We used the t-Distributed Stochastic Neighbor Embedding (t-SNE) algorithm, which is a highly effective method for dimensionality reduction, to visually depict the analyzed tissues according to their genetic signature (12). This approach organizes the samples spatially based on their similarities in gene and miRNA expression, resulting in a visual map containing clusters of samples that exhibit similar genetic characteristics, thereby providing a comprehensive understanding of the predominant genetic profiles present within the analyzed samples.
For the exploratory analysis of the TCGA data we used an in-house developed application that implements the Morphing Projections technique (10). This tool facilitates a user-controlled arrangement of the data to enhance the exploration process, which permits a swift comparison of t-SNE plots constructed with diverse gene and/or miRNA lists, thereby enabling the visual identification of varying genetic patterns based on the chosen lists. Additionally, the tool is highly effective for selecting the samples to be examined, which helps to effectively categorize the data for differential genetic analysis.
Along with the morphing projections technique, the tool features statistical functionality, including the use of logistic regression to find genes or miRNA that best explain the differentiation between two groups selected by the user: miRNAs with higher estimated coefficients, as determined by the logistic regression model, have a greater impact on differentiation. This idea was originally introduced by Clark et al. in 2014 (13), in which they aimed to obtain the “characteristic direction” vector in the multidimensional space, and then to select the main components. However, given the limited number of samples in this case, it is crucial to take additional steps to verify the results. To this end, ANOVA tests are conducted to evaluate the statistical significance of the difference in expression level of the miRNA in the two groups.
The morphing projections tool was used to analyze the PANNET and PGL included in TCGA. Smooth animated transitions from gene expression and miRNA expression t-SNE maps revealed a remarkably different genetic behavior of 7 samples that had been originally labelled as pancreatic adenocarcinoma. In the gene expression t-SNE view, these samples were grouped with PGL; however, when weight was given to a miRNA expression t-SNE view, they were found to move away. This suggests a similar gene expression profile, but different miRNA profile, as shown in Figure 1.
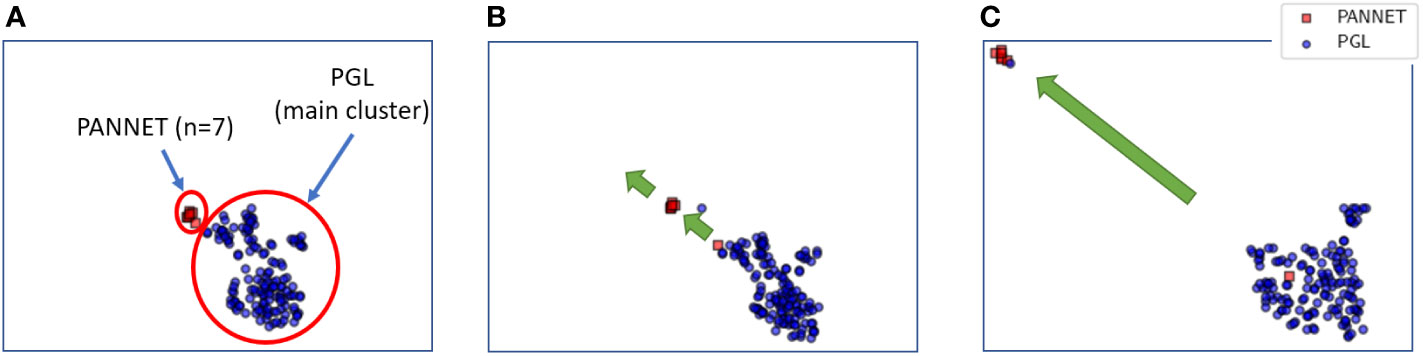
Figure 1 Smooth transition of t-SNE maps from gene expression profile (A) to miRNA expression profile (B, C). In the gene expression profile (A), PANNET samples cluster with PGL samples. However, as the weight of the t-SNE map shifts from gene expression to miRNA expression (B, C), the PANNET samples move away from the PGL samples.
To further investigate this differential expression, data was divided into five groups as shown in Figure 2. First, samples not classified as primary tumors (those with TCGA codes not ending in -01) were eliminated to form the main analysis group #1. Groups #2 and #3 were separated based on gender, with “male” and “female” samples analyzed separately to prevent bias due to unequal proportions of both genders in the PGL set (64 vs. 85). Similarly, groups #4 and #5 were created using race “white” (all 7 available PANNET samples are “white”) and ethnicity “not hispanic or latino” (6 of the 7 PANNET samples belong to this ethnicity, except one that is unclassified).
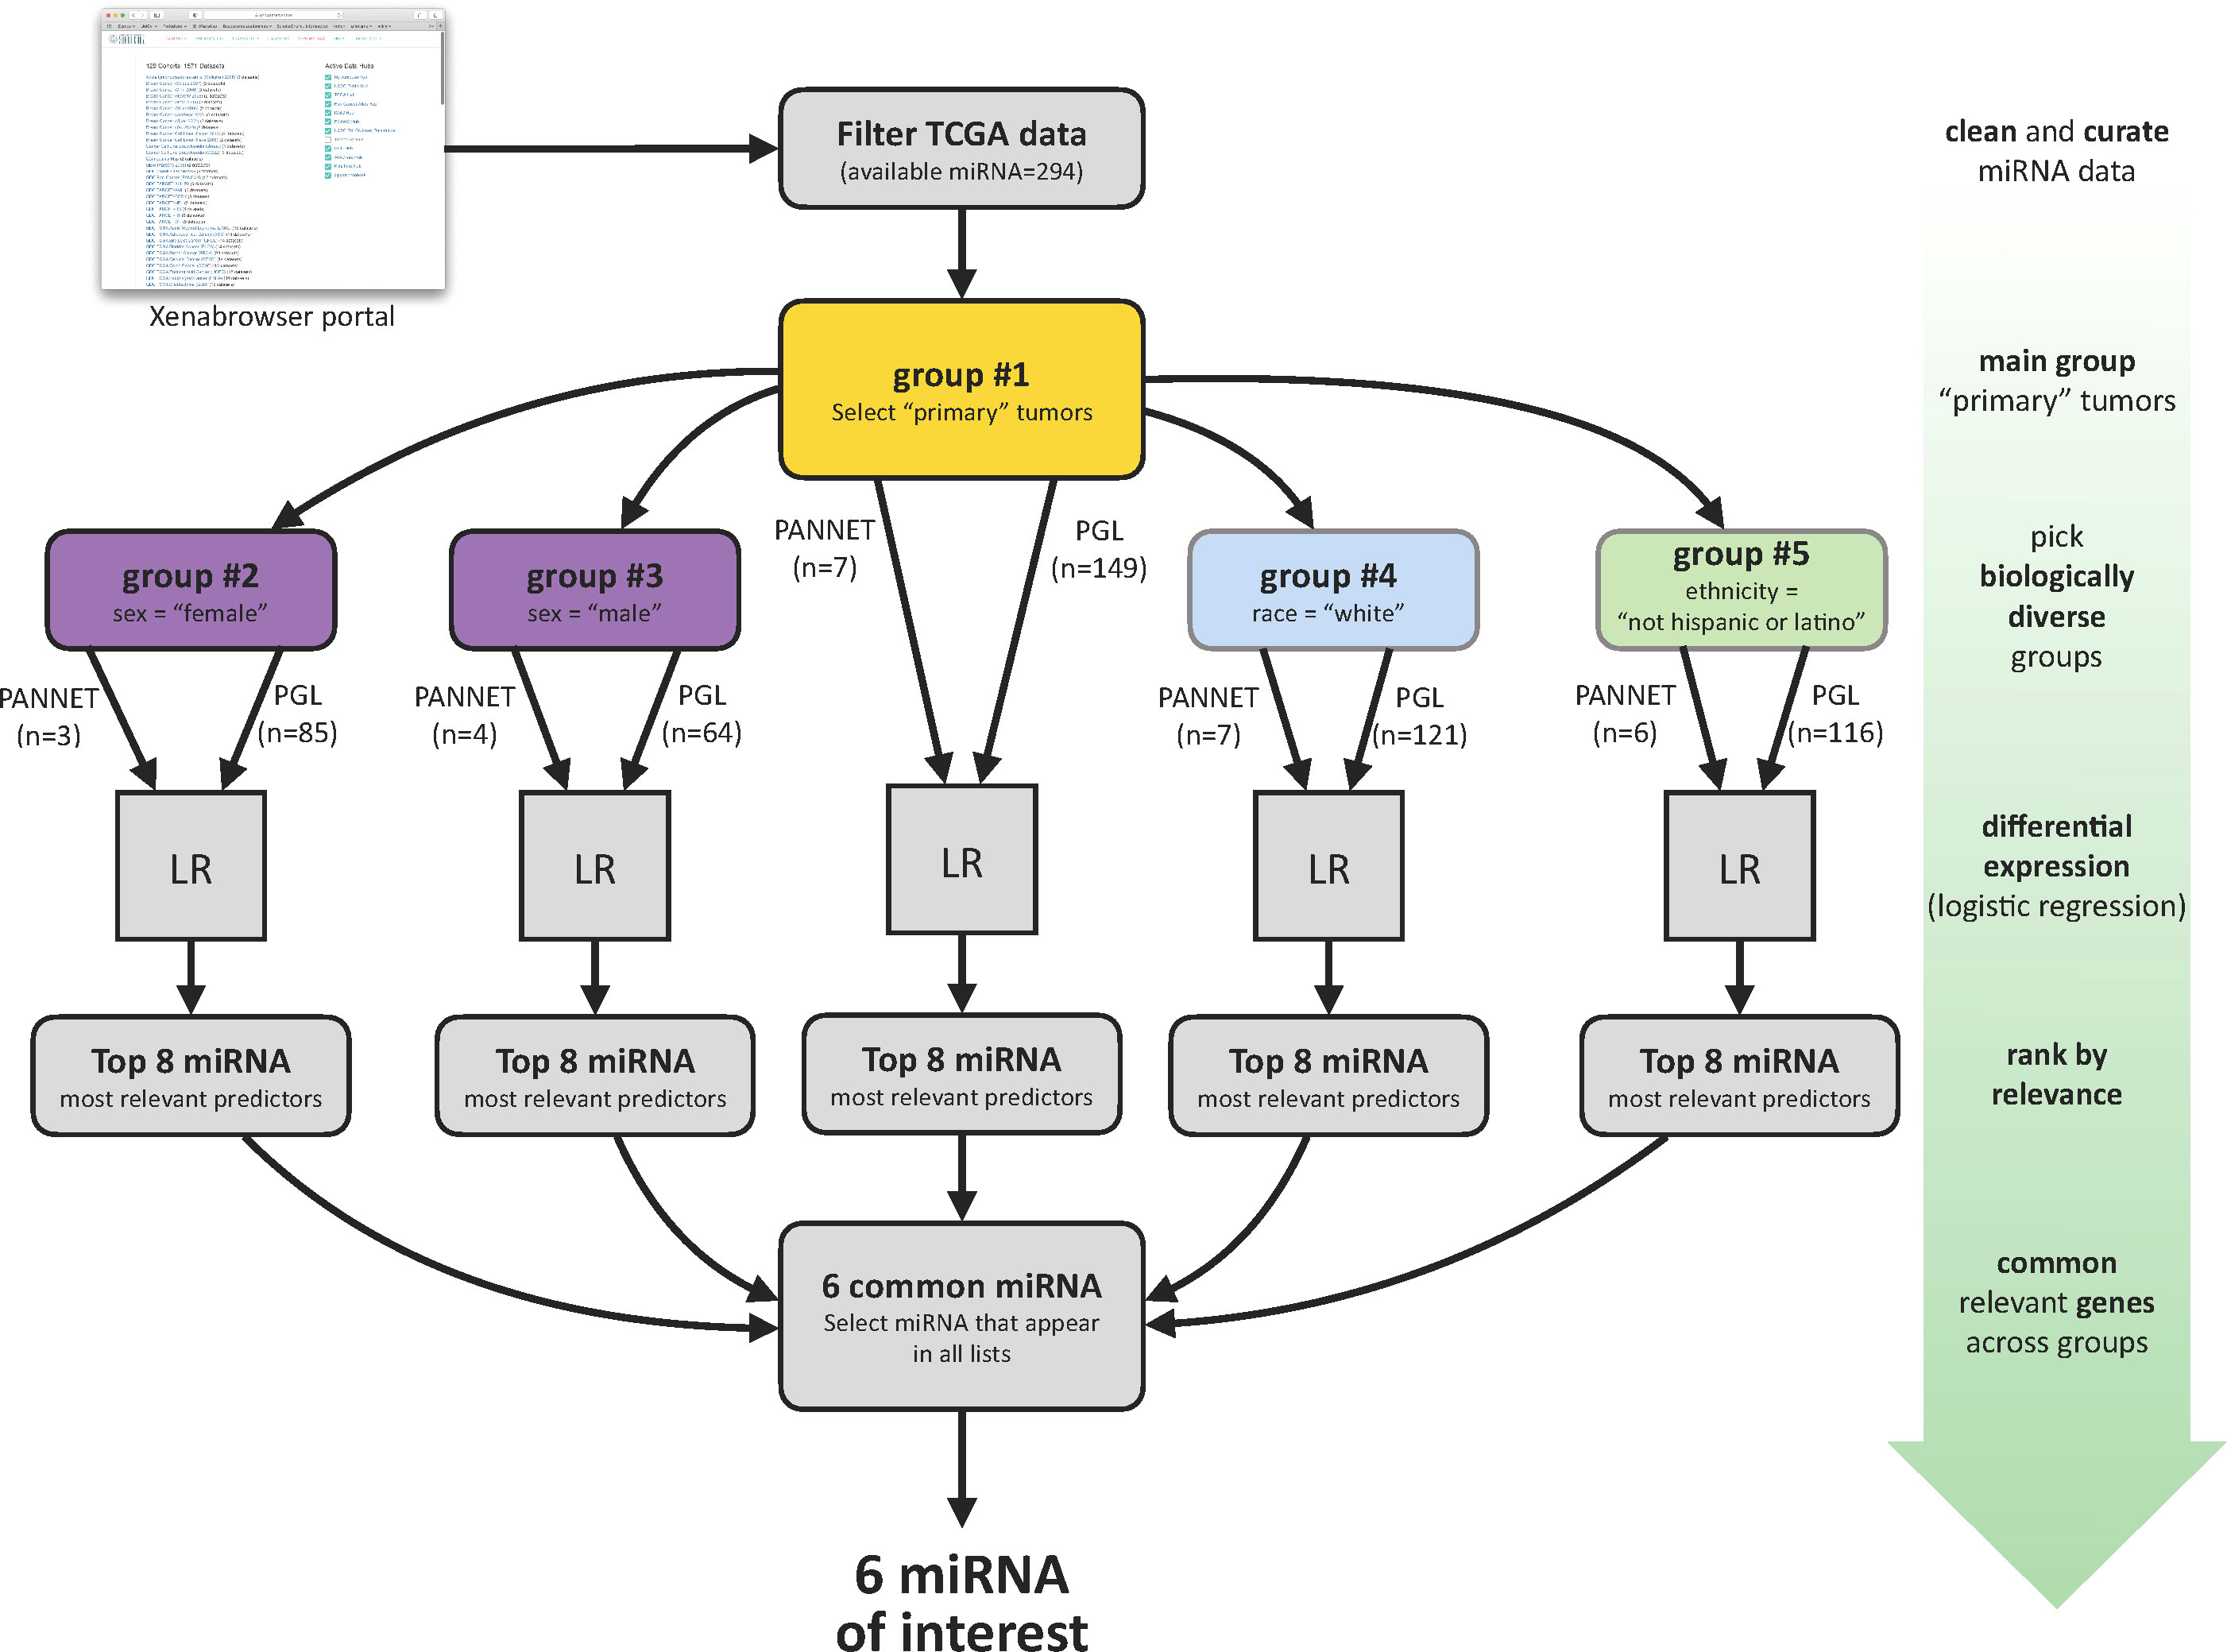
Figure 2 Summary of the data segregation and analysis pipeline for analysis between PANNET and PGL.
A logistic regression was conducted in each group to identify the most significant miRNAs, as explained in section 2.3, and ANOVA tests were performed to determine the statistical significance. As a result, six miRNAs (-141-3p, -200c-3p, -192-5p, -194-5p, -10b-5p and -10b-3p) were repeatedly found among the top eight positions in all lists and were selected for further analysis (Table 1 and Figure 3). Although more miRNAs could be considered, the six selected adequately explain the difference between both groups.
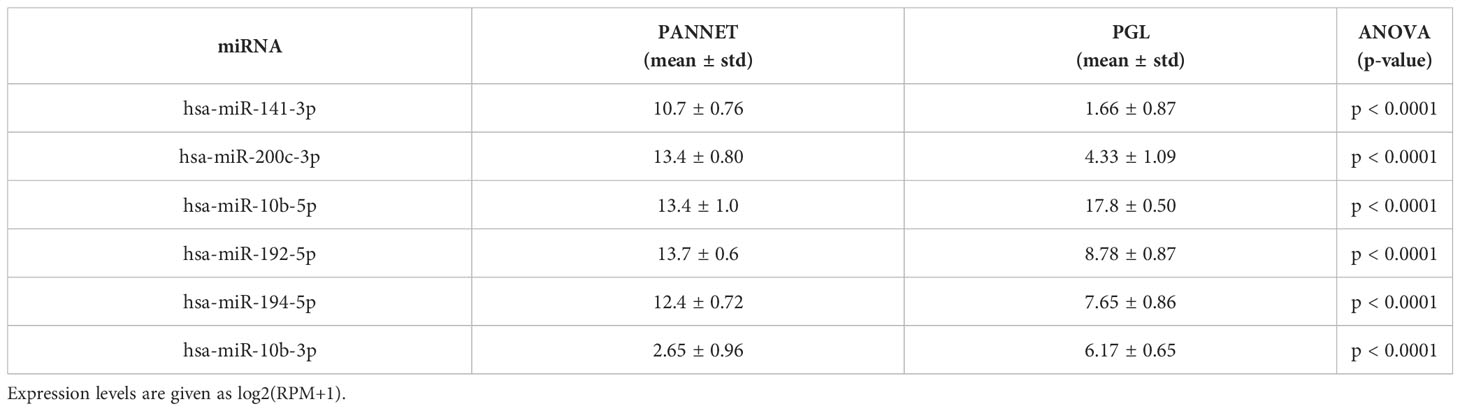
Table 1 Selected miRNAs of interest.
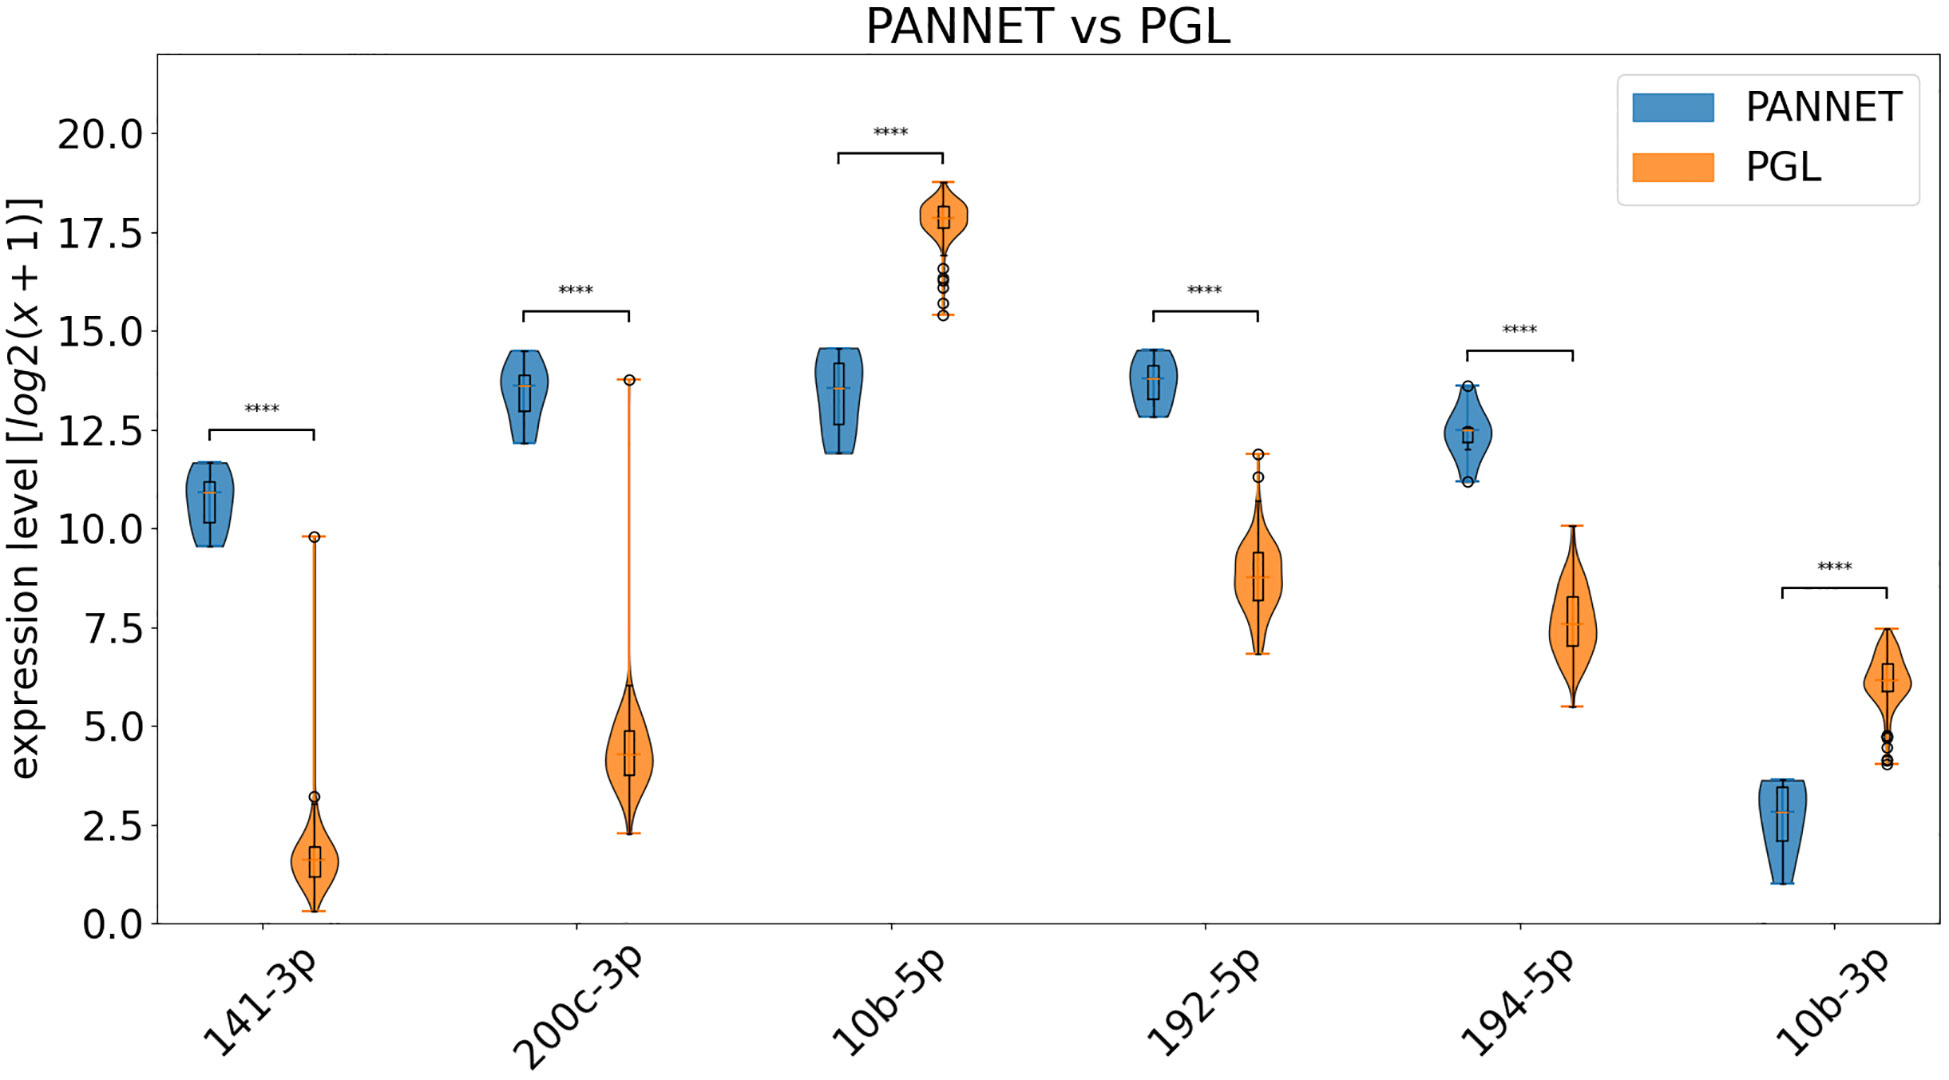
Figure 3 Violin diagrams showing the differential expression of the indicated miRNAs in PANNET and PGL included in the TCGA database. **** = p ≤ 0.0001.
To validate these data, we used the following datasets: GSE29742 (14), which includes miRNA data from fresh-frozen samples of 48 PGL: 37 pheochromocytomas and 11 paragangliomas; and GSE73367 (15) consisting of miRNA data from fresh-frozen samples of PANNET (n=50). By incorporating these datasets into our analysis, we also aimed to address the limitation of having only 7 PANNET samples. However, the use of various methodologies and normalization protocols complicates direct comparisons between different datasets (16). To address this issue, we applied percentile normalization to the data. In the absence of control samples, each value’s percentile was determined based on the full expression levels across all samples in the dataset. This approach allowed us to identify miRNAs that are overexpressed (high percentile values) or underexpressed (low percentile values) relative to the rest of the data.
Results are shown in Figure 4 and clearly confirm our findings for miR-141-3p, -200c-3p, -192-5p and -194-5p, which are clearly overexpressed in PANNETs versus PGL. Additionally, miRNA-10b-5p and miR-10b-3p are overexpressed in PGL compared to PANNET, and although the magnitude of the difference is lower, it is still statistically significant.
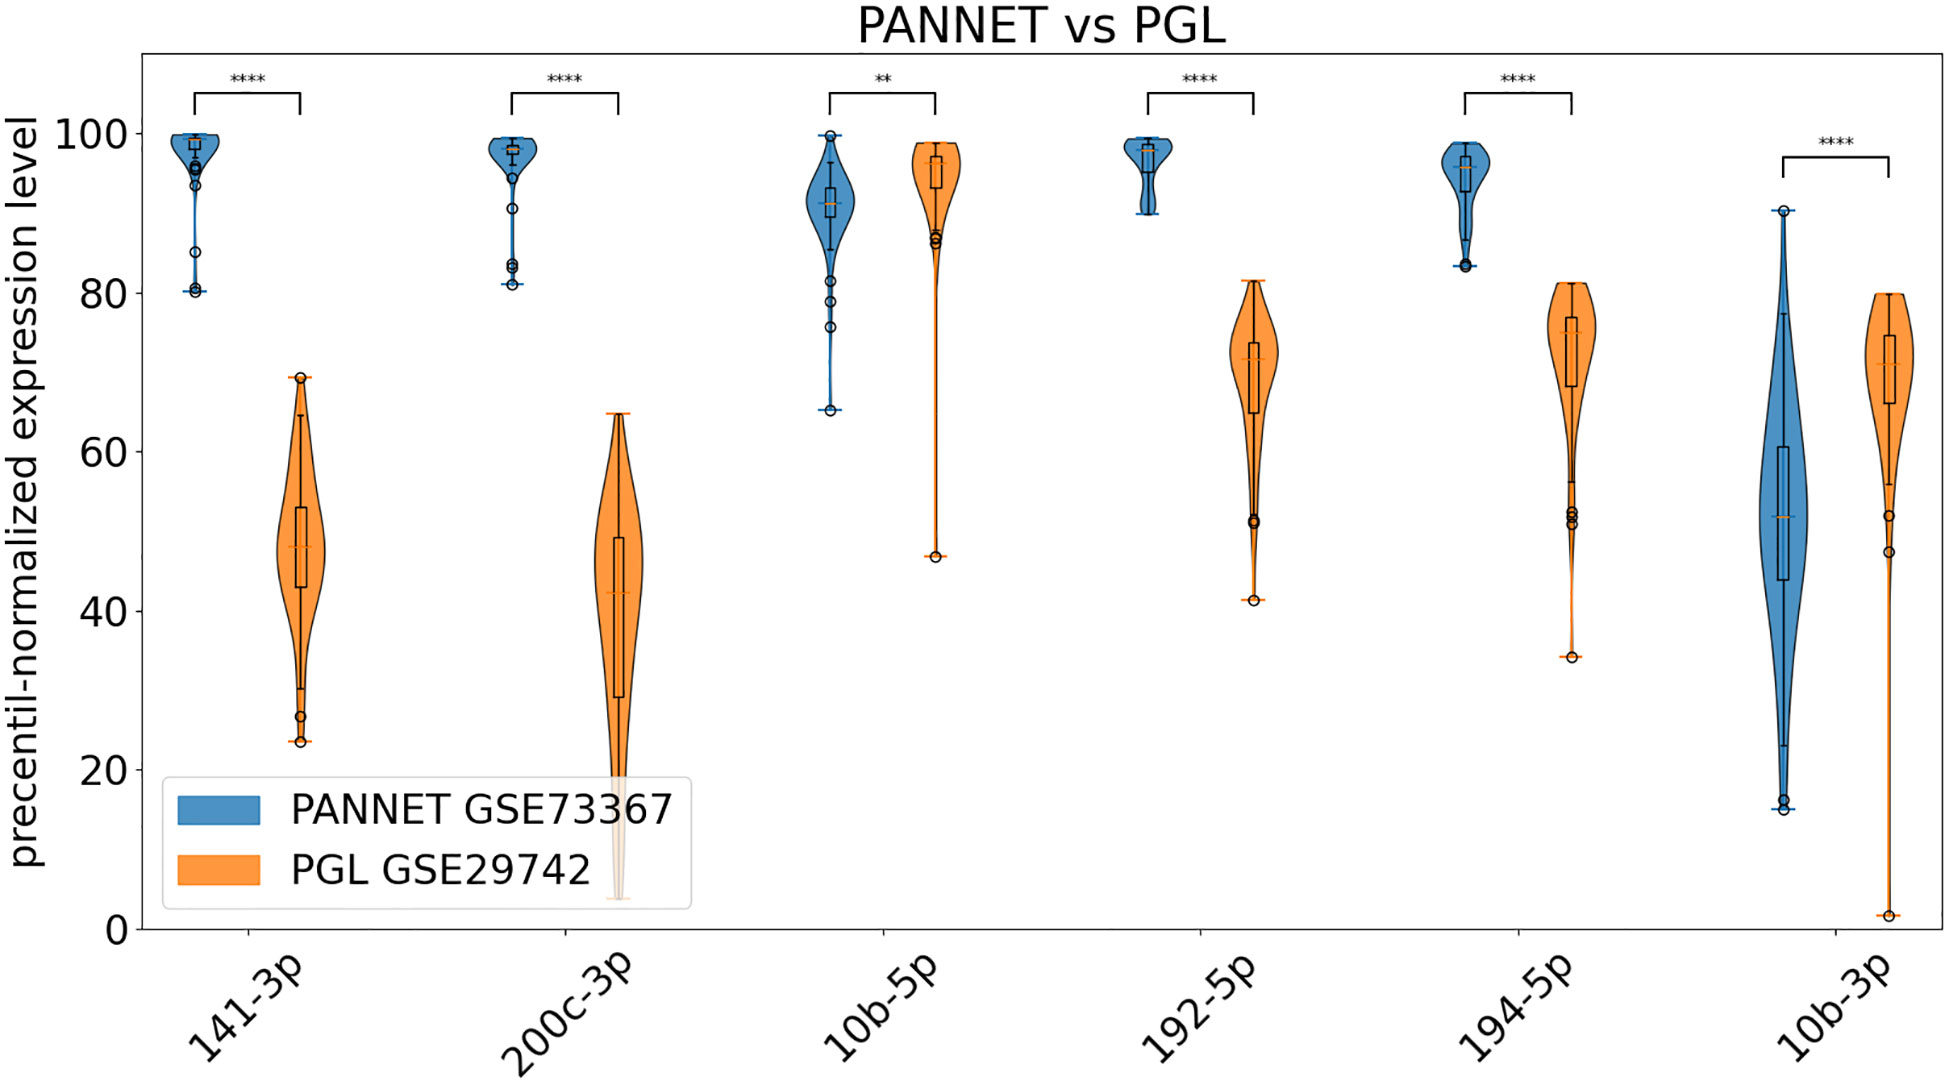
Figure 4 Percentile-normalized expression levels of the indicated miRNAs in PANNET, PGL from datasets GSE73367 and GSE29742 (** = p ≤ 0.01, **** = p ≤ 0.0001).
Our research has uncovered a remarkable similarity at the genetic level between PANNETs and PGLs, yet a striking dissimilarity in their miRNA expression profiles. We have identified 6 key miRNAs that can effectively distinguish between the two types of tumors, addressing a crucial need for more accurate diagnosis in the medical community.
We report here that 4 of the 6 identified miRNAs are elevated in PANNETs compared to PGLs. Interestingly, these microRNAs are members of two miRNA families: miR-200c/141-3p and miR-192/194. miRNA families often share similar sequences and structures, indicating a shared function (17). The miR-200c/141-3p family, located on chromosome 11p, has a complex role in cancer, acting as either an onco-miRNA or tumor suppressor depending on the type of cancer. It regulates epithelial-mesenchymal transition through targeting ZEB1/2 (18, 19) and has been linked to pro-apoptotic and anti-proliferative effects in several cancers, yet it also promotes tumor growth, invasion, and migration in others (20). High expression of miR-200c is associated with poor overall survival in gastric and non-small cell lung carcinomas (21, 22), but with better prognosis in ovarian and bladder cancer (23, 24). In pancreatic neuroendocrine cells, the promotion of beta cell survival by miR-200c has been demonstrated to be essential (25, 26). Meanwhile, miR-141 has demonstrated tumor suppressive effects in multiple cancers, including pancreatic adenocarcinomas (27). The role of miR-192/194 family in cancer is complex and still debated, with evidence supporting both oncogenic and tumor-suppressive effects (28). miR-192 has been shown to inhibit tumor angiogenesis (29), while miR-194 suppresses proliferation, migration, and metastasis and induces apoptosis in cancer cells (30–33). The functional significance and mechanisms of action of these two families of miRNAs in neuroendocrine tumors, such as PANNET and PGL, remains unclear. Further research is needed to fully understand their impact on these tumors.
Our study also showed that PGLs express higher levels of both the -3p and -5p strands of the miR-10b duplex compared to PANNETs. Traditionally, only one strand of the miRNA duplex, known as the functional strand, was thought to target specific mRNAs, while the other strand was degraded. However, recent research has revealed that both strands of the duplex can be functional (34), which could account for the accurate detection of both miR-10b strands in both PANNET and PGL. One study has reported that miR-10b can differentiate PGL from neuroblastoma (35). Our results further support its potential as a biomarker for differentiating PANNET from PGL. miR-10b has been shown to be de-regulated in several types of cancer, but it is still unclear if it is causally related to cancer initiation or progression (36–39). To date, many studies have shown that miR-10b could be involved on metastasis in a wide range of cancer types supporting a role for this miRNA in cancer progression (36).
Retroperitoneal PGLs, although rare, can occur in the vicinity of or within the pancreas, resembling primary pancreatic lesions. To date, literature records have documented approximately 56 peripancreatic PGLs (2, 6, 40–46). Distinguishing between PANNETs and PGLs is crucial for appropriate patient management, both preoperatively and postoperatively. An accurate diagnosis of PGLs is essential for preoperative planning as previous research has shown that perioperative mortality and morbidity can be high if a PGL is diagnosed during surgery. This is because induction of anesthesia and manipulation of the tumor during surgery can trigger catecholamine release. In addition, the majority of PGLs are benign; however, the risk of developing metastatic disease is higher in abdominal PGLs, with rates ranging from 11-36%. Currently, there are no reliable markers to predict malignancy, except for the presence of metastases. This highlights the need for follow-up for patients with PGLs as metastatic disease can appear years after diagnosis. Singhi et al (6), reported that 3 of 9 (33%) of patients diagnosed with peripancreatic PGL developed metastases within 5 years of surgery, and 2 of them died because of their disease. In another report (47), 13.9% exhibited a recurrence or widespread disease and one patient died 48 months following diagnosis. Additionally, it is important to note that more than 40% of abdominal PGLs carry a germline pathogenic gene variant, which has significant clinical implications for personalized surveillance and treatment and for the patient’s family.
Peripancreatic PGLs not only confound diagnosis through their clinical presentation and imaging characteristics, but also pose a significant challenge for even the most experienced pathologists. On surgical resection, both neoplasms are usually solitary, well-demarcated lesions with a fibrous border. In contrast to the peripancreatic PGLs, PANNETs are typically located inside the pancreatic parenchyma. However, parenchymal invasion was observed in many cases of peripancreatic PGLs with loss of zellballen architecture in these areas making accurate assessment of tumor location challenging. Moreover, PANNETs may display a variety of architectural patterns, including nested and solid growth, which may resemble a zellballen architecture.
By immunohistochemistry, both PGLs and some well-differentiated PANNETs demonstrate S-100-positive sustentacular cells. PANNETs are generally positive for cytokeratins AE1/AE3 and CAM 5.2, whereas PGLs are distinctly negative. Nevertheless, a more comprehensive panel of immunohistochemical stains, including cytokeratins, Vimentin, GATA-3 and/or Pax 8, has been recommended for accurate differentiation between the two types of tumors (6, 48, 49) as a single defining feature is not sufficient. In the absence of clear clinical indications, a diagnosis of a primary pancreatic neoplasm may be more likely than PGL. Ultimately, it is the responsibility of the pathologist to arrive at a definitive diagnosis of PGL. Our findings of using miR-200c/141-3p, miR-192/194 and miR-10b levels as potential biomarkers offer a promising solution to this challenge and hold significant implications for accurate diagnosis of PANNET and PGL.
The TCGA data, while balanced in terms of gender representation, lacks diversity in terms of race and ethnicity, as most samples are from the ‘white’ or ‘non-hispanic-or-latino’ groups. This could introduce bias, especially in the case of PANNET where all samples come from these groups. Moreover, the TCGA study only included data from a small number of PANNET samples (7), further limiting its representativeness. By incorporating additional datasets into our analysis, we aimed to address the constraint of a small sample size. However, it’s important to acknowledge that these validation datasets lack clinical data, preventing us from exploring variations in the expression levels of the identified microRNAs across different stages of the disease or determining whether the tumors with different behaviours (benign or malignant) exhibit distinct miRNA expression profiles. Therefore, it is crucial to validate the findings of this study using larger sample sizes that encompass diverse racial and ethnic backgrounds and include comprehensive clinical data to facilitate a broader analysis.
This study uncovered six key microRNAs (miR-10b-3p, miR-10b-5p, and the miRNA families miR-200c/141 and miR-194/192) that can effectively differentiate peripancreatic PGLs from PANNETs. These findings suggest that measuring the levels of these miRNAs in tumor tissue samples could serve as potential biomarkers for more accurate diagnosis, potentially improving the standard of care for patients.
Publicly available datasets were analyzed in this study. This data can be found here: https://portal.gdc.cancer.gov and in https://www.ncbi.nlm.nih.gov/ for the Gene Expression Omnibus: GSE29742 and GSE73367.
JE and ID designed and managed the data study. JE, ID and DG performed the data curation and analysis. The biomedical study was designed and managed by M-DC and NV. TC performed bioinformatics analysis. JE, ID, M-DC and NV wrote and reviewed the paper. All authors contributed to the article and approved the submitted version.
This research has been funded by the Spanish National Research Agency under grant number PID2020-115401GB-I00/AEI/10.13039/501100011033), the Instituto de Salud Carlos III through the project PI20/01754 co-funded by the European Union, the Network Biomedical Research Center–Cancer (CIBERONC), the Spanish Group of Orphan and Infrequent Tumors (GETHI) and the PHEiPAS Association.
The authors declare that the research was conducted in the absence of any commercial or financial relationships that could be construed as a potential conflict of interest.
All claims expressed in this article are solely those of the authors and do not necessarily represent those of their affiliated organizations, or those of the publisher, the editors and the reviewers. Any product that may be evaluated in this article, or claim that may be made by its manufacturer, is not guaranteed or endorsed by the publisher.
1. Mete O, Asa SL, Gill AJ, Kimura N, de Krijger RR, Tischler A. Overview of the 2022 WHO classification of paragangliomas and pheochromocytomas. Endocr Pathol (2022) 33:90–114. doi: 10.1007/s12022-022-09704-6
2. Asa SL, Ezzat S, Mete O. The diagnosis and clinical significance of paragangliomas in unusual locations. J Clin Med (2018) 7(9):280. doi: 10.3390/jcm7090280
3. Lightfoot N, Santos P, Nikfarjam M. Paraganglioma mimicking a pancreatic neoplasm. J Pancreas (2011) 12:259–61.doi: 10.6092/1590-8577/3293
4. Zamir O, Amir G, Lernau O, Ne’eman Z, Nissan S. Nonfunctional paraganglioma of the pancreas. Am J Gastroenterol (1984) 79(10):761–3.
5. Lanke G, Stewart JM, Lee JH. Pancreatic paraganglioma diagnosed by endoscopic ultrasound-guided fine needle aspiration: a case report and review of literature. World J Gastroenterol (2021) 27(37):6322–31. doi: 10.3748/wjg.v27.i37.6322
6. Singhi AD, Hruban RH, Fabre M, Imura J, Schulick R, Wolfgang C, et al. Peripancreatic paraganglioma: a potential diagnostic challenge in cytopathology and surgical pathology. Am J Surg Pathol (2011) 35(10):1498–504. doi: 10.1097/PAS.0b013e3182281767
7. Nguyen E, Nakasaki M, Lee TK, Lu D. Diagnosis of paraganglioma as a pancreatic mass: a case report. Diagn Cytopathol (2018) 46(9):804–6. doi: 10.1002/dc.23974
8. Baumrucker C, Kalavar M, Barkin JA, Franceschi D. The case of an asymptomatic pheochromocytoma masquerading as a pancreatic neuroendocrine tumor. Pancreas (2020) 49(7):e65–6. doi: 10.1097/MPA.0000000000001618
9. Straka M, Soumarova R, Migrova M, Vojtek C. Pancreatic paraganglioma - a rare and dangerous entity. vascular anatomy and impact on management. J Surg Case Rep (2014) 2014(7):rju074. doi: 10.1093/jscr/rju074
10. Díaz I, Enguita JM, González A, García D, Cuadrado AA, Chiara MD, et al. Morphing projections: a new visual technique for fast and interactive large-scale analysis of biomedical datasets. Bioinformatics (2021) 37(11):1571–80. doi: 10.1093/bioinformatics/btaa989
11. Peran I, Madhavan S, Byers SW, McCoy MD. Curation of the pancreatic ductal adenocarcinoma subset of the cancer genome atlas is essential for accurate conclusions about survival-related molecular mechanisms. Clin Cancer Res (2018) 24(16):3813–9. doi: 10.1158/1078-0432.CCR-18-0290
12. Van Der Maaten I, Hinton G. Visualizing data using t-SNE. J Mach Learn Res (2008) 9(86):2579–625.
13. Clark NR, Hu KS, Feldmann AS, Kou Y, Chen EY, Duan Q, et al. The characteristic direction: a geometrical approach to identify differentially expressed genes. BMC Bioinf (2014) 15:79. doi: 10.1186/1471-2105-15-79
14. de Cubas AA, Leandro-García LJ, Schiavi F, Mancikova V, Comino-Méndez I, Inglada-Pérez L, et al. Integrative analysis of miRNA and mRNA expression profiles in pheochromocytoma and paraganglioma identifies genotype-specific markers and potentially regulated pathways. Endocr Relat Cancer (2013) 20(4):477–93. doi: 10.1530/ERC-12-0183
15. Sadanandam A, Grotzinger C, Wiedenmann B, Hanahan D. A cross species and multi-omics (including metabolomics) analysis in pancreatic neuroendocrine tumours (miRNA). NCBI GEO Database: Accession GSE73367 (2015).
16. Malczewska A, Kidd M, Matar S, Kos-Kudla B, Modlin IM. A comprehensive assessment of the role of miRNAs as biomarkers in gastroenteropancreatic neuroendocrine tumors. Neuroendocrinology (2018) 107(1):73–90. doi: 10.1159/000487326
17. Kaczkowski B, Torarinsson E, Reiche K, Havgaard JH, Stadler PF, Gorodkin J. Structural profiles of human miRNA families from pairwise clustering. Bioinformatics (2009) 25(3):291–4. doi: 10.1093/bioinformatics/btn628
18. Korpal M, Lee ES, Hu G, Kang Y. The miR-200 family inhibits epithelial-mesenchymal transition and cancer cell migration by direct targeting of e-cadherin transcriptional repressors ZEB1 and ZEB2. J Biol Chem (2008) 283:14910–4. doi: 10.1074/jbc.C800074200
19. Park SM, Gaur AB, Lengyel E, Peter ME. The miR-200 family determines the epithelial phenotype of cancer cells by targeting the e-cadherin repressors ZEB1 and ZEB2. Genes Dev (2008) 22:894–907. doi: 10.1038/ncb1722
20. Klicka K, Grzywa TM, Mielniczuk A, Klinke A, Włodarski PK. The role of miR-200 family in the regulation of hallmarks of cancer. Front Oncol (2022) 8:965231(12). doi: 10.3389/fonc.2022.965231
21. Huang ZS, Guo XW, Zhang G, Liang LX, Nong B. The diagnostic and prognostic value of miR-200c in gastric cancer: a meta-analysis. Dis Markers (2019) 2019:8949618. doi: 10.1155/2019/8949618
22. Tejero R, Navarro A, Campayo M, Viñolas N, Marrades RM, Cordeiro A. miR-141 and miR-200c as markers of overall survival in early stage non-small cell lung cancer adenocarcinoma. PloS One (2014) 9:e101899. doi: 10.1371/journal.pone.0101899
23. Shi C, Zhang Z. The prognostic value of the miR-200 family in ovarian cancer: a meta-analysis. Acta Obstet Gynecol Scand (2016) 95:505–12. doi: 10.1111/aogs.12883
24. Mei Y, Zheng J, Xiang P, Liu C, Fan Y. Prognostic value of the miR-200 family in bladder cancer: a systematic review and meta-analysis. Med (Baltimore) (2020) 99:e22891. doi: 10.1097/MD.0000000000022891
25. Belgardt BF, Ahmed K, Spranger M, Latreille M, Denzler R, Kondratiuk N. The microRNA-200 family regulates pancreatic beta cell survival in type 2 diabetes. Nat Med (2015) 21(6):619–27. doi: 10.1038/nm.3862
26. Title AC, Silva PN, Godbersen S, Hasenöhrl L, Stoffel M. The miR-200-Zeb1 axis regulates key aspects of β-cell function and survival in vivo. Mol Metab (2021) 53:101267. doi: 10.1016/j.molmet.2021.101267
27. Zhao G, Wang B, Liu Y, Zhang JG, Deng SC, Qin Q. miRNA-141, downregulated in pancreatic cancer, inhibits cell proliferation and invasion by directly targeting MAP4K4. Mol Cancer Ther (2013) 12:2569–80. doi: 10.1158/1535-7163.MCT-13-0296
28. Mishan MA, Tabari MAK, Parnian J, Fallahi J, Mahrooz A, Bagheri A. Functional mechanisms of miR-192 family in cancer. Genes Chromosomes Cancer (2020) 59:722–35. doi: 10.1002/gcc.22889
29. Wu SY, Rupaimoole R, Shen F, Pradeep S, Pecot CV, Ivan C, et al. A miR-192-EGR1-HOXB9 regulatory network controls the angiogenic switch in cancer. Nat Commun (2016) 7:11169. doi: 10.1038/ncomms11169
30. Meng Z, Fu X, Chen X, Zeng S, Tian Y, Jove R, et al. miR-194 is a marker of hepatic epithelial cells and suppresses metastasis of liver cancer cells in mice. Hepatology (2010) 52(6):2148–57. doi: 10.1002/hep.23915
31. Ran RZ, Chen J, Cui LJ, Lin XL, Fan MM, Cong ZZ, et al. miR-194 inhibits liver cancer stem cell expansion by regulating RAC1 pathway. Exp Cell Res (2019) 378(1):66–75. doi: 10.1016/j.yexcr.2019.03.007
32. Wang J, Zhang M, Hu X, She J, Sun R, Qin S, Li D. miRNA-194 predicts favorable prognosis in gastric cancer and inhibits gastric cancer cell growth by targeting CCND1. FEBS Open Bio (2021) 11(7):1814–1826. doi: 10.1002/2211-5463.13125
33. Wu X, Liu T, Fang O, Leach L, Hu X, Luo Z. miR-194 suppresses metastasis of non-small cell lung cancer through regulating expression of BMP1 and p27 kip1. Oncogene (2014) 33(12):1506–14. doi: 10.1038/onc.2013.108
34. Mitra R, Adams CM, Jiang W, Greenawalt E, Eischen CM. Pan-cancer analysis reveals cooperativity of both strands of microRNA that regulate tumorigenesis and patient survival. Nat Commun (2020) 11(1):968. doi: 10.1038/s41467-020-14713-2
35. Korotaeva A, Mansorunov D, Apanovich N, Kuzevanova A, Karpukhin A. MiRNA expression in neuroendocrine neoplasms of frequent localization localizations. Noncoding RNA (2021) 7(3):38. doi: 10.3390/ncrna7030038
36. Huang L, Lin JX, Yu YH, Zhang MY, Wang HY, Zheng M. Downregulation of six microRNAs is associated with advanced stage, lymph node metastasis and poor prognosis in small cell carcinoma of the cervix. PloS One (2012) 7:e33762. doi: 10.1371/journal.pone.0033762
37. Fritz HK, Lindgren D, Ljungberg B, Axelson H, Dahlbäck B. The miR(21/10b) ratio as a prognostic marker in clear cell renal cell carcinoma. Eur J Cancer (2014) 50:1758–65. doi: 10.1016/j.ejca.2014.03.281
38. Khella HWZ, Daniel N, Youssef L, Scorilas A, Nofech-Mozes R, Mirham L, et al. miR-10b is a prognostic marker in clear cell renal cell carcinoma. J Clin Pathol (2017) 70:854–9. doi: 10.1136/jclinpath-2017-204341
39. Sheedy P, Medarova Z. The fundamental role of miR-10b in metastatic cancer. Am J Cancer Res (2018) 8(9):1674–88.
40. Sangster G, Do D, Previgliano C, Li B, LaFrance D, Heldmann M. Primary retroperitoneal paraganglioma simulating a pancreatic mass: a case report and review of the literature. HPB Surg (2010) 2010:645728. doi: 10.1155/2010/645728
41. Tsukada A, Ishizaki Y, Nobukawa B, Kawasaki S. Paraganglioma of the pancreas: a case report and review of the literature. Pancreas (2008) 36(2):214–6. doi: 10.1097/01.MPA.0000311841.35183.45
42. Zeng J, Simsir A, Oweity T, Hajdu C, Cohen S, Shi Y. Peripancreatic paraganglioma mimics pancreatic/gastrointestinal neuroendocrine tumor on fine needle aspiration: report of two cases and review of the literature. Diagn Cytopathol (2017) 45:947–52. doi: 10.1002/dc.23761
43. Inzani F, Rindi G, Tamborrino E, Cobelli R, Bordi C. Extra-adrenal composite paraganglioma with ganglioneuroma component presenting as a pancreatic mass. Endocr Pathol (2009) 20(3):191–5. doi: 10.1007/s12022-009-9085-z
44. Zhao Z, Guo Y, Liu L, Zhang L, Li S, Yang J. Primary non-functional pancreatic paraganglioma: a case report and review of the literature. J Int Med Res (2022) 50(12):3000605221143023. doi: 10.1177/03000605221143023
45. Li T, Yi RQ, Xie G, Wang DN, Ren YT, Li K. Pancreatic paraganglioma with multiple lymph node metastases found by spectral computed tomography: a case report and review of the literature. World J Clin Cases (2022) 10(31):11638–45. doi: 10.12998/wjcc.v10.i31.11638
46. Jiang CN, Cheng X, Shan J, Yang M, Xiao YQ. Primary pancreatic paraganglioma harboring lymph node metastasis: a case report. World J Clin Cases (2021) 9(27):8071–81. doi: 10.12998/wjcc.v9.i27.8071
47. Nikas IP, Ishak A, AlRawashdeh MM, Klapsinou E, Sepsa A, Tzimas GN, et al. Preoperative diagnosis of abdominal extra-adrenal paragangliomas with fine-needle biopsy. Diagnostics (Basel) (2022) 12(8):1819. doi: 10.3390/diagnostics12081819
48. So JS, Epstein JI. GATA3 expression in paragangliomas: a pitfall potentially leading to misdiagnosis of urothelial carcinoma. Mod Pathol (2013) 26:1365–70. doi: 10.1038/modpathol.2013.76
Keywords: paraganglioma, pancreatic neuroendocrine tumors, microRNA, diagnosis, visual analytic
Citation: Enguita JM, Díaz I, García D, Cubiella T, Chiara M-D and Valdés N (2023) Visual analytics identifies key miRNAs for differentiating peripancreatic paraganglioma and pancreatic neuroendocrine tumors. Front. Endocrinol. 14:1162725. doi: 10.3389/fendo.2023.1162725
Received: 09 February 2023; Accepted: 18 May 2023;
Published: 13 June 2023.
Edited by:
Marta Araujo-Castro, Ramón y Cajal University Hospital, SpainReviewed by:
Calin Cainap, University of Medicine and Pharmacy Iuliu Hatieganu, RomaniaCopyright © 2023 Enguita, Díaz, García, Cubiella, Chiara and Valdés. This is an open-access article distributed under the terms of the Creative Commons Attribution License (CC BY). The use, distribution or reproduction in other forums is permitted, provided the original author(s) and the copyright owner(s) are credited and that the original publication in this journal is cited, in accordance with accepted academic practice. No use, distribution or reproduction is permitted which does not comply with these terms.
*Correspondence: Nuria Valdés, bnVyaWEudmFsZGVzZ0BzZXNwYS5lcw==; María-Dolores Chiara, bWRjaGlhcmEudW9AdW5pb3ZpLmVz
†These authors have contributed equally to this work and share first authorship
‡These authors have contributed equally to this work and share senior authorship
Disclaimer: All claims expressed in this article are solely those of the authors and do not necessarily represent those of their affiliated organizations, or those of the publisher, the editors and the reviewers. Any product that may be evaluated in this article or claim that may be made by its manufacturer is not guaranteed or endorsed by the publisher.
Research integrity at Frontiers
Learn more about the work of our research integrity team to safeguard the quality of each article we publish.