 Liangbo Wang1,2†
 Chenlu Wei3†
 Yu Wang4†
 Ning Huang1Tao Zhang1
 Yuting Dai5*
 Li Xue2*
 Shaojian Lin2*
 Zhe Bao Wu1,2*
- 1Department of Neurosurgery, First Affiliated Hospital of Wenzhou Medical University, Wenzhou, China
- 2Department of Neurosurgery, Ruijin Hospital, Shanghai Jiao Tong University School of Medicine, Shanghai, China
- 3Center for Reproductive Medicine, the First Affiliated Hospital of Zhengzhou University, Zhengzhou, China
- 4Department of Neurosurgery, Ren Ji Hospital, School of Medicine, Shanghai Jiao Tong University, Shanghai, China
- 5State Key Laboratory of Medical Genomics, Shanghai Institute of Hematology, National Research Center for Translational Medicine at Shanghai, Ruijin Hospital, Shanghai Jiao Tong University School of Medicine, Shanghai, China
Background: Pituitary neuroendocrine tumors (PitNETs), which originate from the pituitary gland, account for 10%–15% of all intracranial neoplasms. Recent studies have indicated that enhancer RNAs (eRNAs) exert regulatory effects on tumor growth. However, the mechanisms underlying the eRNA-mediated tumorigenesis of PitNETs have not been elucidated.
Methods: Normal pituitary and PitNETs tissues were used to identify the differentially expressed eRNAs (DEEs). Immune gene sets and hallmarks of cancer gene sets were quantified based on single sample gene set enrichment analysis (ssGSEA) algorithm using GSVA. The perspective of immune cells among all samples was calculated by the CIBERSORT algorithm. Moreover, the regulatory network composed of key DEEs, target genes of eRNAs, hallmarks of cancer gene sets, differentially expressed TF, immune cells and immune gene sets were constructed by Pearson correlation analysis. Small molecular anti-PitNETs drugs were explored by CMap analysis and the accuracy of the study was verified by in vitro and in vivo experiments, ATAC-seq and ChIP-seq.
Results: In this study, data of 134 PitNETs and 107 non-tumorous pituitary samples were retrieved from a public database to identify differentially expressed genes. In total, 1128 differentially expressed eRNAs (DEEs) (494 upregulated eRNAs and 634 downregulated eRNAs) were identified. Next, the correlation of DEEs with cancer-related and immune-related gene signatures was examined to establish a co-expression regulatory network comprising 18 DEEs, 50 potential target genes of DEEs, 5 cancer hallmark gene sets, 2 differentially expressed transcription factors, 4 immune cell types, and 4 immune gene sets. Based on this network, the following four therapeutics for PitNETs were identified using Connectivity Map analysis: ciclopirox, bepridil, clomipramine, and alexidine. The growth-inhibitory effects of these therapeutics were validated using in vitro experiments. Ciclopirox exerted potential growth-inhibitory effects on PitNETs. Among the DEEs, GNLY, HOXB7, MRPL33, PRDM16, TCF7, and ZNF26 were determined to be potential diagnostic and therapeutic biomarkers for PitNETs.
Conclusion: This study illustrated the significant influence of eRNAs on the occurrence and development of PitNETs. By constructing the co-expression regulation network, GNLY, HOXB6, MRPL33, PRDM16, TCF7, and ZNF26 were identified as relatively significant DEEs which were considered as the novel biomarkers of diagnosis and treatment of PitNETs. This study demonstrated the roles of eRNAs in the occurrence and development of PitNETs and revealed that ciclopirox was a potential therapeutic for pituitary adenomas.
1 Background
Pituitary neuroendocrine tumors (PitNETs), which are a common type of adenoma, originate from the pituitary gland (1). Epidemiological studies have indicated that PitNETs affect more than 5% of the global population. Functional PitNETs secrete specific hormones, including prolactin, growth hormone, and cortisone hormones, contributing to the development of severe endocrine disorders and fatal outcomes (2). In contrast, non-functional PitNETs invade or exert pressure on neighboring healthy tissues (3). The major aims of PitNET treatment are the suppression of excessive hormonal secretion and tumor size to improve clinical symptoms (4). The frontline treatments for PitNETs include pituitary surgery, pharmacological treatment for specific subtypes (including somatostatin analogs and dopamine agonists), systemic chemotherapy, and/or radiotherapy (3). Patients with PitNETs may exhibit hypopituitarism, cerebrospinal fluid leaks, and diabetes insipidus. Approximately 10% of patients with PitNETs exhibit tumor recurrence within 10 years of surgery (5). Although radiation therapy inhibits tumor growth for several years, adenoma-associated hormone hypersecretion may persist for some years. Most patients experience pituitary failure within 10 years of radiotherapy and require lifelong hormone replacement therapy (6). Currently, the efficacies and adverse effects of various therapeutic approaches vary. Thus, there is an urgent need to identify novel therapeutic biomarkers for PitNETs to develop efficient therapies.
Enhancers are sequences located around a gene, especially upstream of the transcription start site, and serve as a binding site for transcription factors (TFs) to regulate gene expression (7). Enhancer RNAs (eRNAs), which are a class of non-coding RNAs transcribed from the enhancer regions of the genome (8), promote target gene expression, facilitate interactions with TFs, and regulate the epigenome (9). Recent studies have demonstrated the role of eRNAs in gene regulation in both cancerous and non-cancerous cells (10). Some tumor suppressor genes, such as TP53 can regulate tumor cell behavior through the production of eRNAs (11). Additionally, eRNAs can directly regulate tumor development under specific conditions (12). eRNAs exhibit tissue-specific and individual-specific expression patterns (13). Thus, eRNAs are potential diagnostic and prognostic biomarkers, as well as novel therapeutic targets, for cancer (14).
The role of eRNAs in the development of PitNETs has not been completely elucidated. This study comprehensively analyzed data from public databases to investigate the differential expression of eRNAs between PitNET and non-tumor samples. To investigate the correlation between genomic eRNAs and immune cell infiltration, the correlation of eRNAs with the abundance of immune cells (determined using CIBERSORT) and immune-related pathways (identified using single-sample Gene Set Enrichment Analysis (ssGSEA) algorithms) was examined. Moreover, a correlation analysis was performed by integrating TFs, eRNAs and their target genes, the abundance of immune cells, the enrichment score of immune-related gene sets, and cancer hallmark gene sets (signaling pathways were determined using Gene Set Variation Analysis, GSVA). Based on the correlation analysis, a co-expression regulatory network was constructed to explore the underlying regulatory mechanisms of eRNAs, which comprised key components, including target genes, differentially expressed TFs, immune cells, and gene sets. Additionally, Connectivity Map (CMap) analysis was performed to identify potential small-molecule inhibitors with anti-PitNET properties. To validate these findings, sequencing data from the public database (assay for transposase-accessible chromatin with sequencing (ATAC-Seq) and chromatin immunoprecipitation sequencing (ChIP-Seq) data) and experimental approaches were utilized for external validation.
2 Methods
2.1 Primary data collection
In order to calculate the expression of differentially expressed enhancer RNAs (DEEs) and target genes in patients with pituitary neuroendocrine tumors (PitNETs), we analyzed gene expression profiles of 134 PitNET tissue samples. These profiles were obtained from the supplementary appendix of an article published in Cancer Cell (15). To provide control samples, we used RNA-sequencing (RNA-seq) data from 107 normal pituitary tissues extracted from the Genotype-Tissue Expression (GTEx) database (https://commonfund.nih.gov/gtex). Moreover, the results of gene sets (including 50 hallmarks of cancer gene sets and 29 immune gene sets) and 318 PitNETs-related transcription factors (TFs) were obtained separately from Molecular Signatures Database (MSigDB) v7.1 (https://www.gsea-msigdb.org/gsea/msigdb/index.jsp) (16), and the Cistrome database (http://cistrome.org) (17). With the annotation of Ensemble ID, the standardized gene expression profiling of eRNAs in PitNETs was acquired from the enhancer RNA in cancers (eRic) database (https://hanlab.uth.edu/eRic/) (18). Afterward, in terms of the position in hg38 genome, we used the ChIPseeker package to identify the formal gene mark of each eRNA (19).
2.2 Analysis of gene expression, functional enrichment, and clinical relevance
At the beginning of our statistical analysis, edgeR and limma algorithm (20, 21) were used respectively to identify differentially expressed genes (DEGs) based on specific screening criteria (|log2 FC|> 1.0 (FC > 2.0), FDR < 0.05|) in the whole transcriptome and eRNAs. Furthermore, the cellular components (CCs), molecular functions (MFs), biological processes (BPs), and KEGG pathways of DEGs enrichment were illuminated by functional enrichment analysis (Gene Oncology (GO) and Kyoto Encyclopedia of Genes and Genomes (KEGG) items) (22). As for the analysis of clinical relevance, staging and cell type, which was related to prognosis, were considered as screening factors to identify clinical-related differentially expressed eRNAs (DEEs).
2.3 Identification of immune cells abundance, hallmarks of cancer-related gene sets, and differentially expressed target genes of eRNAs
To construct the eRNA regulatory network of PitNETs, we employed the CIBERSORT algorithm to calculate the proportions of 22 different types of immune cells across all samples (23). Furthermore, the infiltration of immune cells in the PitNETs samples and normal cases differed significantly, as determined by the Kruskal-Wallis and Mann-Whitney tests. Then, 29 immune gene sets and 50 hallmarks of cancer gene sets were quantified based on ssGSEA algorithm via GSVA R package (24). The edgeR package (21) was used to identify differential hallmarks of cancer gene sets or immune cells between PitNETs samples and the normal pituitary samples. The significant level was set to FDR < 0.05.
2.4 Construction of the regulation network and connectivity map analysis
To explore the role of eRNA and its related factors in the development of pituitary tumors, we constructed a specific co-expression regulatory network that included clinical-related DEEs, target genes of eRNAs, hallmarks of cancer gene sets, differentially expressed transcription factors (TFs), immune cells, and immune gene sets. Pearson correlation analysis was utilized to identify interaction pairs between these components (|correlation coefficient| > 0.70 and P < 0.05 for hallmarks of cancer gene sets and clinical-related DEEs; |correlation coefficient| > 0.90 and P < 0.05 for differentially expressed TFs and clinical-related DEEs), which were deemed significant elements of the network. Additionally, interaction pairs between target genes and clinical-related DEEs, immune cells and clinical-related DEEs, and immune gene sets and clinical-related DEEs (|correlation coefficient| > 0.85 and P < 0.05, |correlation coefficient| > 0.60 and P < 0.05, and |correlation coefficient| > 0.80 and P < 0.05, respectively) were included. We then utilized the Connectivity Map analysis (CMap) to identify potential small molecules that target significant components in the co-expression regulatory network of the pituitary adenomas, based on clinical-related DEEs, target genes of eRNAs, hallmarks of cancer gene sets, differentially expressed TFs, immune cells, and immune gene sets (25, 26). Finally, the heatmap showed several small molecule inhibitors that were shown to be effective against numerous types of cancers.
2.5 Validation
Since our data was not extracted from TCGA, only String (27) were utilized to validate the key DEEs in order to reduce biases and verify the accuracy of the study. Additionally, the data of ATAC-seq was extracted from The Cancer Genome Atlas (TCGA) (https://tcga-data.nci.nih.gov) to verify the accessibility of the key DEEs (28). Moreover, the binding level between PRDM16 and ELK4 was explored by using the CHIP-seq downloaded from the Cistrome database (http://cistrome.org/) (29–31). The information of clinical data, target genes, and drugs was downloaded from the eRic database (https://hanlab.uth.edu/eRic/) (18). Lastly, four small molecule inhibitors (ciclopirox, bepridil, clomipramine, and alexidine) were tested using the CellTiter-Glo luminescent cell viability assay (Promega, WI, USA) on GH3 cell line as per the manufacturer’s instructions. Among these compounds, ciclopirox was identified as a potential treatment for pituitary adenomas in vitro and in vivo.
2.6 Animal experiments
Athymic mice were purchased from Charles River (Shanghai, China) and kept in a laboratory with SPF-class conditions. For the subcutaneous transplantation animal studies, 1×10⁶ GH3 cells were suspended in 100 μl PBS and bilaterally injected into the subcutaneous region of an athymic mouse. On the 30th day, the tumor volume was assessed using a Vernier caliper and calculated using the formula V= 1/2×L×W2. The athymic mice were divided into two groups: the experimental group and the control group. The experimental group received intraperitoneal administration of ciclopirox at a dosage of 10 mg/kg, repeated at 48-hour intervals (32), in a volume of 100 μl PBS. All mice were euthanized, and tumor samples were collected for subsequent analysis.
2.7 Immunohistochemistry
Tissue samples were fixed with 4% formalin and embedded in paraffin. The slices were cut to 5 μm thickness. IHC was performed by blocking the rehydrated tissue sections using bovine serum overnight at 4°C, and subsequently applying the Anti-Ki67 antibody (Abcam, Cat. no. ab15580) and Anti-PCNA antibody (Abcam, Cat. no. ab92729). The sections were washed and then subjected to incubation with biotinylated anti-mouse IgG or biotinylated anti-rabbit IgG (Vector Laboratories, CA, USA). The ABC method (Vector Laboratories, CA, USA) was employed along with 3,3’- diaminobenzidine (Dojindo Laboratories, Kumamoto, Japan) as a substrate to detect the staining. The sections were visualized using an AX-80 microscope (Olympus, Tokyo, Japan), and Image J software (http://imagej.nih.gov/ij/) was employed for image analysis and quantification of positive expression. Statistical analysis was conducted using One-Way ANOVA.
2.8 Cell proliferation assays
CellTiter-Glo luminescent cell viability assay (Promega, WI, USA), a test system to detect the amount of present ATP proportional to the cell number, was employed to estimate the cell proliferation. GH3 cells were inoculated and treated with cyclopentanol (MCE, CAS No. 29342-05-0, 0-2 μm) for 48 hours (n=3), bepridil (MCE, CAS No. 64706-54-3, 0-100 μM) for 48 hours (n=3), chlorpromazine (MCE, CAS No. 303-49-1, 0-100 μM) for 48 hours (n=3), and alexidine (MCE, CAS No. 22573-93-9, 0-100 μM) for 48 hours (n=3), in 15% HS-2.5% FBS-F12K culture medium. All drugs were dissolved in DMSO and an equal amount of DMSO was added to the control group. Then, the CellTiter-Glo reagent was added into each well at the equivalent volume of cell culture medium in the well. Then, the contents were mixed vigorously for 5 min to induce cell lysis, and the plate was incubated at room temperature for an additional 25 min to stabilize the luminescent signal. Afterwards, 200 µL supernatants were transferred in technical replicates into the 96-well opaque-walled plate and the luminescence was measured. Analysis of the luminescence signal was performed using GraphPad Prism 9.0, with data being normalized to the control group, and p-values calculated through one-way ANOVA. At least three independent experiments were conducted to obtain the results.
2.9 Statistics analysis
During the process of study, the R software (https://www.r-project.org/; version 3.6.1; Institute for Statistics and Mathematics, Vienna, Austria) was used to conduct all statistical analyses. P-values were adjusted using FDR and the significant level was set to P-value < 0.05 or FDR < 0.05 (for multiple testing).
3 Results
3.1 Analysis of expression, functional enrichment, and clinical relevance of enhancer RNAs in PitNETs
The workflow of this study is shown in Figure 1. This study identified 7,267 differentially expressed genes (DEGs) (3,413 upregulated genes and 3,854 downregulated genes) between 134 PitNET and 107 normal pituitary samples. The DEGs were selected based on the following criteria to ensure robust and significant differences in gene expression between the two sample groups: false discovery rate (FDR) value < 0.05; |log2 fold-change (FC)| > 1.0 (Figures 2A, B). Kyoto Encyclopedia of Genes and Genomes and Gene Ontology functional enrichment analyses revealed that the most significantly enriched signaling pathway and molecular function were neuroactive ligand-receptor interaction and extracellular matrix, respectively (Figures 2C, D). The ChIPseeker package was used to identify the official gene symbol of each eRNA according to its location in the hg38 genome. Based on the staging and cell type, 1128 clinically relevant differentially expressed eRNAs (DEEs) (494 upregulated eRNAs and 634 downregulated eRNAs) were identified between PitNET and healthy pituitary samples (Figures 3A, B).
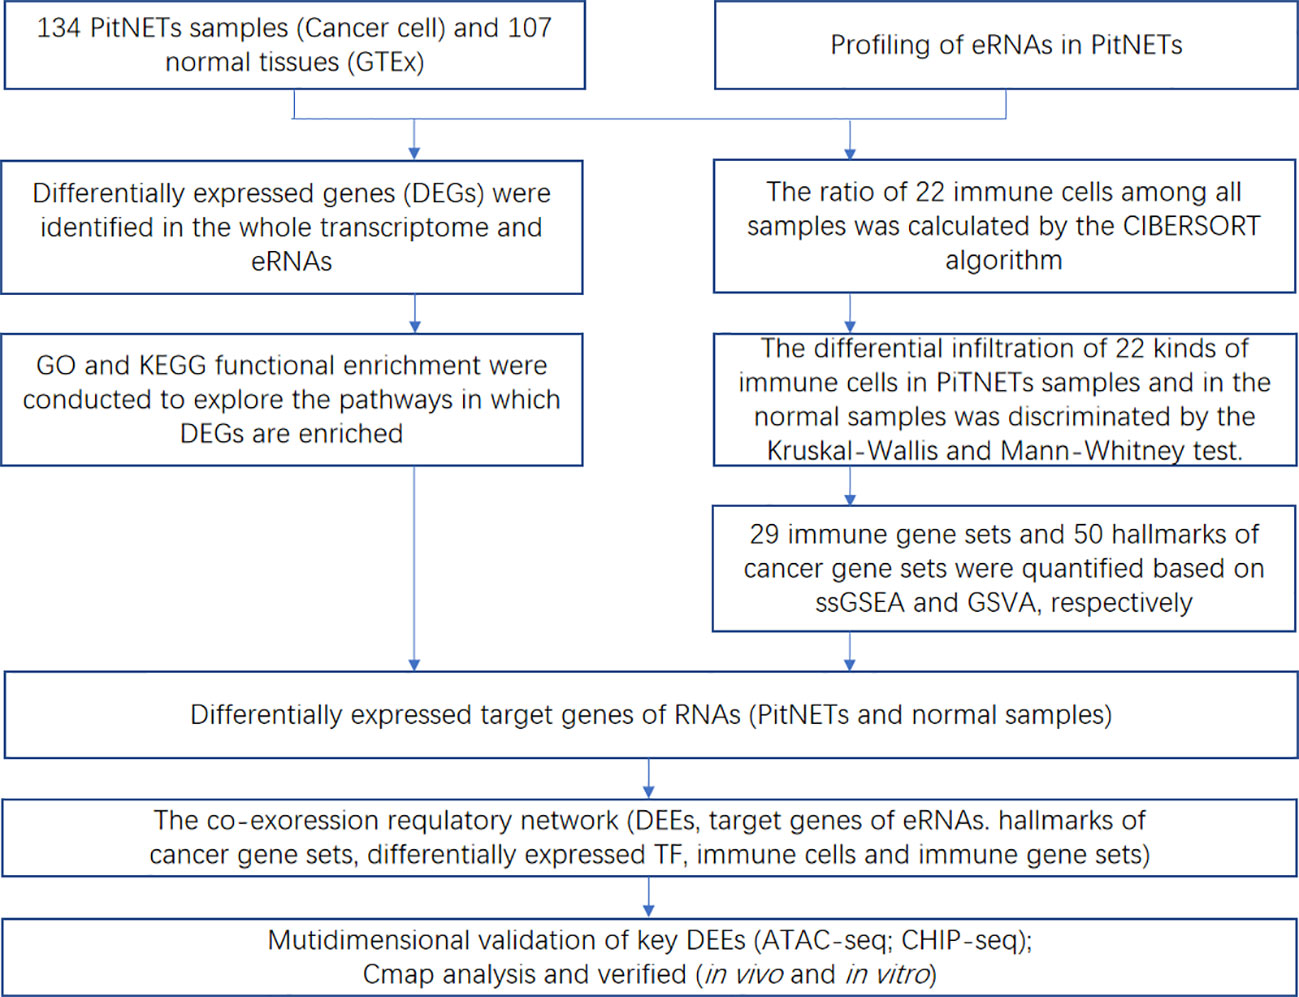
Figure 1 The flowchart showing each procedure of this study in sequence.
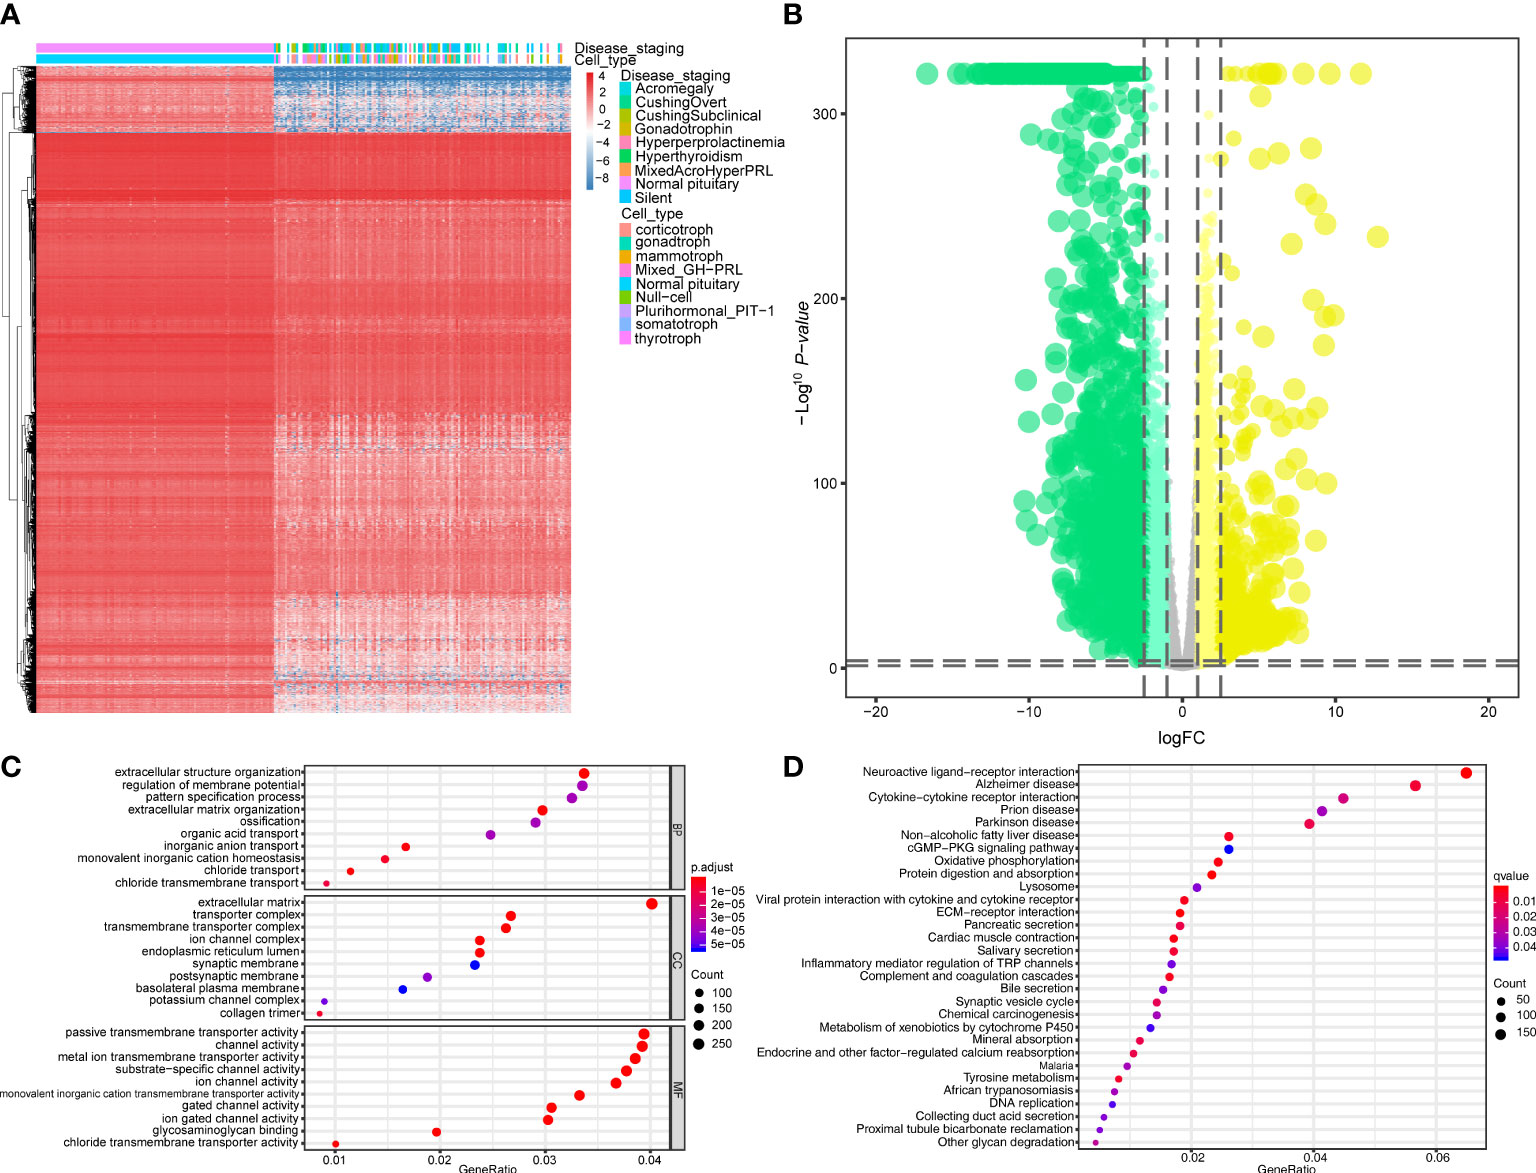
Figure 2 Analysis of differential expression and functional enrichment. (A, B) Differentially expressed genes (DEGs) between PitNETs and normal samples were shown in the heatmap and violin plot. (C, D) The results of GO and KEGG functional enrichment analysis were displayed in the dotplots.
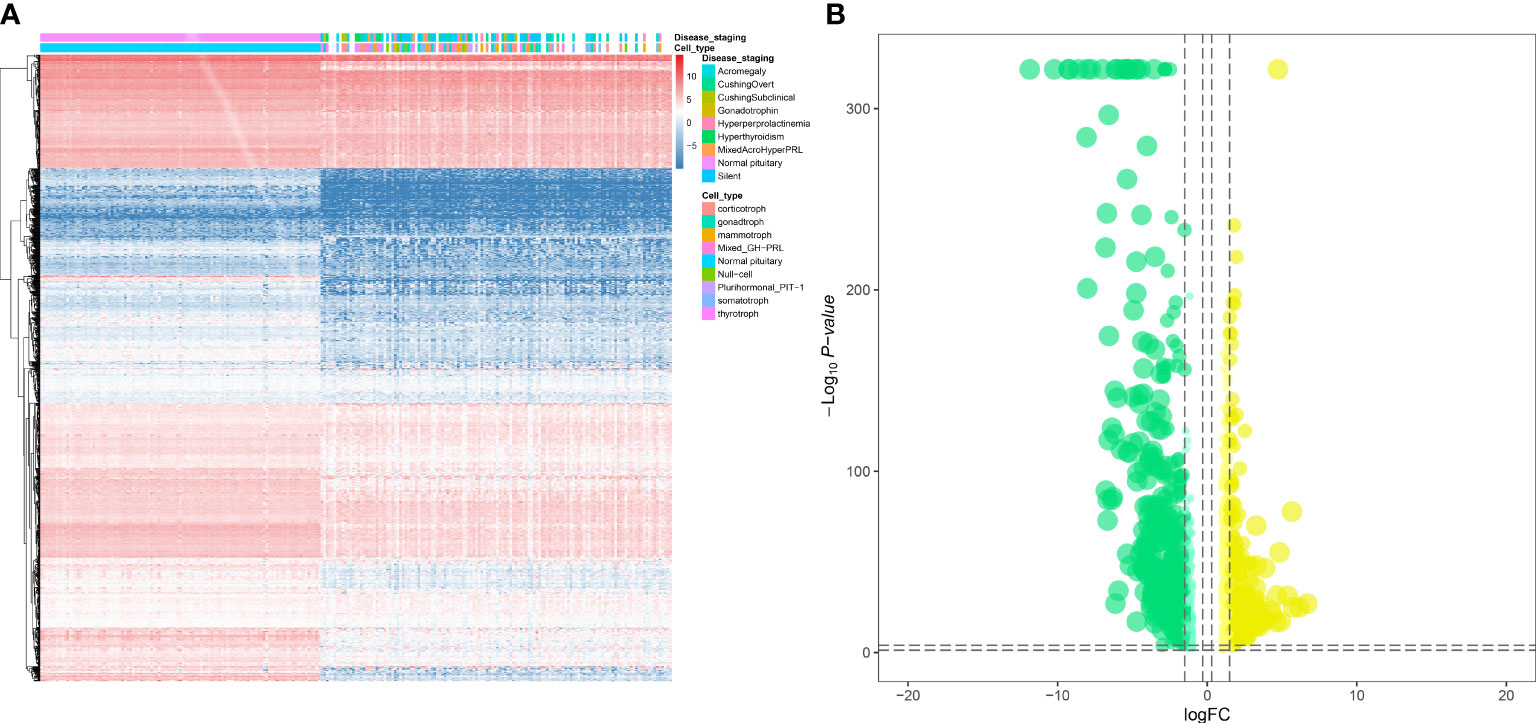
Figure 3 Identification of differentially expressed eRNAs (DEEs). The heatmap (A) and the violin plot (B) showing the key DEEs between PitNETs and normal samples.
3.2 Identification of immune cells and immune gene sets in PitNETs
The CIBERSORT algorithm was used to calculate the proportion of 22 immune cell types in the healthy pituitary and PitNET samples. The results are presented as a bar plot in Figure 4A. Next, the differential abundances of 22 immune cell types between the PitNETs and healthy pituitary samples were determined using the Kruskal-Wallis and Mann-Whitney tests. The differentially abundant immune cell types are shown in Figures 4B, C. The nonparametric test results revealed a significant correlation between immune cells/pathways and PitNETs. Figure 4D shows the co-expression coefficient between each pair of immune cells.
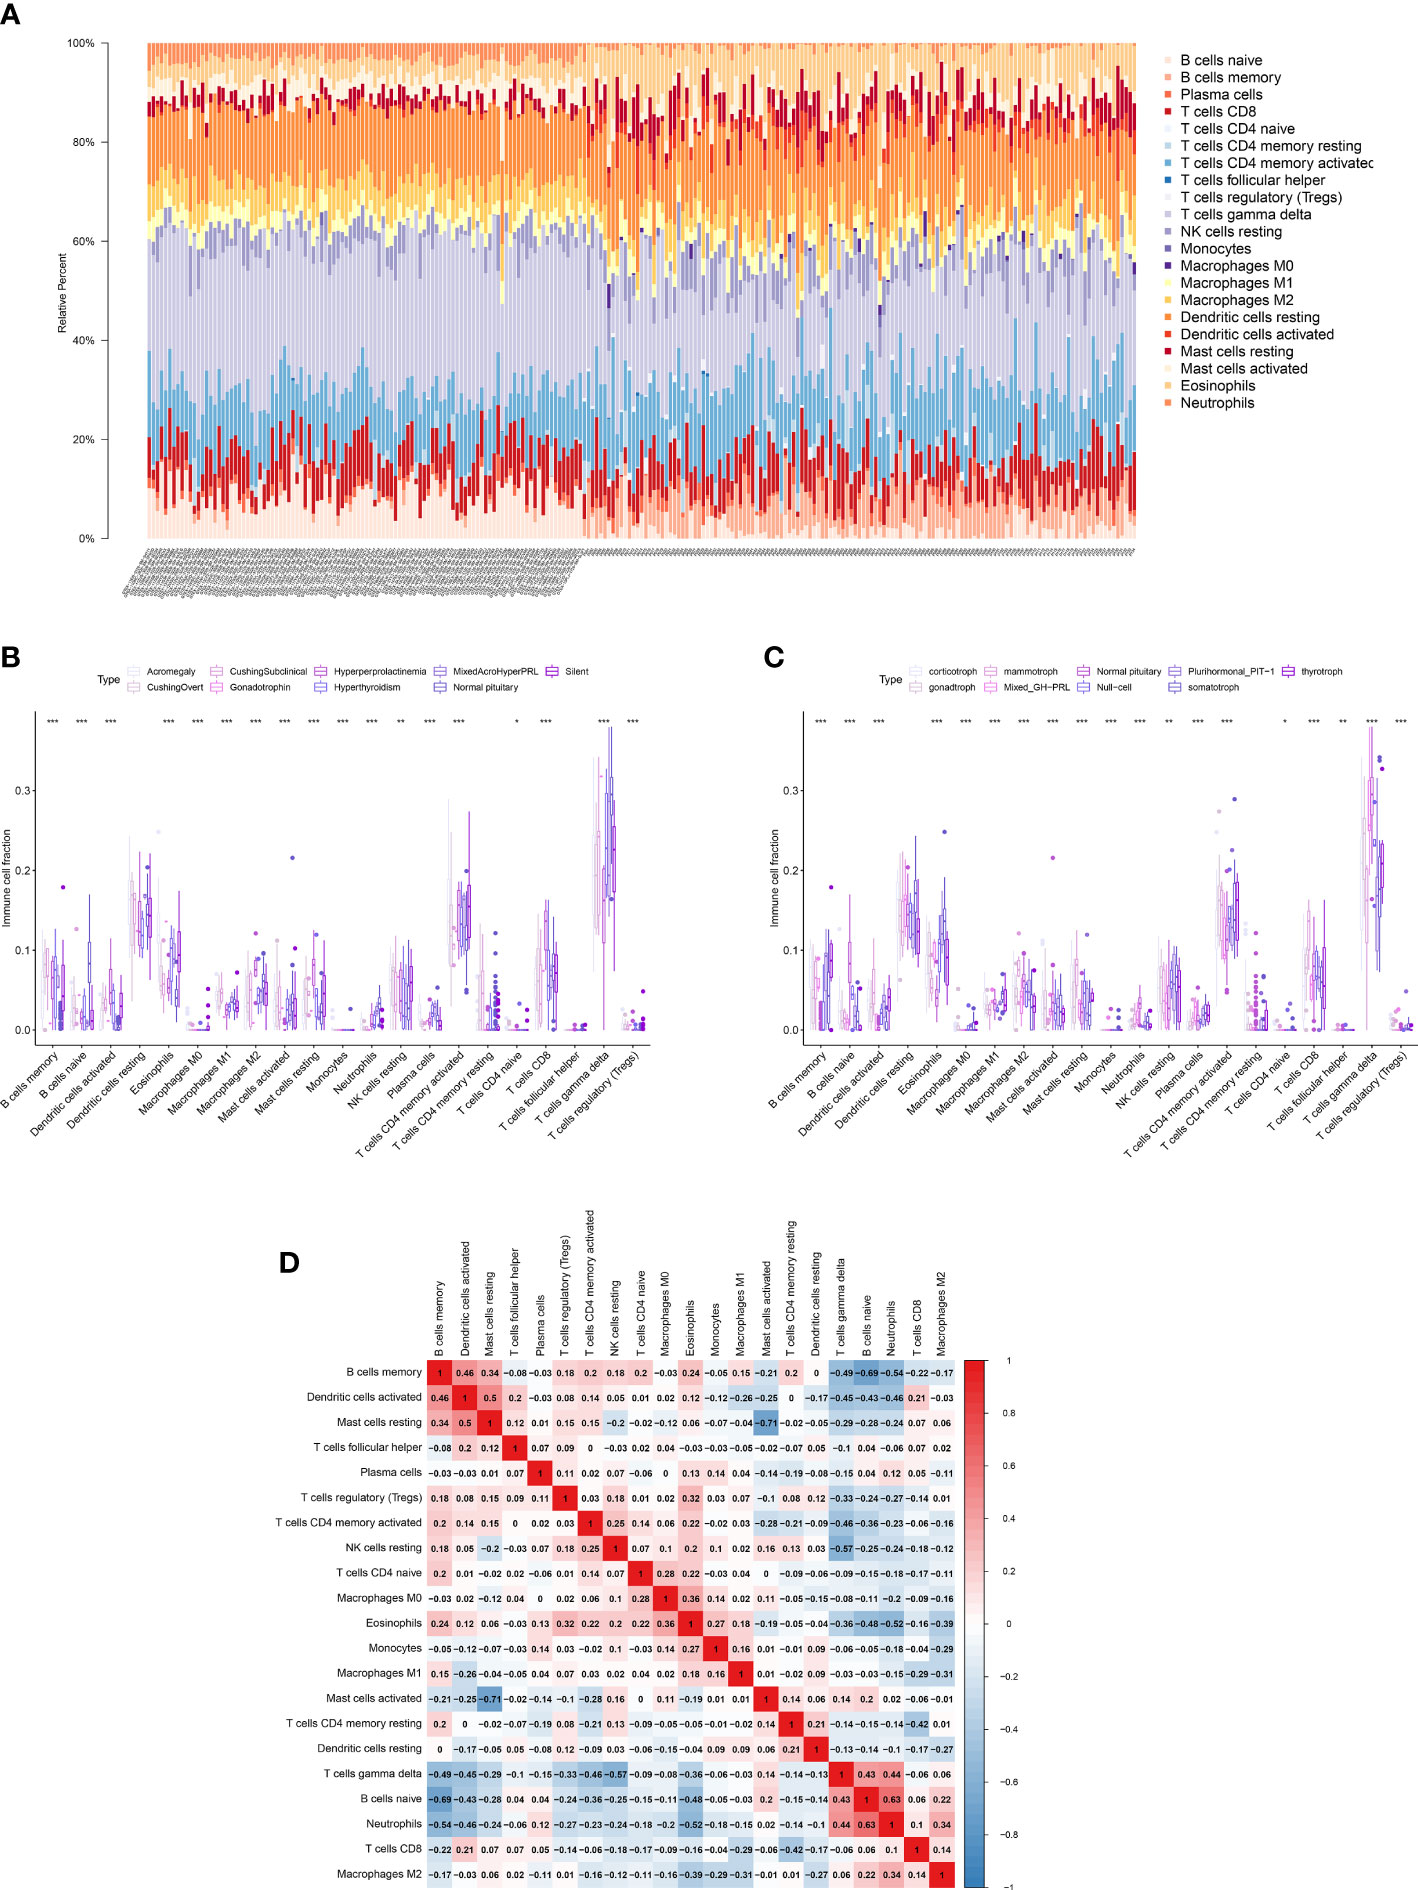
Figure 4 Quantification of immune cells. (A) The proportions of 22 types of immune cells in each PitNETs was shown in the bar plot. (B, C) The plots showing the differential expression level of the key DEEs on disease staging and cell types. (D) The heatmap showing the co-expression of 22 kinds of immune cells. *p<0.05; **p<0.01; ***p<0.001.
3.3 Differential expression analysis of TFs and cancer hallmark gene sets and functional enrichment of PitNETs gene sets
Figures 5A–D shows 105 differentially expressed TFs and 50 differentially expressed cancer hallmark gene sets between 134 PitNETs and 107 healthy samples. Additionally, Figure 5E shows a t-test bar graph comprising 26 upregulated and 28 downregulated cancer hallmark gene sets. The top 2 upregulated cancer hallmarks were TGF-β signaling (t = −13.548, P < 0.001) and mTORC1 signaling (t = −11.702, P < 0.001), whereas the most downregulated cancer hallmark was fatty acid metabolism (t = 17.671, P < 0.001). This result was in contrast to that of most of the 44 significant hallmarks. Figure 5F shows the results of ssGSEA for the differential expression of 29 immune gene sets between PitNETs and healthy samples (FDR < 0.05). As shown in Figures S1A, B, 937 differentially expressed target genes of eRNAs are represented as a heatmap and a violin plot.
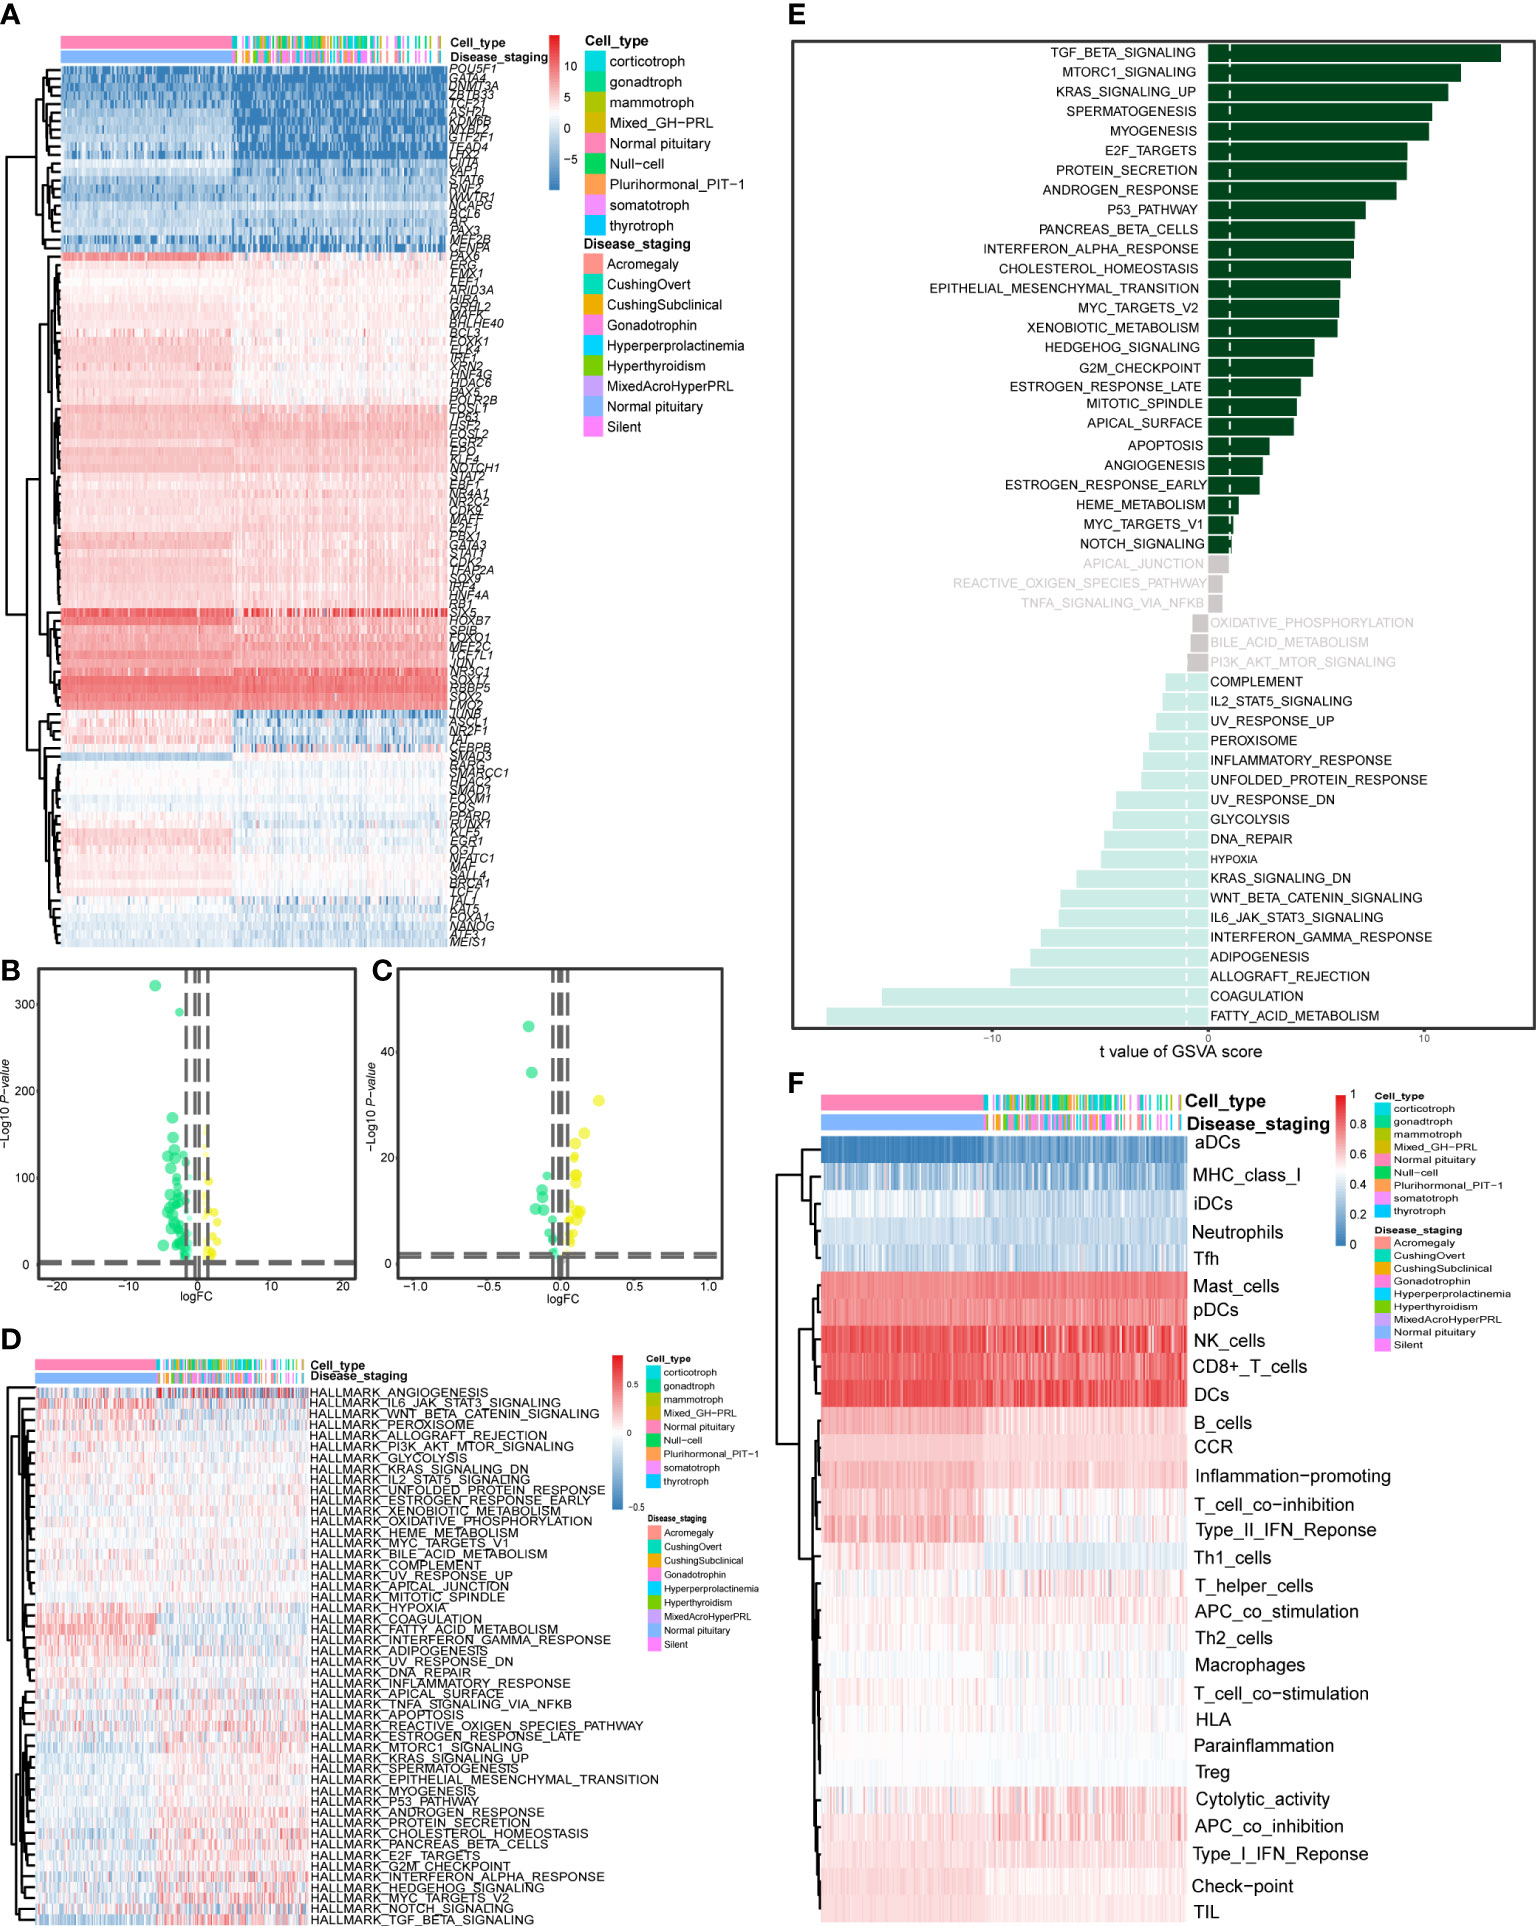
Figure 5 Differentially expressed analysis of TFs, hallmarks of cancer genes and immune gene sets. The heatmap (A) and the violin plot (B) showing the differentially expressed TFs between the PitNETs and normal samples. The heatmap (C) and the violin plot (D) showing the differentially expressed hallmarks of cancer genes between the PitNETs and normal samples. (E) The bar chart showing the key hallmarks of cancer (including 26 upregulated and 28 down-regulated hallmarks). (F) The heatmap illustrating the differential expression of 29 immune gene sets between the PitNETs and normal samples.
3.4 Co-expression regulatory network and CMap analysis
Summarizing the above analysis revealed 42 DEGs between 134 PitNETs and 107 healthy samples, which were represented in a heatmap (Figure 6A). Based on the criteria mentioned in the method, a co-expression regulatory network comprising 18 clinically correlated DEEs, 50 target genes of eRNAs, 5 cancer hallmark gene sets, 2 differentially expressed TFs, 4 types of immune cells, and 4 immune gene sets were established (Figure 6B). Additionally, the heatmap illustrated the complex co-expression relationships among several components of the network (Figure 6C). CMap analysis was performed to distinguish specific small-molecule inhibitors of DEGs in the network. The data included clinically related DEEs, differentially expressed TFs, different target genes of eRNAs, cancer hallmark gene sets, various types of immune cells, and immune gene sets. As shown in Figure 6D, ciclopirox (specificity = 0.133, P < 0.01), bepridil (specificity = 0.094, P < 0.01), clomipramine (specificity = 0.171, P < 0.01), and alexidine (specificity = 0.010, P < 0.01) were the most effective molecular inhibitors for key DEEs.
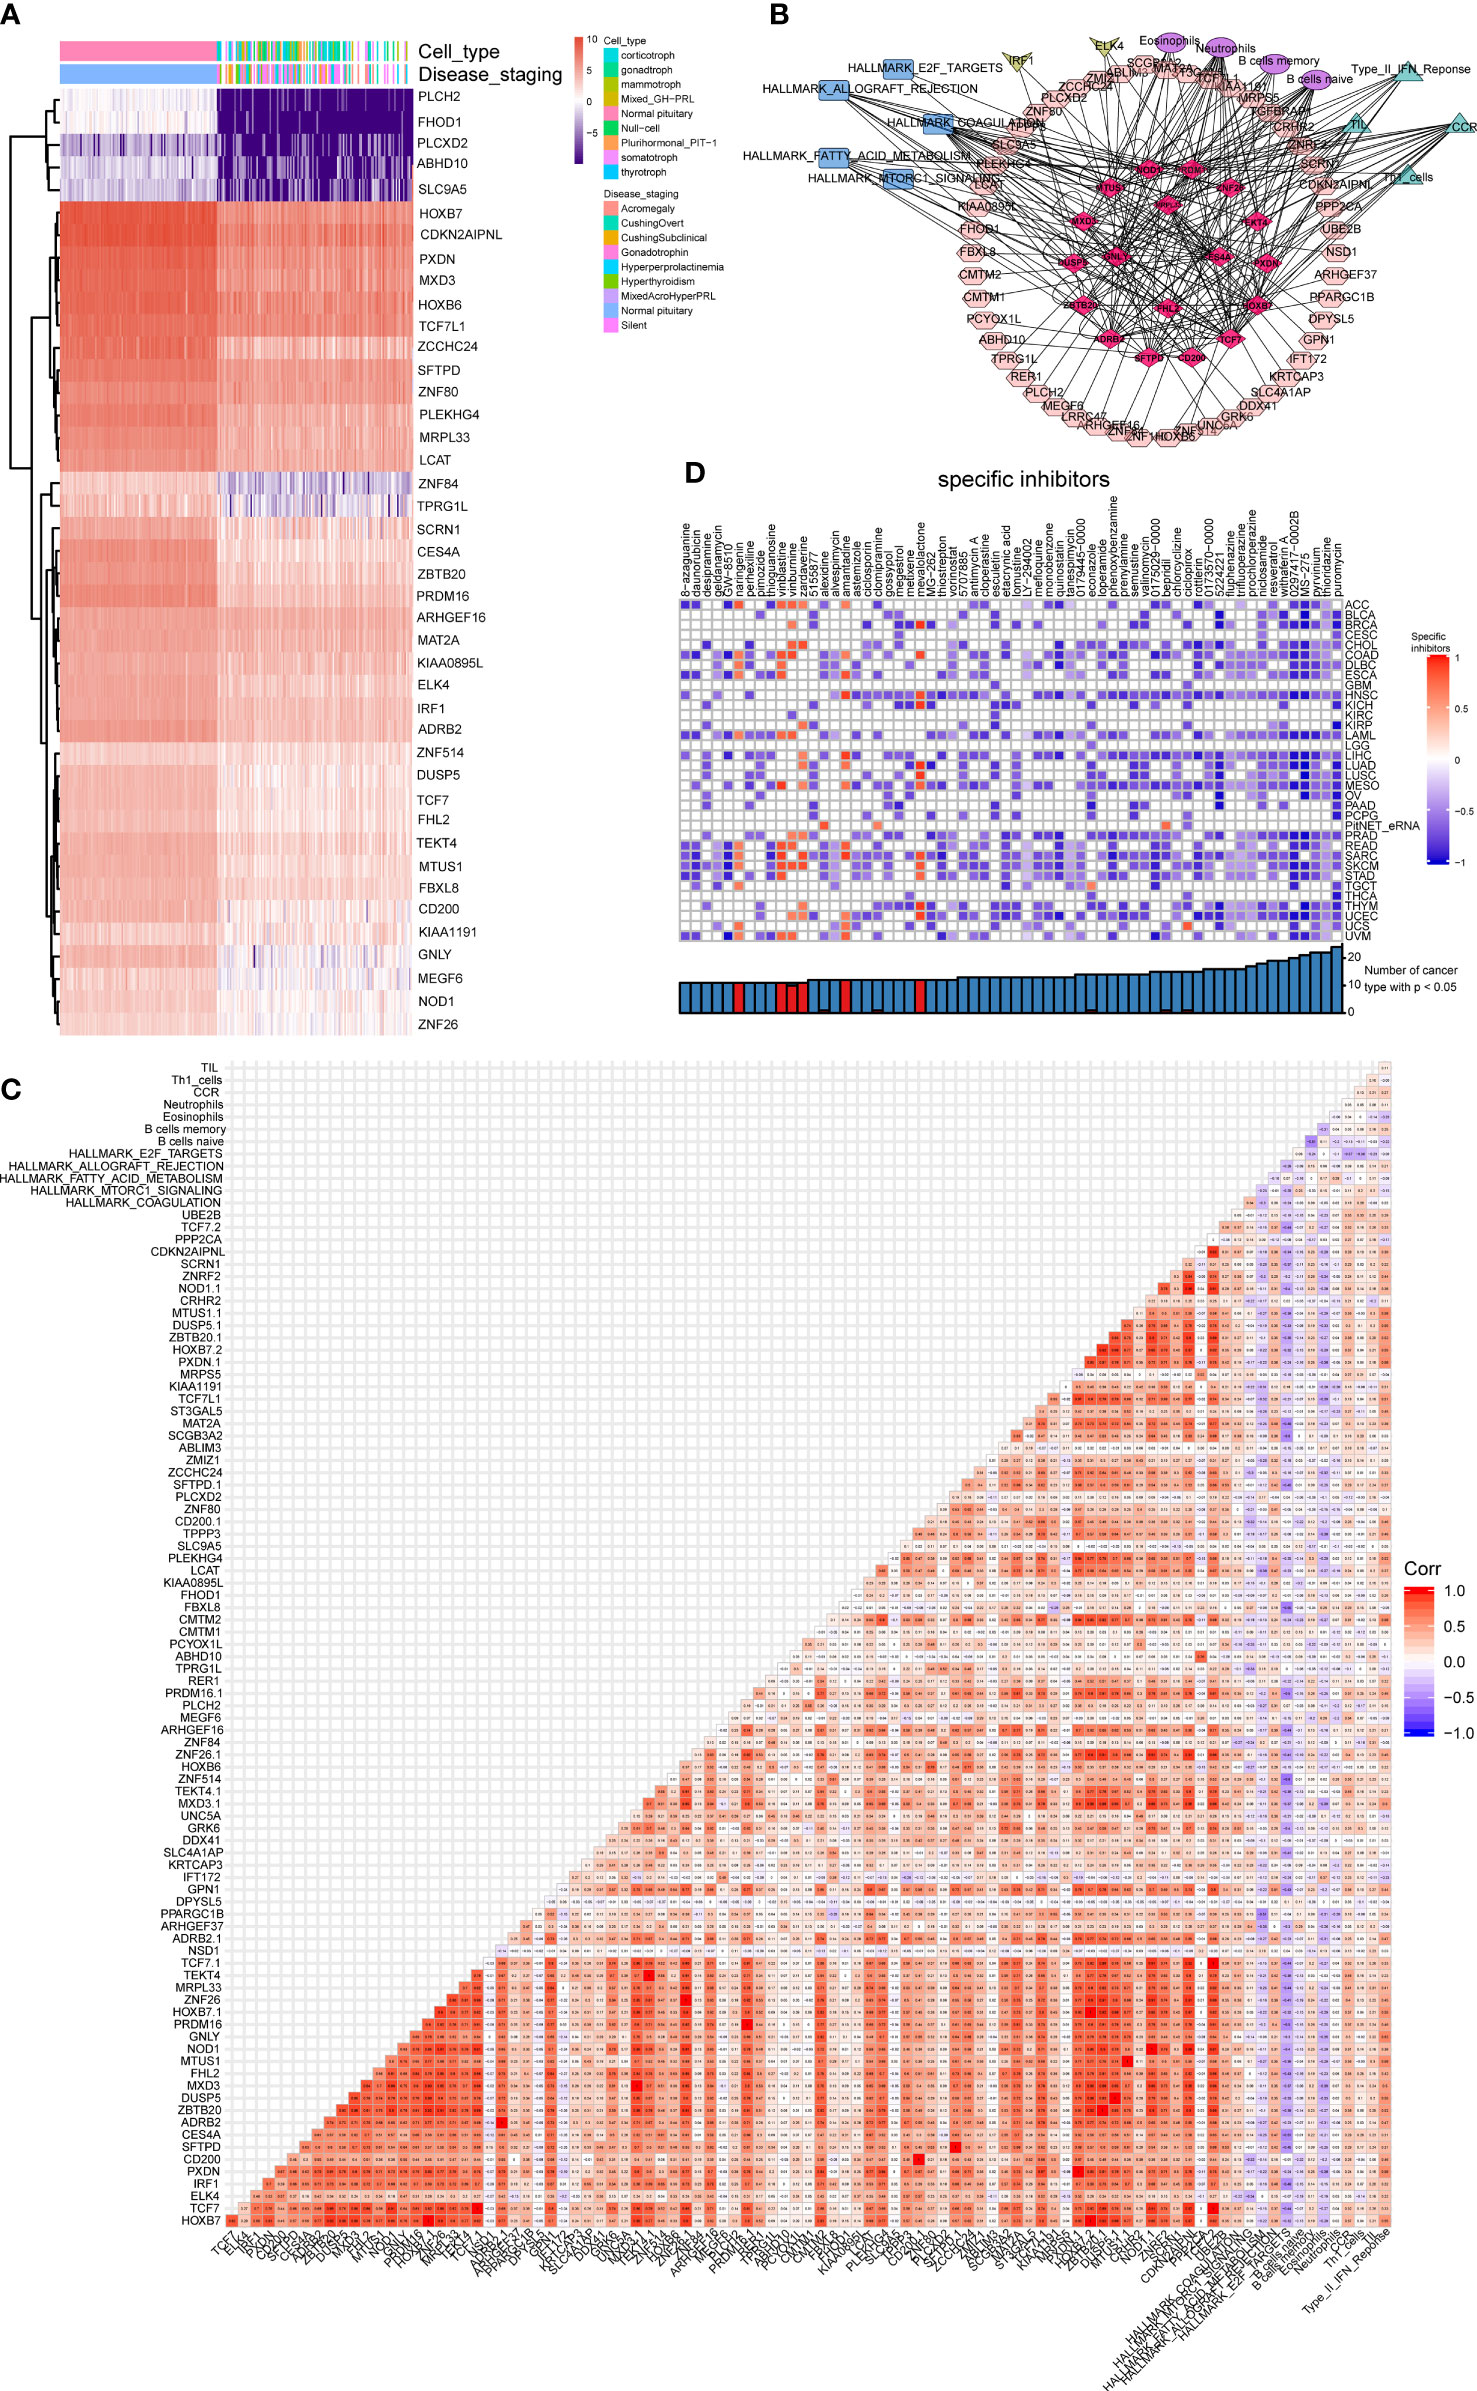
Figure 6 Construction of the regulated network. (A) The heatmap showing the key DEGs in the network between the PitNETs and normal samples. (B) The co-expression regulated network. Red rhombus represented 18 significant DEEs, pink octagon represented 50 target genes of eRNAs, blue rectangle represented 5 hallmarks of cancer gene sets, yellow quadrilateral represented 2 differentially expressed TF, purple circle represented 4 types of immune cells and green triangle represented 4 kinds of immune gene sets. (C) The complicated co-expression coefficient of such several components of the network was shown in the heatmap. (D) Effective small molecular inhibitors were illustrated in the heatmap.
3.5 External database validation
The six most significant DEEs (three upregulated eRNAs and three downregulated eRNAs) were identified from clinical correlation analysis (GNLY, HOXB7, MRPL33, PRDM16, TCF7, and ZNF26). The validation was conducted using String databases (Figure S2). The chromatin accessibility of the six key DEEs was examined. The peaks indicated the regions of the chromatin (Figures S3A–F). ChIP-seq analysis revealed that the correlation coefficient of the interaction pairs of PRDM16 (eRNA) and ELK4 (TF) was the highest (cor = 0.909) (Figure S4). Additionally, GNLY, HOXB7, MRPL33, and PRDM16 were upregulated in bladder urothelial carcinoma, colon adenocarcinoma, lung adenocarcinoma, and rectum adenocarcinoma based on the results of eRic validation (Figure S5; Table S1).
3.6 In vitro and in vivo validation
To assess the therapeutic potential of the screened drugs for pituitary tumors, the growth-inhibitory effects of four drugs against the GH3 cell line were examined. Among the tested small-molecular inhibitors, ciclopirox exhibited the highest efficacy (half-maximal effective concentration = 2.85 μM) against the GH3 cell line (Figure 7A). Subsequently, primary growth hormone (GH)-secreting adenoma cells were seeded in a 96-well plate and treated with different concentrations of ciclopirox. Ciclopirox concentration-dependently decreased the viability of primary GH-secreting pituitary adenoma cells (Figure 7B). To examine the effect of ciclopirox on PitNETs in vivo, a athymic mouse model bearing subcutaneous transplants of GH3 cell line-derived tumors was established. To establish the tumor xenograft model, athymic mice were subcutaneously injected with GH3 tumor cells on both sides of the skin. On day 30 post-injection, the tumor volume was approximately 300 mm3. The athymic mice were screened and classified based on the mean tumor size for further experiments. To determine the treatment effectiveness, the mice were intraperitoneally administered with ciclopirox or phosphate-buffered saline every other day, and tumor size was measured regularly. On day 41, the mice were euthanized, and the tissue samples were collected for further analysis. Ciclopirox did not exert adverse effects on mouse health. At the end of the experimental period, ciclopirox significantly inhibited the growth of subcutaneous tumors in athymic mice. The average tumor volumes in the experimental group (382.95 mm3) were significantly lower than those in the control group (629.87 mm3) (p < 0.05) (Figures 7C–E). Consistently, immunohistochemical staining revealed that the levels of cellular proliferation markers (MKI67 and PCNA) were downregulated in the ciclopirox-treated cells, as well as in subcutaneously transplanted tumors in athymic mice (Figure 7F). However, the bodyweight of mice was not significantly different between the two groups (Figure 7G). This indicates that ciclopirox did not affect the health of the mice at the tested dose. Thus, ciclopirox can suppress the proliferation of pituitary tumor cell lines in vitro and in vivo, as well as inhibit the growth of GH-secreting tumors.
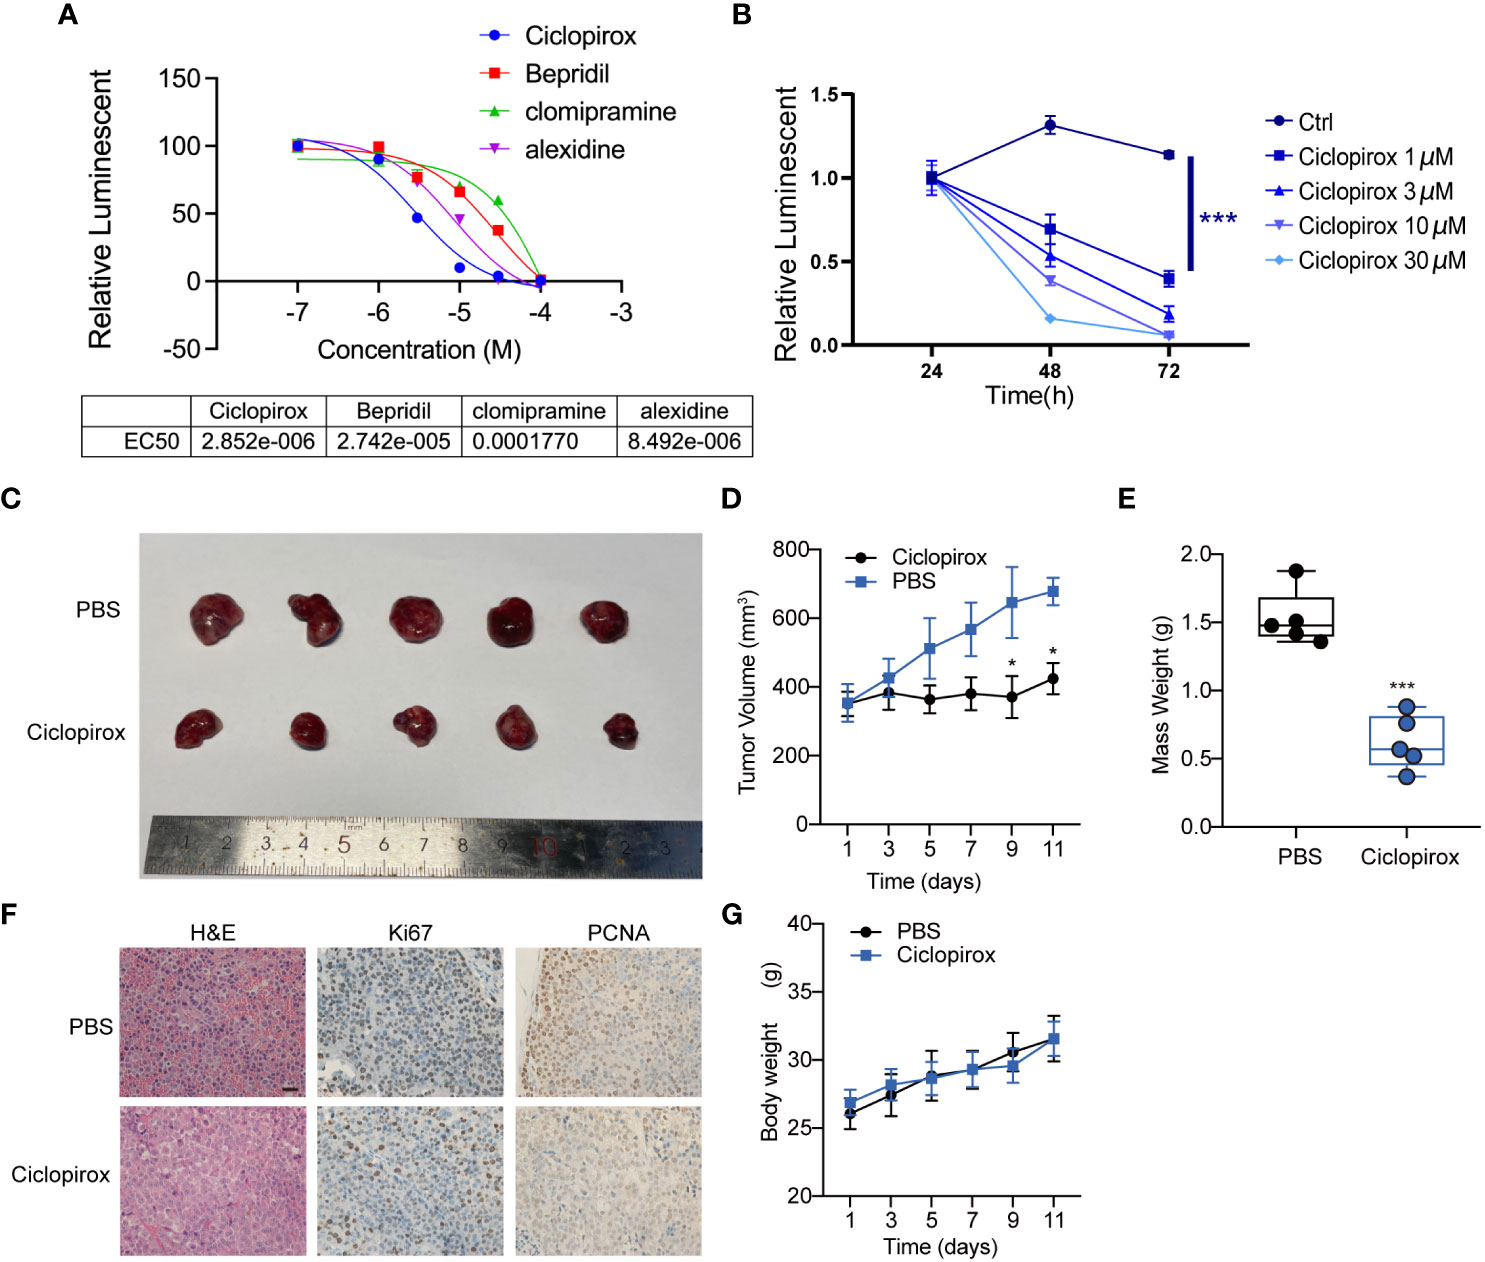
Figure 7 The effect of four molecular inhibitors on GH3 cell line in vitro (A) and the effect of ciclopirox on primary GH-secreting pituitary adenoma cells in vitro (B). Cell survival was determined by CellTiter-Glo luminescent cell viability assay. The effect of ciclopirox in vivo. Representative images (C), tumor growth curve (D), mass weight (E), representative images of HE, ki67 and PCNA staining on tumor section of mice indicated in (F), and body weight (G) of tumors derived from athymic tumor-bearing mice treated with PBS or ciclopirox. *p<0.05; ***p<0.001.
4 Discussion
PitNETs are the most common pituitary disorder (33), accounting for 10%–15% of all intracranial tumor cases (34). Suspected PitNET cases are diagnosed based on the symptoms. Moreover, the diagnostic methods recommended for PitNETs are based on expert opinions and observational research, which are in turn based on prior clinical experience and research findings (35–37). The currently used therapeutic approaches for PitNETs are associated with adverse effects and/or delay disease onset. Furthermore, clinical trials comparing early therapy with conservative treatment have not been performed. Thus, the intervals for management and monitoring rely on expert opinions (38). Consequently, there is an urgent need to identify novel potential biomarkers to develop diagnostic and therapeutic strategies for PitNETs. Additionally, previous bioinformatics analysis findings on pituitary adenomas have piqued the interest of the scientific community. Currently, the main research focus of pituitary adenoma studies is proteogenomics and microRNAs. Meanwhile, limited studies have examined the role of circular RNAs. However, the bioinformatics analysis of eRNAs has not been previously performed (38–40). A recent study reported that dysfunctional enhancers are associated with the pathogenesis of various human cancers (41). Based on the expression patterns of eRNAs in human neoplasm cells, the regulation of eRNA expression is potentially a novel therapeutic approach for tumors (42–46). The mechanism of action of eRNAs in the development of PitNETs has not been elucidated.
In this study, 1128 DEEs (494 upregulated eRNAs and 634 downregulated eRNAs) were identified between 134 PitNETs and 107 healthy pituitary samples. The proportion of immune cells in the tumor microenvironment is a crucial biomarker for predicting therapy response and identifying patients who will benefit from immunotherapy. The CIBERSORT, ssGSEA, and GSVA algorithms were used to identify the proportion of 22 different types of immune cells, immune gene sets, and cancer hallmark gene sets, respectively. The final co-expression regulatory network was constructed using 18 DEGs, 50 target genes of eRNAs, five cancer hallmark gene sets, two differentially expressed TFs, four types of immune cells, and four immune gene sets. CMap analysis revealed that ciclopirox, bepridil, clomipramine, and alexidine are effective therapeutics for PitNETs. The top three upregulated and downregulated eRNAs (GNLY, HOXB7, MRPL33, PRDM16, TCF7, and ZNF26) were validated using ATAC-seq and online datasets.
In the human genome, GNLY encodes granulysin, a cytolytic granule protein secreted from natural killer cells and cytotoxic T lymphocytes (47). GNLY exerts tumor suppressor effects. The serum concentrations of granulysin determine the immune response in patients with cancer (48, 49). Granulysin exhibits pro-inflammatory, cytotoxic, antitumor, and antimicrobial properties (50, 51). Previous studies have suggested that serum granulysin levels are biomarkers in patients with benign tumors and malignant diseases. However, limited studies have examined serum granulysin concentrations in patients with PitNETs (52). HOXB7, which belongs to class I homeobox genes, is involved in tumor progression and tumorigenesis. The dysregulation of HOXB7 is reported to induce multiple tumors (53). For example, HOXB7 is dysregulated in tumors, such as colorectal and pancreatic cancers and is associated with differentiation and tumor grade (54). Recent studies have confirmed that HOXB7 is associated with tumor cell invasiveness and proliferation and clinicopathological features (53). MRPL33 is one of the 50 genes encoding the mitoribosome subunit. MRPL33-L and MRPL33-S are the transcriptional variants of MRPL33 and are generated via alternative splicing of exon 3 (55). The two variants exert contrasting effects on the apoptosis and proliferation of cancer cells (55). However, the effects of the two MRPL33 isoforms on cancer have not been completely elucidated. Further studies on the mechanisms and functions of MRPL33 may contribute to the development of personalized and effective treatment strategies (56). PRDM16, a TF, promotes mitochondrial respiration and oxidative metabolism in brown fat cells (57). Additionally, PRDM16 enhances the transcriptional activity of the peroxisome proliferator-activated receptors, promoting the transcription of metabolic genes in fat cells and regulating the activity of some stem cell populations (58). A recent study reported that PRDM16 inhibits the development of tumors (59). The loss of PRDM family members, including PRDM16, in kidney and lung cancer suggested that PRDM16 is involved in the pathogenesis of multiple cancers. TCF7 (also known as TCF-1), which belongs to the TCF family, comprises a β-catenin-binding domain and a high-mobility group DNA-binding domain. The β-catenin-binding domain can interact with nuclear β-catenin, while the high-mobility group DNA-binding domain can identify DNA and switch transcription activities toward Wnt signaling (60). TCF7 upregulation was recently reported to be related to the development and poor prognosis of multiple tumors. Additionally, some miRNAs suppress tumor carcinogenesis and progression by downregulating the expression of TCF7 (61). ZNF26 regulates herpes simplex virus 1 infection response-related and gene expression-related pathways. ZNF268 is a paralog of ZNF26 (https://www.genecards.org/cgi-bin/carddisp.pl?gene=ZNF26). In this study, the aberrant expression of ZNF26 was reported to promote the occurrence of PitNETs.
Ciclopirox, a broad-spectrum fungicide, has been used to treat pathogenic dermatophytes, yeasts, and Malassezia furfur (62, 63). Recent preclinical and clinical studies have demonstrated that ciclopirox exhibits anti-cancer activities (63) and exerts therapeutic effects on diabetes (64, 65), cardiovascular disorders (66), and acquired immune deficiency syndrome (67). Ciclopirox exerts anti-cancer effects in vitro by inhibiting cell proliferation, angiogenesis, and lymphangiogenesis, inducing apoptosis, and suppressing cell migration and invasion (68). In vivo studies have reported that the growth rate of human leukemia and human breast xenograft in mice administered with ciclopirox (25 mg/kg bodyweight) via oral gavage is suppressed by up to 65% and 75%, respectively, when compared with that in control mice (69, 70). Additionally, ciclopirox (20 mg/kg bodyweight) potently inhibited the growth of human colon tumors in mice (71). Furthermore, clinical studies have indicated that the oral administration of ciclopirox (40 mg/m2) for five days resulted in disease stabilization and/or hematological improvement in 2/3 patients with advanced hematological malignancies (NCT00990587) (72). The anti-cancer mechanisms of ciclopirox are complex and include the inhibition of Wnt/β-catenin, histone demethylases/Myc, VEGFR-3/ERK1/2, cyclin-dependent kinases, and mTORC1 and the induction of reactive oxygen species or activation of ATR/Chk (68). In this study, ciclopirox (10 mg/kg bodyweight) effectively inhibited pituitary tumor cell proliferation in vitro. Consistently, the intraperitoneal injection of ciclopirox significantly suppressed tumor size in a mouse model. The toxicological and pharmacological profiles indicated that the systemic administration of ciclopirox, especially ciclopirox-POM (ciclopirox prodrug), is feasible and safe (73). Preclinical and clinical data suggest that ciclopirox can be repositioned as an anti-PitNET drug.
This study examined the novel roles of eRNAs in PitNETs. However, this study has several limitations. The Cancer Genome Atlas database did not provide relevant data on pituitary tumors. Hence, the tumor data from other sources and the non-cancerous tissue data from the Genotype-Tissue Expression database were used for analysis. The PitNET data were extracted from the article published in Cancer Cell (15). These data may be limited and associated with statistical bias. Therefore, external data should be used to verify the findings of this study. Additionally, the findings of this study may be associated with geographical bias as the analyzed samples were only from the American population. Furthermore, this study only focused on investigating the role of eRNAs in PitNETs. Future studies must examine the role of eRNAs in different PitNET subtypes. Finally, validation was limited to in vitro experiments involving the GH3 cell line and a single GH-secreting primary tumor owing to the limited availability of primary cells. Therefore, additional cellular, animal, and clinical experiments must be performed with various types of PitNETs to accurately validate the bioinformatics analysis results of this study.
5 Conclusions
This study demonstrated the roles of eRNAs in the development and progression of PitNETs. Furthermore, a co-expression regulatory network was constructed, which revealed the following six DEEs: GNLY, HOXB7, MRPL33, PRDM16, TCF7, and ZNF26. These DEEs are potential diagnostic and therapeutic biomarkers for PitNETs. Additionally, in vivo experiments demonstrated that ciclopirox exerts therapeutic effects on pituitary adenomas.
Data availability statement
The datasets presented in this study can be found in online repositories. The names of the repository/repositories and accession number(s) can be found in the article/Supplementary Material.
Ethics statement
The animal study was reviewed and approved by Institutional Animal Care and Use Committee at Shanghai Jiao Tong University School of Medicine.
Author contributions
SL, YD, LX, and ZW designed the study and carried out the data analyses. LW, CW, YW, NH, and TZ interpreted the results. LW and CW drafted the manuscript. YD, LX, SL and ZW revised the manuscript. All authors contributed to the article and approved the submitted version.
Funding
This work was supported by the National Natural Science Foundation of China (No. 81701359 and No. 82172605).
Acknowledgments
We thank dear M. Neou, C. Villa et al. for using their data.
Conflict of interest
The authors declare that the research was conducted in the absence of any commercial or financial relationships that could be construed as a potential conflict of interest.
Publisher’s note
All claims expressed in this article are solely those of the authors and do not necessarily represent those of their affiliated organizations, or those of the publisher, the editors and the reviewers. Any product that may be evaluated in this article, or claim that may be made by its manufacturer, is not guaranteed or endorsed by the publisher.
Supplementary material
The Supplementary Material for this article can be found online at: https://www.frontiersin.org/articles/10.3389/fendo.2023.1149997/full#supplementary-material
Supplementary Figure 1 | The heatmap (A) and the violin plot (B) showing the differentially expressed target genes of key eRNAs between the PitNETs and normal samples.
Supplementary Figure 2 | The result of validation from String.
Supplementary Figure 3 | Results of ATAC-seq analysis. The accessibility on chromatin of (A) GNLY, (B) HOXB7, (C) MRPL33, (D) TCF7 and (E) ZNF26 was verified by ATAC-seq analysis.
Supplementary Figure 4 | The binding level between PRDM16 (eRNA) and ELK4 (TF) in response to the CHIP-seq analysis.
Supplementary Figure 5 | The expression level of (A) GNLY, (B) HOXB7, (C) MRPL33 and (D) PRDM16 between the PitNETs and normal samples based on the eRic database. Kaplan Meier curves (KM_CURVE) of overall survival of (E) GNLY, (F) HOXB7, (G) MRPL33 and (H) PRDM16 based on the eRic database.
References
1. Mete O, Cintosun A, Pressman I, Asa SL. Epidemiology and biomarker profile of pituitary adenohypophysial tumors. Mod Pathol (2018) 31(6):900–9. doi: 10.1038/s41379-018-0016-8
2. Asa SL, Casar-Borota O, Chanson P, Delgrange E, Earls P, Ezzat S, et al. From pituitary adenoma to pituitary neuroendocrine tumor (PitNET): an international pituitary pathology club proposal. Endocrine-Related Cancer (2017) 24(4):C5. doi: 10.1530/ERC-17-0004
3. Molitch ME. Diagnosis and treatment of pituitary adenomas: a review. JAMA (2017) 317(5):516–24. doi: 10.1001/jama.2016.19699
4. Lake MG, Krook LS, Cruz SV. Pituitary adenomas: an overview. Am Fam Physician (2013) 88(5):319–27.
5. Melmed S. Pituitary-tumor endocrinopathies. N Engl J Med (2020) 382(10):937–50. doi: 10.1056/NEJMra1810772
6. Lee CC, Vance ML, Xu Z, Yen CP, Schlesinger D, Dodson B, et al. Stereotactic radiosurgery for acromegaly. J Clin Endo Meta 99(4):1273–81. doi: 10.1210/jc.2013-3743
7. Bulger M, Groudine M. Enhancers: the abundance and function of regulatory sequences beyond promoters. Dev Biol (2010) 339(2):250–7. doi: 10.1016/j.ydbio.2009.11.035
8. Blackwood EM, Kadonaga JT. Going the distance: a current view of enhancer action. Science (1998) 281(5373):60–3. doi: 10.1126/science.281.5373.60
9. Adhikary S, Roy S, Chacon J, Gadad SS, Das C. Implications of enhancer transcription and eRNAs in cancer. Cancer Res (2021) 81(16):4174–82. doi: 10.1158/0008-5472.CAN-20-4010
10. Pan CW, Wen S, Chen L, Wei Y, Niu Y, Zhao Y. Functional roles of antisense enhancer RNA for promoting prostate cancer progression. Theranostics (2021) 11(4):1780–94. doi: 10.7150/thno.51931
11. Han Z, Li W, Enhancer RNA. What we know and what we can achieve. Cell Prolif (2022) 55(4):e13202. doi: 10.1111/cpr.13202
12. Sur I, Taipale J. The role of enhancers in cancer. Nat Rev Cancer (2016) 16(8):483–93. doi: 10.1038/nrc.2016.62
13. Zhu J, He F, Hu S, Yu J. On the nature of human housekeeping genes. Trends Genet (2008) 24(10):481–4. doi: 10.1016/j.tig.2008.08.004
14. Lee J-H, Xiong F, Li W. Enhancer RNAs in cancer: regulation. Mech Ther potential RNA Biol (2020) 17(11):1550–9. doi: 10.1080/15476286.2020.1712895
15. Neou M, Villa C, Armignacco R, Jouinot A, Raffin-Sanson ML, Septier A, et al. Pangenomic classification of pituitary neuroendocrine tumors. Cancer Cell (2020) 37(1):123–134.e5. doi: 10.1016/j.ccell.2019.11.002
16. Liberzon A, Birger C, Thorvaldsdóttir H, Ghandi M, Mesirov JP, Tamayo P. The molecular signatures database (MSigDB) hallmark gene set collection. Cell Syst (2015) 1(6):417–25. doi: 10.1016/j.cels.2015.12.004
17. Zheng R, Wan C, Mei S, Qin Q, Wu Q, Sun H, et al. Cistrome data browser: expanded datasets and new tools for gene regulatory analysis. Nucleic Acids Res (2019) 47(D1):D729–d735. doi: 10.1093/nar/gky1094
18. Zhang Z, Lee J-H, Ruan H, Ye Y, Krakowiak J, Hu Q, et al. Transcriptional landscape and clinical utility of enhancer RNAs for eRNA-targeted therapy in cancer. Nat Commun (2019) 10. doi: 10.1038/s41467-019-12543-5
19. Yu G, Wang LG, He QY. ChIPseeker: an R/Bioconductor package for ChIP peak annotation, comparison and visualization. Bioinformatics (2015) 31(14):2382–3. doi: 10.1093/bioinformatics/btv145
20. Ritchie ME, Phipson B, Wu D, Hu Y, Law CW, Shi W, et al. Limma powers differential expression analyses for RNA-sequencing and microarray studies. Nucleic Acids Res (2015) 43(7). doi: 10.1093/nar/gkv007
21. Robinson MD, McCarthy DJ, Smyth GK. edgeR: a bioconductor package for differential expression analysis of digital gene expression data. Bioinformatics (2010) 26(1):139–40. doi: 10.1093/bioinformatics/btp616
22. Meng T, Huang R, Zeng Z, Huang Z, Yin H, Jiao C, et al. Identification of prognostic and metastatic alternative splicing signatures in kidney renal clear cell carcinoma. Front Bioengineering Biotechnol (2019) 7. doi: 10.3389/fbioe.2019.00270
23. Newman AM, Steen CB, Liu CL, Gentles AJ, Chaudhuri AA, Scherer F, et al. Determining cell type abundance and expression from bulk tissues with digital cytometry. Nature Biotechnology (2019) 37(7):773–82. doi: 10.1038/s41587-019-0114-2
24. Hanzelmann S, Castelo R, Guinney J. GSVA: gene set variation analysis for microarray and RNA-seq data. BMC Bioinf (2013) 14:7. doi: 10.1186/1471-2105-14-7
25. Lamb J, Crawford ED, Peck D, Modell JW, Blat IC, Wrobel MJ, et al. The connectivity map: using gene-expression signatures to connect small molecules, genes, and disease. Science (2006) 313(5795):1929–35. doi: 10.1126/science.1132939
26. Subramanian A, Narayan R, Corsello SM, Peck DD, Natoli TE, Lu X, et al. A next generation connectivity map: L1000 platform and the first 1,000,000 profiles. Cell (2017) 171(6):1437–1452.e17. doi: 10.1016/j.cell.2017.10.049
27. Snel B, Lehmann G, Bork P, Huynen MA. STRING: a web-server to retrieve and display the repeatedly occurring neighbourhood of a gene. Nucleic Acids Res (2000) 28(18):3442–4. doi: 10.1093/nar/28.18.3442
28. Buenrostro JD, Wu B, Chang HY, Greenleaf WJ. ATAC-seq: a method for assaying chromatin accessibility genome-wide. Curr Protoc Mol Biol (2015) 109. doi: 10.1002/0471142727.mb2129s109
29. Mei S, Qin Q, Wu Q, Sun H, Zheng R, Zang C, et al. Cistrome data browser: a data portal for ChIP-seq and chromatin accessibility data in human and mouse. Nucleic Acids Res (2017) 45(D1):D658–d662. doi: 10.1093/nar/gkw983
30. Park PJ. ChIP-seq: advantages and challenges of a maturing technology. Nat Rev Genet (2009) 10(10):669–80. doi: 10.1038/nrg2641
31. Davis CA, Hitz BC, Sloan CA, Chan ET, Davidson JM, Gabdank I, et al. The encyclopedia of DNA elements (ENCODE): data portal update. Nucleic Acids Res (2018) 46(D1):D794–d801. doi: 10.1093/nar/gkx1081
32. Radadiya PS, Thornton MM, Puri RV, Yerrathota S, Dinh-Phan J, Magenheimer B, et al. Ciclopirox olamine induces ferritinophagy and reduces cyst burden in polycystic kidney disease. JCI Insight (2021) 6(8). doi: 10.1172/jci.insight.141299
33. Famini P, Maya MM, Melmed S. Pituitary magnetic resonance imaging for sellar and parasellar masses: ten-year experience in 2598 patients. J Clin Endocrinol Metab (2011) 96(6):1633–41. doi: 10.1210/jc.2011-0168
34. Fernandez A, Karavitaki N, Wass JA. Prevalence of pituitary adenomas: a community-based, cross-sectional study in Banbury (Oxfordshire, UK). Clin Endocrinol (Oxf) (2010) 72(3):377–82. doi: 10.1111/j.1365-2265.2009.03667.x
35. Freda PU, Beckers AM, Katznelson L, Molitch ME, Montori VM, Post KD, et al. Pituitary incidentaloma: an endocrine society clinical practice guideline. J Clin Endocrinol Metab (2011) 96(4):894–904. doi: 10.1210/jc.2010-1048
36. Melmed S, Casanueva FF, Hoffman AR, Kleinberg DL, Montori VM, Schlechte JA, et al. Diagnosis and treatment of hyperprolactinemia: an endocrine society clinical practice guideline. J Clin Endocrinol Metab (2011) 96(2):273–88. doi: 10.1210/jc.2010-1692
37. Vilar L, Freitas MC, Naves LA, Casulari LA, Azevedo M, Montenegro R Jr., et al. Diagnosis and management of hyperprolactinemia: results of a Brazilian multicenter study with 1234 patients. J Endocrinol Invest (2008) 31(5):436–44. doi: 10.1007/BF03346388
38. Wang J, Wang D, Wan D, Ma Q, Liu Q, Li J, et al. Circular RNA in invasive and recurrent clinical nonfunctioning pituitary adenomas: expression profiles and bioinformatic analysis. World Neurosurg (2018) 117:e371–86. doi: 10.1016/j.wneu.2018.06.038
39. Cui M, Zhang M, Liu HF, Wang JP. Effects of microRNA-21 targeting PITX2 on proliferation and apoptosis of pituitary tumor cells. Eur Rev Med Pharmacol Sci (2017) 21(13):2995–3004.
40. Zhang F, Zhang Q, Zhu J, Yao B, Ma C, Qiao N, et al. Integrated proteogenomic characterization across major histological types of pituitary neuroendocrine tumors. Cell Res (2022) 32(12):1047–67. doi: 10.1038/s41422-022-00736-5
41. Sartorelli V, Lauberth SM. Enhancer RNAs are an important regulatory layer of the epigenome. Nat Struct Mol Biol (2020) 27(6):521–8. doi: 10.1038/s41594-020-0446-0
42. Catarino RR, Stark A. Assessing sufficiency and necessity of enhancer activities for gene expression and the mechanisms of transcription activation. Genes Dev (2018) 32(3-4):202–23. doi: 10.1101/gad.310367.117
43. Franco HL, Nagari A, Kraus WL. TNFα signaling exposes latent estrogen receptor binding sites to alter the breast cancer cell transcriptome. Mol Cell (2015) 58(1):21–34. doi: 10.1016/j.molcel.2015.02.001
44. Lai F, Orom UA, Cesaroni M, Beringer M, Taatjes DJ, Blobel GA, et al. Activating RNAs associate with mediator to enhance chromatin architecture and transcription. Nature (2013) 494(7438):497–501. doi: 10.1038/nature11884
45. Li W, Notani D, Ma Q, Tanasa B, Nunez E, Chen AY, et al. Functional roles of enhancer RNAs for oestrogen-dependent transcriptional activation. Nature (2013) 498(7455):516–20. doi: 10.1038/nature12210
46. Rahnamoun H, Lu H, Duttke SH, Benner C, Glass CK, Lauberth SM. Mutant p53 shapes the enhancer landscape of cancer cells in response to chronic immune signaling. Nat Commun (2017) 8(1):754. doi: 10.1038/s41467-017-01117-y
47. Krensky AM, Clayberger C. Biology and clinical relevance of granulysin. Tissue Antigens (2009) 73(3):193–8. doi: 10.1111/j.1399-0039.2008.01218.x
48. Kishi A, Takamori Y, Ogawa K, Takano S, Tomita S, Tanigawa M, et al. Differential expression of granulysin and perforin by NK cells in cancer patients and correlation of impaired granulysin expression with progression of cancer. Cancer Immunology Immunotherapy (2002) 50(11):604–14. doi: 10.1007/s002620100228
49. Sekiya M, Ohwada A, Katae M, Dambara T, Nagaoka I, Fukuchi Y. Adenovirus vector-mediated transfer of 9 kDa granulysin induces DNA fragmentation in HuD antigen-expressing small cell lung cancer murine model cells. Respirology (2002) 7(1):29–35. doi: 10.1046/j.1440-1843.2002.00365.x
50. Stenger S, Hanson DA, Teitelbaum R, Dewan P, Niazi KR, Froelich CJ, et al. An antimicrobial activity of cytolytic T cells mediated by granulysin. Science (1998) 282(5386):121–5. doi: 10.1126/science.282.5386.121
51. Wang Z, Choice E, Kaspar A, Hanson D, Okada S, Lyu S-C, et al. Bactericidal and tumoricidal activities of synthetic peptides derived from granulysin. J Immunol (2000) 165(3):1486–90. doi: 10.4049/jimmunol.165.3.1486
52. Lin J, Huang Y, Zhang L, Tang W, Li X, Wang X, et al. Evaluation of serum granulysin as a potential biomarker for nasopharyngeal carcinoma. Clin Chim Acta (2016) 454:72–6. doi: 10.1016/j.cca.2015.12.035
53. Huo XY, Zhang XY, Yuan F, Zhao XY, You BA. HOXB7 promotes proliferation and metastasis of glioma by regulating the wnt/beta-catenin pathway. Eur Rev Med Pharmacol Sci (2019) 23(6):2476–85. doi: 10.26355/eurrev_201903_17395
54. Joo MK, Park JJ, Chun HJ. Impact of homeobox genes in gastrointestinal cancer. World J Gastroenterol (2016) 22(37):8247–56. doi: 10.3748/wjg.v22.i37.8247
55. Liu L, Luo C, Luo Y, Chen L, Liu Y, Wang Y, et al. MRPL33 and its splicing regulator hnRNPK are required for mitochondria function and implicated in tumor progression. Oncogene (2018) 37(1):86–94. doi: 10.1038/onc.2017.314
56. Li J, Feng D, Gao C, Zhang Y, Xu J, Wu M, et al. Isoforms s and l of MRPL33 from alternative splicing have isoformspecific roles in the chemoresponse to epirubicin in gastric cancer cells via the PI3K/AKT signaling pathway. Int J Oncol (2019) 54(5):1591–600. doi: 10.3892/ijo.2019.4728
57. Ito K, Carracedo A, Weiss D, Arai F, Ala U, Avigan DE, et al. A PML-PPAR-delta pathway for fatty acid oxidation regulates hematopoietic stem cell maintenance. Nat Med (2012) 18(9):1350–8. doi: 10.1038/nm.2882
58. Seale P, Conroe HM, Estall J, Kajimura S, Frontini A, Ishibashi J, et al. Prdm16 determines the thermogenic program of subcutaneous white adipose tissue in mice. J Clin Invest (2011) 121(1):96–105. doi: 10.1172/JCI44271
59. Kundu A, Nam H, Shelar S, Chandrashekar DS, Brinkley G, Karki S, et al. PRDM16 suppresses HIF-targeted gene expression in kidney cancer. J Exp Med (2020) 217(6). doi: 10.1084/jem.20191005
60. Cadigan KM, Waterman ML. TCF/LEFs and wnt signaling in the nucleus. Cold Spring Harb Perspect Biol (2012) 4(11). doi: 10.1101/cshperspect.a007906
61. Chen WY, Liu SY, Chang YS, Yin JJ, Yeh HL, Mouhieddine TH, et al. MicroRNA-34a regulates WNT/TCF7 signaling and inhibits bone metastasis in ras-activated prostate cancer. Oncotarget (2015) 6(1):441–57. doi: 10.18632/oncotarget.2690
62. Gupta AK. Ciclopirox: an overview. Int J Dermatol (2001) 40(5):305–10. doi: 10.1046/j.1365-4362.2001.01156.x
63. Shen T, Huang S. Repositioning the old fungicide ciclopirox for new medical uses. Curr Pharm Des (2016) 22(28):4443–50. doi: 10.2174/1381612822666160530151209
64. Maier B, Ogihara T, Trace AP, Tersey SA, Robbins RD, Chakrabarti SK, et al. The unique hypusine modification of eIF5A promotes islet beta cell inflammation and dysfunction in mice. J Clin Invest (2010) 120(6):2156–70. doi: 10.1172/JCI38924
65. Mihailidou C, Chatzistamou I, Papavassiliou AG, Kiaris H. Ciclopirox enhances pancreatic islet health by modulating the unfolded protein response in diabetes. Pflugers Arch (2016) 468(11-12):1957–68. doi: 10.1007/s00424-016-1887-5
66. Tan T, Marin-Garcia J, Damle S, Weiss HR. Hypoxia-inducible factor-1 improves inotropic responses of cardiac myocytes in ageing heart without affecting mitochondrial activity. Exp Physiol (2010) 95(6):712–22. doi: 10.1113/expphysiol.2009.051649
67. Caceres CJ, Angulo J, Contreras N, Pino K, Vera-Otarola J, Lopez-Lastra M. Targeting deoxyhypusine hydroxylase activity impairs cap-independent translation initiation driven by the 5'untranslated region of the HIV-1, HTLV-1, and MMTV mRNAs. Antiviral Res (2016) 134:192–206. doi: 10.1016/j.antiviral.2016.09.006
68. Huang Z, Huang S. Reposition of the fungicide ciclopirox for cancer treatment. Recent Pat Anticancer Drug Discovery (2021) 16(2):122–35. doi: 10.2174/1574892816666210211090845
69. Eberhard Y, McDermott SP, Wang X, Gronda M, Venugopal A, Wood TE, et al. Chelation of intracellular iron with the antifungal agent ciclopirox olamine induces cell death in leukemia and myeloma cells. Blood (2009) 114(14):3064–73. doi: 10.1182/blood-2009-03-209965
70. Zhou H, Shen T, Luo Y, Liu L, Chen W, Xu B, et al. The antitumor activity of the fungicide ciclopirox. Int J Cancer (2010) 127(10):2467–77. doi: 10.1002/ijc.25255
71. Qi J, Zhou N, Li L, Mo S, Zhou Y, Deng Y, et al. Ciclopirox activates PERK-dependent endoplasmic reticulum stress to drive cell death in colorectal cancer. Cell Death Dis (2020) 11(7):582. doi: 10.1038/s41419-020-02779-14
72. Minden MD, Hogge DE, Weir SJ, Kasper J, Webster DA, Patton L, et al. Oral ciclopirox olamine displays biological activity in a phase I study in patients with advanced hematologic malignancies. Am J Hematol (2014) 89(4):363–8. doi: 10.1002/ajh.23640
Keywords: pituitary neuroendocrine tumors (PitNETs), enhancer RNAs, prediction model, regulatory network, ciclopirox
Citation: Wang L, Wei C, Wang Y, Huang N, Zhang T, Dai Y, Xue L, Lin S and Wu ZB (2023) Identification of the enhancer RNAs related to tumorgenesis of pituitary neuroendocrine tumors. Front. Endocrinol. 14:1149997. doi: 10.3389/fendo.2023.1149997
Received: 23 January 2023; Accepted: 27 June 2023;
Published: 18 July 2023.
Edited by:
Peng Zhao, Capital Medical University, ChinaReviewed by:
Ding Nie, Capital Medical University, ChinaPrashant Chittiboina, National Institute of Neurological Disorders and Stroke (NIH), United States
Xun Zhang, Harvard Medical School, United States
Shixiang Wang, Sun Yat-sen University Cancer Center (SYSUCC), China
Copyright © 2023 Wang, Wei, Wang, Huang, Zhang, Dai, Xue, Lin and Wu. This is an open-access article distributed under the terms of the Creative Commons Attribution License (CC BY). The use, distribution or reproduction in other forums is permitted, provided the original author(s) and the copyright owner(s) are credited and that the original publication in this journal is cited, in accordance with accepted academic practice. No use, distribution or reproduction is permitted which does not comply with these terms.
*Correspondence: Yuting Dai, ZHl0MTI0MjNAcmpoLmNvbS5jbg==; Li Xue, eGwxMjI3MkByamguY29tLmNu; Shaojian Lin, U2hhb2ppYW5saW44OEAxMjYuY29t; Zhe Bao Wu, emhlYmFvd3VAYWxpeXVuLmNvbQ==
†These authors have contributed equally to this work