 Maria Krajewska1*
 Ewelina Witkowska-Sędek1
 Małgorzata Rumińska1
 Anna M. Kucharska1Anna Stelmaszczyk-Emmel2Maria Sobol3Anna Majcher1
 Beata Pyrżak1
- 1Department of Paediatrics and Endocrinology, Medical University of Warsaw, Warsaw, Poland
- 2Department of Laboratory Diagnostics and Clinical Immunology of Developmental Age, Medical University of Warsaw, Warsaw, Poland
- 3Department of Biophysics, Physiology and Pathophysiology, Medical University of Warsaw, Warsaw, Poland
Background: Vitamin D affects adipogenesis, oxidative stress, inflammation, secretion of adipocytokines, lipid metabolism and thermogenesis. Some researchers postulate that those effects could be exerted by the influence of vitamin D on chemerin levels.
Aim of the study: We aimed to investigate if there is a link between serum 25-hydroksyvitamin D [25(OH)D], chemerin and metabolic profile in overweight and obese children before and after vitamin D supplementation.
Material and methods: The prospective study included 65 overweight and obese children aged 9.08-17.5 years and 26 peers as a control. None of the patients in the study group had received vitamin D within the last twelve months before the study.
Results: The study group had lower baseline 25(OH)D (p<0.001) and higher chemerin (p<0.001), triglycerides (TG, p<0.001), triglycerides/high density lipoprotein cholesterol (TG/HDL-C, p<0.001), C-reactive protein (CRP, p<0.05), fasting insulin (p<0.001), Homeostasis Model Assessment - Insulin Resistance (HOMA-IR, p<0.001), alanine aminotransferase (ALT, p<0.001) and uric acid (p<0.001) compared to the control group. Baseline vitamin D was related to fasting insulin (R=-0.29, p=0.021), HOMA-IR (R=-0.30, p=0.016), HDL-C (R=0.29, p=0.020) and uric acid (R=-0.28, p=0.037) in the study group. Baseline chemerin was related to insulin at 30’ (R=0.27, p=0.030), 60’ (R=0.27, p=0.033), 90’ (R=0.26, p=0.037) and 120’ (R=0.26, p=0.040) during the oral glucose tolerance test (OGTT) and ALT (R=0.25, p=0.041) in the study group. Correlation between vitamin D and chemerin (R=-0.39, p=0.046) was found only in the control group. After six months of vitamin D supplementation a decrease in CRP (p<0.01), total cholesterol (p<0.05), ALT (p<0.01), glucose at 150’ OGTT (p<0.05) was observed. Moreover, we noticed a tendency for negative association between 25(OH)D and chemerin levels (p=0.085). Multivariable backward linear regression models were build using baseline vitamin D, baseline chemerin and six months chemerin as the dependent variables.
Conclusions: Our study confirmed that vitamin D has positive effect on metabolic profile in overweight and obese children. The relationship between vitamin D and chemerin is not clear, nevertheless we have observed a tendency to decrease chemerin concentrations after improving vitamin D status, even without a significant reduction in body fat mass.
Introduction
Adipose tissue as a highly metabolically active organ has been intensively studied over the last decades (1, 2). It secretes a number of adipokines and pro-inflammatory cytokines which link excess body fat with chronic inflammation and atherosclerosis, contributing to the development of obesity-related metabolic disorders (1, 3–5). Vitamin D is also involved in those processes (6, 7). The development of obesity and vitamin D status are mutually dependent (6). It has been confirmed that vitamin D can affect both genomic and nongenomic responses in adipose tissue. Its effect includes the impact on adipogenesis and apoptosis, on the development of oxidative stress and inflammation, the regulation of the secretion of adipokines, pro-inflammatory and anti-inflammatory cytokines, the influence on lipid metabolism and thermogenesis (8). Some studies reported the beneficial effect of vitamin D supplementation on reducing cardiometabolic risk factors in childhood obesity (9–11). Some researchers postulated that the protective effect of vitamin D on metabolic profile could be exerted by the influence on chemerin levels (12–14). Chemerin is one of the most important multifunctional adipokines, generated mainly in subcutaneous and visceral adipose tissue by elastase and tryptase which activate prochemerin. Chemerin mRNA is expressed also in fibroblasts, chondrocytes, epithelial cells, platelets and in a number of organs such as liver, female reproductive organs, adrenal glands, lungs, kidneys and pancreas (15–18). Chemerin is involved in glucose homeostasis, lipid metabolism, maintenance of energy balance, adipogenesis, angiogenesis, inflammatory and autoimmune processes (1, 18–22). Recent studies indicate that it could be also used as a marker of tumours (23, 24). Increased chemerin levels, typical for obesity, are associated with adiposity-related dyslipidaemia, insulin resistance, low-grade inflammation and hypertension (25–29). Recent evidence suggest that chemerin, similarly to other adipokines e.g. leptin, may influence bone metabolism. Experimental data indicate that chemerin promotes osteoclastogenesis (30–35).
The aim of these study was to investigate the link between serum 25-hydroksyvitamin D [25(OH)D], chemerin and metabolic profile in overweight and obese children before and after vitamin D supplementation.
Material and methods
The prospective study included 65 children (51 obese and 14 overweight, aged 9.08-17.5 years) with mean body mass index (BMI) 30.9 ± 4.8 and 26 peers as a control with mean BMI 18.3 ± 2.6 age- and sex- matched. None of the patients in the study group had received vitamin D within the last twelve months before the study. The study protocol was approved by the Bioethics Committee at the Medical University of Warsaw (decision number KB/257/2013) and conducted in the Department of Paediatrics and Endocrinology at the Medical University of Warsaw (Poland). At the time of blood collection, children in both the study and the control group were healthy, without infection or chronic diseases and were not taking any medication. During the study period the participants did not change their diet or the level of physical activity. Serum 25(OH)D, chemerin, C-reactive protein (CRP), glucose and insulin during the oral glucose tolerance test (OGTT), uric acid, aminotransferases (aspartate aminotransferase – AST and alanine aminotransferase - ALT), lipid profile (total cholesterol, low density lipoprotein cholesterol - LDL-C, high density lipoprotein cholesterol - HDL-C, triglycerides - TG) and glycated haemoglobin (HbA1c) were determined at baseline (both in the study and in the control group) and after six months of vitamin D supplementation (in the study group). Following indices were calculated: TG/HDL-C ratio, Homeostasis Model Assessment - Insulin Resistance (HOMA-IR) and Quantitative Insulin Sensitivity Check Index (QUICKI) at baseline and after six months of vitamin D supplementation. The aim of vitamin D administration was to achieve the reference serum 25(OH)D levels between 30 and 50 ng/ml after six months of intervention (36). Depending on the serum 25(OH)D levels, the doses of vitamin D ranged from 2000 to 4000 units per day. Serum 25(OH)D concentrations were assessed every month, which allowed us to control compliance and to modify administered vitamin D doses to achieve reference values after six months of the study.
Anthropometric parameters (height, weight, waist and hip circumference) were measured using standardized methods. Based on these measurements BMI, waist-to-hip ratio (WHR) and waist-to-height ratio (WHtR) were calculated. The skinfold thickness (mm) was measured under the triceps brachii muscle and under the inferior scapular angle. Body fat percentage (%FAT skinfolds) was calculated in the study group and in the control group using Slaughter formula (37). Additionally, in the study group the percentage of fat was measured using a bioimpedance analysis (%FAT BIA) device (Maltron Body FAT Analyzer BF-905). Height and weight were evaluated according to polish 2010 growth references for school-aged children and adolescents (38). The degree of obesity expressed as BMI standard deviation score (SDS) was calculated using the LMS method to normalize skewness of the distribution of BMI (38, 39). Obesity was defined as BMI SDS ≥ 2, and overweight as BMI SDS ≥ 1 and < 2 (40).
Biochemical analyses
Blood samples were collected after overnight fasting and analysed by standard methods. Serum 25(OH)D levels (ng/ml) were determined by immunoassay method using Architect Analyzer (Abbott Diagnostics, Lake Forest, USA). Serum levels of chemerin (pg/ml) were evaluated by ELISA (Mediagnost, Reutlingen, Germany) using Asys UVM 340 Analyzer. The concentrations of fasting glucose (mg/dl) and glucose in the oral glucose tolerance test (OGTT 1.75g of glucose/kg body weight, no more than 75g; blood samples taken at 0’, 30’, 60’, 90’, 120’, 150’, 180’) were determined in blood serum by glucose oxidase colorimetric method using Vitros 5600 Analyzer (Ortho Clinical Diagnostic, New Jersey, USA). The concentrations of HbA1c (%) were measured in whole blood by ion-exchange high-performance liquid chromatography using D-10 Hemoglobin Analyzer (BIO-RAD). The concentrations of insulin (uIU/ml) were measured in serum by immunoassay using IMMULITE 2000 Xpi Analyzer (Siemens). Serum levels of total cholesterol (mg/dl), LDL-C (mg/dl), HDL-C (mg/dl), TG (mg/dl), ALT (U/l), AST (U/l), CRP (mg/dl) and uric acid (mg/dl) were determined in blood serum using Vitros 5600 Analyzer (Ortho Clinical Diagnostic, New Jersey, USA). The HOMA-IR was calculated as follows: HOMA-IR = (fasting glucose mg/dl) x (fasting insulin uIU/ml)/405. The QUICKI was calculated as follows: QUICKI = 1/[log(fasting insulin uIU/ml) + log(fasting glucose mg/dl)] (41). The levels of uric acid were classified as normal or increased according to the reference values provided by the manufacturer. The values of lipid parameters were classified as normal or increased/decreased (increased total cholesterol, LDL-C, TG and decreased HDL-C) according to the reference values used in paediatric population (42).
Statistical analysis
Statistical analysis was performed using Statistica 13.3. Data distribution was checked using the Shapiro–Wilk test. Data were presented as means with standard deviation or the median and interquartile ranges, as appropriate. Comparisons between baseline data of the study group and the control group were made using the T-test for parametric data or using the U Mann-Whitney test for non-parametric data. Analysis of changes of the same parameter at baseline and after six months of vitamin D supplementation were provided using the T-test or the Wilcoxon test, as appropriate. Correlation analysis was performed using Spearman correlation coefficient. In further analysis, we used multivariable stepwise regression analysis to determine which factors (model first: body mass SDS, hip circumference, BMI SDS, waist circumference or model second: fasting insulin, HOMA-IR, HDL-C, uric acid) were associated with baseline 25(OH)D (as dependent variable). We also analysed which parameters (model third: %FAT BIA, %FAT skinfolds, WHtR, BMI SDS or model fourth: insulin at 60’ and 120’ during the OGTT, ALT, TG/HDL-C) were associated with baseline chemerin levels (as dependent variable). In model fifth: WHR, WHtR, %FAT skinfolds and model sixth: TG, TG/HDL-C, ALT we investigated which factors were associated with chemerin values after six months of vitamin D supplementation.
Results
Baseline anthropometric and biochemical parameters in the study group and in the control group
Baseline anthropometric and biochemical characteristics of the study group and of the control group are presented in Tables 1, 2. As expected, baseline 25(OH)D levels were significantly lower in children with excess body weight compared to the control group (median values 16.0 vs. 25.7 ng/ml, p<0.001), whereas baseline chemerin levels were significantly higher in the study group than in the control group (median 212.0 vs. 147.1 pg/ml, p<0.001). We noticed also that the study group had higher TG (p<0.001), TG/HDL-C ratio (p<0.001), CRP (p<0.05), fasting insulin (p<0.001), HOMA-IR (p<0.001), ALT activity (p<0.001) and uric acid (p<0.001) compared to the control group. The levels of HDL-C were significantly lower (p<0.001) in overweight and obese children.
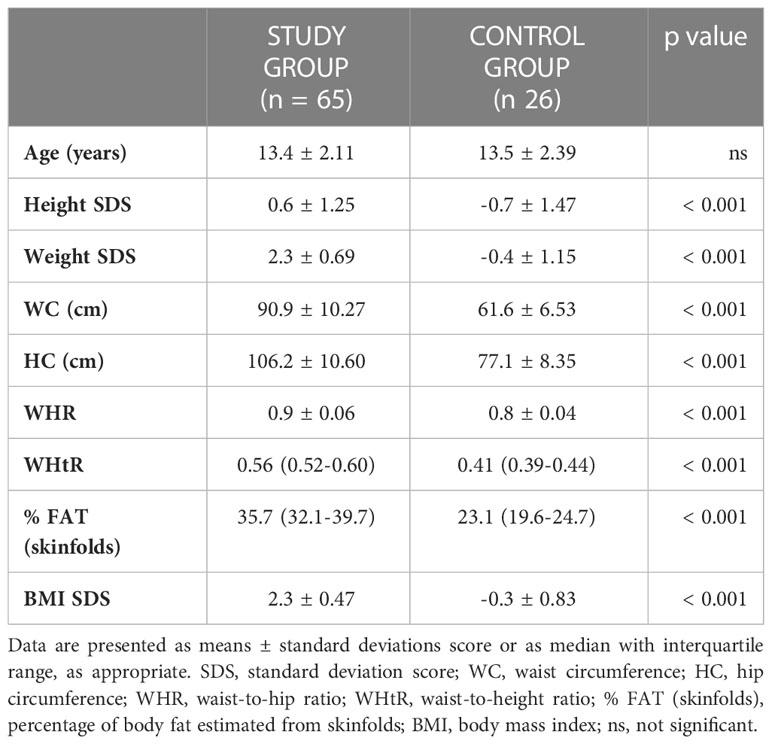
Table 1 Baseline anthropometric measurements in the study group and in the control group.
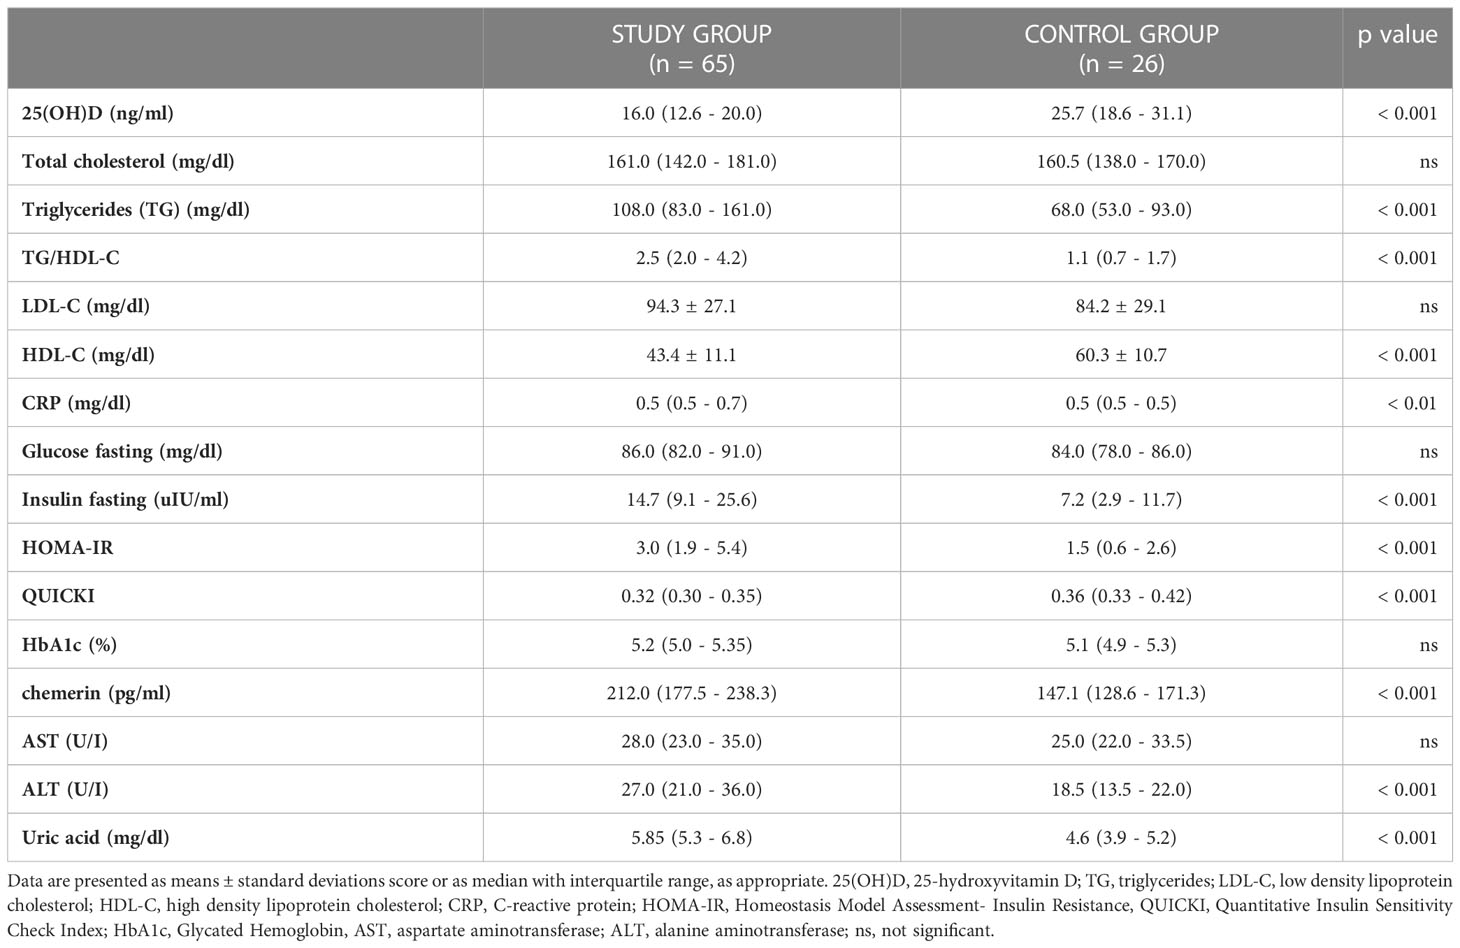
Table 2 Baseline biochemical parameters in the study group and in the control group.
Correlation analysis revealed that baseline 25(OH)D levels correlated significantly with nutritional status parameters of the study group such as body weight SDS (R=-0.27, p=0.032), BMI SDS (R=-0.27, p=0.028), hip circumference (R=-0.27, p=0.030). In the control group none associations between baseline vitamin D status and anthropometric parameters were observed.
Analysing baseline metabolic profile of both groups we found that vitamin D status was related significantly to fasting insulin (R=-0.29, p=0.021), HOMA-IR (R=-0.30, p=0.016, Figure 1), QUICKI (R=0.29, p=0.020), HDL-C (R=0.29, p=0.020) and uric acid (R=-0.28, p=0.037) in the study group. These associations were not found in the control group. We did not find any associations between 25(OH)D levels and CRP, fasting glucose or glucose levels in OGTT, HbA1c, aminotransferase activity both in the study group and the control group at baseline. Interestingly, we noticed, but only in the control group, significant negative correlation between baseline vitamin D level and baseline chemerin (R=-0.39, p=0.046, Figure 2).
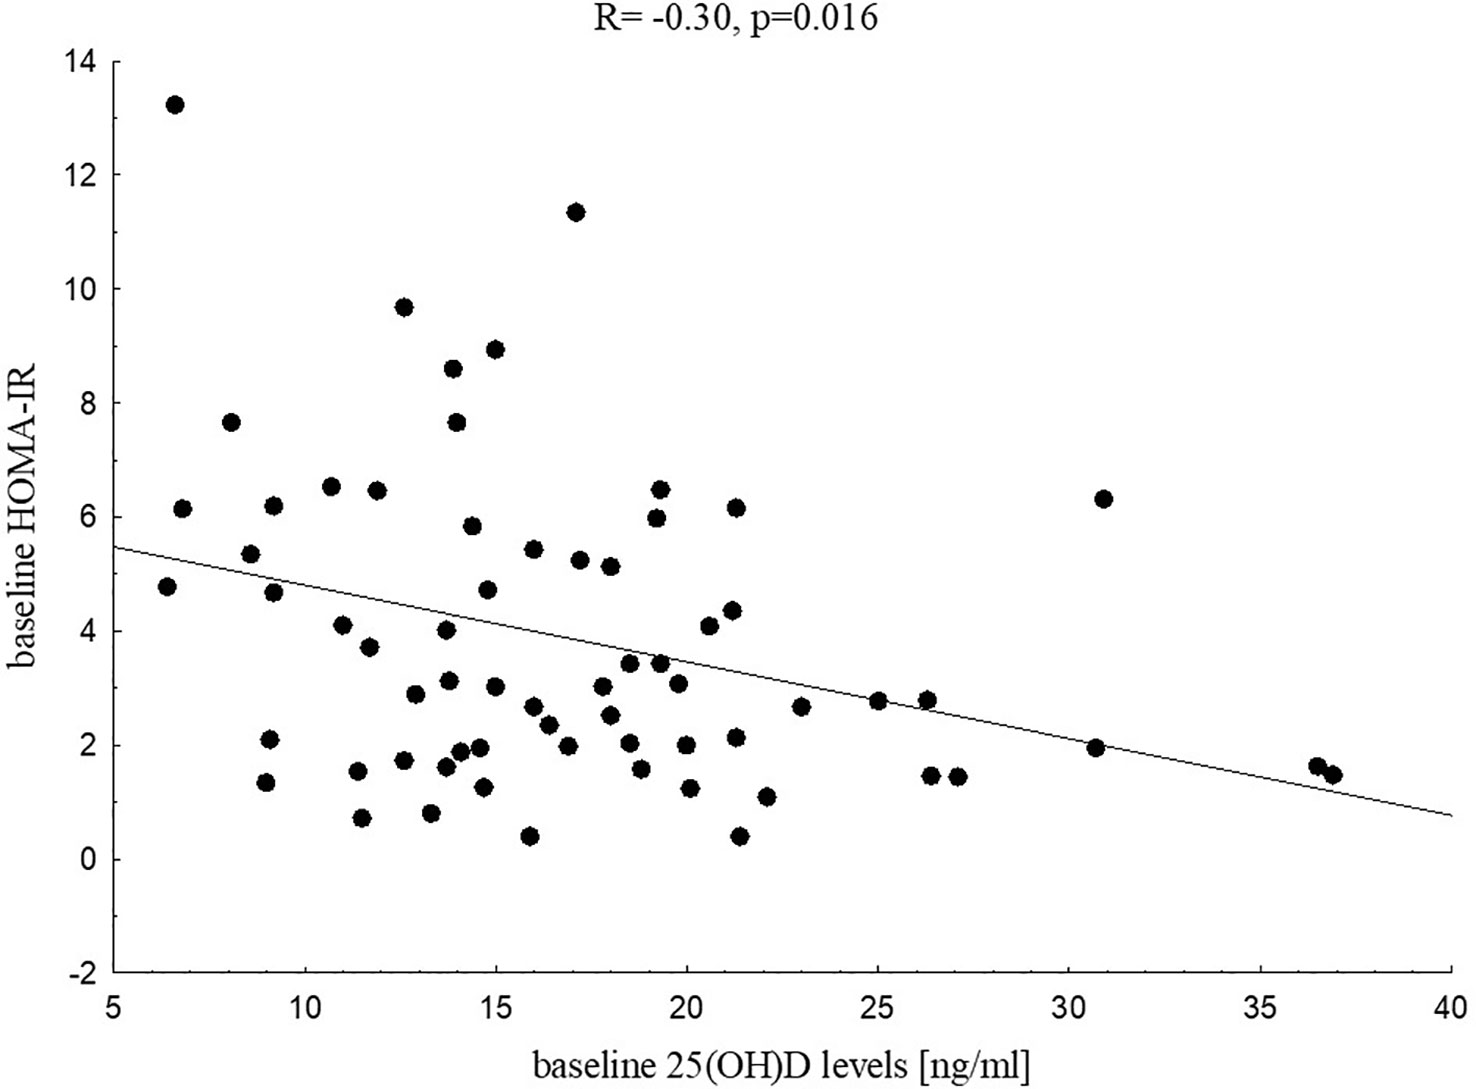
Figure 1 Correlation between 25(OH)D levels and HOMA-IR in the study group at baseline.
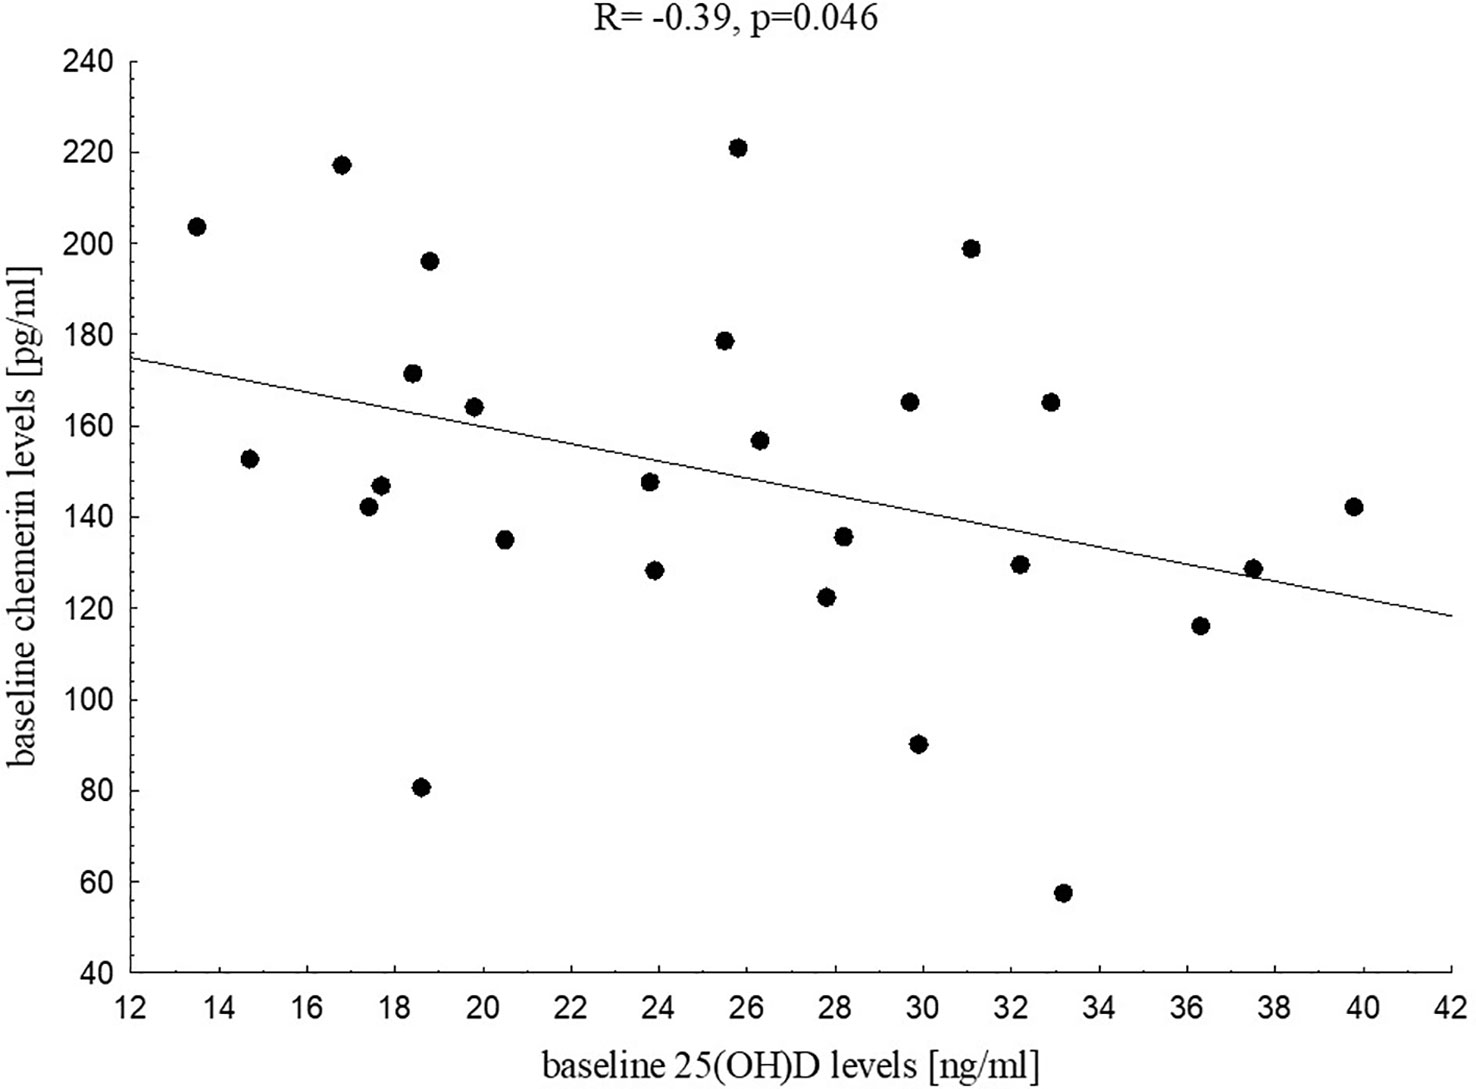
Figure 2 Correlation between 25(OH)D and chemerin levels in the control group at baseline.
Baseline chemerin levels were related to WHtR (R=0.32, p=0.010), %FAT BIA (R=0.25, p=0.045), %FAT skinfolds (R=0.26, p=0.042), insulin at 30’ (R=0.27, p=0.030), 60’ (R=0.27, p=0.033), 90’ (R=0.26, p=0.037) and 120’ during the OGTT (R=0.26, p=0.040) and ALT activity (R=0.25, p=0.041) in the study group. In the control group we found only positive relationship between baseline chemerin level and WHR (R=0.46, p=0.045).
Anthropometric and biochemical parameters after six months of vitamin D supplementation in the study group
Comparison between anthropometric and biochemical parameters in the study group at baseline and after six months of vitamin D supplementation is presented in Tables 3, 4. After six months of vitamin D supplementation the levels of 25(OH)D significantly increased in the study group compared to baseline values (median 16.0 vs. 27.1 ng/ml, p<0.001), while BMI SDS and chemerin levels did not change significantly. We found significant decrease in CRP (p<0.01), total cholesterol (p<0.05), ALT (p<0.01) and AST (p<0.01). We also noticed a decrease in glucose at 150’ during the OGTT (p<0.05) and a tendency for lower glucose levels at 120’ during the OGTT (p=0.079).
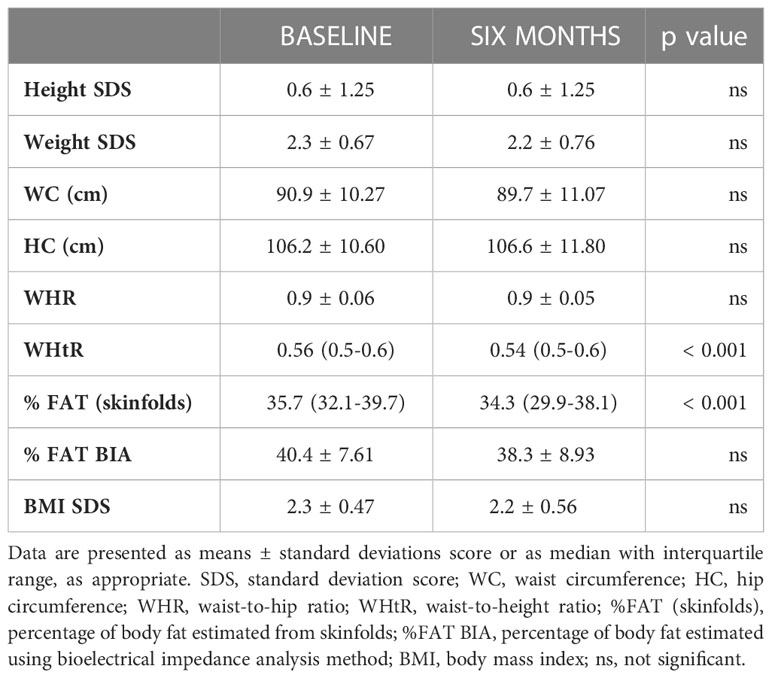
Table 3 Comparison between anthropometric parameters in the study group at baseline and after six months of vitamin D supplementation.
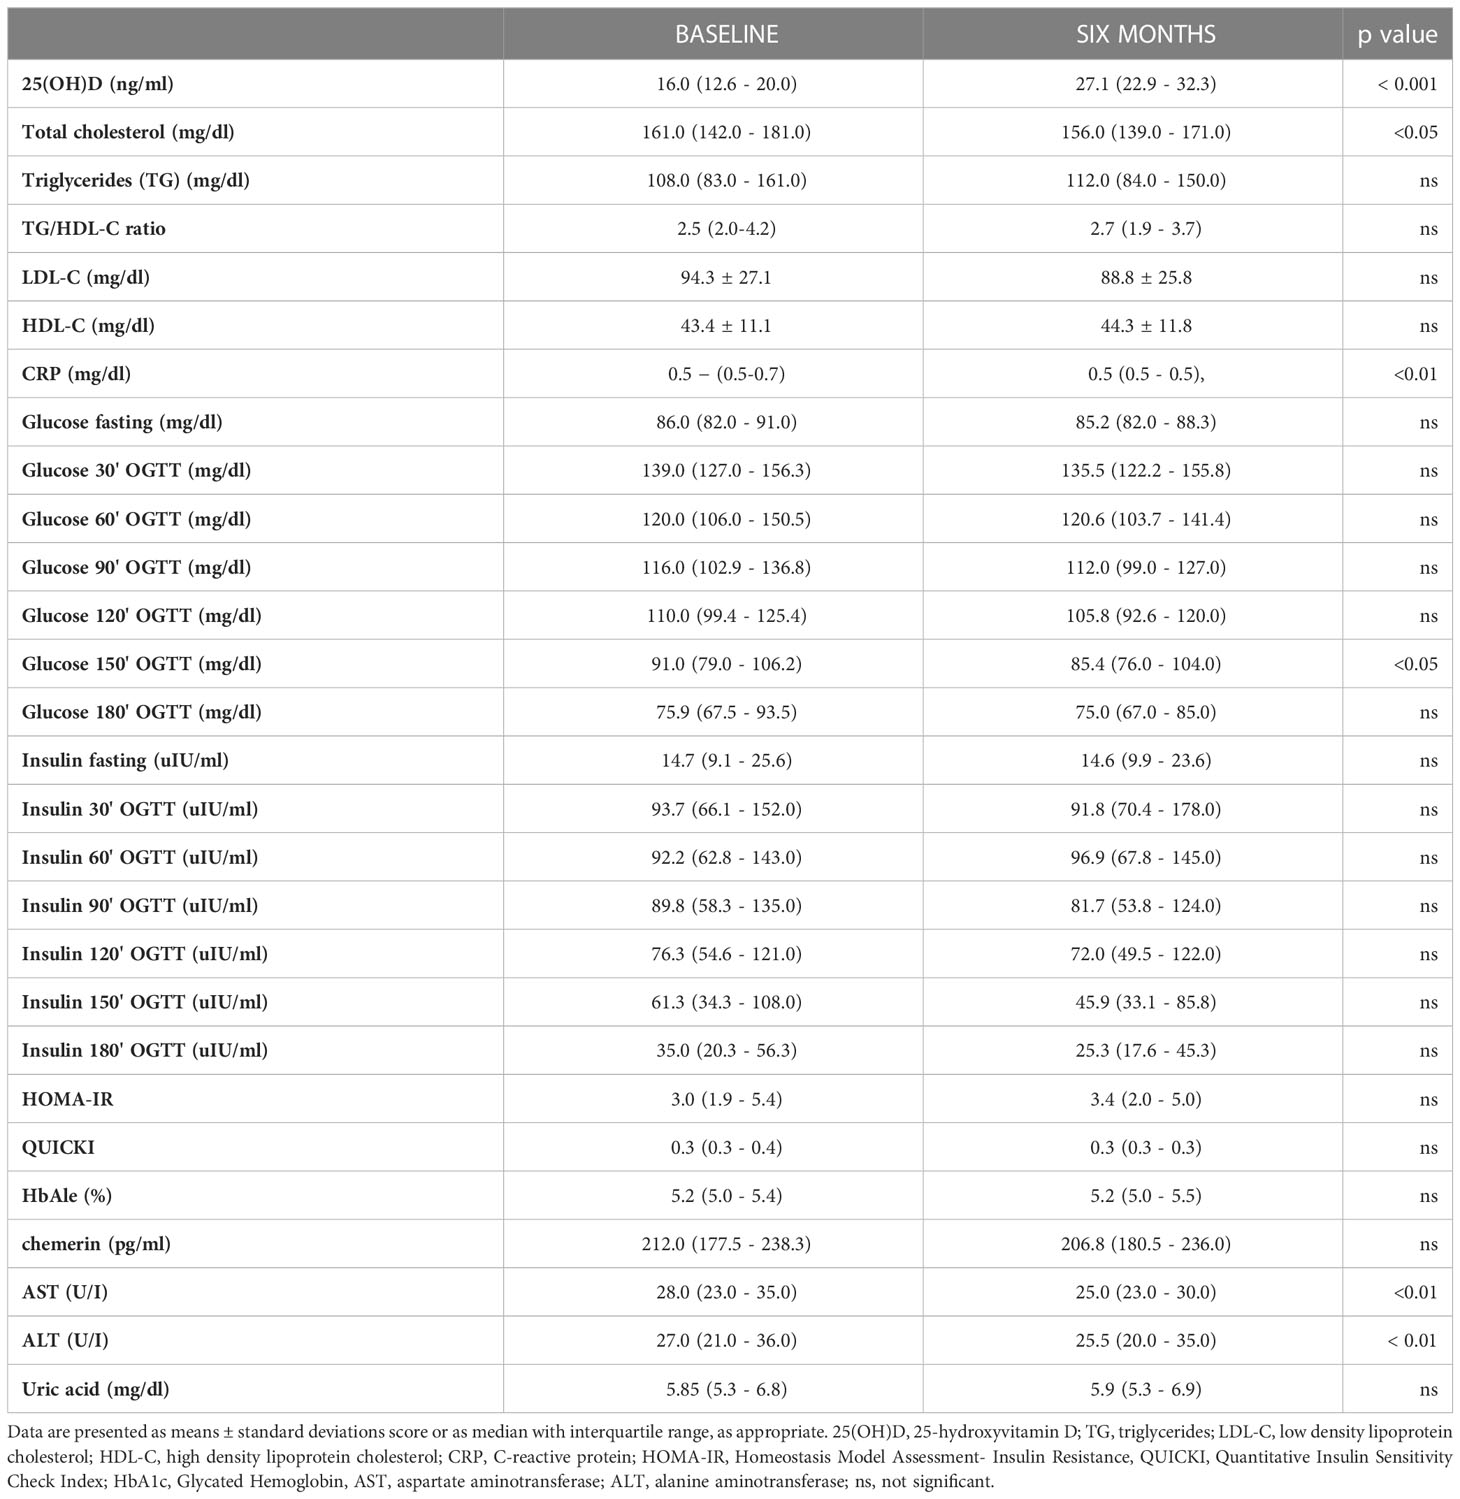
Table 4 Comparison between biochemical parameters in the study group at baseline and after six months of vitamin D supplementation.
Although we did not find any relationship between vitamin D status after six months of its supplementation and anthropometric or biochemical parameters at six months, we noticed a tendency for negative association between 25(OH)D and chemerin levels (p=0.085).
In further analysis we aimed to investigate if changes in vitamin D status during its supplementation influence metabolic profile in children with excess body mass. We found that changes in 25(OH)D levels were related negatively to changes in fasting glucose (R=-0.32, p=0.009, Figure 3) and changes in insulin levels at 120’ during the OGTT (R=-0.26, p=0.036).
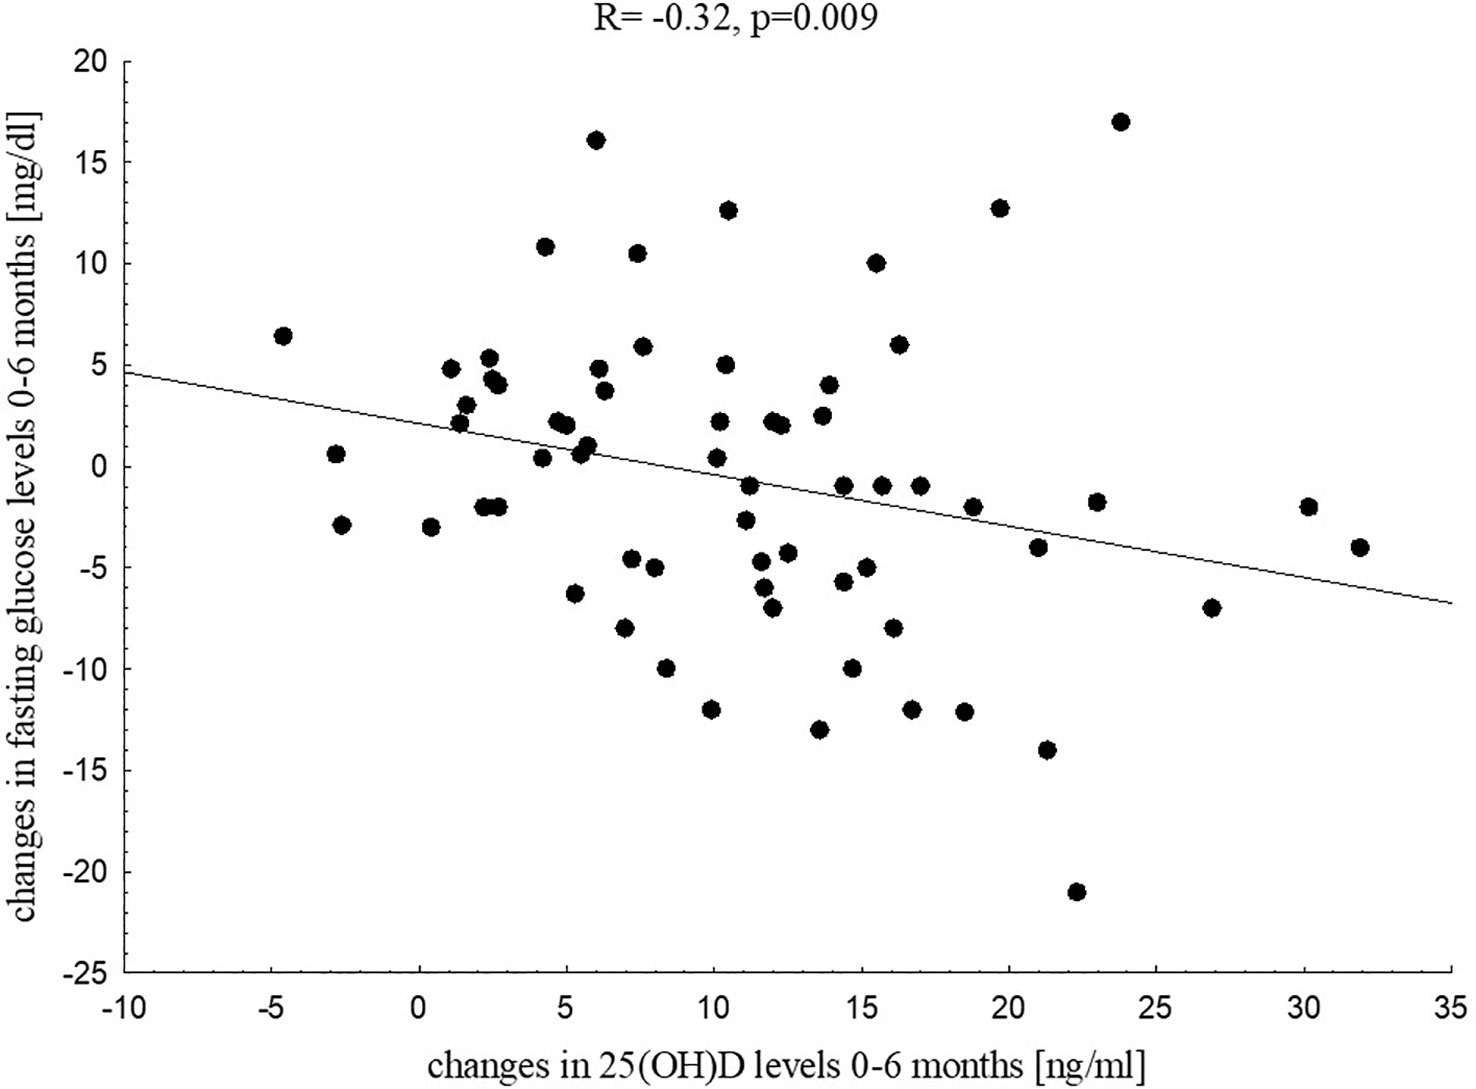
Figure 3 Correlation between changes in 25(OH)D levels and changes in fasting glucose in the study group after six months of vitamin D supplementation.
After six months of vitamin D supplementation chemerin levels correlated significantly with WHR (R=0.42, p=0.002), WHtR (R=0.38, p=0.006) and tended to be positively associated with % FAT skinfolds (p=0.052) and waist circumference (p=0.068). Among biochemical parameters six months chemerin levels correlated significantly with insulin at 30’ during the OGTT (R=0.25, p=0.043), TG (R=0.25, p=0.042), TG/HDL-C ratio (R=0.25, p=0.044) and ALT (R=0.39, p=0.012, Figure 4) in that period.

Figure 4 Correlation between chemerin levels and ALT activity in the study group after six months of vitamin D supplementation.
We investigated also how many patients in the study group presented dyslipidaemia and hyperuricemia, and if there were any significant associations between vitamin D and chemerin in these subgroups. At baseline dyslipidaemia was observed in 87% of children and hyperuricemia in 37,5%. After six months of vitamin D supplementation dyslipidaemia was found in 83% of the study group and hyperuricemia in 30%. Unfortunately, we did not find any statistically significant relationships.
Summary of the multivariable backward linear regression models build for the study group
Based on findings of Spearman correlation analysis we build some multivariable backward linear regression models for the study group using baseline 25(OH)D values, baseline chemerin and six months chemerin values as the dependent variables, as appropriate.
The first model included baseline vitamin D (as dependent variable) and baseline anthropometric parameters such as body mass SDS, hip circumference, BMI SDS and waist circumference as independent variables. This model was statistically significant with cumulative R2 = 0.10, p=0.011 and identified hip circumference as the parameter significantly negatively associated with baseline 25(OH)D levels. The received correlation coefficient was equal β=-0.320 ± 0.122 with 95% CI from -0.564 to -0.075.
The second model included baseline vitamin D (as dependent variable) and baseline fasting insulin, HOMA-IR, HDL-C and uric acid as independent variables. The model was statistically significant with cumulative R2 = 0.20, p=0.001 and identified only HDL-C level as the parameter significantly positively associated with baseline 25(OH)D level. The received correlation coefficient was equal β=0.443 ± 0.122 with 95% CI from 0.199 to 0.688.
Next two models included baseline chemerin level as dependent variable and respectively baseline % FAT BIA, % FAT skinfolds, WHtR and BMI SDS (third model) and baseline insulin at 60’ during the OGTT, insulin at 120’ during the OGTT, ALT and TG/HDL-C as independent variables (fourth model). The third model was statistically significant with cumulative R2 = 0.09, p=0.023. In that model WHtR was identified as one factor significantly positively associated with baseline chemerin. The received correlation coefficient was equal β=0.294 ± 0.126 with 95% CI from 0.043 to 0.545. The fourth model wasn’t statistically significant with cumulative R2 = 0.03, p=0.814.
Chemerin values after six months of vitamin D supplementation were used as dependent variable in the fifth (WHR, WHtR, % FAT skinfolds at six months as independent variables) and sixth model (TG, TG/HDL-C, ALT at six months as independent variables). The fifth model was statistically significant with cumulative R2 = 0.14, p=0.007 and identified WHtR at six months of vitamin D supplementation as a parameter significantly positively associated with chemerin level in that period. The received correlation coefficient was equal β=0.379 ± 0.135 with 95% CI from 0.108 to 0.651. The sixth model was statistically significant with cumulative R2 = 0.14, p=0.016 and revealed ALT as a factor significantly positively associated with chemerin at six months. The received correlation coefficient was equal β=0.378 ± 0.150 with 95% CI from 0.073 to 0.682.
Discussion
In our study we aimed to investigate the relationships between vitamin D status, chemerin and metabolic prolife parameters among overweight and obese children. Our analysis confirmed significantly lower vitamin D levels coincided with higher chemerin levels in patients with excess body fat compared to the controls, but we did not find any direct relationships between vitamin D status and chemerin in those children. This results stand in line with previous studies (25, 43–46). We noticed that baseline vitamin D was related mainly to fasting insulin, insulin resistance indices, HDL-C and uric acid, whereas baseline chemerin was positively associated with insulin secretion after glucose intake in OGTT and ALT activity in the study group. Both vitamin D and chemerin were related to nutritional status parameters, vitamin D mainly to BMI SDS and hip circumference, while chemerin was related to WHtR and fat mass expressed as %FAT BIA and %FAT skinfolds. Interestingly, in the control group with normal nutritional status parameters, significant negative relationship between 25(OH)D and chemerin was found. In overweight and obese children we observed a tendency for negative association between chemerin and 25(OH)D levels, but only after improvement in vitamin D status after six months of supplementation.
The relationships between excess body fat, insulin resistance, inflammation, dyslipidaemia and vitamin D deficit are intensively studied. Obesity-related insulin resistance and low-grade chronic inflammation seem to be the most important predictive factors for the development of complications of overweight and obesity such as metabolic syndrome, type 2 diabetes mellitus, cardiovascular disease and osteopenia/osteoporosis (47). The associations between vitamin D status and insulin sensitivity parameters in obese pediatric population have been previously reported (12, 48–53). The effects of vitamin D on glucose homeostasis, exerted mainly by its active form 1,25-dihydroxycholecalciferol, include the increase of peripheral and hepatic glucose uptake, the improvement in synthesis and secretion of insulin, the protection of β-cells from cytokine induced apoptosis and attenuation of inflammation (47, 54–56). It has been confirmed that insulin resistance affects obesity-related pro-atherogenic changes in lipid profile (57, 58). Insulin resistance impairs the function of insulin-dependent hormone-sensitive lipase and lipoprotein lipase, which are involved in lipid metabolism, whereas insulin cannot act effectively due to obesity and dyslipidaemia (59, 60). The study by Wang et al. (61) including nearly three hundred prepubertal and pubertal, normal and overweight/obese children and adolescents, demonstrated significant association between HOMA-IR and BMI and serum 25(OH)D level based on the stepwise multiple linear regression analysis of age, sex, pubertal maturation, BMI, WHtR, TG, total cholesterol, HDL-C, LDL-C, 25(OH)D and HOMA-IR. Several studies showed also the association between lipid profile, CRP, uric acid and vitamin D deficit, but the serum 25(OH)D level, predictive for vitamin D deficit-dependent metabolic disorders, has not been strictly defined (11, 62–68). Reis et al. (69), based on cross-sectional analysis of a group of more than three thousand adolescents, reported that individuals with 25(OH)D levels lower than 15 ng/ml are more likely to have fasting hyperglycemia, low HDL-C, hypertriglyceridemia, hypertension and metabolic syndrome compared to adolescents with 25(OH)D levels above 26 ng/ml. Rusconi et al. (62), among a group of more than one hundred obese children with 25(OH)D levels above or below 20 ng/ml, found higher total cholesterol and LDL-C levels in the group with vitamin D deficit. It should be noted that the stage of puberty also affects the relationship between vitamin D and the components of metabolic syndrome in obese children (53, 70, 71). Pires et al. (53) reported that the significant increase in TG, fasting insulin and HOMA-IR, observed during puberty, was related to a decrease in 25(OH)D levels independent of sex, body mass and pubertal Tanner stage.
Metabolic effects of vitamin D supplementation seem to be dependent on the dose and time of intervention. Our analysis showed that six months of vitamin D supplementation between 2000 to 4000 IU/day led mainly to a significant decrease in CRP, total cholesterol and aminotransferases activity. We found also that the increase in 25(OH)D levels resulted in a decrease in fasting glucose and insulin secretion at 120’ during the OGTT. Moreover, we noticed that after improvement of 25(OH)D level, a tendency for negative correlation between vitamin D status and chemerin appeared. Nader et al. (11) showed that twelve weeks of 2000 IU/day vitamin D supplementation in obese adolescents did not lead to detectable changes in fasting glucose, fasting insulin, HOMA-IR, lipids and highly sensitive CRP. On the other hand, the retrospective observational study by Pecoraro et al. (9), including overweight and obese children with 25(OH)D levels below 25 ng/ml, who underwent oral vitamin D supplementation (100 000 IU, one vial/month) for six months, indicated that vitamin D supplementation was associated with a significant decrease in total cholesterol, LDL-C and ALT serum levels and an increase in HDL-C.
In our study we also aimed to investigate the role of chemerin as a factor which could link vitamin D, insulin resistance and dyslipidaemia in overweight and obese children and adolescents. Those dependencies are not widely described, but some experimental studies suggest that protective effects of vitamin D supplementation could be exerted by reduction in chemerin levels (13, 14, 72). The number of clinical studies in that field is scarce. The cross-sectional study by Reyman et al. (12) revealed that vitamin D deficient obese children have significantly lower insulin sensitivity coexisted with higher chemerin, cathepsin S and soluble vascular adhesion molecule, which are known as pro-inflammatory, pro-diabetic and pro-atherogenic factors.
The mechanisms explaining the relationship between vitamin D status and chemerin are still not fully understood. Our multivariable backward linear regression models revealed WHtR and ALT activity as factors significantly positively associated with chemerin levels, both baseline and after six months of vitamin D supplementation. Based on our results we could presume that the relation between chemerin and body fat and hepatic steatosis is stronger than its association with vitamin D, especially in vitamin D deficient obese children (median 25(OH)D 16 ng/ml). Improvement of vitamin D status in our study group (median 25(OH)D 27.1 ng/ml) revealed a tendency for negative relationship between 25(OH)D and chemerin. In our control group with normal body weight and median 25(OH)D 25.7 ng/ml the significant negative correlation between 25(OH)D and chemerin levels was observed.
The study by Niklowitz et al. (25), including nearly one hundred obese children, confirmed that weight loss was associated with a decrease of chemerin levels and improvement of metabolic syndrome parameters such as insulin, HDL-C and TG. The associations between chemerin and weight loss were reported in several studies in obese pediatric and adult population (73–77). A study by Liu et al. (75) conducted among obese female adolescents showed that chemerin reduction achieved as a result of lifestyle changes correlated positively with fasting glucose, fasting insulin, HOMA-IR, TG and total cholesterol.
Gad et al. (78) revealed higher chemerin serum levels in obese children with metabolic syndrome. In his study chemerin positively correlated with fasting blood glucose and negatively with HDL-C. Other studies confirmed positive relationship between chemerin and insulin and HOMA-IR (25–27). In our study chemerin was related to insulin levels secreted in the response to OGTT, this relationship was present both before and after six months of vitamin D supplementation. Our study showed also positive correlation between chemerin and TG and TG/HDL-C ratio after the intervention.
Our study revealed positive correlation between chemerin levels and ALT activity. Elevated liver enzymes are the markers of non-alcoholic fatty liver disease (NAFLD), which is considered a liver manifestation of metabolic syndrome (79). Hamza et al. (44) among a group of fifty obese children also found a positive correlation between chemerin and liver enzymes, moreover he noticed that the increase in chemerin levels correlated positively with NAFLD severity.
Our study showed that vitamin D and chemerin are involved in metabolic processes. Taking into account that both of them affect adipose tissue and bone tissue, there may be some considerable overlap between their action, but it requires further investigation. We intend to continue our study on larger population and in longer follow-up.
Conclusion
Our study confirmed that vitamin D has positive effect on metabolic profile in overweight and obese children. The relationship between vitamin D and chemerin is not clear, nevertheless we have observed a tendency to decrease chemerin concentrations after improving vitamin D status, even without a significant reduction in body fat mass. Taking into account the role of chemerin as early indicator of obesity-related diseases, the studies in this field seem to be valuable.
Data availability statement
The original contributions presented in the study are included in the article/supplementary material. Further inquiries can be directed to the corresponding author.
Ethics statement
The studies involving human participants were reviewed and approved by Bioethics Committee at the Medical University of Warsaw (decision number KB/257/2013). Written informed consent to participate in this study was provided by the participants’ legal guardian/next of kin.
Author contributions
MK, EW-S and MR contributed to conception and design of the study. MK and MR organized the database. MK and EW-S prepared the tables. AM performed anthropometric measurements. MK and AS-E took measurements of serum chemerin levels. MK, EW-S and MS performed statistical analysis. MK and EW-S wrote the first draft of the manuscript. BP, AK supervised the work. MK and EW-S wrote the final version of the manuscript. All authors contributed to the article and approved the submitted version.
Funding
The article was not funded by a grant.
Acknowledgments
The authors would like to thank the nurse Małgorzata Przybylska for her contribution in blood sample collection.
Conflict of interest
The authors declare that the research was conducted in the absence of any commercial or financial relationships that could be construed as a potential conflict of interest.
Publisher’s note
All claims expressed in this article are solely those of the authors and do not necessarily represent those of their affiliated organizations, or those of the publisher, the editors and the reviewers. Any product that may be evaluated in this article, or claim that may be made by its manufacturer, is not guaranteed or endorsed by the publisher.
References
1. Thomas MM, Zaki ME, Youness E, Hamed K, Khedr AA, Abd El-Massieh PM, et al. Measurement of serum chemerin, oxidized LDL, and vitamin d levels in prader-willi syndrome: a cross-sectional study in pediatric Egyptian patients. J Child Sci (2020) 10:187–95. doi: 10.1055/s-0040-1718896
2. Blüher M, Mantzoros CS. From leptin to other adipokines in health and disease: facts and expectations at the beginning of the 21st century. Metabolism (2015) 64(1):131–45. doi: 10.1016/j.metabol.2014.10.016
3. Coelho M, Oliveira T, Fernandes R. Biochemistry of adipose tissue: an endocrine organ. Arch Med Sci (2013) 9(2):191–200. doi: 10.5114/aoms.2013.33181
4. Booth A, Magnuson A, Fouts J, Foster M. Adipose tissue: an endocrine organ playing a role in metabolic regulation. Horm Mol Biol Clin Investig (2016) 26(1):25–42. doi: 10.1515/hmbci-2015-0073
5. Hui HX, Feng T. Adipose tissue as an endocrine organ. London: IntechOpen (2018). doi: 10.5772/intechopen.76220
6. Zakharova I, Klimov L, Kuryaninova V, Nikitina I, Malyavskaya S, Dolbnya S, et al. Vitamin d insufficiency in overweight and obese children and adolescents. Front Endocrinol (Lausanne) (2019) 1:103(10). doi: 10.3389/fendo.2019.00103
7. Gharib AF, El Askary A, Almehmadi M, Elsawy WE, Allam HH, Elsayyad LK, et al. Association of vitamin d deficiency and inflammatory cytokines with the clinicopathological features of breast cancer in female Saudi patients. Eur J Inflammation (2022) 20:1–23. doi: 10.1177/1721727X221106507
8. Szymczak-Pajor I, Miazek K, Selmi A, Balcerczyk A, Śliwińska A. The action of vitamin d in adipose tissue: is there the link between vitamin d deficiency and adipose tissue-related metabolic disorders? Int J Mol Sci (2022) 23(2):956. doi: 10.3390/ijms23020956
9. Pecoraro L, Nisi F, Serafin A, Antoniazzi F, Dalle Carbonare L, Piacentini G, et al. Vitamin d supplementation in the assessment of cardiovascular risk factors in overweight and obese children. Med Sci (Basel) (2022) 10(3):49. doi: 10.3390/medsci10030049
10. Kelishadi R, Salek S, Salek M, Hashemipour M, Movahedian M. Effects of vitamin d supplementation on insulin resistance and cardiometabolic risk factors in children with metabolic syndrome: a triple-masked controlled trial. J Pediatr (Rio J) (2014) 90(1):28–34. doi: 10.1016/j.jped.2013.06.006
11. Nader NS, Aguirre Castaneda R, Wallace J, Singh R, Weaver A, Kumar S. Effect of vitamin D3 supplementation on serum 25(OH)D, lipids and markers of insulin resistance in obese adolescents: a prospective, randomized, placebo-controlled pilot trial. Horm Res Paediatr (2014) 82(2):107–12. doi: 10.1159/000362449
12. Reyman M, Verrijn Stuart AN, van Summeren M, Rakhshandehroo M, Nuboer R, de Boer FK, et al. Vitamin d deficiency in childhood obesity is associated with high levels of circulating inflammatory mediators, and low insulin sensitivity. Int J Obes (Lond) (2014) 38(1):46–52. doi: 10.1038/ijo.2013.75
13. Nassar SZ, Badae NM. Protective effect of vitamin d supplementation in a rat modal of preeclampsia: a possible implication of chemerin. Hypertens Pregnancy (2019) 38(3):149–56. doi: 10.1080/10641955.2019.1597108
14. Said AA, Moursi SMM. Vitamin d supplementation reduces serum chemerin level in gestational diabetes mellitus rat model. Med J Cairo Univ (2019) 87(5):3069–80. doi: 10.21608/mjcu.2019.59509
15. Buechler C, Feder S, Haberl EM, Aslanidis C. Chemerin isoforms and activity in obesity. Int J Mol Sci (2019) 20(5):1128. doi: 10.3390/ijms20051128
16. Yu M, Yang Y, Huang C, Ge L, Xue L, Xiao Z, et al. Chemerin: a functional adipokine in reproductive health and diseases. Biomedicines (2022) 10(8):1910. doi: 10.3390/biomedicines10081910
17. Muruganandan S, Sinal CJ. The impact of bone marrow adipocytes on osteoblast and osteoclast differentiation. IUBMB Life (2014) 66:147–55. doi: 10.1002/iub.1254
18. Zdanowicz K, Bobrus-Chociej A, Lebensztejn DM. Chemerin as potential biomarker in pediatric diseases: a PRISMA-compliant study. Biomedicines (2022) 10(3):591. doi: 10.3390/biomedicines10030591
19. Goralski KB, McCarthy TC, Hanniman EA, Zabel BA, Butcher EC, Parlee SD, et al. Chemerin, a novel adipokine that regulates adipogenesis and adipocyte metabolism. J Biol Chem (2007) 282(38):28175–188. doi: 10.1074/jbc.M700793200
20. Zabel BA, Kwitniewski M, Banas M, Zabieglo K, Murzyn K, Cichy J. Chemerin regulation and role in host defense. Am J Clin Exp Immunol (2014) 3(1):1–19.
21. Acewicz M, Kasacka I. Chemerin activity in selected pathological states of human body - a systematic review. Adv Med Sci (2021) 66(2):270–8. doi: 10.1016/j.advms.2021.05.002
22. Su X, Cheng Y, Zhang G, Wang B. Chemerin in inflammatory diseases. Clin Chim Acta (2021) 517:41–7. doi: 10.1016/j.cca.2021.02.010
23. Treeck O, Buechler C, Ortmann O. Chemerin and cancer. Int J Mol Sci (2019) 20(15):3750. doi: 10.3390/ijms20153750
24. Shin WJ, Zabel BA, Pachynski RK. Mechanisms and functions of chemerin in cancer: potential roles in therapeutic intervention. Front Immunol (2018) 9:2772. doi: 10.3389/fimmu.2018.02772
25. Niklowitz P, Rothermel J, Lass N, Barth A, Reinehr T. Link between chemerin, central obesity, and parameters of the metabolic syndrome: findings from a longitudinal study in obese children participating in a lifestyle intervention. Int J Obes (Lond) (2018) 42(10):1743–52. doi: 10.1038/s41366-018-0157-3
26. Ba HJ, Xu LL, Qin YZ, Chen HS. Serum chemerin levels correlate with determinants of metabolic syndrome in obese children and adolescents. Clin Med Insights Pediatr (2019) 5(13):1179556519853780. doi: 10.1177/1179556519853780
27. Sledzińska M, Szlagatys-Sidorkiewicz A, Brzezinski M, Kaźmierska K, Sledziński T, Kamińska B. Serum chemerin in children with excess body weight may be associated with ongoing metabolic complications - a pilot study. Adv Med Sci (2017) 62(2):383–6. doi: 10.1016/j.advms.2017.04.002
28. Rourke JL, Dranse HJ, Sinal CJ. Towards an integrative approach to understanding the role of chemerin in human health and disease. Obes Rev (2013) 14(3):245–62. doi: 10.1111/obr.12009
29. Maghsoudi Z, Kelishadi R, Hosseinzadeh-Attar MJ. Association of chemerin levels with anthropometric indexes and c-reactive protein in obese and non-obese adolescents. ARYA Atheroscler (2015) 11(Suppl 1):102–8.
30. Menzel J, Biemann R, Aleksandrova K, Schulze MB, Boeing H, Isermann B, et al. The cross-sectional association between chemerin and bone health in peri/pre and postmenopausal women: results from the EPIC-potsdam study. Menopause (2018) 25(5):574–8. doi: 10.1097/GME.0000000000001041
31. Muruganandan S, Roman AA, Sinal CJ. Role of chemerin/CMKLR1 signaling in adipogenesis and osteoblastogenesis of bone marrow stem cells. J Bone Miner Res (2010) 25:222–34. doi: 10.1359/jbmr.091106
32. Muruganandan S, Dranse HJ, Rourke JL, McMullen NM, Sinal CJ. Chemerin neutralization blocks hematopoietic stem cell osteoclastogenesis. Stem Cells (2013) 31:2172–82. doi: 10.1002/stem.1450
33. Shi L, Mao C, Wang X, Liu R, Li L, Mou X, et al. Association of chemerin levels and bone mineral density in Chinese obese postmenopausal women. Med (Baltimore) (2016) 95(35):e4583. doi: 10.1097/MD.0000000000004583
34. Jiang XY, Wang Q, Zhang Y, Chen Y, Wu LF. Association of high serum chemerin with bone mineral density loss and osteoporotic fracture in elderly Chinese women. Int J Womens Health (2022) 2(14):107–18. doi: 10.2147/IJWH.S337985
35. Ostrowska Z, Morawiecka-Pietrzak M, Pluskiewicz W, Świętochowska E, Strzelczyk J, Gołąbek K, et al. The relationship between chemerin, bone metabolism, the RANKL/RANK/OPG system, and bone mineral density in girls with anorexia nervosa. Endokrynol Pol (2022) 73(1):26–34. doi: 10.5603/EP.a2021.0103
36. Rusiníska A, Płudowski P, Walczak M, Borszewska-Kornacka MK, Bossowski A, Chlebna-Sokoíł D, et al. Vitamin d supplementation guidelines for general population and groups at risk of vitamin d deficiency in Poland - recommendations of the polish society of pediatric endocrinology and diabetes and the expert panel with participation of national specialist consultants and representatives of scientific societies-2018 update. Front Endocrinol (Lausanne) (2018) 9:246. doi: 10.3389/fendo.2018.00246
37. Slaughter MH, Lohman TG, Boileau RA, Horswill CA, Stillman RJ, Van Loan MD, et al. Skinfold equations for estimation of body fatness in children and youth. Hum Biol (1988) 60(5):709–23.
38. Kułaga Z, Litwin M, Tkaczyk M, Palczewska I, Zajączkowska M, Zwolińska D, et al. Polish 2010 growth references for school-aged children and adolescents. Eur J Pediatr (2011) 170(5):599–609. doi: 10.1007/s00431-010-1329-x
39. Cole TJ. The LMS method for constructing normalized growth standards. Eur J Clin Nutr (1990) 44(1):45–60.
40. Physical status: the use and interpretation of anthropometry. report of a WHO expert committee. World Health Organ Tech Rep Ser (1995) 854:1–452.
41. Szapary PO, Bloedon LT, Samaha FF, Duffy D, Wolfe ML, Soffer D, et al. Effects of pioglitazone on lipoproteins, inflammatory markers, and adipokines in nondiabetic patients with metabolic syndrome. Arterioscler Thromb Vasc Biol (2006) 26(1):182–8. doi: 10.1161/01.ATV.0000195790.24531.4f
42. Kwiterovich PO Jr. Recognition and management of dyslipidemia in children and adolescents. J Clin Endocrinol Metab (2008) 93(11):4200–9. doi: 10.1210/jc.2008-1270
43. Fiamenghi VI, Mello ED. Vitamin d deficiency in children and adolescents with obesity: a meta-analysis. J Pediatr (Rio J) (2021) 97(3):273–9. doi: 10.1016/j.jped.2020.08.006
44. Hamza RT, Elkabbany ZA, Shedid AM, Hamed AI, Ebrahim AO. Serum chemerin in obese children and adolescents before and after l-carnitine therapy: relation to nonalcoholic fatty liver disease and other features of metabolic syndrome. Arch Med Res (2016) 47(7):541–9. doi: 10.1016/j.arcmed.2016.11.010
45. Rowicka G, Dyląg H, Chełchowska M, Weker H, Ambroszkiewicz J. Serum calprotectin and chemerin concentrations as markers of low-grade inflammation in prepubertal children with obesity. Int J Environ Res Public Health (2020) 17(20):7575. doi: 10.3390/ijerph17207575
46. Nassar MF, Emam EK, Allam MF. Is there a benefit of vitamin d supplementation in deficient children and adolescents suffering from obesity? a meta-analysis. Glob Pediatr Health (2021) 8:2333794X211018352. doi: 10.1177/2333794X211018352
47. Peterson CA. Vitamin d deficiency and childhood obesity: interactions, implications, and recommendations. Nutr Diet Suppl (2015) 7:29–39. doi: 10.2147/NDS.S52024
48. Delvin E, Lambert M, Levy E, O’Loughlin J, Mark S, Gray-Donald K, et al. Vitamin d status is modestly associated with glycemia and indicators of lipid metabolism in French-Canadian children and adolescents. J Nutr (2010) 140(5):987–91. doi: 10.3945/jn.109.112250
49. Buyukinan M, Ozen S, Kokkun S, Saz EU. The relation of vitamin d deficiency with puberty and insulin resistance in obese children and adolescents. J Pediatr Endocrinol Metab (2012) 25(1-2):83–7. doi: 10.1515/jpem-2011-0426
50. Khadgawat R, Thomas T, Gahlot M, Tandon N, Tangpricha V, Khandelwal D, et al. The effect of puberty on interaction between vitamin d status and insulin resistance in obese Asian-Indian children. Int J Endocrinol (2012) 2012:173581. doi: 10.1155/2012/173581
51. Olson ML, Maalouf NM, Oden JD, White PC, Hutchison MR. Vitamin d deficiency in obese children and its relationship to glucose homeostasis. J Clin Endocrinol Metab (2012) 97(1):279–85. doi: 10.1210/jc.2011-1507
52. Corica D, Zusi C, Olivieri F, Marigliano M, Piona C, Fornari E, et al. Vitamin d affects insulin sensitivity and β-cell function in obese non-diabetic youths. Eur J Endocrinol (2019) 181(4):439–40. doi: 10.1530/EJE-19-0369
53. Pires LV, González-Gil EM, Anguita-Ruiz A, Bueno G, Gil-Campos M, Vázquez-Cobela R, et al. The vitamin d decrease in children with obesity is associated with the development of insulin resistance during puberty: the PUBMEP study. Nutrients (2021) 13(12):4488. doi: 10.3390/nu13124488
54. Peterson CA, Tosh AK, Belenchia AM. Vitamin d insufficiency and insulin resistance in obese adolescents. Ther Adv Endocrinol Metab (2014) 5(6):166–89. doi: 10.1177/2042018814547205
55. Bornstedt ME, Gjerlaugsen N, Pepaj M, Bredahl MKL, Thorsby PM. Vitamin d increases glucose stimulated insulin secretion from insulin producing beta cells (INS1E). Int J Endocrinol Metab (2019) 17(1):e74255. doi: 10.5812/ijem.74255
56. Szymczak-Pajor I, Drzewoski J, Śliwińska A. The molecular mechanisms by which vitamin d prevents insulin resistance and associated disorders. Int J Mol Sci (2020) 21(18):6644. doi: 10.3390/ijms21186644
57. Jago R, Harrell JS, McMurray RG, Edelstein S, El Ghormli L, Bassin S. Prevalence of abnormal lipid and blood pressure values among an ethnically diverse population of eighth-grade adolescents and screening implications. Pediatrics (2006) 117(6):2065–73. doi: 10.1542/peds.2005-1716
58. Chung ST, Katz LEL, Stettler-Davis N, Shults J, Sherman A, Ha J, et al. The relationship between lipoproteins and insulin sensitivity in youth with obesity and abnormal glucose tolerance. J Clin Endocrinol Metab (2022) 107(6):1541–51. doi: 10.1210/clinem/dgac113
59. Holland WL, Bikman BT, Wang LP, Yuguang G, Sargent KM, Bulchand S, et al. Lipid-induced insulin resistance mediated by the proinflammatory receptor TLR4 requires saturated fatty acid-induced ceramide biosynthesis in mice. J Clin Invest (2011) 121(5):1858–70. doi: 10.1172/JCI43378
60. Erol M, Bostan Gayret Ö, Hamilçıkan Ş, Can E, Yiğit ÖL Vitamin d deficiency and insulin resistance as risk factors for dyslipidemia in obese children. Arch Argent Pediatr (2017) 115(2):133–9. doi: 10.5546/aap.2017.eng.133
61. Wang L, Wang H, Wen H, Tao H, Zhao X. Relationship between HOMA-IR and serum vitamin d in Chinese children and adolescents. J Pediatr Endocrinol Metab (2016) 29(7):777–81. doi: 10.1515/jpem-2015-0422
62. Rusconi RE, De Cosmi V, Gianluca G, Giavoli C, Agostoni C. Vitamin d insufficiency in obese children and relation with lipid profile. Int J Food Sci Nutr (2015) 66(2):132–4. doi: 10.3109/09637486.2014.959902
63. Kim MR, Jeong SJ. Relationship between vitamin d level and lipid profile in non-obese children. Metabolites (2019) 9(7):125. doi: 10.3390/metabo9070125
64. Rodríguez-Rodríguez E, Aparicio A, Andrés P, Ortega RM. Moderate vitamin d deficiency and inflammation related markers in overweight/obese schoolchildren. Int J Vitam Nutr Res (2014) 84(1-2):98–107. doi: 10.1024/0300-9831/a000197
65. Krajewska M, Witkowska-Sędek E, Rumińska M, Stelmaszczyk-Emmel A, Sobol M, Majcher A, et al. Vitamin d effects on selected anti-inflammatory and pro-inflammatory markers of obesity-related chronic inflammation. Front Endocrinol (Lausanne) (2022) 13:920340. doi: 10.3389/fendo.2022.920340
66. Bellia A, Garcovich C, D'Adamo M, Lombardo M, Tesauro M, Donadel G, et al. Serum 25-hydroxyvitamin d levels are inversely associated with systemic inflammation in severe obese subjects. Intern Emerg Med (2013) 8(1):33–40. doi: 10.1007/s11739-011-0559-x
67. Isnuwardana R, Bijukchhe S, Thadanipon K, Ingsathit A, Thakkinstian A. Association between vitamin d and uric acid in adults: a systematic review and meta-analysis. Horm Metab Res (2020) 52(10):732–41. doi: 10.1055/a-1240-5850
68. Wojcik M, Janus D, Kalicka-Kasperczyk A, Sztefko K, Starzyk JB. The potential impact of the hypovitaminosis d on metabolic complications in obese adolescents - preliminary results. Ann Agric Environ Med (2017) 24(4):636–9. doi: 10.5604/12321966.1230676
69. Reis JP, von Mühlen D, Miller ER III, Michos ED, Appel LJ. Vitamin d status and cardiometabolic risk factors in the united states adolescent population. Pediatrics (2009) 124(3):e371–9. doi: 10.1542/peds.2009-0213
70. Cediel G, Corvalán C, López de Romaña D, Mericq V, Uauy R. Prepubertal adiposity, vitamin d status, and insulin resistance. Pediatrics (2016) 138(1):e20160076. doi: 10.1542/peds.2016-0076
71. Saneifard H, Shakiba M, Sheikhy A, Baniadam L, Abdollah Gorji F, Fallahzadeh A. Vitamin d deficiency in children and adolescents: role of puberty and obesity on vitamin d status. Nutr Metab Insights (2021) 14:11786388211018726. doi: 10.1177/11786388211018726
72. Albanesi C, Scarponi C, Pallotta S, Daniele R, Bosisio D, Madonna S, et al. Chemerin expression marks early psoriatic skin lesions and correlates with plasmacytoid dendritic cell recruitment. J Exp Med (2009) 206(1):249–58. doi: 10.1084/jem.20080129
73. Marti A, Martínez I, Ojeda-Rodríguez A, Azcona-Sanjulian MC. Higher lipopolysaccharide binding protein and chemerin concentrations were associated with metabolic syndrome features in pediatric subjects with abdominal obesity during a lifestyle intervention. Nutrients (2021) 13(2):289. doi: 10.3390/nu13020289
74. Chakaroun R, Raschpichler M, Klöting N, Oberbach A, Flehming G, Kern M, et al. Effects of weight loss and exercise on chemerin serum concentrations and adipose tissue expression in human obesity. Metabolism (2012) 61(5):706–14. doi: 10.1016/j.metabol.2011.10.008
75. Liu M, Lin X, Wang X. Decrease in serum chemerin through aerobic exercise plus dieting and its association with mitigation of cardio-metabolic risk in obese female adolescents. J Pediatr Endocrinol Metab (2018) 31(2):127–35. doi: 10.1515/jpem-2017-0431
76. Ress C, Tschoner A, Engl J, Klaus A, Tilg H, Ebenbichler CF, et al. Effect of bariatric surgery on circulating chemerin levels. Eur J Clin Invest. (2010) 40(3):277–80. doi: 10.1111/j.1365-2362.2010.02255.x
77. Saremi A, Shavandi N, Parastesh M, Daneshmand H. Twelve-week aerobic training decreases chemerin level and improves cardiometabolic risk factors in overweight and obese men. Asian J Sports Med (2010) 1(3):151–8. doi: 10.5812/asjsm.34860
78. Gad SS, Shora HA, Abdelwahab A, Abdou RM, Abdel Raouf BM, Elmikaty HA, et al. Chemerin, IL-18 and IL-1 beta as biomarkers of metabolic syndrome in Egyptian obese children. ASMS (2022) 6(7):66–7. doi: 10.31080/ASMS.2022.06.1310
Keywords: obesity, children, vitamin D, chemerin, C-reactive protein, glucose, insulin, lipid profile
Citation: Krajewska M, Witkowska-Sędek E, Rumińska M, Kucharska AM, Stelmaszczyk-Emmel A, Sobol M, Majcher A and Pyrżak B (2023) The link between vitamin D, chemerin and metabolic profile in overweight and obese children - preliminary results. Front. Endocrinol. 14:1143755. doi: 10.3389/fendo.2023.1143755
Received: 13 January 2023; Accepted: 06 April 2023;
Published: 20 April 2023.
Edited by:
Dénes Molnár, University of Pécs, HungaryReviewed by:
Elzbieta Petriczko, Pomeranian Medical University, PolandSemra Çaglar Çetinkaya, University of Health Sciences, Türkiye
Copyright © 2023 Krajewska, Witkowska-Sędek, Rumińska, Kucharska, Stelmaszczyk-Emmel, Sobol, Majcher and Pyrżak. This is an open-access article distributed under the terms of the Creative Commons Attribution License (CC BY). The use, distribution or reproduction in other forums is permitted, provided the original author(s) and the copyright owner(s) are credited and that the original publication in this journal is cited, in accordance with accepted academic practice. No use, distribution or reproduction is permitted which does not comply with these terms.
*Correspondence: Maria Krajewska, bWtyYWpld3NrYUB3dW0uZWR1LnBs