 Mengwen Xia
 Fulong Song2
 Yongfeng Zhao
 Yongzhi Xie
 Yafei Wen
 Ping Zhou
94% of researchers rate our articles as excellent or good
Learn more about the work of our research integrity team to safeguard the quality of each article we publish.
Find out more
ORIGINAL RESEARCH article
Front. Endocrinol., 12 May 2023
Sec. Thyroid Endocrinology
Volume 14 - 2023 | https://doi.org/10.3389/fendo.2023.1140816
This article is part of the Research TopicThyroid Nodule Evaluation: Current, Evolving, and Emerging ToolsView all 16 articles
Objectives: To compare ultrasonography (US) feature-based radiomics and computer-aided diagnosis (CAD) models for predicting malignancy in thyroid nodules, and to evaluate their utility for thyroid nodule management.
Methods: This prospective study included 262 thyroid nodules obtained between January 2022 and June 2022. All nodules previously underwent standardized US image acquisition, and the nature of the nodules was confirmed by the pathological results. The CAD model exploited two vertical US images of the thyroid nodule to differentiate the lesions. The least absolute shrinkage and operator algorithm (LASSO) was applied to choose radiomics features with excellent predictive properties for building a radiomics model. Ultimately, the area under the receiver operating characteristic curve (AUC) and calibration curves were assessed to compare diagnostic performance between the models. DeLong’s test was used to analyze the difference between groups. Both models were used to revise the American College of Radiology Thyroid Imaging Reporting and Data Systems (ACR TI-RADS) to provide biopsy recommendations, and their performance was compared with the original recommendations.
Results: Of the 262 thyroid nodules, 157 were malignant, and the remaining 105 were benign. The diagnostic performance of radiomics, CAD, and ACR TI-RADS models had an AUC of 0.915 (95% confidence interval (CI): 0.881–0.947), 0.814 (95% CI: 0.766–0.863), and 0.849 (95% CI: 0.804–0.894), respectively. DeLong’s test showed a statistically significant between the AUC values of models (p < 0.05). Calibration curves showed good agreement in each model. When both models were applied to revise the ACR TI-RADS, our recommendations significantly improved the performance. The revised recommendations based on radiomics and CAD showed an increased sensitivity, accuracy, positive predictive value, and negative predictive value, and decreased unnecessary fine-needle aspiration rates. Furthermore, the radiomics model’s improvement scale was more pronounced (33.3–16.7% vs. 33.3–9.7%).
Conclusion: The radiomics strategy and CAD system showed good diagnostic performance for discriminating thyroid nodules and could be used to optimize the ACR TI-RADS recommendation, which successfully reduces unnecessary biopsies, especially in the radiomics model.
Thyroid nodules are common but often asymptomatic, and guidelines strongly recommend that all patients with known or suspected thyroid nodules undergo thyroid ultrasonography (US) with a survey of the cervical lymph nodes (1). With the widespread use of high-frequency US, the prevalence of thyroid nodules has been reported to be as high as 68%, with a higher proportion among populations with iodine deficiency and the elderly (2). The management of thyroid nodules has shown increased clinical importance due to the high incidence of nodules and soaring healthcare costs. However, operator-specific expertise and the inability to quantify image features frequently restrict the sensitivity and specificity of US diagnoses, which results in a lack of consistency and objectivity (3).
With the presentation and application of various risk-stratification systems, such as the Thyroid Imaging Reporting and Data System released by the American College of Radiology (ACR TI-RADS), standardized terminology has gradually been used to describe the appearance of thyroid nodules (4, 5). US has become a primary diagnostic tool used for the final classification of thyroid nodules and can help in decision-making regarding the use of fine-needle aspiration (FNA). However, due to the subjectivity, diversity, and overlapping risk features between the benign and malignant nodules, data on the interobserver agreement are weak (6).
Recent advances in technology have shown superiority in the differentiation of thyroid nodules. The use of computer-aided diagnosis (CAD) systems in the diagnosis of thyroid nodules seems to be a promising tool (7). Several artificial intelligence tools are commercially available that have received Food and Drug Association approval, such as S-detect, AmCAD-UT, Koios DS, and Medo Thyroid. Previous studies have shown that S-detect could provide second objective decision-making support via a semiautomated workflow in differentiating thyroid nodules from US images and reducing the rate of missed diagnoses (8–12). S-detect technology has been iterated several times, and can now identify calcification as an important clue. More recently, a new analysis method called radiomics, which is based on data science, quantifies the characteristics of lesions in medical images to extract a significant number of phenotypic features (13, 14). To our best knowledge, no published study has compared the accuracy of radiomics and CAD systems based on US features in the prediction of thyroid cancer for thyroid nodule management.
Therefore, this study aimed to prospectively evaluate the diagnostic efficiency of benign and malignant thyroid nodules using the US-based radiomics analysis method and CAD system while exploring their potential complementary role to ACR management recommendations.
This study was approved by the ethical review committee of the Third Xiangya Hospital of Central South University, and written informed consent was obtained from all patients before they received examinations. Patients and data were collected prospectively randomized and double-blinded by a tertiary hospital.
A total of 301 thyroid nodules from 179 consecutive patients who had undergone regular preoperative gray-scale US imaging of thyroid nodules with clear images and had obtained a pathological diagnosis by FNA or surgical resection for lesions within 2 weeks were included at our institution between January 2022 and June 2022. Among the 301 thyroid nodules, 39 were excluded due to the following reasons (1): biopsy or local treatment before US (n =23) (2); other cancers (n = 2) (3); poor image quality or ill-defined pathological results (n = 8); and (4) multiple nodules could not be conclusively correlated in US images with pathological diagnosis (n = 6). Finally, this study included 148 patients in total with 262 thyroid nodules. Figure 1 shows the flowchart of this study population. The final diagnosis was based on FNA or surgical histopathology.
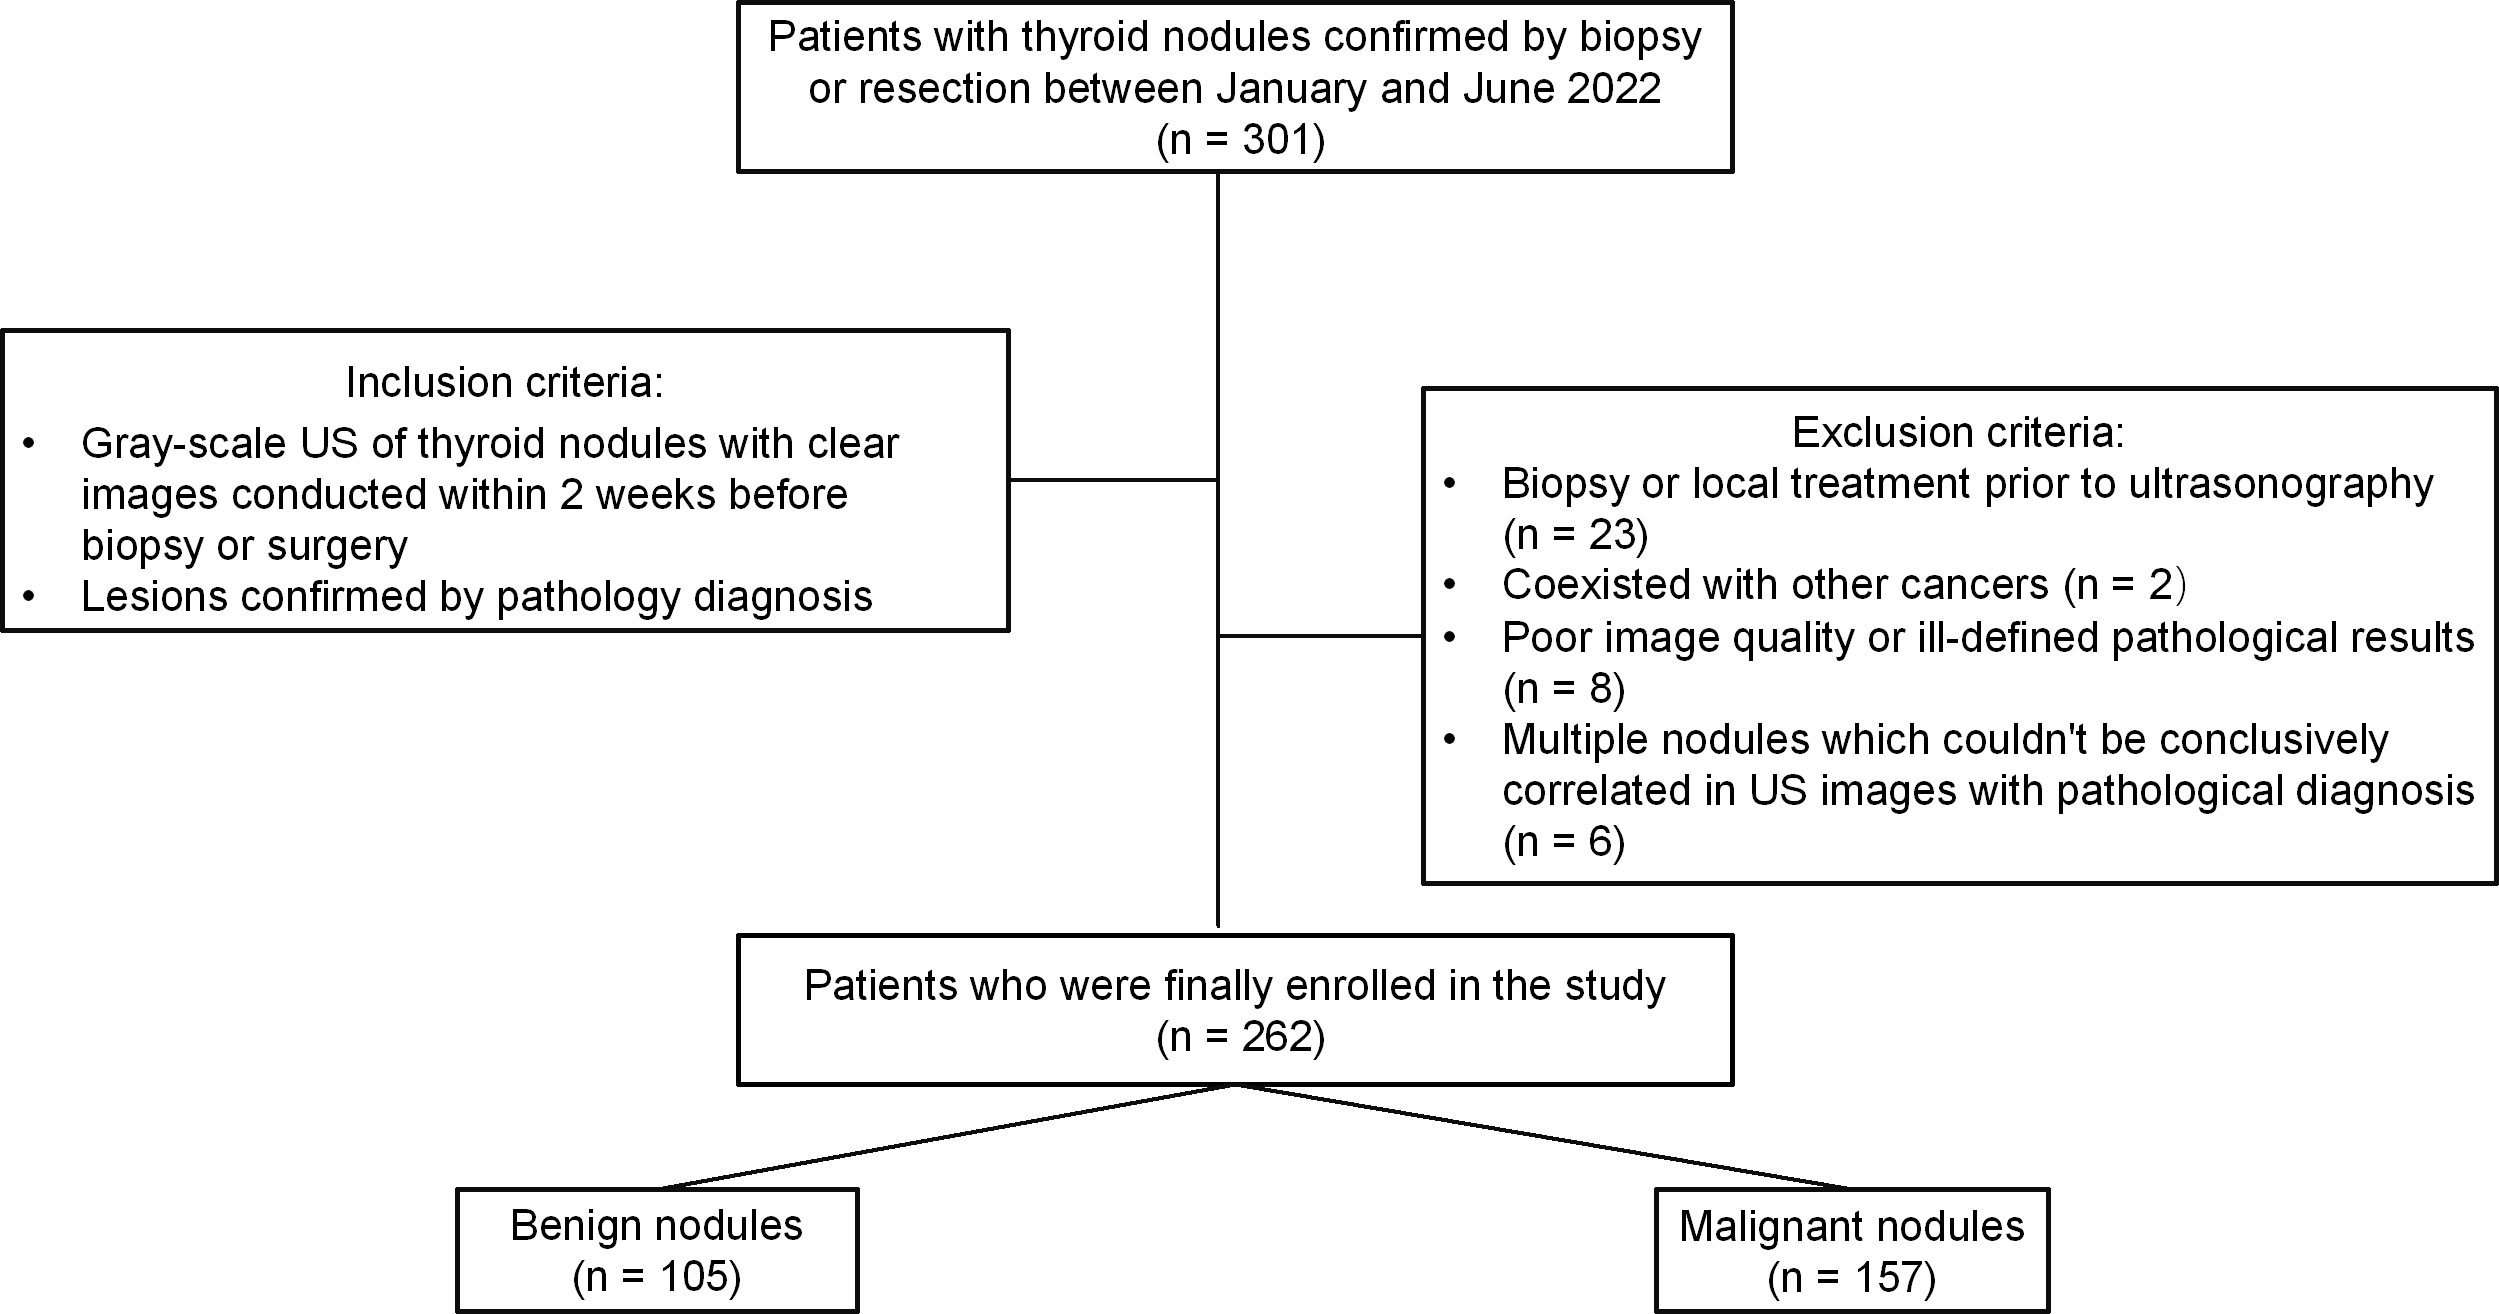
Figure 1 Flowchart of the study population.
All US examinations were performed with Hera W10 (Samsung Medison) and a real-time CAD US system (S-Detect for Thyroid; Samsung Medison) using a 3–12 MHz linear probe. A senior trained radiologist with 25 years of experience in thyroid imaging independently performed all US examinations and numbered the nodules. Meanwhile, the thyroid nodule’s largest segment (longitudinal section) and its vertical section (transverse section) were measured for further image annotation.
The same sonologist analyzed CAD data with S-Detect on transverse and longitudinal sections immediately after image acquisition. After manually confirming the location of the lesion, the software automatically segmented the mass contours. The operator manually readjusted the outline if the contour border was dissatisfactory. The software analyzed US features of the lesion, including composition, echogenicity, orientation, margins, shape, calcifications, and spongiform appearance (8). Finally, S-Detect provided the diagnosis as “possibly benign” or “possibly malignant” in dichotomy form (Figure 2). In addition, if the assessments of two vertical sections were inconsistent, the malignant result was regarded as final.
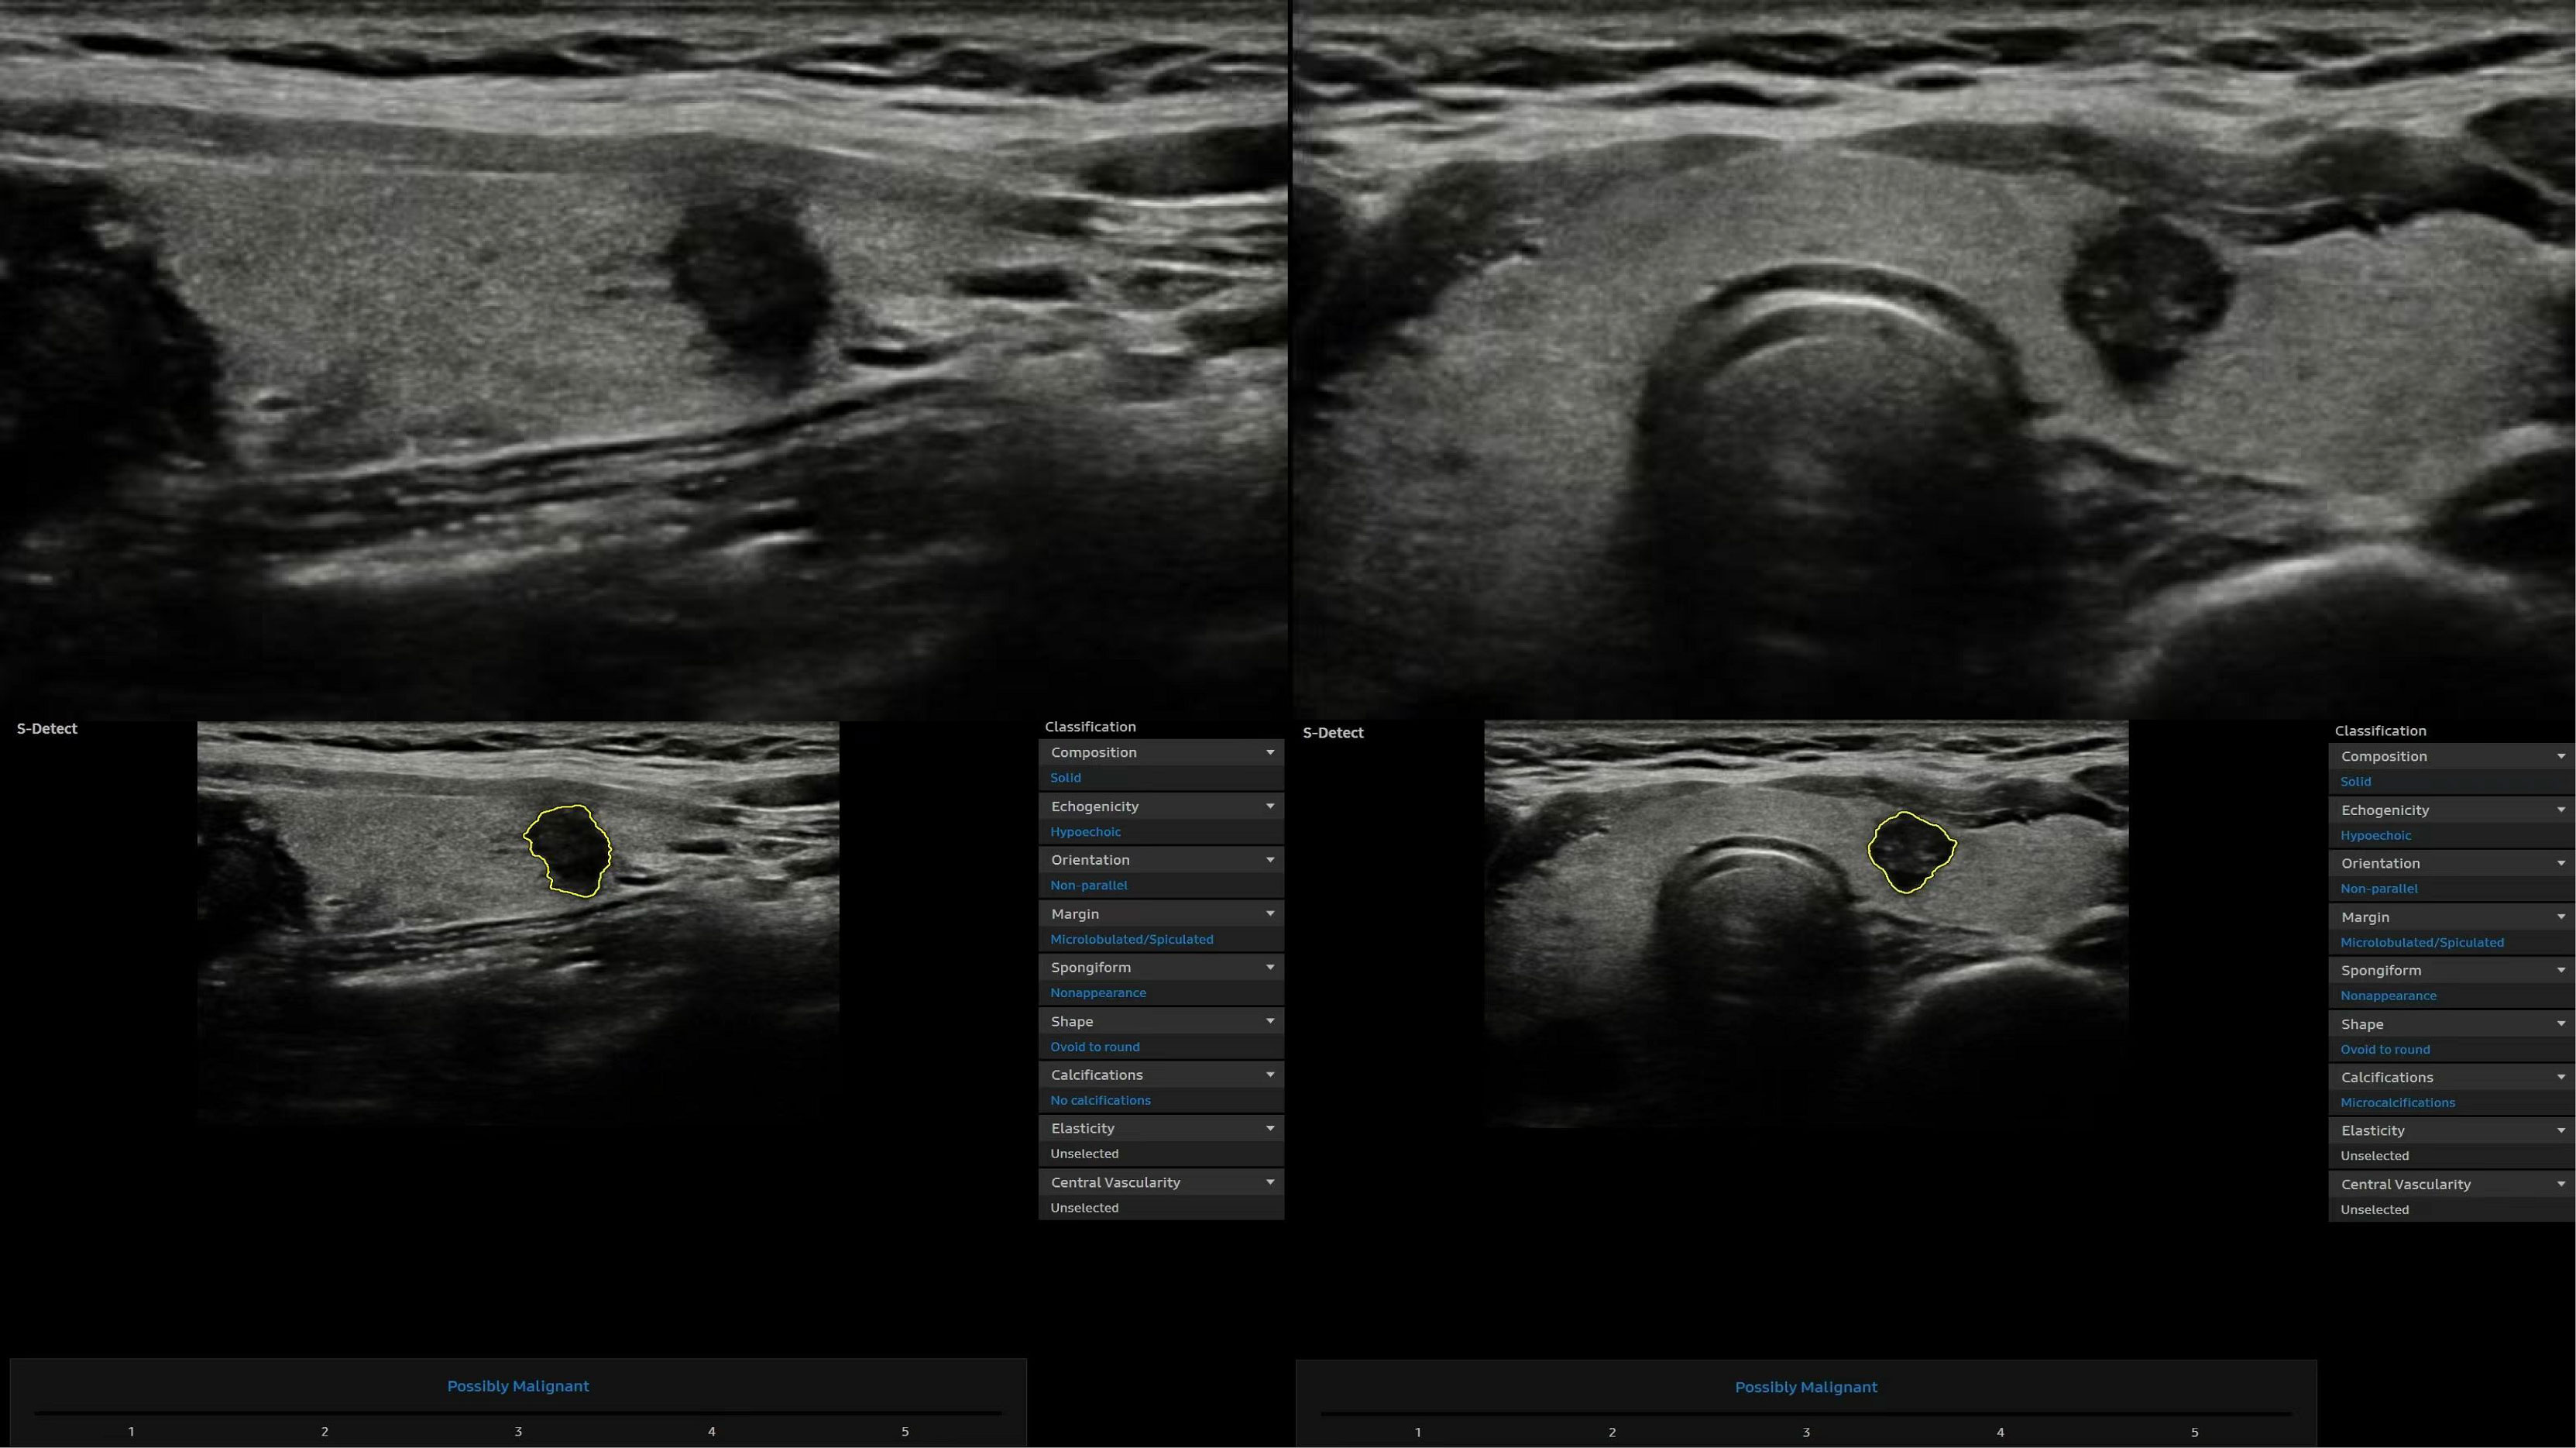
Figure 2 Representative thyroid nodule images were acquired with the computer-aided diagnosis (CAD) system.
Sonograms were independently evaluated by an experienced senior thyroid imaging expert with 20 years of experience who was blinded to the pathological result according to ACR TI-RADS for composition, echogenicity, shape, margin, and echogenic foci (1). The reader independently assigned features of every nodule for the five ACR TI-RADS categories. Ultimately, all nodules had feature assignments, resulting in point assignments and corresponding TI-RADS risk classifications for each nodule.
Without any knowledge of the other results, two radiologists (3 and 5 years of experience in thyroid imaging) independently performed the follow-up radiomics analysis. After normalizing the grayscale and voxels, the regions of interest (ROIs) were performed by a 3D Slicer (https://www.slicer.org/) (software version 5.0.2) to manually segment the thyroid nodules on the image in the transverse and longitudinal section. Operators were trained to segment ROIs before the study began. Intra-observer and inter-observer consistency was evaluated with a random cohort of 30 nodules segmented by one of the operators. One month after the first lesion segmentation, two operators completed the re-segmentation of this cohort image. The intraclass correlation coefficient (ICC) was used to assess the reproducibility and robustness of lesion segmentation and feature extraction.
A total of 837 candidate radiomics features were extracted from each ROI using the plug-in “PyRadiomics” package in 3D-Slicer, including features from first-order statistics, gray level co-occurrence matrix (GLCM), gray level dependence matrix (GLDM), gray level run length matrix (GLRLM), gray level size zone matrix (GLSZM), and neighborhood gray level different matrix (NGTDM). All radiomics features were standardized by Z-score transformation to strengthen the data comparability and reduce bias. We only included features with a good agreement (ICC > 0.75). The univariate logistic analysis was performed after the results were obtained to include the features with p < 0.10 for further study. Subsequently, the least absolute shrinkage and operator (LASSO) method was used to select radiomics features with excellent predictive properties.
S-Detect is a more interactive CAD system based on a specific deep learning algorithm: a convolutional neural network. Deep learning is an intricate multi-layer neural network architecture consisting of input, hidden, and output layers. S-Detect can realize precise decisions and identify benign and malignant nodules by learning a large amount of training data, extracting high-order statistics, and optimizing the balance of input and output data through many hidden layers (15, 16).
The Rad-Score (radiomics score) for each lesion was computed based on the estimated weighting coefficient of the selected features on each transverse and longitudinal section. Then, the radiomics model was ultimately constructed using this Rad-Score. Moreover, the nomogram was developed by radiomics labels to quantify the possibility of malignancy risk and evaluate high- and low-grade thyroid nodules.
We used the area under the receiver operating characteristic curves (AUCs) and calibration curves to evaluate the performance among the models and the senior radiologist in discriminating between benign and malignant nodules.
Based on the nodule’s level and maximum diameter, ACR TI-RADS offers three recommendations: no biopsy, US follow-up, or biopsy (4). Both models had binary outputs of high and low malignant risks, and the results were used to upgrade or downgrade ACR TI-RADS management recommendations to explore the possibility of reducing unnecessary biopsies. More specifically, if our assessment indicated a high risk of malignancy, an upgrade was performed, such as no biopsy to follow-up or follow-up to FNA, or FNA remained unchanged; otherwise, when nodules were classified as low risk, we downgraded recommendations. Ultimately, we compared the diagnostic performance of the new risk stratification model with the original ACR TI-RADS recommendations.
The continuous variables were described with the median (interquartile range), and categorical variables were presented as frequencies or percentages. The Student’s t-test, chi-square test, and Fisher’s exact test were used for the univariate statistical analysis, as appropriate. The AUCs with 95% confidence intervals (CIs) were calculated to assess model performance for classifying benign and malignant thyroid nodules. DeLong’s test was employed to analyze between-group differences. Model calibration performance was assessed using calibration curves.
Additionally, the diagnostic value of the management recommendation was evaluated by calculating sensitivity, specificity, positive predictive value (PPV), negative predictive value (NPV), accuracy, and unnecessary FNA rates (no biopsy and follow-up were considered negative, and the biopsy was positive). We applied the maximum Youden index (sensitivity + specificity − 1) as the optimal cutoff value of the radiomics model to dichotomize all nodules into two groups (high and low risk of malignancy, similar to the CAD model) for discussing potential complementary roles to the ACR guidelines.
Statistical analyses were conducted using the SPSS for Windows version 25.0 (IBM Corporation) and R statistical software version 4.1.30 (R Foundation for Statistical Computing; https://r-project.org). A two-tailed p value < 0.05 was regarded as statistically significant.
Of the 262 thyroid nodules with complete imaging data and confirmed pathological diagnoses from 148 unique patients (median age, 43 years, 202 women), 157 (59.9%) were malignant, while the remaining 105 (40.1%) were benign (Table 1). Patients of the malignant group were younger and malignant nodules were significantly smaller than benign nodules (p < 0.001). There were statistical differences in the ACR TI-RADS level in this cohort. (p < 0.001).
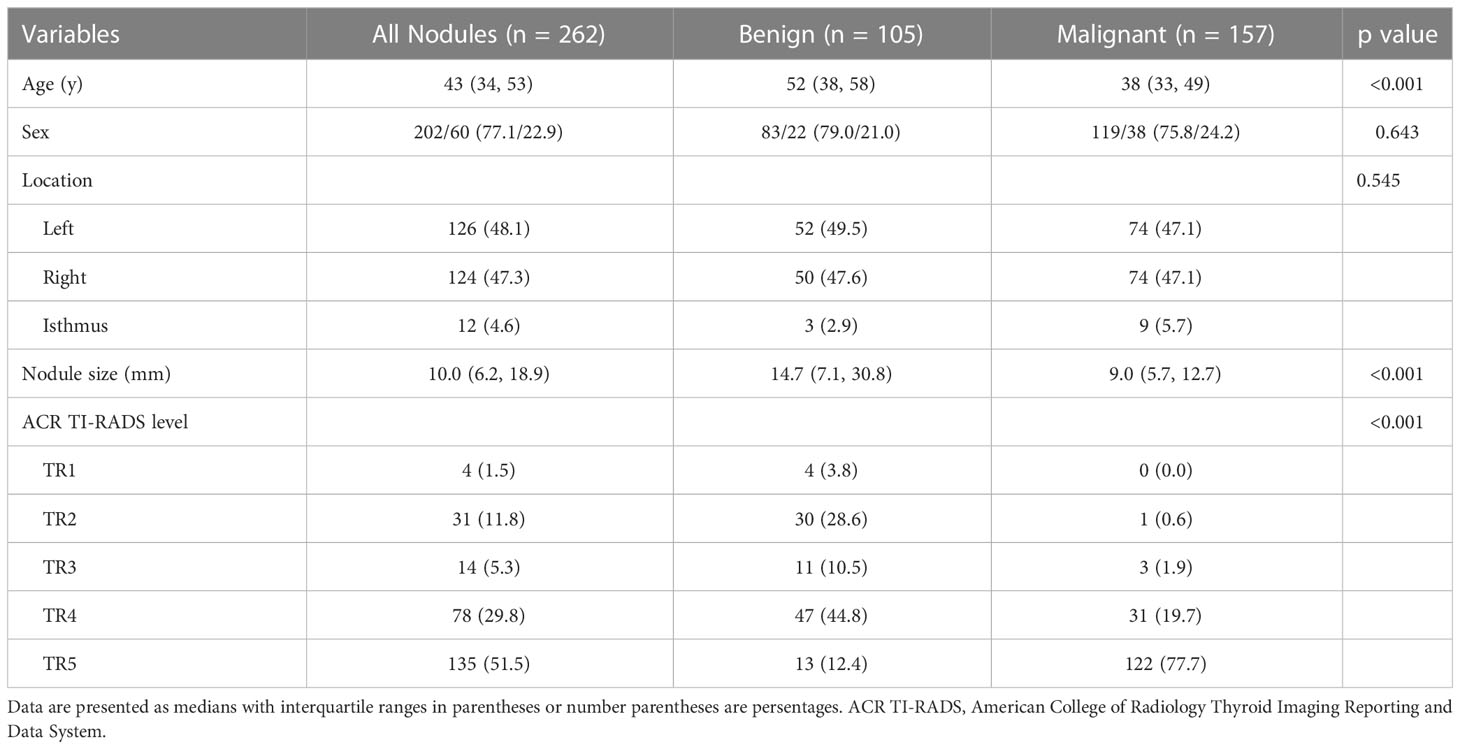
Table 1 Patient demographics and nodule characteristics (stratified by pathologic diagnosis).
Figure 3 demonstrates the receiver operating characteristic (ROC) curves of three models for discriminating malignant and benign nodules. The AUCs of the radiomics, ACR TI-RADS, and CAD models were 0.915 (95% confidence interval (CI): 0.881–0.947), 0.849 (95% CI: 0.804–0.894), and 0.814 (95% CI: 0.766–0.863), respectively, as shown in Table 2. Compared with the senior radiologist, the CAD model had a higher sensitivity, and our radiomics model tended towards a higher AUC. The comparative results showed that the radiomics model yielded a higher performance than the ACR TI-RADS and CAD models, and DeLong’s test showed that the differences were statistically significant (p = 0.004, p < 0.001, respectively).
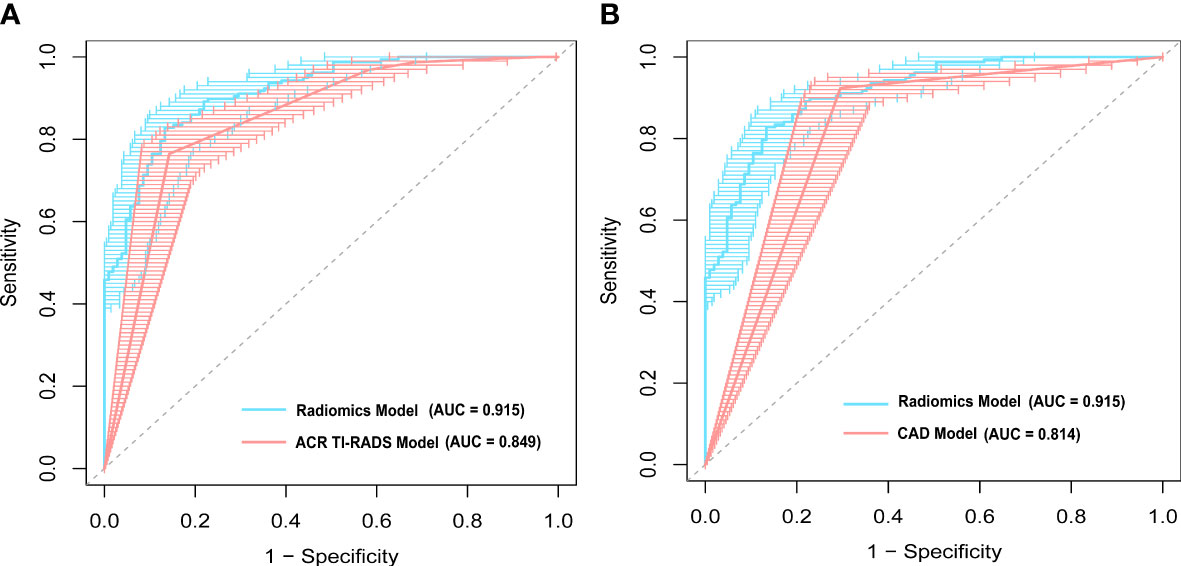
Figure 3 A comparison of receiver operating characteristic (ROC) curves between the radiomics model and (A) the American College of Radiology Thyroid Imaging Reporting and Data Systems (ACR TI-RADS) model, and (B) computer-aided diagnosis (CAD) model. The area under the ROC curve (AUC) was 0.915 for the radiomics model, which was significantly higher than that of the ACR TI-RADS (p = 0.004) and CAD models (p < 0.001).
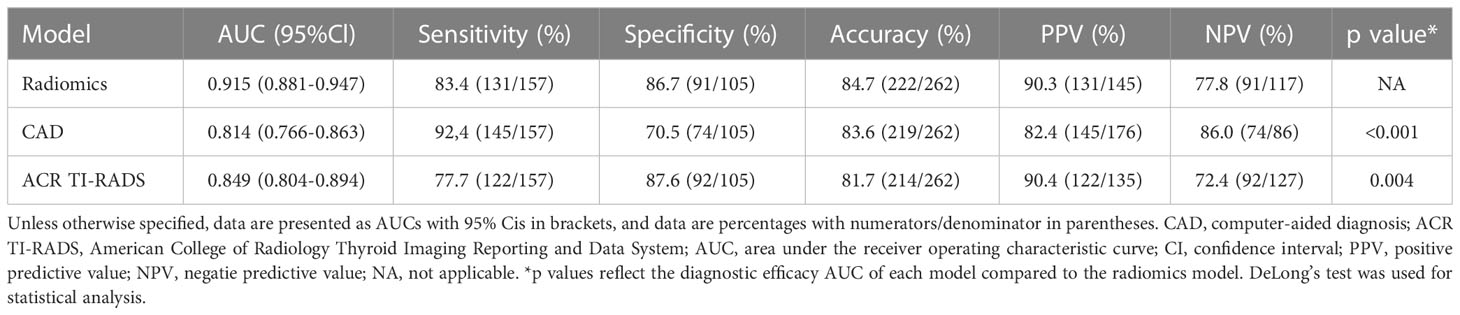
Table 2 Diagnostic performances comparison of the radiomics, CAD, and ACR TI-RADS models for thyroiuds nodules.
In the radiomics model (Supplementary Material), the two variables, transverse and longitudinal radiomics label scores of thyroid nodules, that were statistically significant in the univariate statistical tests were entered into the model, and then applied to construct the nomogram (Figure 4A). In this visualization, each nodule could obtain predicted risk values for thyroid nodules by summing the scores for each variable. According to the ROC curve, the optimal cutoff value for the “risk of malignant nodules” was 0.656.
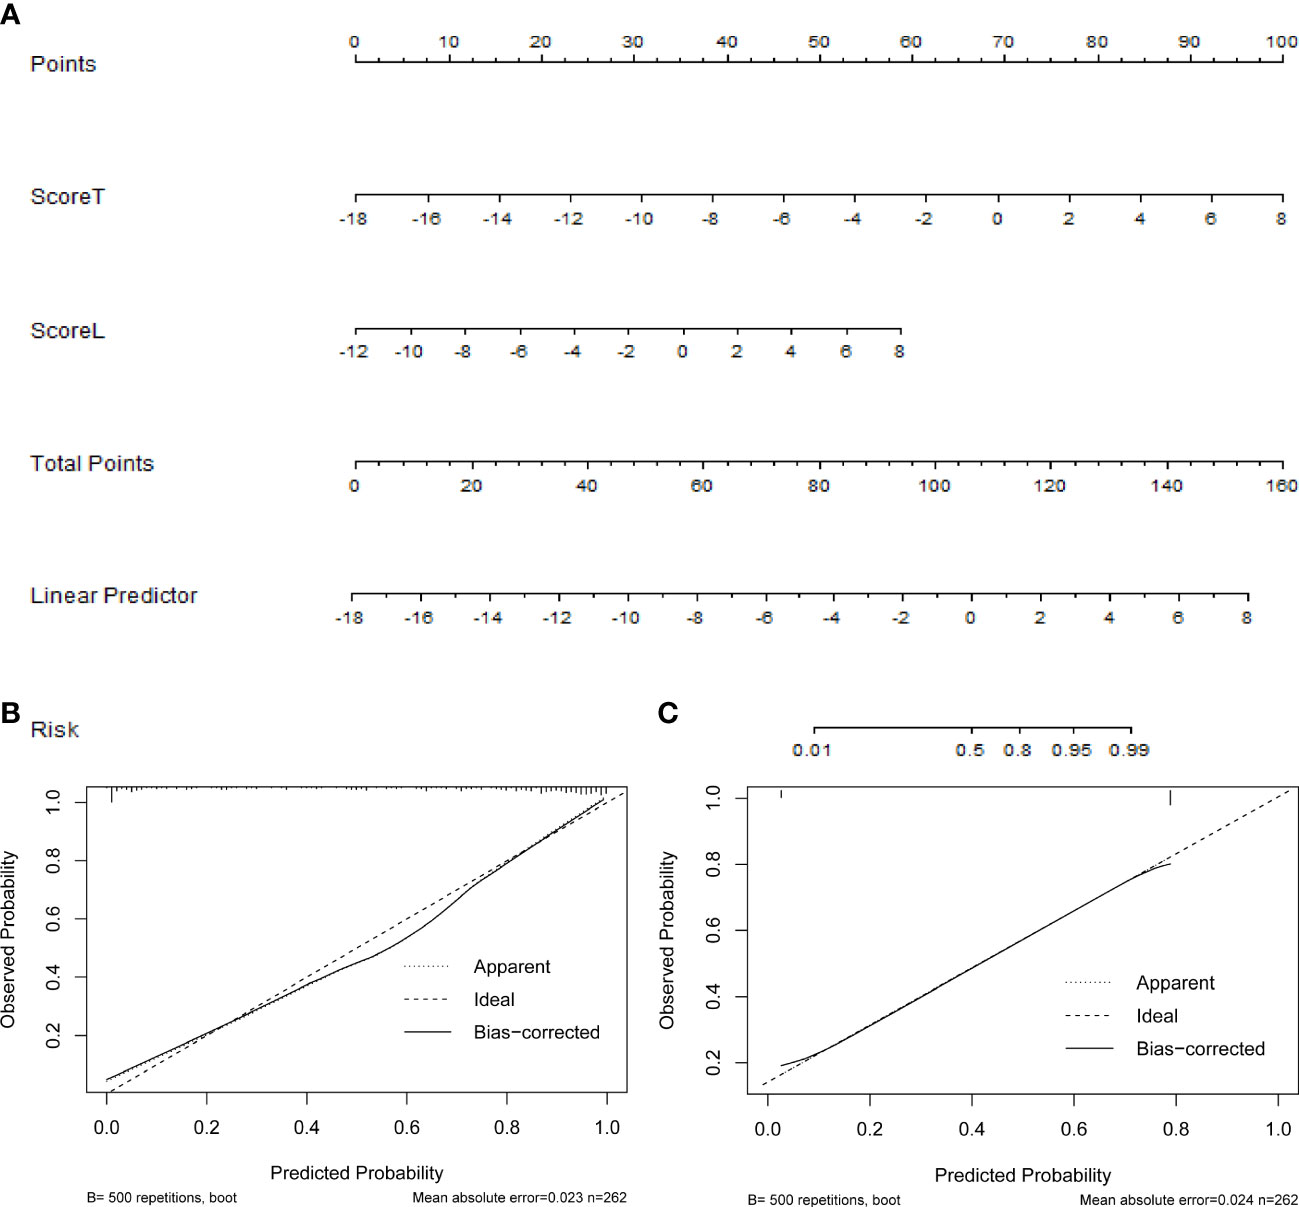
Figure 4 (A) The nomogram based on the radiomics model, the calibration curves of (B) the radiomics, and (C) computer-aided diagnosis (CAD) models.
Figures 4B, C show the calibration curves of the radiomics and CAD models for predicting thyroid nodules, which illustrates that both models have good agreement between the observed and predicted values.
The original ACR TI-RADS management recommendations categorized 87 nodules as FNA, and 58 of them were malignant. When both models were applied to revise the ACR TI-RADS, our risk stratifications significantly improved the performance. Specifically, the CAD model resulted in the downgrading of 54 nodules (29 from biopsy to follow-up), whereas 118 were upgraded (116 from follow-up to biopsy), and the radiomics model resulted in the downgrading of 83 nodules (39 from biopsy to follow-up), whereas the reassigning from biopsy to follow-up occurred for 97 nodules (Table 3). However, 12 malignant thyroid nodules were missed in the revised CAD model, and 26 tumors were missed in the revised radiomic model. Table 4 shows the diagnostic performance of the original ACR TI-RADS and our revised risk stratification system. Compared with the ACR guidelines, both revised CAD and radiomics recommendations have impressive diagnostic performance, such as higher sensitivity, accuracy, PPV, and NPV, and decreased unnecessary FNA rates. In addition, the improvement scale of the radiomics model in the unnecessary FNA rates was more pronounced (33.3–16.7% vs. 33.3–9.7%). From the perspective of reducing missed diagnoses, the CAD model combined with TI-RADS is more effective.
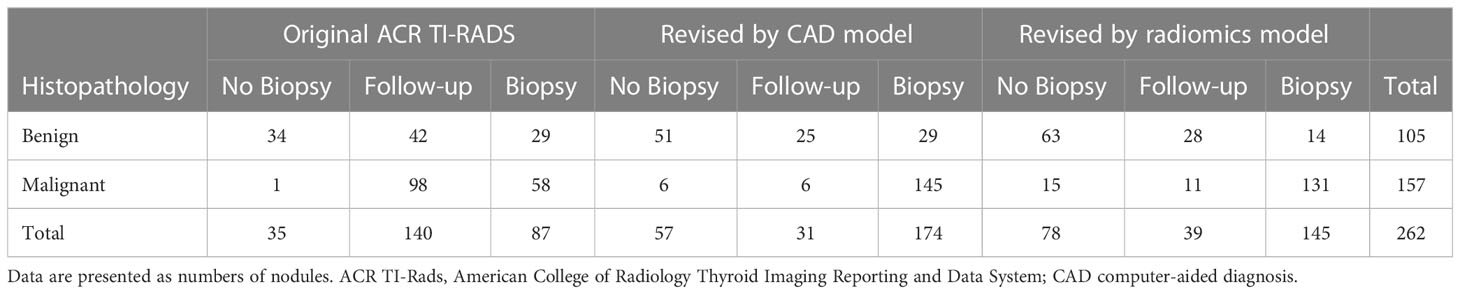
Table 3 Distribution of ACR TI-RADS guidelines revised by our models.

Table 4 The effects compared among original ACR TI-RADS management recommendations and revised diagnoses based on our models.
In this study, we found that the radiomics model presented with a significantly higher diagnostic accuracy for predicting the malignancy risk of thyroid nodules compared with the CAD model (p < 0.001) and a senior radiologist (p = 0.004), while the CAD model showed a higher sensitivity (92.4 vs. 83.4, 77.7%). In addition, we applied our systems to revise the ACR TI-RADS management recommendations, especially the radiomics model, successfully optimizing its performance and reducing unnecessary biopsies.
Our study had some unique characteristics. First, in contrast to most previous studies using the retrospective radiomics strategy, we adopted a prospective design process in which a senior radiologist acquired images and applied strict quality control, thus making all high-quality images more standardized. Second, most S-detect-related studies developed models solely on the transverse section of the lesion for analysis (8, 9, 11, 12). The largest segment (longitudinal section) and its vertical section (transverse section) were chosen in our study to increase the lesion characteristics and reduce the impact of subjective factors. Additionally, the radiomics features of a thyroid nodule were separately extracted from two objective vertical US images, which may provide more detailed information and reflect the tumor heterogeneity.
Radiomics is widely recognized as an important method for medical image analysis in oncology research (17). In this study, we developed a radiomics model for the differentiation of thyroid nodules and constructed a nomogram using the radiomics label. Our model was established through the logistic regression approach, which is the most commonly used supervised learning model in US radiomics (18). The application of radiomics showed adequate diagnostic performance in predicting the malignancy of thyroid nodules with an AUC of 0.915, which was consistent with previously reported studies (19–21). Several studies have reported that the CAD system is a promising approach for solving practical difficulties in clinical diagnosis (8–12, 22). Eun et al. (23) reported a high sensitivity of up to 88.6% and suggested that the CAD system could be useful as decision-making support to rule out cancer. In this study, we also found that the CAD system had a high sensitivity (92.4%) and accuracy (83.6%). The thyroid CAD system used in this study was integrated into the US system, which enabled the use of CAD system in real-time clinical practice. Furthermore, a real-time second opinion on the decision for the necessity of FNA is possible with the present system. Due to its simplicity and reduced analysis time, this system would be simpler to apply in routine practice (8). Therefore, we concluded that the CAD system could reduce the time required for the interpretation process of thyroid nodules and diagnose them as benign or malignant, making it a simple system to screen thyroid nodules for high sensitivity. The radiomics and CAD models constructed in our study showed good robustness and also illustrated the strong generalization ability of our method.
The ACR TI-RADS is based on an expert consensus, literature review, and partial analysis of the database of proven nodules; its core objective is to focus on clinically significant thyroid cancers and reduce the FNA of benign nodules (4). Wildman et al. (7) used genetic algorithms to improve the performance of artificial intelligence TI-RADS by optimization of the points assigned to each TI-RADS feature, which can validate the ACR TI-RADS while improving specificity and maintaining sensitivity. In our study, we attempted to explore the potential complementary role of radiomics and CAD models to ACR TI-RADS Risk Stratification for thyroid nodule management; the results showed that both models could provide additional gains in performance, especially in terms of sensitivity and accuracy (Table 4). Notably, both revised models successfully reduced unnecessary biopsies compared with the ACR TI-RADS, especially the radiomics model. This may support that the radiomics strategy can capture information that is beyond visual interpretation and interpret heterogeneity within lesions. Using quantitative information on radiomics features could be more effective as a complementary tool to management recommendations. On the other hand, although the S-detect model is based on a deep learning algorithm generated using a large database, the algorithm relies on the quality of the annotated US image features, which will inevitably depend on the reader’s experience. In addition, the deep learning method may suffer from possible over-fitting. In summary, we recommended that radiologists appropriately optimize the ACR TI-RADS risk stratification system with the assistance of new technologies.
Our study had several limitations. First, this study did not include any large-scale test datasets to validate. Thus, it will be necessary to conduct a more stringent internal and external validation with a larger sample size representing the screening population. Second, this study only used static vertical section images. In future studies, model evaluation using cine clips that include the entire thyroid nodule and surrounding thyroid parenchyma may be necessary to avoid losing the risk features for malignancy. Third, thyroid nodules have various histological subtypes with different molecular mechanisms, grades of malignancy, clinical aggressiveness, and imaging appearances (24). The low occurrence rate of non-papillary carcinoma determines a relatively low percentage in our study. Future efforts will be warranted to include a larger sample size with varied pathological types to further enhance the generalizability and performance.
In conclusion, our study provides evidence that the radiomics strategy and CAD system both have the potential to predict malignancy in thyroid nodules and suggests a simple method to optimize the ACR TI-RADS recommendation. This approach finds the potential complementary roles of both models to the guidelines, which can more precisely help in the classification of thyroid nodules and successfully reduce unnecessary biopsies, especially the radiomics model, which is recommended due to its lower unnecessary FNA rates.
The raw data supporting the conclusions of this article will be made available by the authors, without undue reservation.
The studies involving human participants were reviewed and approved by the ethical review committee of the Third Xiangya Hospital of Central South University. Written informed consent to participate in this study was provided by the participants’ legal guardian/next of kin. Written informed consent was obtained from the individual(s), and minor(s)’ legal guardian/next of kin, for the publication of any potentially identifiable images or data included in this article.
MX designed the research, analyzed, and drafting of the manuscript. FS contributed to the analysis and provided statistical advice for this manuscript. PZ collected data and reviewed the manuscript. YZ and YW analyzed data. YX provided instructive advice and supervision. All authors contributed to the article and approved the submitted version.
This study has received funding from the National Natural Science Foundation of China (No. 81871367), the Natural Science Foundation of Hunan Province, China (No. 2021JJ31037 and No. 2022JJ30894), and the Project of Hunan Provincial Health Commission (No. 202209025123).
Thanks to all members of the Department of Thyroid Surgery, The Third Xiangya Hospital of Central South University for their support in the manuscript preparation.
The authors declare that the research was conducted in the absence of any commercial or financial relationships that could be construed as a potential conflict of interest.
All claims expressed in this article are solely those of the authors and do not necessarily represent those of their affiliated organizations, or those of the publisher, the editors and the reviewers. Any product that may be evaluated in this article, or claim that may be made by its manufacturer, is not guaranteed or endorsed by the publisher.
The Supplementary Material for this article can be found online at: https://www.frontiersin.org/articles/10.3389/fendo.2023.1140816/full#supplementary-material
1. Haugen BR, Alexander EK, Bible KC, Doherty GM, Mandel SJ, Nikiforov YE, et al. 2015 American Thyroid association management guidelines for adult patients with thyroid nodules and differentiated thyroid cancer: the American thyroid association guidelines task force on thyroid nodules and differentiated thyroid cancer. Thyroid (2016) 26(1):1–133. doi: 10.1089/thy.2015.0020
2. Guth S, Theune U, Aberle J, Galach A, Bamberger CM. Very high prevalence of thyroid nodules detected by high frequency (13 mhz) ultrasound examination. Eur J Clin Invest (2009) 39(8):699–706. doi: 10.1111/j.1365-2362.2009.02162.x
3. Ko SY, Kim EK, Sung JM, Moon HJ, Kwak JY. Diagnostic performance of ultrasound and ultrasound elastography with respect to physician experience. Ultrasound Med Biol (2014) 40(5):854–63. doi: 10.1016/j.ultrasmedbio.2013.10.005
4. Tessler FN, Middleton WD, Grant EG, Hoang JK, Berland LL, Teefey SA, et al. ACR thyroid imaging, reporting and data system (TI-RADS): white paper of the ACR TI-RADS committee. J Am Coll Radiol (2017) 14(5):587–95. doi: 10.1016/j.jacr.2017.01.046
5. Tessler FN, Middleton WD, Grant EG. Thyroid imaging reporting and data system (TI-RADS): a user's guide. Radiology (2018) 287(1):29–36. doi: 10.1148/radiol.2017171240
6. Persichetti A, Di Stasio E, Coccaro C, Graziano F, Bianchini A, Di Donna V, et al. Inter- and intraobserver agreement in the assessment of thyroid nodule ultrasound features and classification systems: a blinded multicenter study. Thyroid (2020) 30(2):237–42. doi: 10.1089/thy.2019.0360
7. Wildman-Tobriner B, Buda M, Hoang JK, Middleton WD, Thayer D, Short RG, et al. Using artificial intelligence to revise ACR TI-RADS risk stratification of thyroid nodules: diagnostic accuracy and utility. Radiology (2019) 292(1):112–9. doi: 10.1148/radiol.2019182128
8. Choi YJ, Baek JH, Park HS, Shim WH, Kim TY, Shong YK, et al. A computer-aided diagnosis system using artificial intelligence for the diagnosis and characterization of thyroid nodules on ultrasound: initial clinical assessment. Thyroid (2017) 27(4):546–52. doi: 10.1089/thy.2016.0372
9. Kim HL, Ha EJ, Han M. Real-world performance of computer-aided diagnosis system for thyroid nodules using ultrasonography. Ultrasound Med Biol (2019) 45(10):2672–8. doi: 10.1016/j.ultrasmedbio.2019.05.032
10. Xia S, Yao J, Zhou W, Dong Y, Xu S, Zhou J, et al. A computer-aided diagnosing system in the evaluation of thyroid nodules-experience in a specialized thyroid center. World J Surg Oncol (2019) 17(1):210. doi: 10.1186/s12957-019-1752-z
11. Barczyński M, Stopa-Barczyńska M, Wojtczak B, Czarniecka A, Konturek A. Clinical validation of s-DetectTm mode in semi-automated ultrasound classification of thyroid lesions in surgical office. Gland Surg (2020) 9(Suppl 2):S77–85. doi: 10.21037/gs.2019.12.23
12. Wei Q, Zeng SE, Wang LP, Yan YJ, Wang T, Xu JW, et al. The value of s-detect in improving the diagnostic performance of radiologists for the differential diagnosis of thyroid nodules. Med Ultrason (2020) 22(4):415–23. doi: 10.11152/mu-2501
13. Arimura H, Soufi M, Kamezawa H, Ninomiya K, Yamada M. Radiomics with artificial intelligence for precision medicine in radiation therapy. J Radiat Res (2019) 60(1):150–7. doi: 10.1093/jrr/rry077
14. Gillies RJ, Kinahan PE, Hricak H. Radiomics: images are more than pictures, they are data. Radiology (2016) 278(2):563–77. doi: 10.1148/radiol.2015151169
15. Zhao C, Xiao M, Jiang Y, Liu H, Wang M, Wang H, et al. Feasibility of computer-assisted diagnosis for breast ultrasound: the results of the diagnostic performance of s-detect from a single center in China. Cancer Manag Res (2019) 11:921–30. doi: 10.2147/cmar.S190966
16. Zhang D, Jiang F, Yin R, Wu GG, Wei Q, Cui XW, et al. A review of the role of the s-detect computer-aided diagnostic ultrasound system in the evaluation of benign and malignant breast and thyroid masses. Med Sci Monit (2021) 27:e931957. doi: 10.12659/msm.931957
17. Limkin EJ, Sun R, Dercle L, Zacharaki EI, Robert C, Reuzé S, et al. Promises and challenges for the implementation of computational medical imaging (Radiomics) in oncology. Ann Oncol (2017) 28(6):1191–206. doi: 10.1093/annonc/mdx034
18. Jiang M, Li C, Tang S, Lv W, Yi A, Wang B, et al. Nomogram based on shear-wave elastography radiomics can improve preoperative cervical lymph node staging for papillary thyroid carcinoma. Thyroid (2020) 30(6):885–97. doi: 10.1089/thy.2019.0780
19. Liang J, Huang X, Hu H, Liu Y, Zhou Q, Cao Q, et al. Predicting malignancy in thyroid nodules: radiomics score versus 2017 American college of radiology thyroid imaging, reporting and data system. Thyroid (2018) 28(8):1024–33. doi: 10.1089/thy.2017.0525
20. Galimzianova A, Siebert SM, Kamaya A, Rubin DL, Desser TS. Quantitative framework for risk stratification of thyroid nodules with ultrasound: a step toward automated triage of thyroid cancer. AJR Am J Roentgenol (2020) 214(4):885–92. doi: 10.2214/ajr.19.21350
21. Park VY, Lee E, Lee HS, Kim HJ, Yoon J, Son J, et al. Combining radiomics with ultrasound-based risk stratification systems for thyroid nodules: an approach for improving performance. Eur Radiol (2021) 31(4):2405–13. doi: 10.1007/s00330-020-07365-9
22. Szczepanek-Parulska E, Wolinski K, Dobruch-Sobczak K, Antosik P, Ostalowska A, Krauze A, et al. S-detect software vs. EU-TIRADS classification: a dual-center validation of diagnostic performance in differentiation of thyroid nodules. J Clin Med (2020) 9(8):2495. doi: 10.3390/jcm9082495
23. Jeong EY, Kim HL, Ha EJ, Park SY, Cho YJ, Han M. Computer-aided diagnosis system for thyroid nodules on ultrasonography: diagnostic performance and reproducibility based on the experience level of operators. Eur Radiol (2019) 29(4):1978–85. doi: 10.1007/s00330-018-5772-9
Keywords: thyroid nodule, radiomics, computer-aided diagnosis, ultrasonography, risk assessment, prediction
Citation: Xia M, Song F, Zhao Y, Xie Y, Wen Y and Zhou P (2023) Ultrasonography-based radiomics and computer-aided diagnosis in thyroid nodule management: performance comparison and clinical strategy optimization. Front. Endocrinol. 14:1140816. doi: 10.3389/fendo.2023.1140816
Received: 09 January 2023; Accepted: 01 May 2023;
Published: 12 May 2023.
Edited by:
Jeffrey Garber, Atrius Health, United StatesReviewed by:
Sina Jasim, Washington University in St. Louis, United StatesCopyright © 2023 Xia, Song, Zhao, Xie, Wen and Zhou. This is an open-access article distributed under the terms of the Creative Commons Attribution License (CC BY). The use, distribution or reproduction in other forums is permitted, provided the original author(s) and the copyright owner(s) are credited and that the original publication in this journal is cited, in accordance with accepted academic practice. No use, distribution or reproduction is permitted which does not comply with these terms.
*Correspondence: Ping Zhou, emhvdXBpbmcxMDAwQGhvdG1haWwuY29t
Disclaimer: All claims expressed in this article are solely those of the authors and do not necessarily represent those of their affiliated organizations, or those of the publisher, the editors and the reviewers. Any product that may be evaluated in this article or claim that may be made by its manufacturer is not guaranteed or endorsed by the publisher.
Research integrity at Frontiers
Learn more about the work of our research integrity team to safeguard the quality of each article we publish.