 Hebatalla Said Ali1*
 Marwa Mostafa Kamel1*
 Sara H. A. Agwa2
 Mohamed S. Abdel Hakeem3Mahmoud Shawky El Meteini4
 Marwa Matboli1*
- 1Medical Biochemistry and Molecular Biology Department, Faculty of Medicine, Ain Shams University, Abbassia, Cairo, Egypt
- 2Clinical Pathology, Medical Ain Shams Research Institute, Ain Shams University, Cairo, Egypt
- 3Institute of Immunology, University of Pennsylvania, Philadelphia, PA, United States
- 4Department of General Surgery, The School of Medicine, University of Ain Shams, Cairo, Egypt
Introduction: Type 2 diabetes mellitus (T2DM) is a major global health concern. It usually develops gradually and is frequently preceded by undetectable pre-diabetes mellitus (pre-DM) stage. The purpose of this study was to identify a novel set of seven candidate genes associated with the pathogenesis of insulin resistance (IR) and pre-DM, followed by their experimental validation in patients’ serum samples.
Methods: We used the bioinformatics tools and through a two-step process, we first identified and verified two mRNA candidate genes linked to insulin resistance molecular pathogenesis. Second, we identified a non-coding RNAs related to the selected mRNAs and implicated in the insulin resistance molecular pathways followed by pilot study for the RNA panel differential expression in 66 patients with T2DM, 49 individuals with prediabetes and 45 matched controls using real time PCR.
Results: The levels of expression of TMEM173 and CHUK mRNAs, hsa-miR (-611, -5192, and -1976) miRNAs gradually increased from the healthy control group to the prediabetic group, reaching their maximum levels in the T2DM group (p <10-3), whereas the levels of expression of RP4-605O3.4 and AC074117.2 lncRNAs declined gradually from the healthy control group to the prediabetic group, reaching their lowest levels in the T2DM group (p <10-3). TMEM173, CHUK mRNAs, hsa_miR (-611 & -1976) and RP4-605O3.4 lncRNA were useful in distinguishing insulin resistant from insulin sensitive groups. miR_611 together with RP4-605O3.4 exhibited significant difference in good versus poor glycemic control groups.
Discussion: The presented study provides an insight about this RNA based STING/NOD/IR associated panel that could be used for PreDM-T2DM diagnosis and also as a therapeutic target based on the differences of its expression level in the pre-DM and T2DM stages.
1 Introduction
Insulin resistance has been identified as a leading cause of major health problems such as diabetes, hyperlipidemia, hypertension, and cardiovascular disease (1, 2). Insulin resistance can begin years before type 2 diabetes mellitus is diagnosed, even before prediabetes is recognized (3). Diabetes mellitus (DM) is a common metabolic condition characterized by hyperglycemia, insulin resistance, and significantly decreased insulin production. In 2021, the International Diabetes Federation estimated that 537 million adults globally have diabetes, and by 2045, this number will increase to 783 million. Diabetes and its consequences were expected to cost 966 billion US dollars in 2021, a 316% rise over the previous 15 years (4). Notably, the MENA region is now identified as an emerging center of the T2DM epidemic. Egypt is one of the 21 IDF MENA region countries and territories with 4.5 million diabetics (5, 6). The major problem is that in the early stages of the disease, most patients do not have specific symptoms, and many cases may present suddenly with serious complications (7).
Prediabetes mellitus (pre-DM) is a metabolic condition preceding T2DM, characterized by higher than normal blood glucose levels but below the diabetes threshold. Globally, the number of individuals with prediabetes is rising; approximately 541 million adults have prediabetes and are at greater risk of developing type 2 diabetes (4). The pre-diabetes mellitus stage is mainly characterized by β-cell dysfunction and insulin resistance, which can exist prior to observable changes in blood glucose levels. It is suggested that the early stages of neuropathy, nephropathy, retinopathy, and macrovascular disease all begin in the pre-DM stage (8, 9).
In recent years, several molecular pathways that are involved in the development of prediabetes and T2DM have gained attention. One such pathway is the alteration of gut microbiota, which is known to play an important role in insulin resistance. Studies have shown that gut microbiota can raise plasma LPS levels and microbial DNA, which in turn aggravate tissue inflammation through the cGAS-STING and NOD-like receptor pathways (10, 11).
The cGAS–STING pathway has recently gained attention as a mediator of inflammation caused by various factors, including infection, cellular stress, and tissue damage because of its ability to detect cellular responses to both microbial and host-derived DNAs (12–14). STING is a transmembrane protein triggered by cytosolic self-derived nucleic acids and is encoded by TMEM173. Most of TMEM173 variants result in JAK/STAT pathway-mediated INF production, which is involved in a variety of inflammatory disorders (15). Additionally, TMEM173 is involved in oxidative stress and autophagy (16), both of which are strongly related to insulin signaling. This suggests that TMEM173 may be involved in the development of diabetes (17). TMEM173 variants were also found in many human diseases such as esophageal squamous cell carcinoma (18), colon cancer (19), lung diseases including familial interstitial lung disease (20), and severe pulmonary fibrosis (21) and drives lethal coagulation in sepsis (22), These findings make TMEM173 a potential therapeutic target for both cancers and inflammatory diseases.
NOD-like receptors (NLRs) have been implicated in a number of human diseases. They play an important role in regulating inflammatory responses by inducing the production of chemokines, cytokines, and antimicrobial genes, which contributes to the development of obesity and T2DM (23). Pathogenic variants in the NLRs have been associated with alteration in the NF-κB signaling pathway, leading to an inability to respond properly. The CHUK gene is a member of the inhibitor of the nuclear factor kappa B kinase complex, encoding for inhibitor-κB kinase α that degrades IκBα and NF-κB inhibitors through phosphorylation, causing activation of NF-κB. CHUK/IKK has also been recognized as a tumor suppressor in multiple human and mouse organs (24). Furthermore, it has been linked to plasma lipid abnormalities, a major risk factor for stroke (25, 26).
Epigenetic dysregulation that could alter the expression of many target genes is another crucial player in insulin resistance and T2DM pathogenesis. Non-coding RNAs (ncRNAs) play an important role in cellular function and disease development. Their up- or downregulation affects glucose homeostasis and is associated with the development of diabetes. They are also associated with poor glycemic control, proinflammation and senescence in T2DM individuals (27). They are found to be good diagnostic biomarkers in several metabolic illnesses such as diabetes, obesity, and non-alcoholic fatty liver disease (NFLD) due to their stability in bodily fluids (28).
Several studies have found involvement and changes in expression of different miRNAs in processes implicated in the pathogenesis of type 2 diabetes (29, 30). MiR-611 is located on chromosome 11q12.2, a region that is commonly altered or amplified in cancer. miR-611 was found to be significantly dysregulated in tongue squamous cell carcinoma and was strongly linked with TNM stage (31). Regarding miR-5192, it was found to be differentially expressed in idiopathic pulmonary fibrosis (32), human breast cancer cells (33), and childhood acute lymphoblastic leukemia (34). miR-1976 is located on 1p36.1; its aberrant expression has been related to the progression of breast cancer (35), and it may also predispose to Parkinson’s disease (36) and function as a predictive biomarker for obesity and weight loss (37).
lncRNAs have gained attention due to a greater understanding of their functional role in both health and disease. The extensive dysregulation of lncRNA expression in a variety of diseases emphasizes their importance as master regulators. Recent study reveals that lncRNAs play a role in disease development; they may affect glucose homeostasis and be associated with development of diabetes, and hence should be evaluated and targeted for therapeutic benefits (38).
Despite the advances in diagnosis and improvement in therapies, T2DM still remains an incurable disease. Increasing attention is focused on understanding the molecular mechanisms (e.g. STING, NOD signaling) that cause IR and complications that starts early in the prediabetes stage. This study aimed to identify novel pre-DM and T2DM related RNA panel that may aid in discrimination of risky pre-diabetes, DM-T2DM, and thus can delay or prevent the development of T2DM complications.
To achieve this objective, we identified a STING/NOD/IR RNA panel consisting of lncRNAs, miRNAs. We integrated differentially expressed mRNA-miRNA interactions with lncRNA-miRNA interactions using in silico data analysis followed by pilot study for the chosen circulatory RNA panel differential expression analysis in pre-diabetes, T2DM, and healthy control by real-time PCR.
2 Results
2.1 Bioinformatics results
The identification of the target genes and pathways followed a specific selection criterion, based mainly on bioinformatics-based selection and other criteria such as Pathway analysis, Relevance to the disease of interest, Functionality, Cost-effectiveness, and Accessibility. These criteria help to ensure that the target genes and pathways selected for the RNA PCR gene expression panel analysis are relevant, well-established, and feasible to measure, which can increase the confidence in the results and the impact of the study.
We used bioinformatics analysis to select candidate mRNA genes which are related to Type 2 DM, insulin resistance signaling, STimulator of Interferon Gene (STING), and NLR signaling pathways from public microarray databases, e.g., National Center of Biotechnology Information GEO (https://www.ncbi.nlm.nih.gov/geo/, available May 2022), Gene atlas expression database (https://www.ebi.ac.uk/gxa/home), and KEGG map (https://www.genome.jp/kegg/) to choose a pathway related to insulin resistance in T2DM and identify the target effector. Search was confined to Homo sapiens species and p-value ≤0.05 was considered statistically significant. Among 156 differentially expressed genes and FDR-adjusted p-value <0.05, We have retrieved a set TMEM173 and CHUK mRNAs according to the following criteria: (i) Genes which are dysregulated in T2DM and insulin resistance molecular pathways; (ii) Genes which are expressed in tissues of interest, e.g., skeletal muscle, adipose tissue and also in blood samples for easy extraction and less invasiveness; (iii) Both genes are related to STING and NLR signaling pathway involved in innate immunity and chronic sterile inflammation; (iv). Gene ontology (GO) enrichment of TMEM173 and CHUK mRNAs were performed using Enrichr (http://amp.pharm.mssm.edu/Enrichr) with p < 0.05 set as the cutoff criterion that verified their correlation to positive regulation of interferon production and kappa beta phosphorylation. TMEM173 and CHUK mRNAs were imported into the Search Tool for the retrieval of interacting genes (STRING; version 11.0; http://stringdb.org) online database for protein–protein interaction (PPI) network building to ensure their link to insulin resistance pathways and previously known genes in T2DM through STRING interaction network. PPI enrichment p-value was 1.6E-05 with combined score 0.943 for CHUK and TMEM173, 0.847. Afterwards, we predicted upstream key miRNAs and lncRNAs using miRWalk 3.0 (http://mirwalk.umm.uni-heidelberg.de/) and DIANA Tools database, which integrate the target prediction of both TargetScan * MiRBase. miRNAs and lncRNAs interaction was predicted by using miRWalk 2.0; miRNA: ncRNA target tool. We found that hsa-miR (-611, -5192, and -1976) can interact with both selected mRNAs with score >0.9 at CDS binding sites. Finally, RP4-605O3.4 and AC074117.2 were identified to be interacting with the chosen miR (-611, -5192, and -1976) and which was confirmed by Clustal Omega tool of The European Bioinformatics Institute based on high complementarity rate between them. Thus, finally, the (TMEM173 and CHUK) - (miR-611, -5192 and-1976) - (RP4-605O3.4 and AC074117.2) regulatory panel was constructed. Detailed bioinformatics are shown in Figure 1 and Supplementary Figures S1–9.
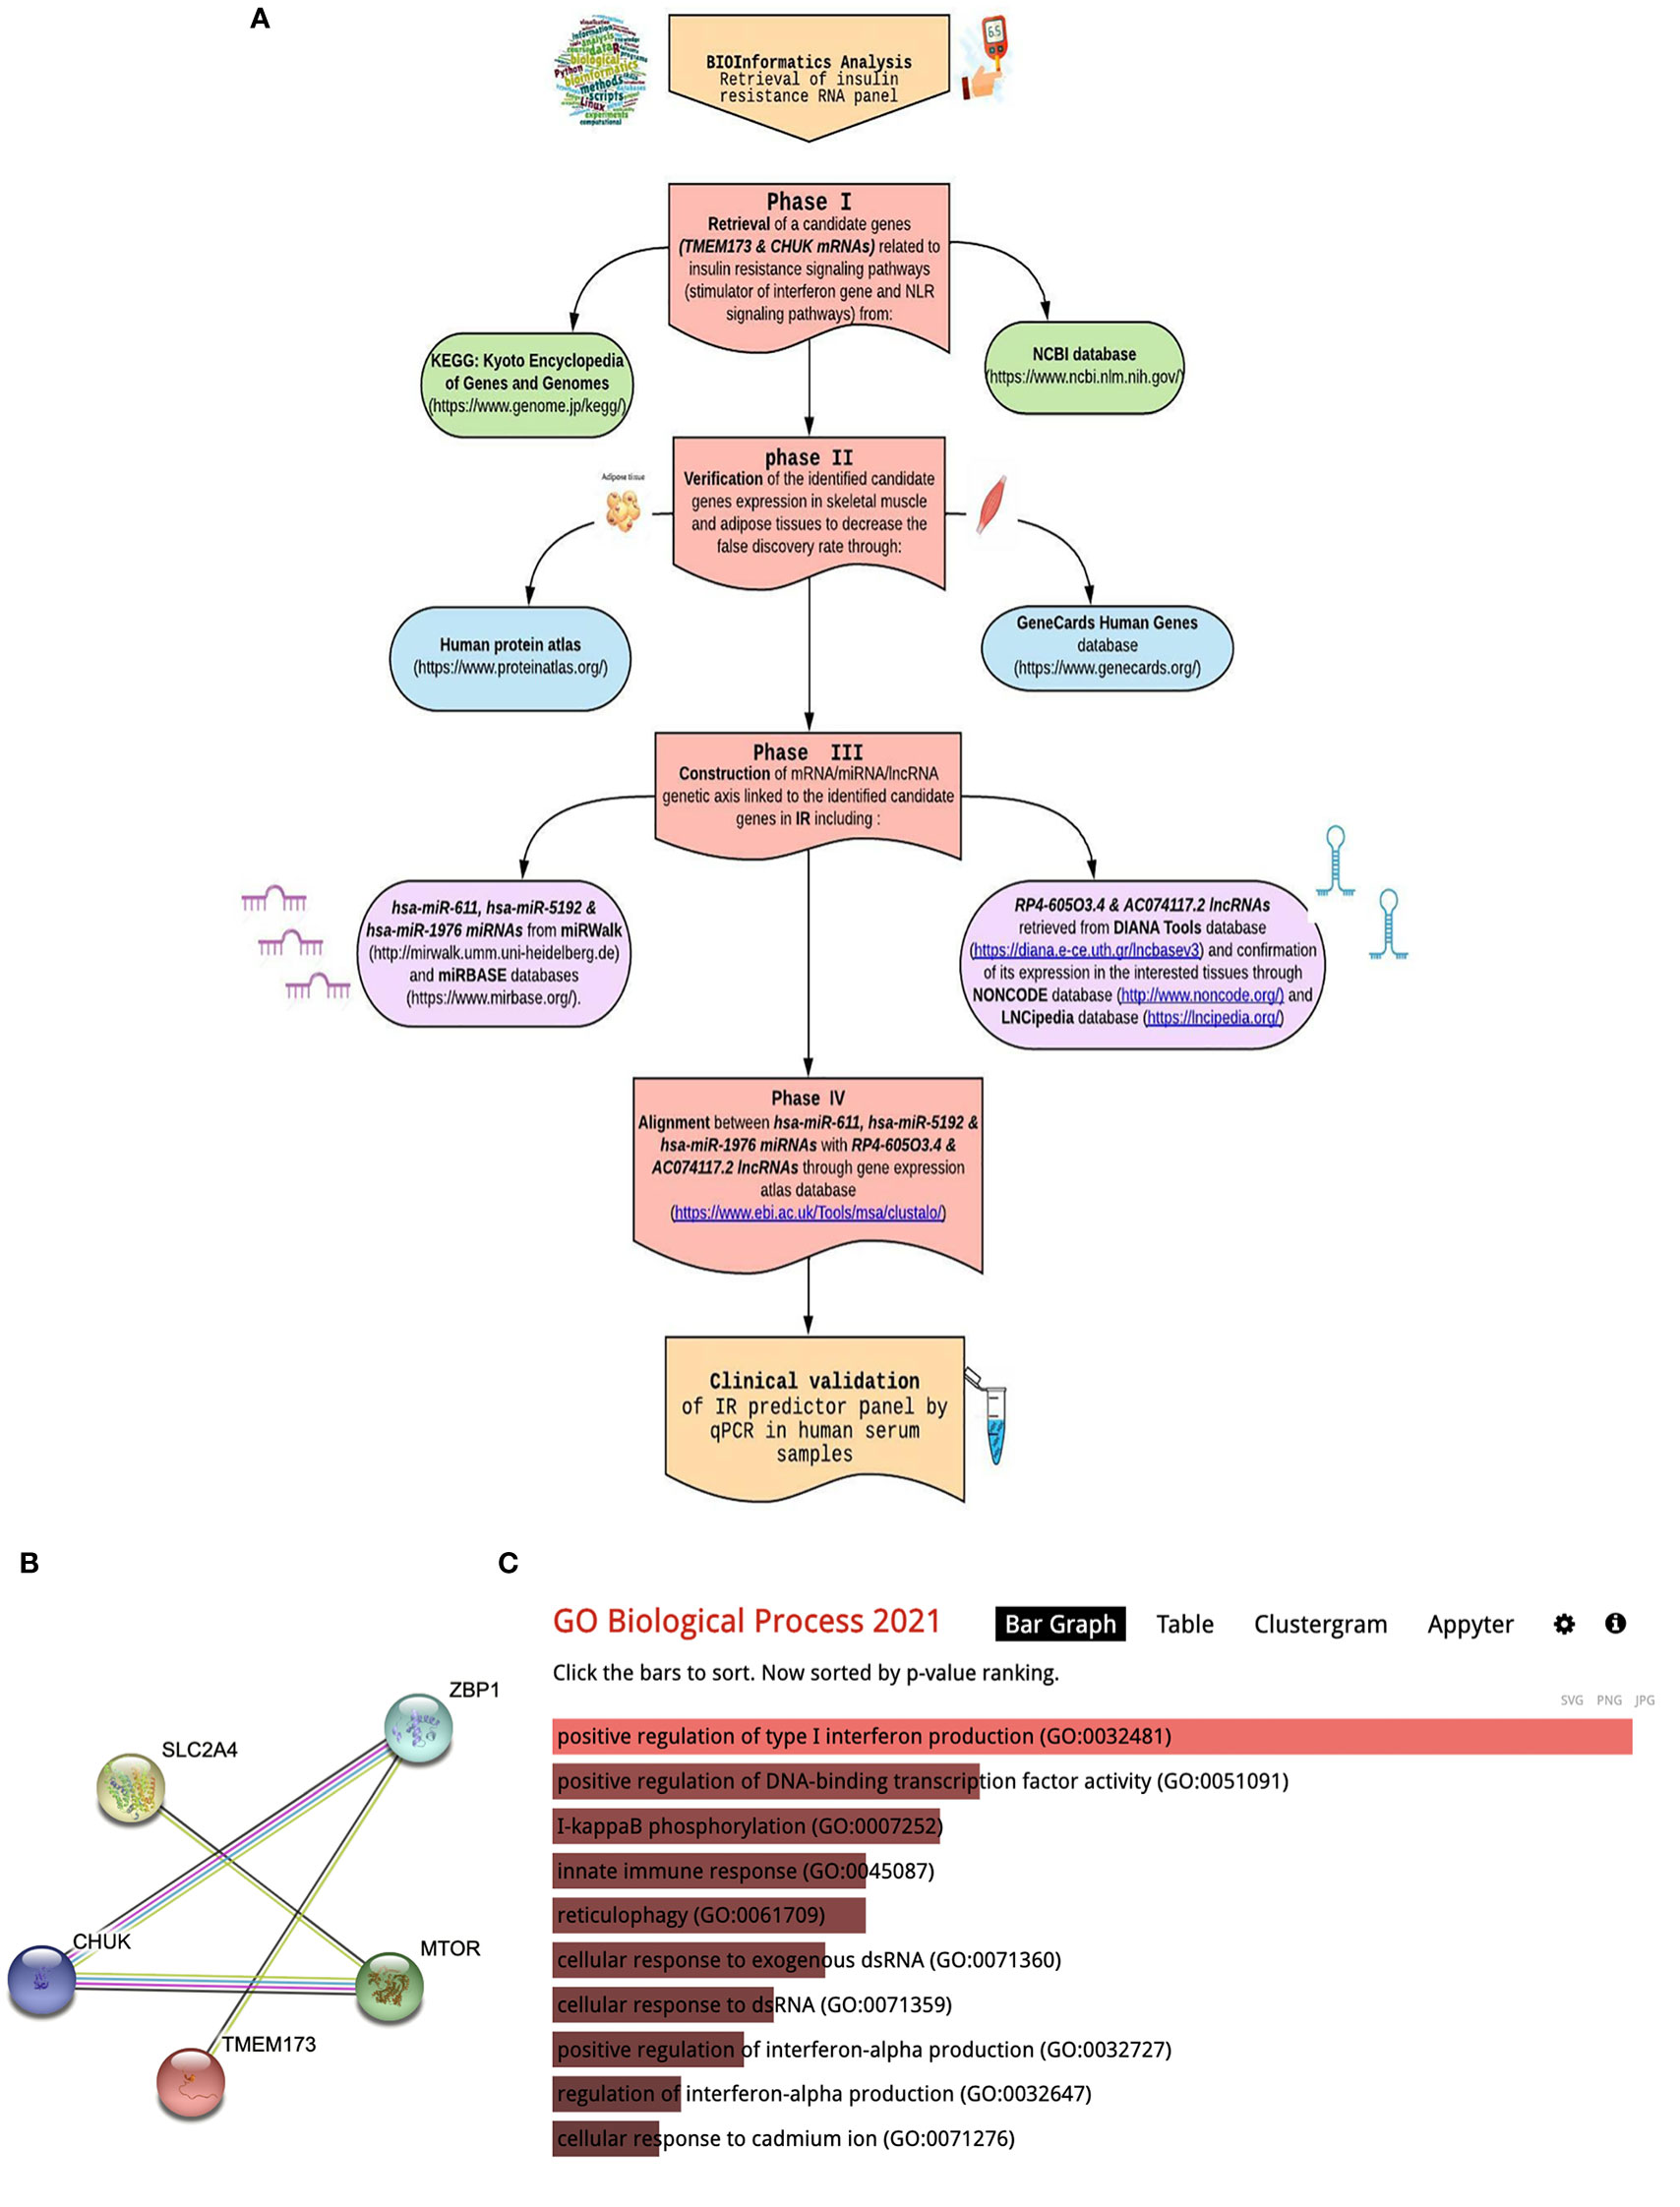
Figure 1 Bioinformatics workflow include: (A) Bioinformatics chart for retrieval of STING/NOD/IR RNA panel, (B) STRING interaction (STRING pathway analysis of significantly dysregulated biomarkers in T2DM). (C) Gene ontology enrichment analysis using the Enrichr algorithm (available at: https://maayanlab.cloud/Enrichr/).
2.2 Clinical and biochemical indices
The present study includes 160 study subjects, classified into 66 cases with type 2 diabetes mellitus, 49 were prediabetics and 45 healthy volunteers. There were no significant differences as regards sex, age, and smoking between the three investigated groups (p > 0.05). On the other hand, there were significant differences among the three studied groups concerning family history of T2DM (p < 0.001), fasting and 2-h post-prandial blood glucose levels (p < 0.001), HbA1c, fasting insulin level (p < 0.001), BMI (p < 0.001), systolic and diastolic BP (p < 0.001), lipid profile including total Cholesterol, LDLc, HDLc, and Triglycerides (p < 0.001), and Alb/Cr. ratio (p < 0.001) as shown in Supplementary Table S1.
HOMA-IR was used as a valid surrogate indicator of insulin resistance and was calculated according to the equation: Fasting insulin (μU/L) x fasting glucose (nmol/L)/22.5 (39), while HOMA-B was calculated as follows: (20x insulin in mIU/ml)/(glucose in mmol/L – 3.5) and it has been suggested to be an effective indicator of B-cell function (40). Both formulas measure HOMA-IR, although they do so from a different perspective. We found significant differences between the three studied groups concerning HOMA-IR (p = <0.001), which was significantly higher in T2DM group compared to prediabetic and healthy control groups; it was also higher in the prediabetic group compared to the healthy control group which indicates different degrees of insulin sensitivity between the three groups.
2.3 Spearman correlation analysis
There was high positive significant correlation between both mRNAs TMEM173 and CHUK and the three miRNAs: hsa-miR (-611, -5192, and -1976) while it was a negative correlation with the two lncRNAs: RP4-605O3.4 and AC074117.2 among all the studied groups and also among the prediabetic and the healthy control group which suggests that the lncRNAs work as a ceRNA competing with the miRNAs for the mRNA pool in the molecular pathogenesis of IR, prediabetes, and T2DM (Table S2-S4).
There was also a positive significant correlation between both mRNAs TMEM173 and CHUK, the three miRNAs; hsa-miR (-611, -5192, and -1976) and the different clinicopathological factors except HOMA-B, which was negatively correlated, while the correlation was negative with the two lncRNAs; RP4-605O3.4 and AC074117.2 and the different clinicopathological factors but it was positive correlation with HOMA-B (Table S4). Spearman correlation was also done between the STING/NOD/IR related RNA associated panel among prediabetic and T2DM groups, there were significant positive correlations between the expression of TMEM173 and CHUK mRNAs, hsa-miR (-611 and -1976), and negative correlation with RP4-605O3.4 lncRNA. To evaluate the diagnostic potential of the investigated IR panel, Spearman correlation of the clinical traits such as: HbA1c and HOMA-IR, with the levels of expression of individual RNA was done for better modeling of how these RNA levels could explain the pathogenesis of IR/T2DM and to reveal the usefulness of these RNAs as diagnostic markers (Figures 2–4 and Tables S2–S4).
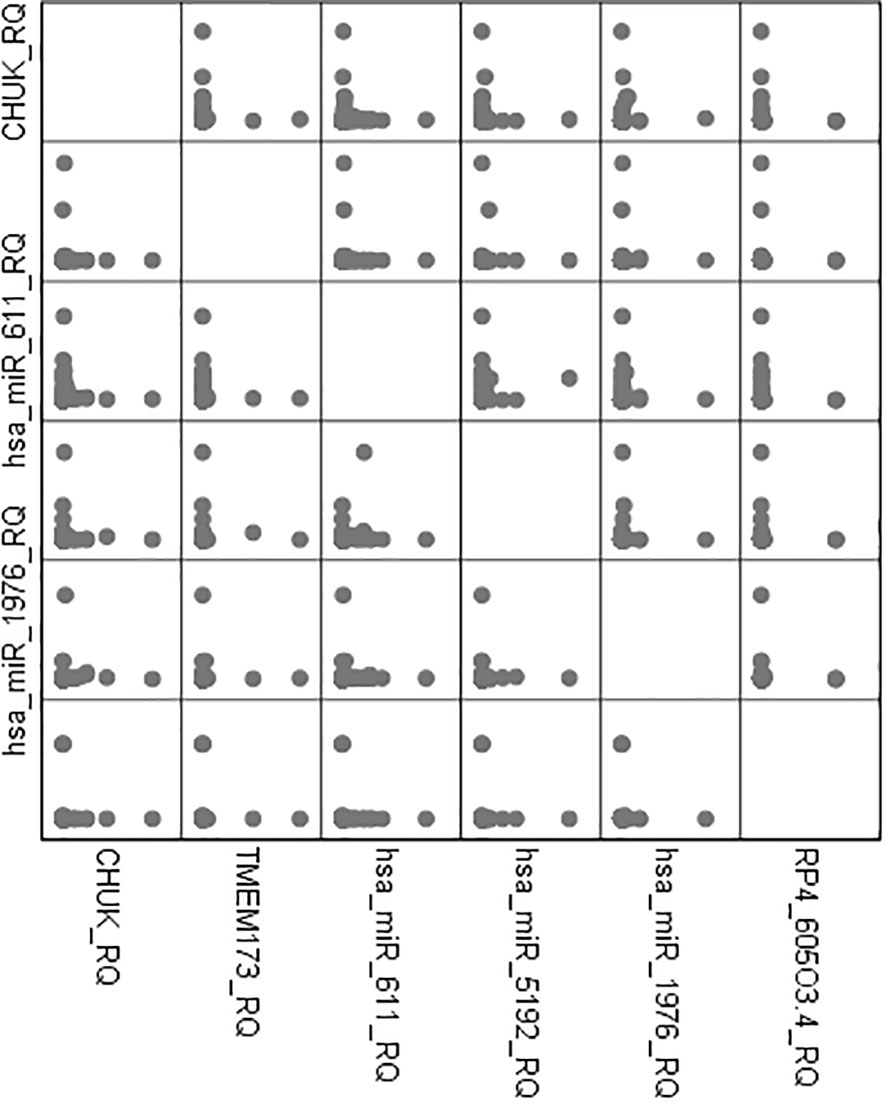
Figure 2 Graphical pairwise correlations between candidate genes.
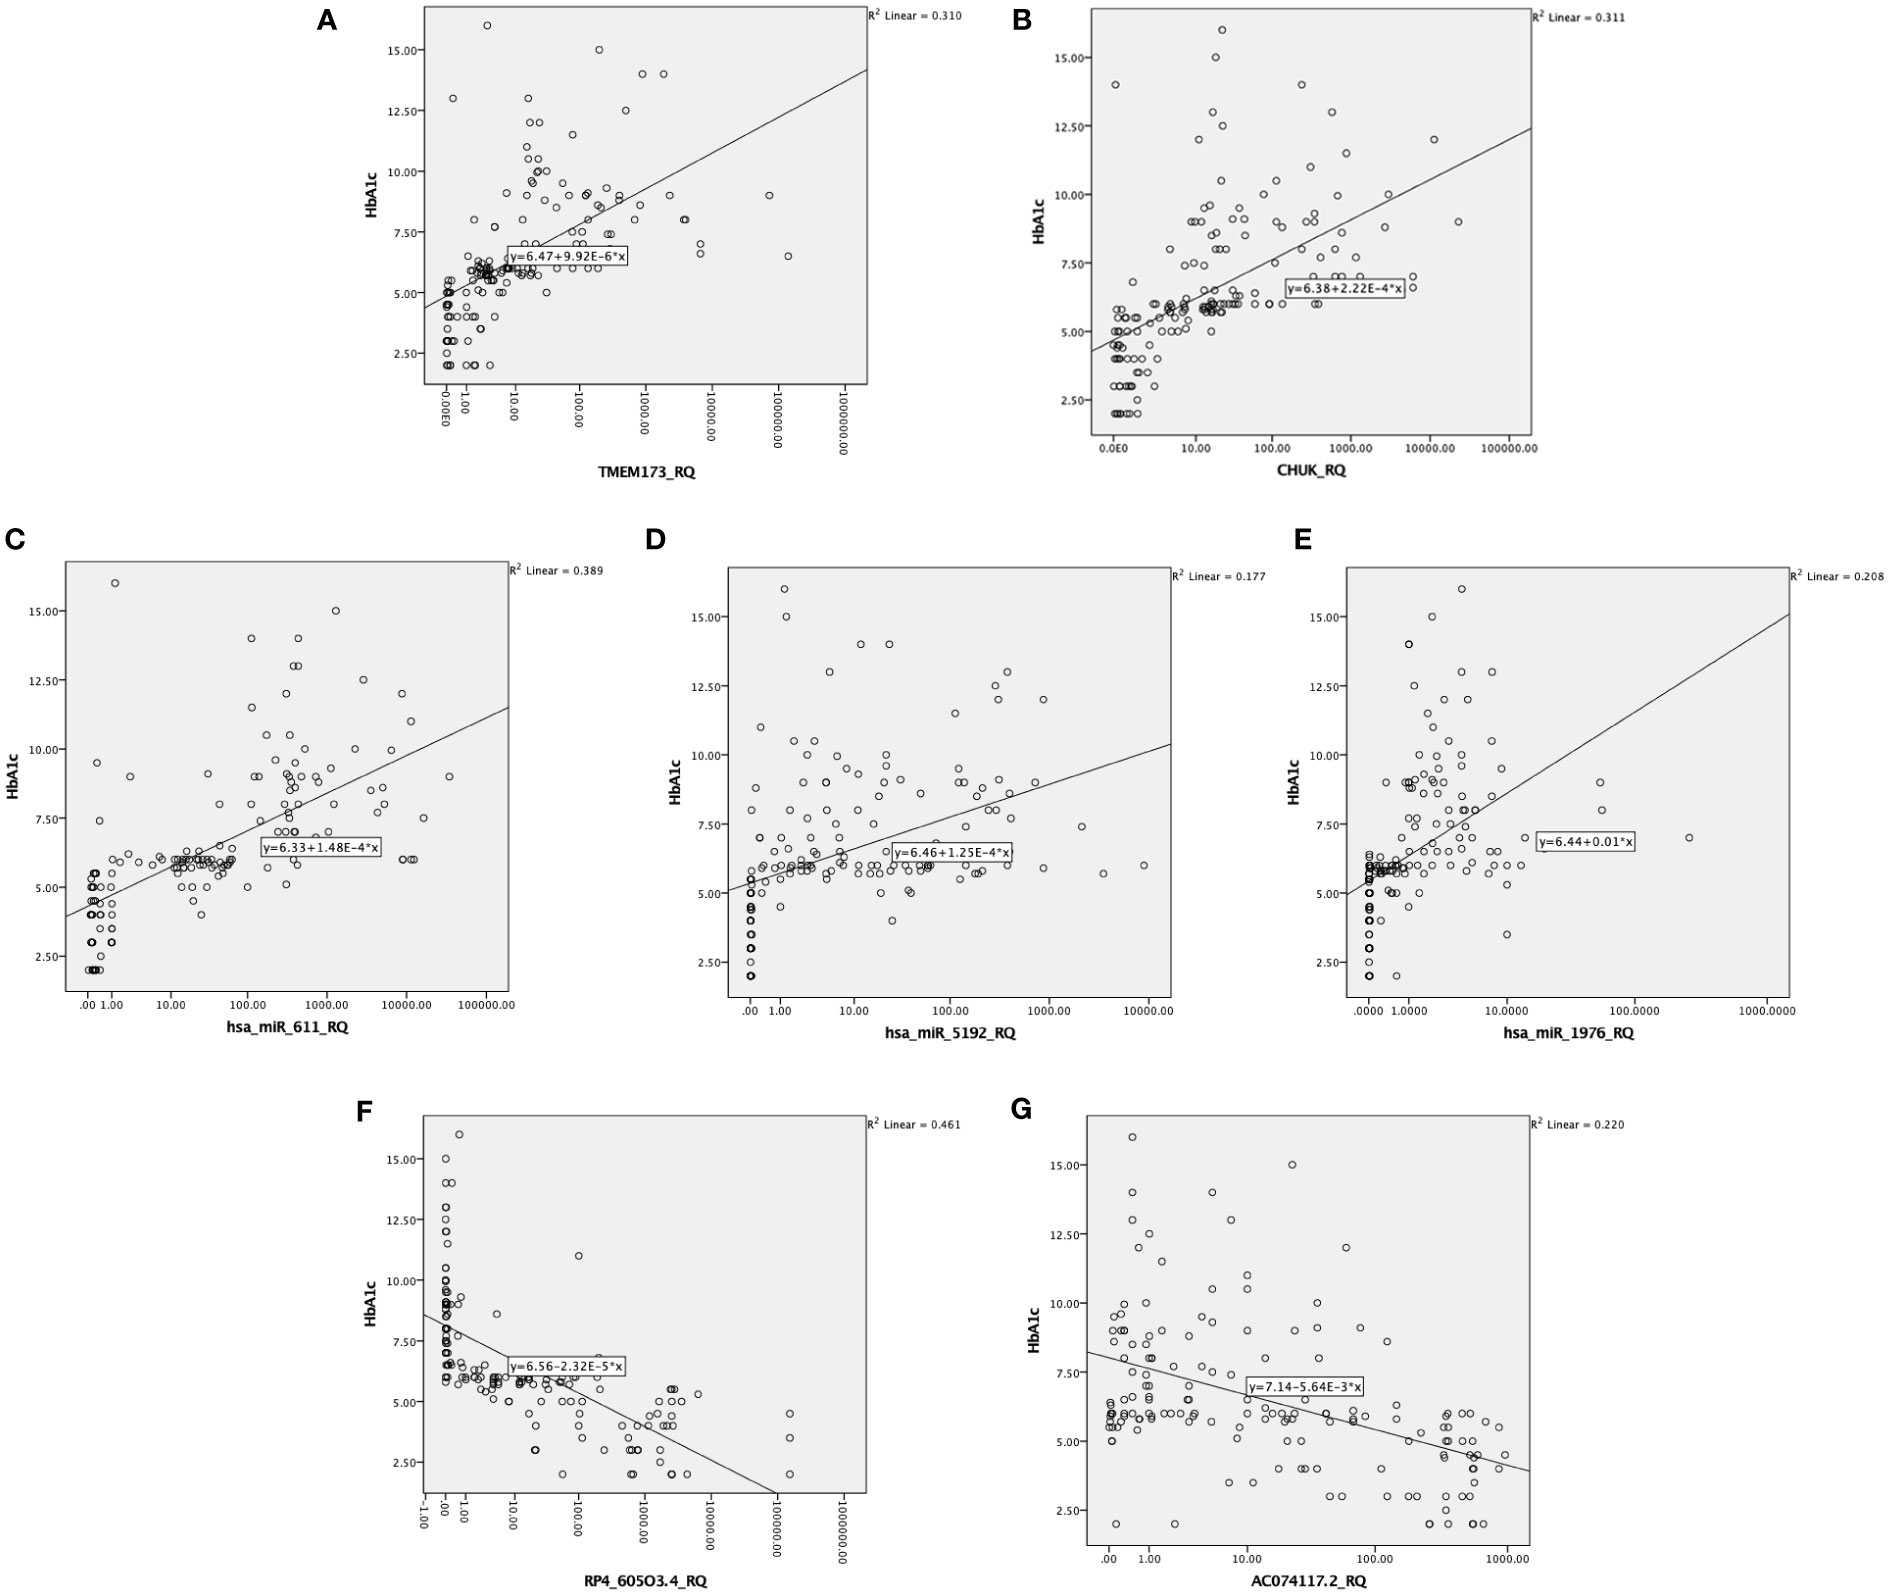
Figure 3 Correlation between the investigated IR predictor panel and glycemic control represented by HbA1c among all the studied groups (n = 160); as shown HbA1c is correlated with (A, B) the relative quantity of TMEM-173 and CHUK, respectively, (C–E) the relative quantity of hsa-miR (-611, -5192, and -1976), respectively, (F, G) the relative quantity of RP4-605O3.4 and AC074117.2, respectively.
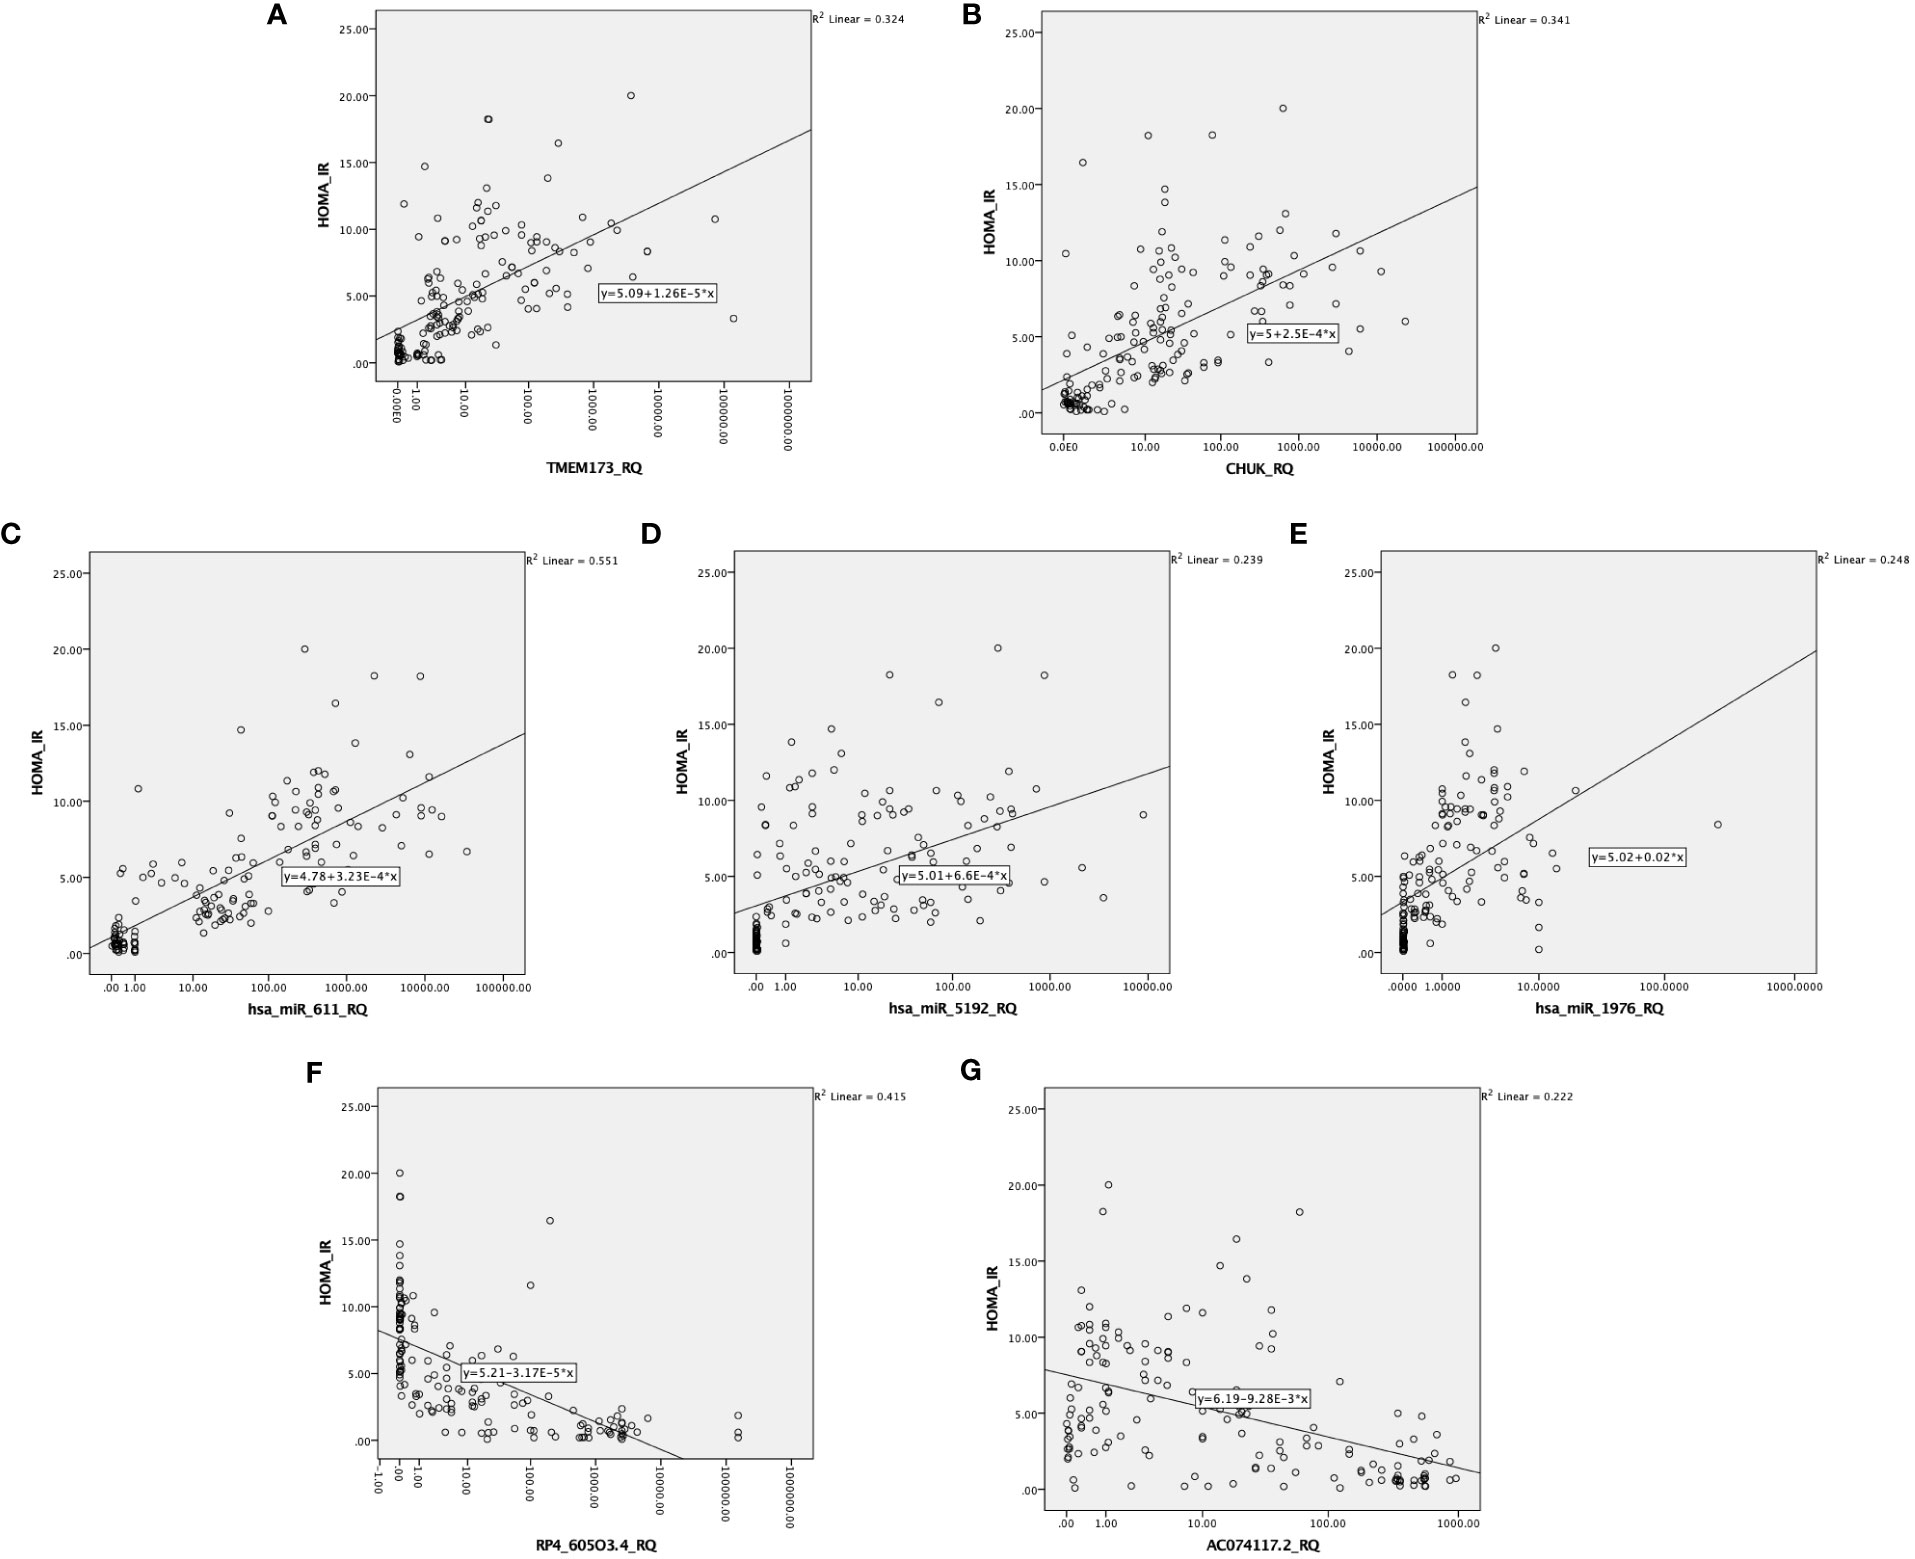
Figure 4 Correlation between the investigated IR predictor panel and degree of insulin resistance represented by HOMA-IR among all the studied groups (n = 160). As shown HOMA-IR is correlated with (A, B) the relative quantity of TMEM-173 and CHUK, respectively. (C–E) the relative quantity of hsa-miR (-611, -5192, and -1976), respectively, (F, G) the relative quantity of RP4-605O3.4 and AC074117.2, respectively.
2.4 Differential expression of the insulin resistance associated panel in the investigated groups
The heatmap (https://biit.cs.ut.ee/clustvis/) is generated using the web tool ClustVis representing hierarchal clustering of the associations between serum RNA expression and the selected clinical traits (41). It was a standardization with a mean at 0 and a standard deviation at 1. The differences were set as |FC| > 1.2 and p-value <0.05. Gene expression levels were illustrated as Z-scores (blue to red). Individuals are in rows, while transcripts are in columns. Blue color indicates lower expression while red color indicates high expression. Light brown color indicates downregulation while dark red color indicates upregulation (Figure 5).
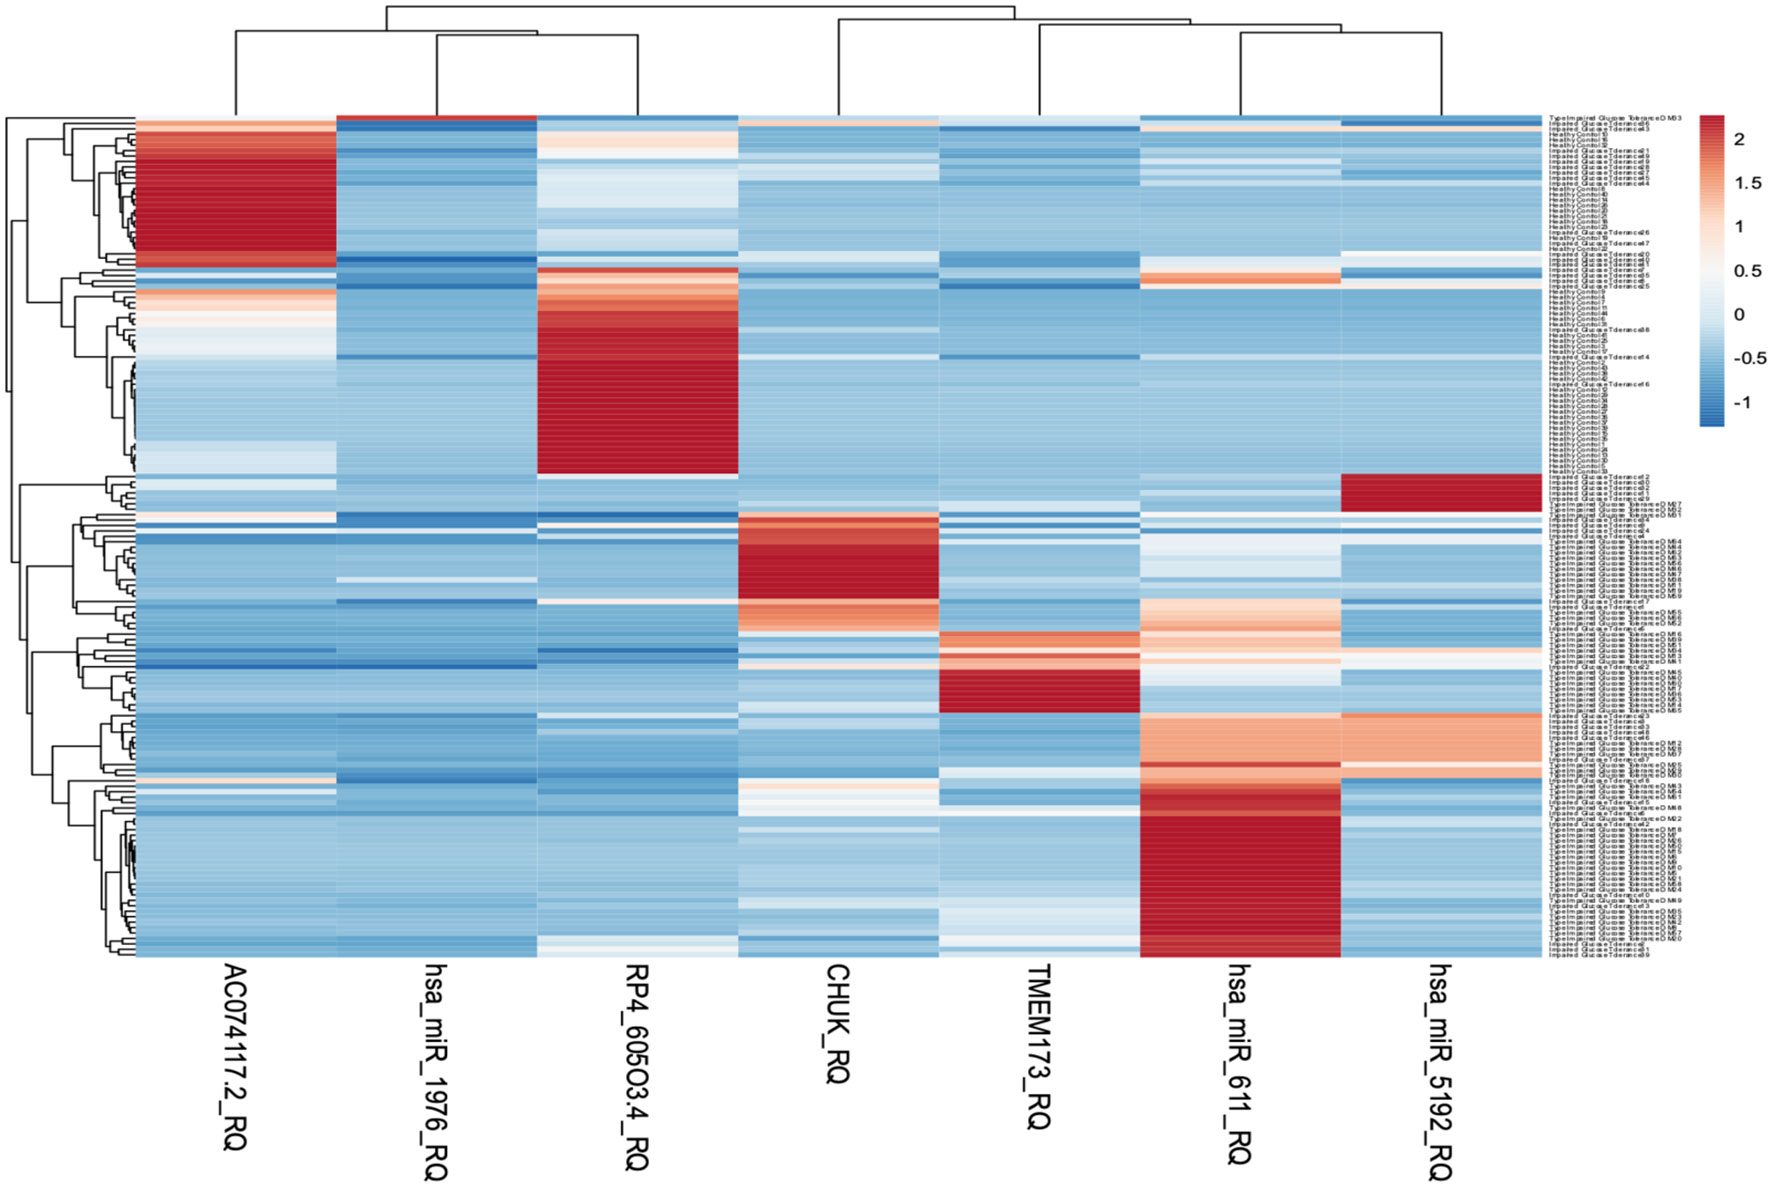
Figure 5 Heatmap representing hierarchal clustering of serum RNA expression was generated using the web tool ClustVis.
The level of expression of the investigated RNA panel was assessed in terms of fold-change (RQ) values in the three investigated groups (T2DM group, prediabetes group, and healthy control group) aiming to confirm the retrieved bioinformatics data. TMEM173 and CHUK mRNAs, hsa-miR (-611, -5192, and -1976) miRNAs expression levels increased gradually from the control group to the pre-diabetic group to reach the highest levels in the T2DM group (p < 0.001), while RP4-605O3.4 and AC074117.2 lncRNAs expression levels decreased gradually from the control group to the pre-diabetic group to reach the lowest levels in the T2DM group (p < 0.001). Thus, the pattern of expression of the investigated STING/NOD/IR RNA associated panel was discriminative between prediabetes and T2DM groups compared to healthy controls and between prediabetes and T2DM patients (Table 1 and Figure 6).
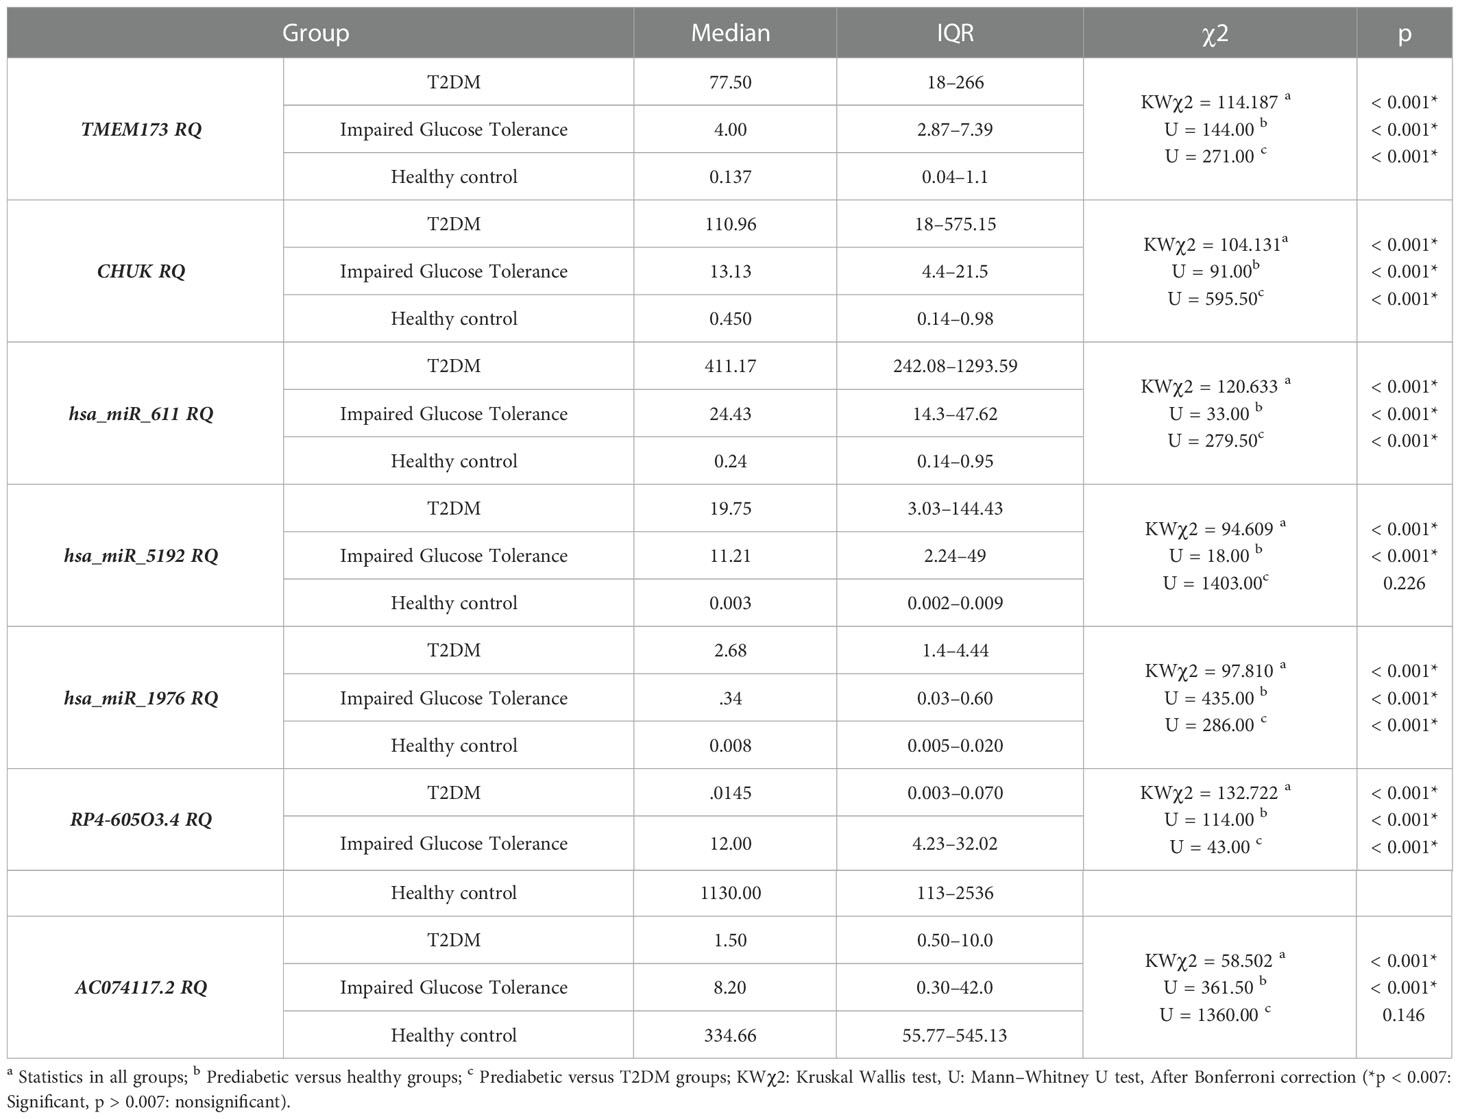
Table 1 The differential expression of the investigated STING/NOD/IR RNA associated panel among the 3 investigated groups with comparison in between the groups.
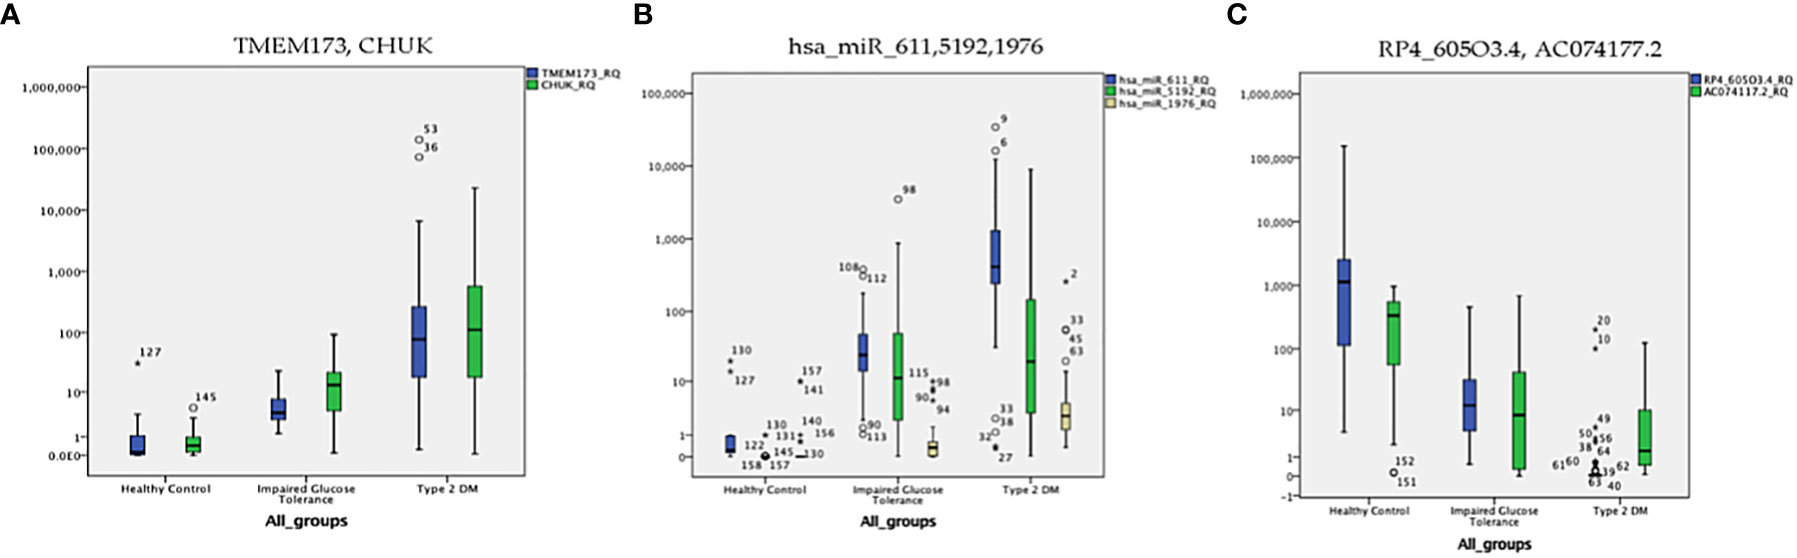
Figure 6 The distribution of the differential expression of the seven candidate genes (measured by qRT-PCR) in the three investigated groups; (A) TMEM173 and CHUK mRNAs, (B) hsa-miR (-611, -5192, and -1976) miRNAs, (C) RP4-605O3.4 and AC074117.2 lncRNAs. The median represented by the line inside the box, 1st and 3rd quartiles represented by the top and bottom lines of the box, respectively. Outliers represented by the dots; logarithmic scale Y axis = 10.
2.5 The performance characteristics of the insulin resistance associated panel in the investigated groups
ROC curve analysis was performed for the investigated STING/NOD/IR RNA associated panel to discriminate between healthy controls and the prediabetes group and to determine the best cutoff values. As regards TMEM173 and CHUK mRNAs, the ideal cutoff values were ≥1.80 (AUC=0.935) and ≥2.05 (AUC = 0.959), sensitivities were 95.9% and 93.9%, specificities were 86.7% and 93.3%, respectively. For serum hsa-miR (-611, -5192, and -1976) the best cutoff values were ≥1.018 (AUC = 0.985), ≥0.1654 (AUC = 0.992) and ≥0.0165 (AUC = 0.803), sensitivities were 100%, 98.0%, and 81.6%, specificities were 95.6%, 95.6%, and 73.3% respectively. Concerning serum RP4-605O3.4 and AC074117.2 lncRNAs the best cutoff values were ≤95 (AUC = 0.931) and ≤97.5 (AUC = 0.836), sensitivities were 95.9% and 85.7% specificities were 82.2% and 73.3%, respectively. Thus, the selected STING/NOD/IR RNA panel was associated with the prediabetes stage. Indeed, recognizing patients at risk for insulin resistance and prediabetes will assist clinicians to determine the optimal management strategy before developing T2DM (Table 2 and Figures 7, 8). Interestingly, the chosen RNAs could be used by clinicians to identify prediabetic patients especially those with family history of T2DM during routinely applied checking up.
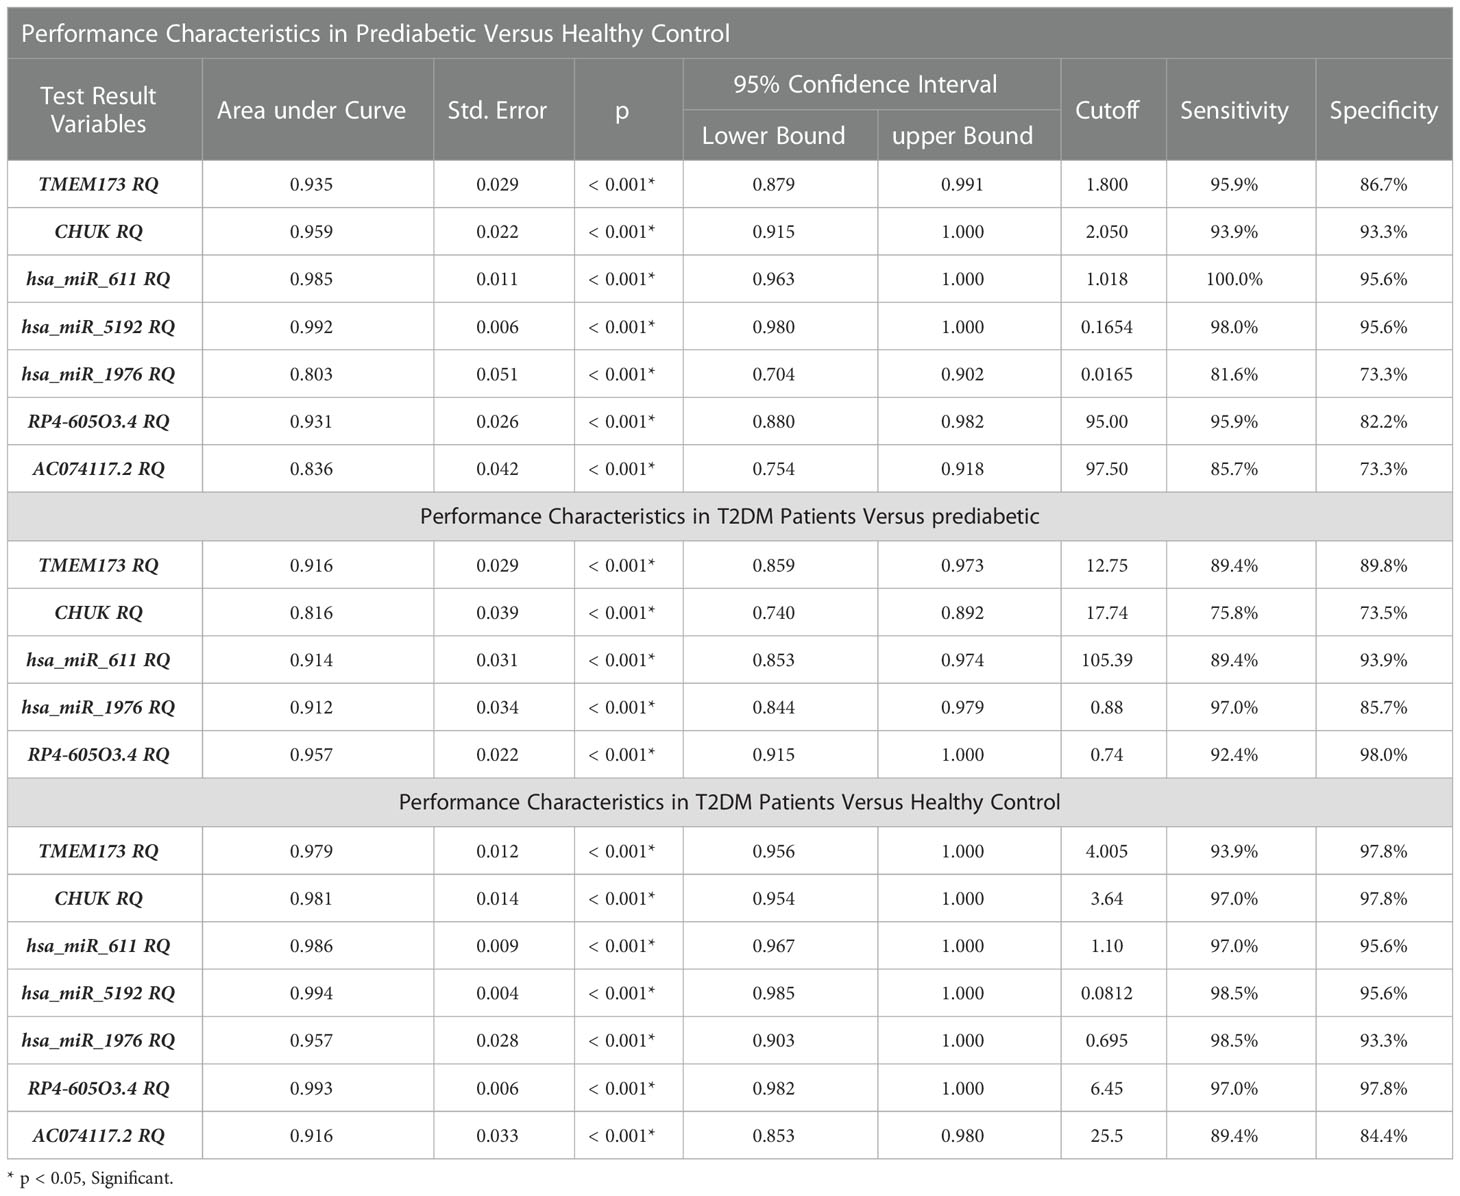
Table 2 The performance characteristics of the insulin resistance associated panel among the investigated groups.
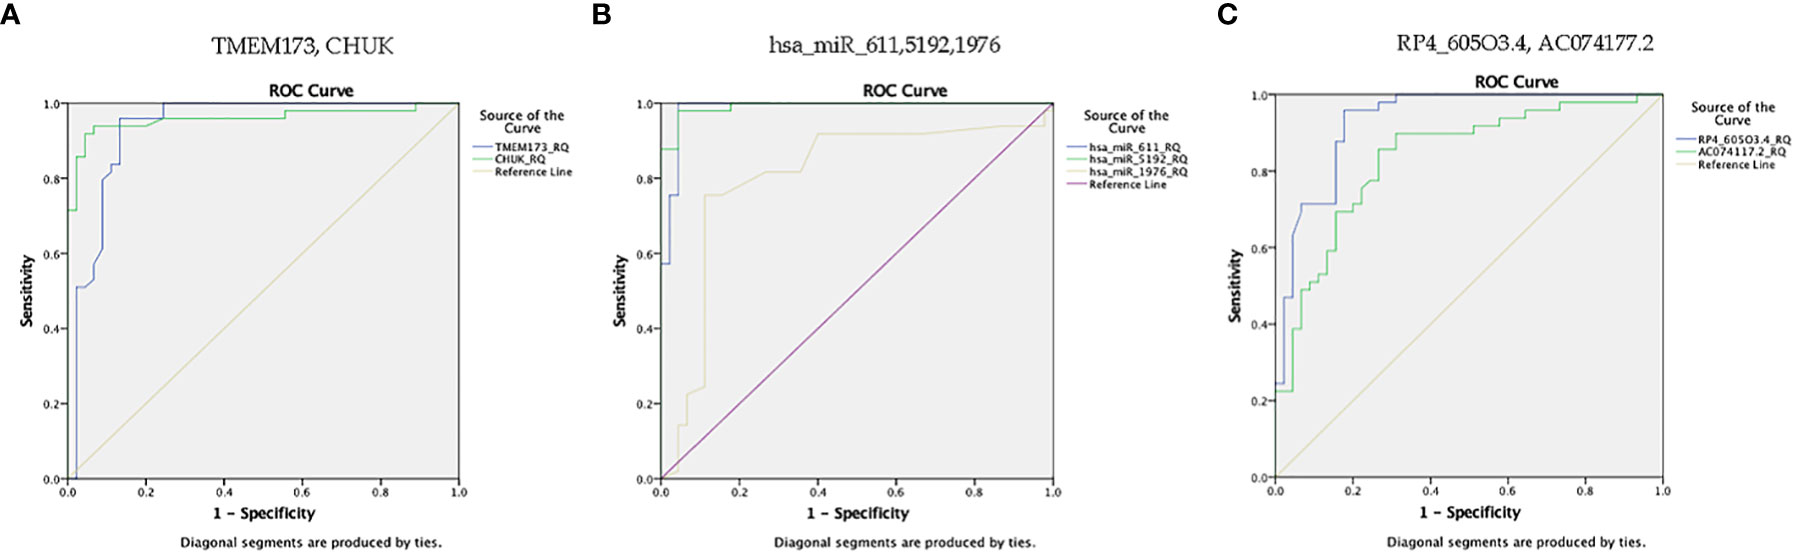
Figure 7 ROC curve represents the diagnostic accuracy of the investigated STING/NOD/IR RNA associated panel to discriminate between healthy controls and prediabetes group. (A) ROC curve analysis for serum TMEM173 and CHUK mRNAs. (B) ROC curve analysis for serum hsa-miR (-611, -5192, and -1976) miRNAs. (C) ROC curve analysis for serum RP4-605O3.4 and AC074117.2 lncRNAs.
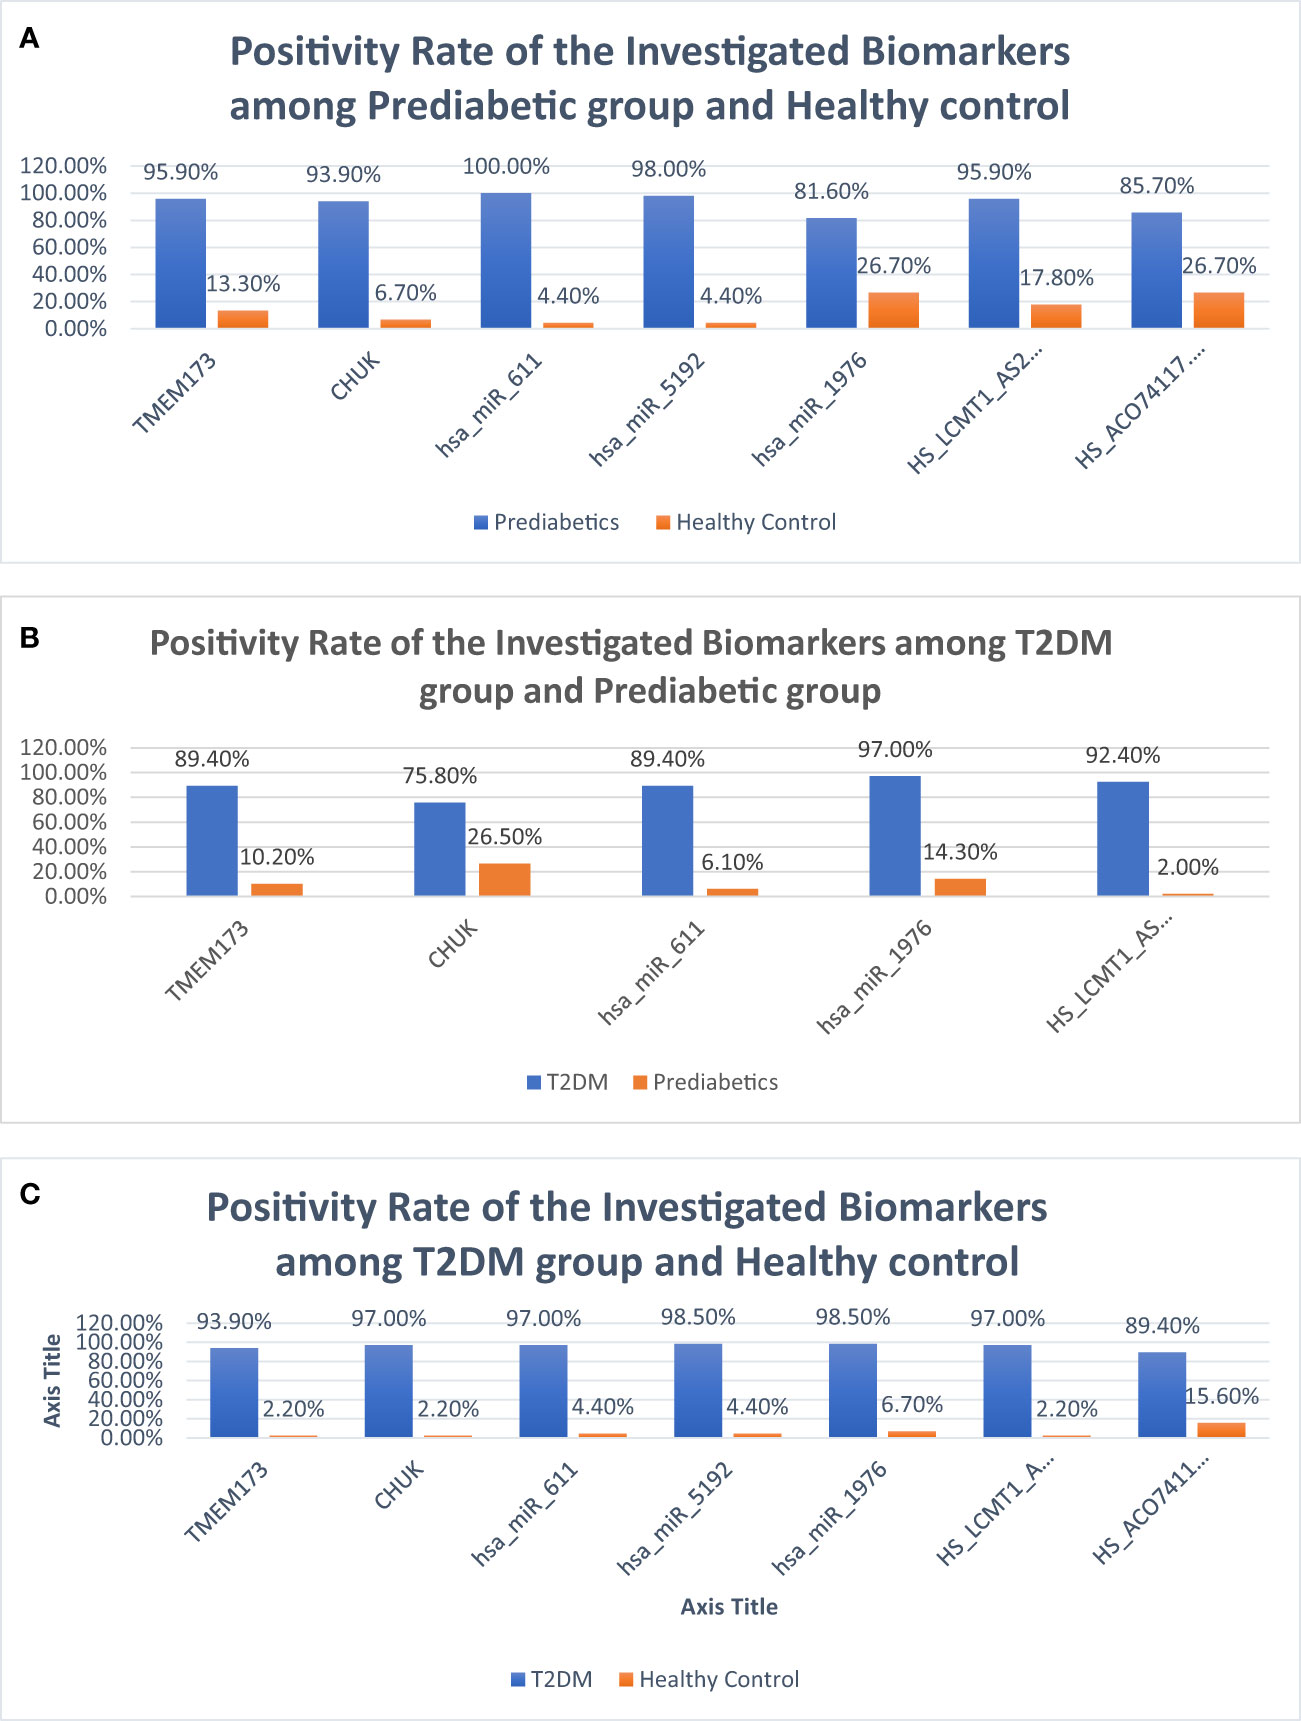
Figure 8 Bar charts demonstrating positivity rates of the investigated parameters: (A) between prediabetic and control groups, (B) between prediabetic and T2DM groups, and (C) between prediabetic and T2DM groups.
ROC curve analysis was also performed for the investigated STING/NOD/IR RNA associated panel to discriminate prediabetes group and T2DM group and to determine the best cutoff values. For serum TMEM173 and CHUK mRNAs the best cutoff values were ≥ 12.75 (AUC = 0.916) and ≥ 17.74 (AUC = 0.816), sensitivities were 89.4% and 75.8% specificities were 89.8% and 73.5% respectively. As regards serum hsa-miR (-611 and -1976 miRNAs the best cutoff values were ≥ 105.39 (AUC = 0.914) and ≥ 0.88 (AUC = 0.912), sensitivities were 89.4% and 97.0%, specificities were 93.9% and 85.7% respectively. And for serum RP4-605O3.4 lncRNA the best cutoff value was ≤ 0.74 (AUC = 0.957), sensitivity was 92.4% specificity was 98.0%. These results suggest that the selected STING/NOD/IR RNA associated panel could be used as a tool to differentiate between prediabetes and type 2 diabetes cases (Table 2 and Figures 8, 9).
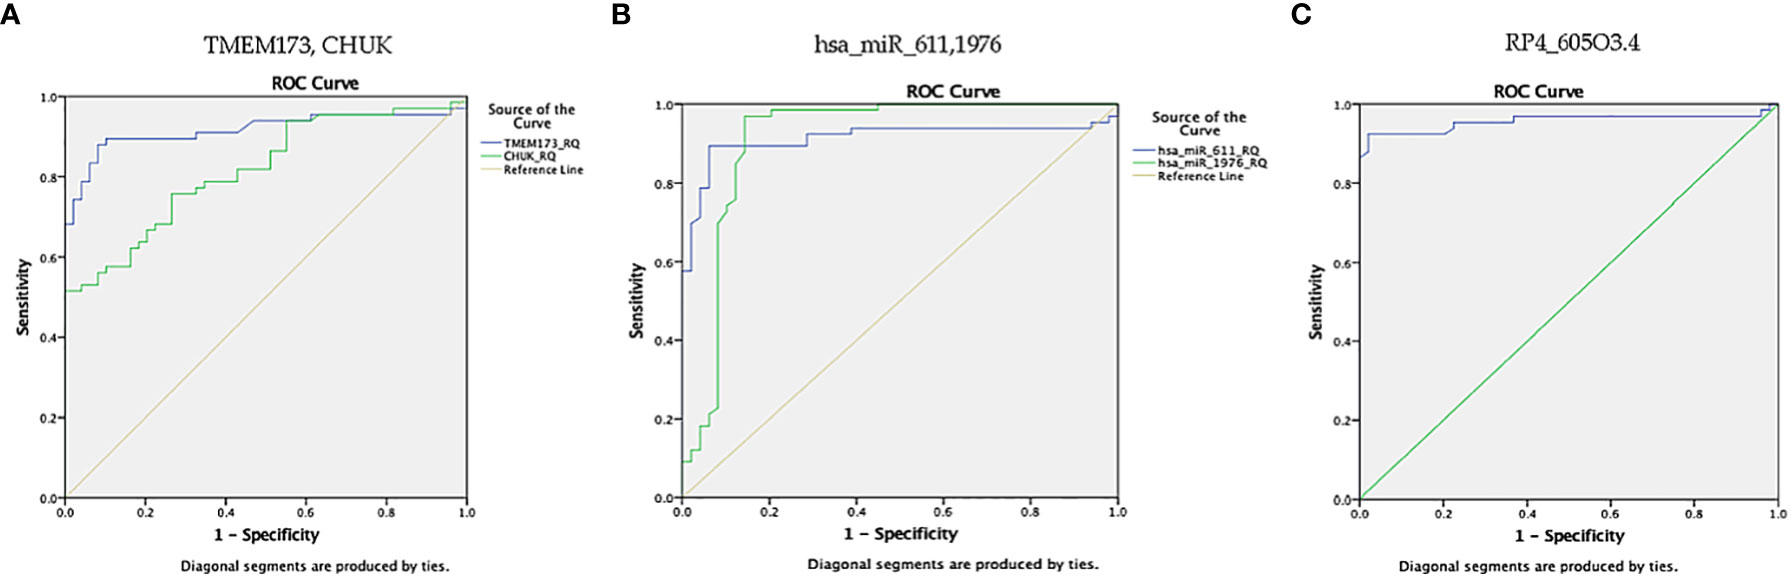
Figure 9 ROC curve represents the diagnostic accuracy of the investigated STING/NOD/IR RNA panel to discriminate between prediabetes group and T2DM group. (A) ROC curve analysis for serum TMEM173 and CHUK mRNAs. (B) ROC curve analysis for serum hsa-miR (-611 and -1976) miRNAs. (C) ROC curve analysis for serum RP4-605O3.4 lncRNA.
Finally, ROC curve analysis was performed for the investigated STING/NOD/IR RNA associated panel to discriminate T2DM group and healthy controls. As for TMEM173 and CHUK mRNAs the best cutoff values were ≥4.005 (AUC = 0.979), and ≥ 3.64 (AUC = 0.981), sensitivities were 93.9% and 97.0%, specificities were 97.8% and 97.8%, respectively. For serum hsa-miR (-611, -5192, and -1976) the best cutoff values were ≥1.10 (AUC = 0.986), ≥0.0812 (AUC = 0.994) and ≥0.695 (AUC = 0.957), sensitivities were 97.0%, 98.5%, and 98.5%, specificities were 95.6%, 95.6%, and 93.3%, respectively. While for serum RP4-605O3.4 and AC074117.2 lncRNAs the best cutoff values ≤6.45 (AUC = 0.993) and ≤25.5 (AUC = 0.916), sensitivities were 97.0% and 89.4%, specificities were 97.8% and 84.4% respectively. These findings suggest the potential use of this panel dysregulation is associated with T2DM pathogenesis (Table 2 and Figures 8, 10).
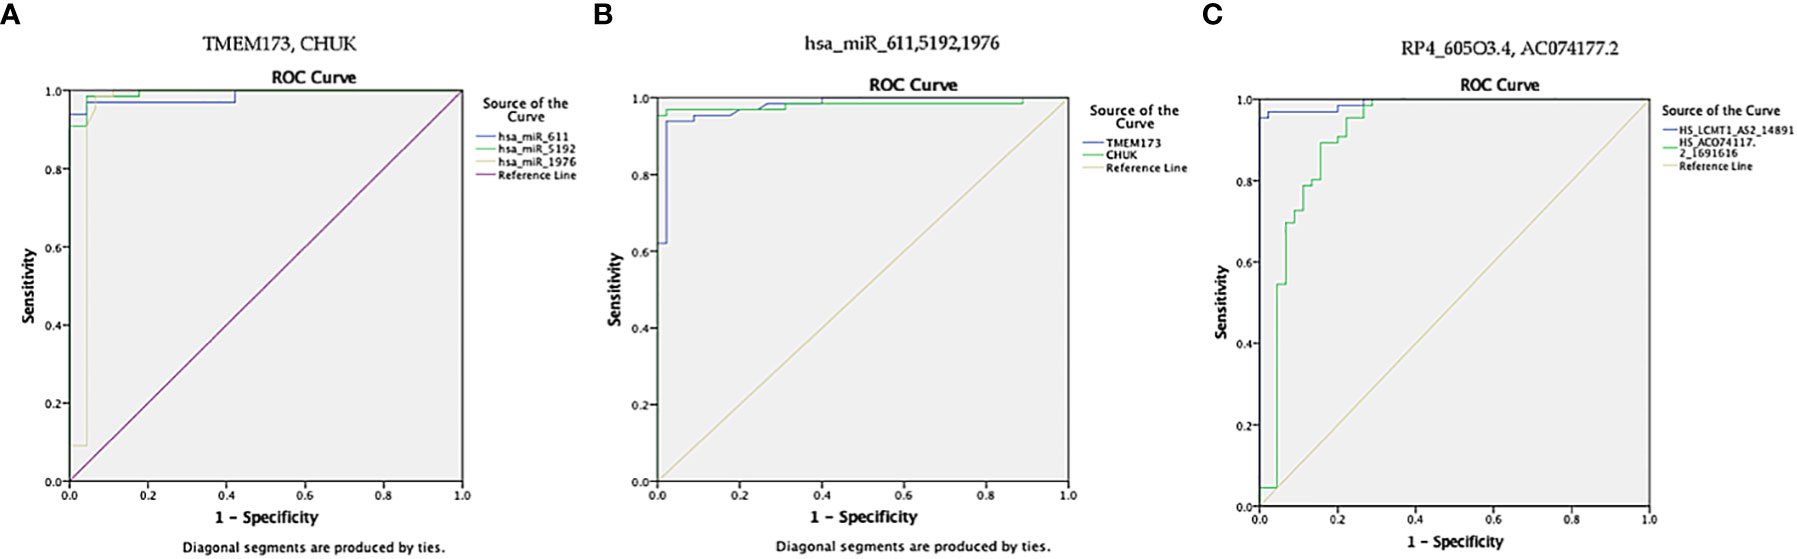
Figure 10 ROC curve presents the diagnostic accuracy of the investigated STING/NOD/IR RNA associated panel to discriminate between T2DM group and healthy controls. (A) ROC curve analysis for serum TMEM173 and CHUK mRNAs. (B) ROC curve analysis for serum hsa-miR (-611, -5192, and -1976) mRNAs. (C) ROC curve analysis for serum RP4-605O3.4 and AC074117.2 lncRNAs.
Patients with T2DM were subdivided into two groups according to their glycemic control. Good glycemic control was indicated by HbA1c <7%, while poor glycemic control was indicated by HbA1c ≥7% (42). There was clinical significance without statistically significant upregulation in the levels of expression of hsa-miR-611 and clinically significant downregulation in the expression of CHUK, hsa-miR (-611, and -5192) and RP4-605O3.4 in the individuals with poor glycemic control compared to individuals with good glycemic control (p = 0.040 and 0.010, respectively) suggesting possible use of these biomarkers together with HbA1c in discriminating glycemic control in T2DM patients. (Table S5).
The degree of insulin resistance was examined in relation to the expression of the insulin resistance associated panel. The prediabetic and T2DM groups were redivided into two groups; group which was insulin resistant (HOMA-IR ≥3.8) and the another was insulin sensitive (HOMA-IR <3.8) (43, 44). TMEM173, hsa-miR (-611 and -1976) and RP4-605O3.4 showed a significant difference in their expression (Table S6), which makes the use of these insulin resistance associated biomarkers together with HOMA-IR possible in differentiating insulin resistant from insulin sensitive patients. Multivariate analysis for prediction of insulin resistance has been used and showed that miR-611 then -1976 then CHUK were significant insulin resistance predictors beside HOMA-IR and HOMA-B (Table 3)
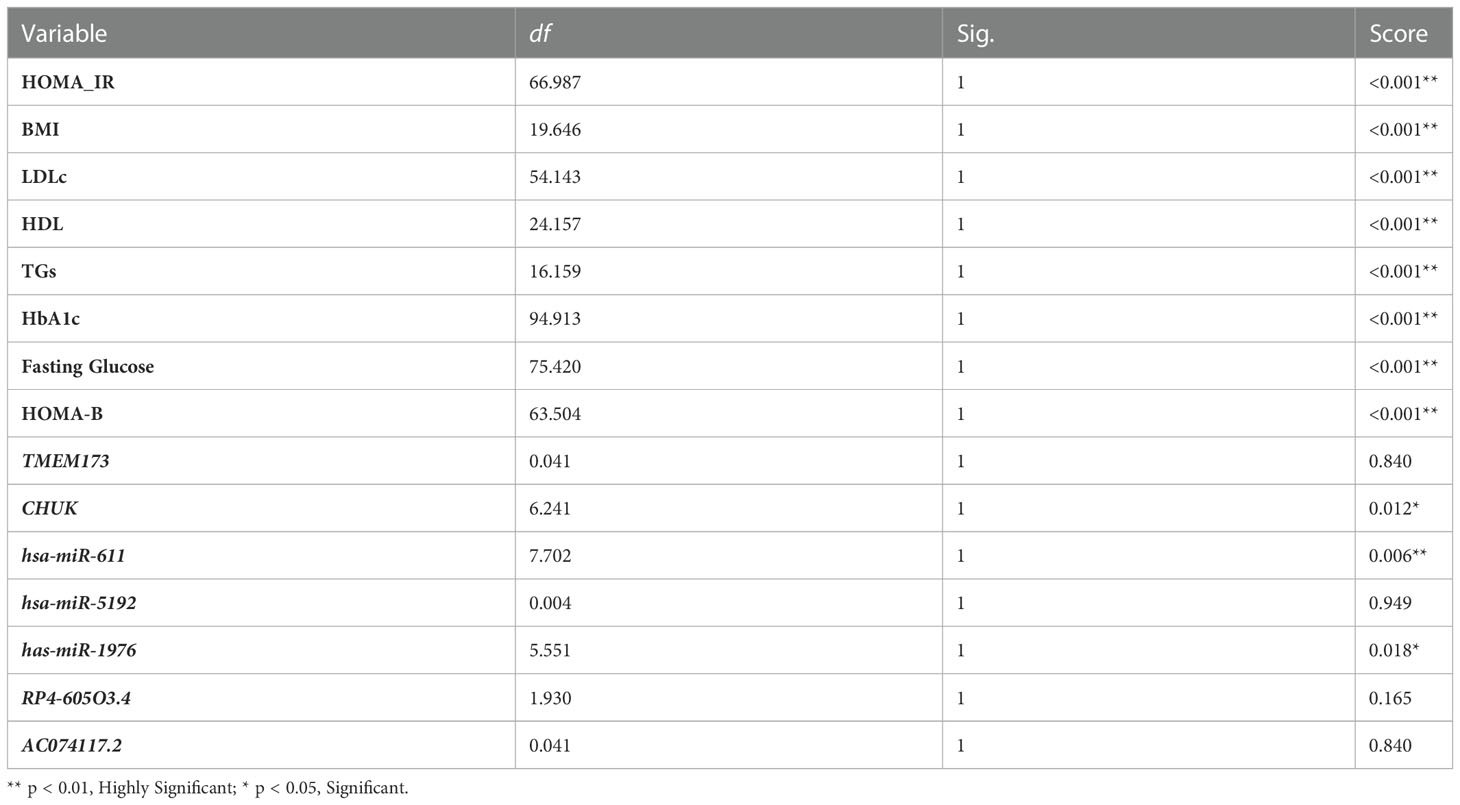
Table 3 Multivariate analysis for the predictors of IR.
3 Discussion
Type 2 diabetes mellitus (T2DM) is a complex metabolic disease that poses a significant health burden. Early detection of the prediabetes stage is crucial to prevent complications from developing (45). However, studies on prediabetes and related biomarkers are limited. In this study, we aimed to more accurately determine those at risk of developing prediabetes and progressing to T2DM by combining several STING/NOD/IR RNA biomarkers. To achieve this, we explored the STimulator of Interferon Gene (STING)/Nucleotide-binding oligomerization domain (NOD)/insulin resistance (IR) signaling pathways and identified STING-related molecular target effectors. Our goal was to evaluate the diagnostic efficacy of this molecular RNA panel in the early detection and diagnosis of prediabetes and T2DM.
The cGAS-STING pathway is activated by host DNA that is aberrantly located in the cytosol, which contributes to enhanced inflammation-mediated insulin resistance (46). Overactivation of this system results in the generation of harmful pro-inflammatory cytokines. Consistent with these findings, knockout of cGAS-STING pathway downstream targets or pharmacological targeting of Ik-kinase alpha (IKKa) may improve glucose tolerance and insulin sensitivity in patients with T2DM (47, 48). TMEM173, commonly known as STING1, is a key adaptor protein found in the endoplasmic reticulum’s outer membrane. TMEM173 was first recognized as a key molecule in innate immunity for its role in sensing invading DNA segments and inducing the production of interferon, as well as other pro-inflammatory cytokines via JAK/STAT signaling associated with the development of many diseases, including insulin resistance and diabetes (15). This is consistent with our results, which demonstrated an increase in the levels of expression of TMEM173 mRNA in the prediabetic and T2DM groups.
The NOD signaling pathway acts as a key player in the inflammation induced and triggered by the cGAS-STING pathway. The CHUK gene is a crucial effector of the NLR pathway, and it is mapped to human Chr 10q24-q25. The encoded protein is a component of a cytokine-activated protein complex that acts as an inhibitor of the transcription factor NF-kappa-B signaling pathway, which is involved in the pathogenesis of prediabetes and T2DM (49). Our study found that the level of expression of CHUK mRNA increased progressively from the healthy control to the prediabetic and T2DM groups, indicating its role in the development of prediabetes and T2DM.
ncRNAs are particularly convincing candidates as diagnostic and prognostic biomarkers. Given the complexity of insulin resistance pathogenesis, a method based on the combination of both coding and non-coding biomarkers is preferable (28). Multiple studies have found that miRNAs play a crucial role in the molecular pathways that contribute to β-cell malfunction (50). Our candidate miRNAs hsa-miR (-611, -5192, and -1976) were first to be studied in this IR related study and found to be associated with prediabetes and T2DM. Some researchers suggested that miRNAs could be used as biomarkers for predicting susceptibility to diabetes (28). Seyahn et al., found that assessing circulating levels of miR126, miR148a and miR146a miRNAs was useful in discriminating individuals with prediabetes from healthy controls, whereas miR-34a and miR-30d miRNAs levels were better in distinguishing T2DM patients (51).
Several lncRNAs are involved in different stages of insulin production and are linked to the development of insulin resistance (28). A study by Sathishkumar and colleagues suggested that levels of circulating lncRNAs in type 2 DM were correlated with different pathological factors, such as reduced glycemic control, broad inflammation, and cellular senescence (52). This is consistent with the findings by Formichi et al., who discovered abnormal levels of some lncRNAs when comparing T2DM patients to healthy individuals. Surprisingly, these dysregulated lncRNAs were found to be positively related to insulin resistance and poor glucose tolerance (28). Remarkably, our study demonstrated that RP4-605O3.4 and AC074117.2 lncRNAs are differently expressed in the sera of T2DM patients, and their levels were significantly correlated with impaired glycemic control and insulin resistance.
Interactions between miRNAs and their target mRNA in 5′ UTR regions, coding-sequence, or gene promoters can regulate translation or activate transcription (53). Because lncRNAs containing miRNA response elements can compete with other RNA transcripts, they can theoretically operate as ceRNAs; and a single miRNA can control several target RNAs containing the unique miRNA response element, and these RNAs can be regulated by multiple miRNAs, laying the foundation for the establishment of a ceRNA network (54).
In this study, we hypothesized that molecular triggers, such as microbial dysbiosis, obesity, and DNA damage, lead to increased expression levels of hsa-miR (-611, -5192, and -1976) miRNAs. These miRNAs act as sponges, decreasing the expression of the RP4-605O3.4 and AC074117.2 lncRNAs, which act as ceRNAs, releasing and increasing levels of TMEM173 and CHUK genes involved in the modulation of STING and NLR pathways, respectively, along with their downstream effectors. This leads to activation of the INF pathway, triggering low-grade inflammation and insulin resistance, eventually leading to prediabetes and T2DM.
The screened STING/NOD/IR RNA panel was found to be differently expressed in the studied groups. Our results demonstrated that the expression levels of TMEM173 and CHUK mRNAs, together with hsa-miR (-611, -5192 and -1976) miRNAs, progressively increased from the healthy control to the prediabetic group, reaching the highest levels in T2DM group. In contrast, the expression levels of RP4-605O3.4 and AC074117.2 lncRNAs progressively decreased from the healthy control to the prediabetic group, to reaching the lowest levels in the T2DM group. These findings raise the possibility of using this RNA panel as a circulating coding-noncoding biomarker panel for early detection of prediabetes and type 2 diabetes mellitus.
Furthermore, there was a significant upregulation in the expression of hsa-miR-611 miRNA with significant downregulation in the expression of RP4-605O3.4 lncRNA in the poor glycemic control group compared to individuals with good glycemic control. This suggests the possible use of these non-coding biomarkers, together with HbA1c, in discriminating glycemic control in T2DM patients. These findings are consistent with those of Ortiz-Martínez M et al., who stated that novel serum biomarkers can be used with or even instead of conventional markers for detection and follow-up of diabetes (55). TMEM173, CHUK mRNAs, hsa-miR (-611 and -1976) miRNAs, and RP4-605O3.4 lncRNA were significantly useful in distinguishing insulin-resistant from insulin-sensitive groups, which matches the data collected by Pielok et al., who revealed a set of ncRNAs that may act as potential predictors for hepatic insulin resistance (56).
This study had some limitations. The small sample size of the study and the limited number of genes may not represent the complete picture of the molecular changes occurring in individuals with prediabetes and T2DM. The use of bioinformatics analysis in selecting candidate mRNA genes related to type 2 DM and insulin resistance signaling has its advantages, but it is also subject to biases. One limitation is that this approach only considers gene expression at the transcriptional level, which may not fully capture the complexity of molecular changes associated with T2DM. To overcome this limitation, future studies may consider integrating data from different levels of molecular regulation, such as epigenetic and post-transcriptional modifications. This approach may provide a more comprehensive understanding of the molecular changes associated with T2DM. However, we plan to address these limitations in future research by conducting larger longitudinal studies with functional validation of the identified biomarkers through in vitro or in vivo experiments with more diverse populations to further explore the association between the identified biomarkers and the development and progression of type 2 diabetes.
In conclusion, this study identified novel STING/NOD/IR RNA panel (TMEM173, CHUK mRNAs, hsa-miR (-611 and -1976) and RP4-605O3.4 lncRNA) as pre-DM and T2DM associated biomarker panel. Our findings provide support for the association between this IR panel and other serum parameters in the progression of prediabetes to type 2 diabetes mellitus. However, prospective studies are needed to confirm these findings and explain the role of these genes in the risk of developing prediabetes and type 2 diabetes mellitus.
4 Materials and methods
4.1 Bioinformatics analysis
The identified STING/NOD/IR RNA associated panel was constructed through the following steps:
Retrieval of a set of candidate mRNA genes (TMEM173 and CHUK) related to insulin resistance signaling pathways (STimulator of Interferon Gene and NLR pathways) from public microarray databases available at National Center of Biotechnology Information GEO (https://www.ncbi.nlm.nih.gov/geo/, accessed in May 2022), Gene atlas expression database; Verification of the expression of the retrieved candidate genes in skeletal muscles and adipose tissues via Gene Cards Human Genes database (https://www.genecards.org/), and via the Human protein atlas database (https://www.proteinatlas.org/) so as to decrease the false discovery rate; gene ontology was checked for TMEM173 and CHUK mRNAs using Enrichr (http://amp.pharm.mssm.edu/Enrichr) at p-value <0.05 which was defined to identify up-regulated and down-regulated genes in GO functional enrichments (Supplementary Table S7). Interactions of differently expressed biomarkers in IR and T2DM were analyzed via STRING database available at (https://string-db.org/). Identification of ncRNA (miRNA/lncRNA) genetic axis linked to the retrieved candidate mRNA genes in insulin resistance including hsa-miR (-611, -5192 and -1976) miRNAs from miRWalk (http://mirwalk.umm.uni-heidelberg.de) and miRBASE databases available at (https://www.mirbase.org/). RP4-605O3.4 and AC074117.2 lncRNAs retrieved from DIANA Tools database available at (https://diana.e-ce.uth.gr/lncbasev3); these lncRNA–miRNA interactions were obtained through target gene prediction with confirmation of its expression in the interested tissues through NONCODE database and LNCipedia database available at (http://www.noncode.org/ and https://lncipedia.org/) respectively. Alignment between hsa-miR-611 with RP4-605O3.4 and AC074117.2 lncRNAs through EMBL’s European Bioinformatics Institute database; Claustal omega database available at (https://www.ebi.ac.uk/Tools/msa/clustalo/), Detailed bioinformatics are illustrated in Figure 1 and Supplementary Figures S1–9.
4.2 Study population
The current study was approved by the Ain Shams ethical committee, Faculty of Medicine. Participants were admitted to the Endocrinology Unit, Internal Medicine Department, Faculty of Medicine, Ain Shams University in the period between April 2022 and May 2022. There were 160 Egyptian unrelated participants. They were classified into 66 cases with type 2 diabetes mellitus, 49 were prediabetics with impaired glucose tolerance state, and there were 45 healthy volunteers came at the Ain Shams hospital outpatients’ clinics for routine checkups. A written informed consent was received from all the participants after being informed about the study. The diagnosis and classification of the diabetic and prediabetic state was made according to American Diabetes Association criteria 2022 for the diagnosis of type 2 diabetes mellitus and prediabetes (57).
Criteria for diagnosing diabetes and prediabetes was made based on the clinical presentation along with biochemical analyses, including fasting and 2 h post prandial blood glucose level, level of fasting insulin, glycated hemoglobin (HbA1c), lipid profile (total cholesterol, triglycerides, LDLc and HDLc), and albumin/creatinine ratio. HOMA-IR formula was calculated to assess the degree of tissue resistance to insulin. Upon hospital admission blood samples were collected and processed by centrifugation at 4000 rpm for 20 min. Resulting sera were kept in aliquots in a freezer at −80°C for further processing within 2 months.
4.3 Extraction of total RNA and quantitative real-time PCR
Total RNA was extracted and purified using miRNEasy extraction kit (Qiagen, Hilden, Germany) from the serum samples according to the manufacturer’s manual. Further assessments of RNA concentration, integrity and purity were performed using Nano-Drop instrument (Thermo Scientific, Waltham, MA, USA). miScript II RT Kit (Qiagen, Germany) was used for the preparation of cDNA libraries for mRNAs, lncRNAs and miRNAs. We added 4 µl of 5x miScript HiFlex Buffer, 2 µl of 10x miScript Nucleics Mix, 2 µl of miScript Reverse Transcriptase Mix and continued with RNase free water to 2 µg of extracted RNA to reach final volume of 20 µl, followed by incubation at 37°C for 60 minutes and at 95°C for 5 minutes using Rotor gene Thermal cycler (Thermo Electron, Waltham, MA, USA) then cDNA was stored at -20°C for further processing by real-time PCR.
The levels of the identified TMEM173 and CHUK mRNAs in serum were measured using QuantiTect SYBR Green PCR kit (Cat. no. 204143, Qiagen, Hilden, Germany) with specific primers for Hs_TMEM173_1_SG QuantiTect Primer Assay (NM_198282) and Hs_CHUK_1_SG QuantiTect Primer Assay (NM_001278) with 500 ng of cDNA added from the undiluted RT reaction to the individual PCR tube, alongside with Hs_GAPDH_1_SG QuantiTect Primer Assay (NM_002046) as the reference gene following the manufacturer’s protocol. Relative expression levels for RP4-605O3.4 and AC074117.2 lncRNAs were analyzed by QuantiNova Probe PCR Kit (Cat. no. 208252; Qiagen, Helman Germany) and QuantiNova LNA Probe PCR Assay for Human RP4-605O3.4 (ENST00000548468) and AC074117.2 (ENST00000417130) supplied by Qiagen. HS_HGDC_2467750 QuantiNova LNA PCR Probe (GeneGlobe ID: UPFH1126608) was used as Reference Assay following the manufacturer’s protocol.
The relative expression levels of hsa-miR (-611, -5192 and -1976) miRNAs in serum were investigated by a miScript SYBRGreen PCR Kit (Cat. no. 218073; Qiagen, Helman Germany), a miScript universal primer and a miRNA‐specific forward primers of (Hs_miR-611 miScript Primer Assay) (Accession: MIMAT0003279) for hsa-miR-611, (Hs_miR-5192 miScript Primer Assay) (Accession: MIMAT0021123) for hsa-miR-5192 and (Hs_miR-1976 miScript Primer Assay) (Accession: MIMAT0009451) for hsa-miR-1976 with RNU‐6 was used as an internal reference control gene. All PCR primers were obtained from Qiagen, and the details of the primers used are supplied in Supplementary Table S8. The PCR program cycling conditions were adjusted according to the type of the measured RNA by the real time cycler Applied Biosystems 7500 (Cat. no. 4351105) according to the manufacturer’s protocol. Tenfold serial dilutions of cDNA (100 ng to 1 pg) were analyzed in duplicate to create a standard curve with at least five points using the PCR Kit with specific primers. We calculate the log of each sample dilution followed by getting the slope of the regression between the log values and the average Ct values. A PCR efficiency of 96% over six logs of template dilution was achieved, and as little as 1 pg of transcript was sensitively detected.
To ensure reproducibility of the assay, dilutions were prepared fresh and PCR reactions were carried out in triplicate experiments. The limit of detection was defined as the lowest dilution of cDNA in which all three replicates resulted in positive amplification. Threshold detection by using Applied Biosystems 7500 software v2.3 (51) that verify all the samples within geometric phase so delta Ct between any two samples remain constant. Applicants specifically were ensured by melting curve analysis. Negative non template control containing master mix and molecular grade water has been used to check any contamination. Melting curve was used to assess primer specificity. The 2−ΔΔCt technique was used to measure the expression of the IR specific RNA‐based candidate genes panel (58). genes were used as an internal control to normalize the raw data of the samples and compare these results to a reference sample. In this study, appropriate standardization strategies were carried out to recognize any experimental error introduced at any stage during extraction and processing of the RNA according to MIQE guidelines (59) (Table S9).
4.4 Statistical analysis
The software package of statistical analysis version 24 (SPSS24, IBM, Chicago, IL, USA) was used to statistically analyze the output data. Quantitative variables were analyzed using the median and the interquartile range (IQR) for the non-parametric data, and the mean ± SD and standard error were used for the raw symmetrically distributed numerical data. One-way ANOVAs and Mann–Whitney U test were also applied as appropriate. chi-Square tests were used to evaluate qualitative variables in number and percentage. Spearman correlation tests were applied to assess the correlations between quantitative variables. The Receiver Operating Characteristic (ROC) curve was used to evaluate the predictive value of the IR associated panel among investigated groups, in order to estimate the best cut-off points for different parameters with optimal sensitivities and specificities. Multivariate analysis was performed to determine the predictive power of different biomarkers for Insulin resistance and prediabetes. A p-value <0.05 was considered statistically significant.
Data availability statement
The original contributions presented in the study are included in the article/Supplementary material. Further inquiries can be directed to the corresponding authors.
Ethics statement
The studies involving human participants were reviewed and approved by Research Ethics Committee, Faculty of Medicine, Ain Shams University, Egypt, dated 21/7/2020, FWA 000017585. The patients/participants provided their written informed consent to participate in this study.
Author contributions
HA shared in funding and supervision. MMe helped in resource acquisition. MH handled supervision, shared in the original draft reviewing. MMa shared in conceptualization, data creation, methodology, visualization, investigation, and reviewing. SA shared in the methodology and investigation. MK participated in formal analysis, validation, and original drafting. All authors contributed to the article and approved the submitted version.
Funding
This study received fund from the Academy of Scientific Research and Technology, Egypt, JESOR call 2019 ID 5090.
Acknowledgments
Authors acknowledge Dr. Dalia Gaber Sos, Associate Professor of Community, Faculty of Medicine, Ain Shams University, and Dr. Maha Magdy Wahdan for their statistical analysis support.
Conflict of interest
The authors declare that the research was conducted in the absence of any commercial or financial relationships that could be construed as a potential conflict of interest.
Publisher’s note
All claims expressed in this article are solely those of the authors and do not necessarily represent those of their affiliated organizations, or those of the publisher, the editors and the reviewers. Any product that may be evaluated in this article, or claim that may be made by its manufacturer, is not guaranteed or endorsed by the publisher.
Supplementary material
The Supplementary Material for this article can be found online at: https://www.frontiersin.org/articles/10.3389/fendo.2023.1131171/full#supplementary-material
Abbreviations
hsa-miR, Homo sapiens-Micro ribonucleic acid; cGAS, Cyclic GMP-AMP synthase; STING, DNA-sensing stimulator of interferon genes; NOD, Nucleotide binding oligomerization domain; MENA, Middle East and North Africa; TMEM173, Transmembrane protein 173; CHUK, Conserved helix–loop–helix ubiquitous kinase; JAK/STAT, Janus kinase/signal transducers and activators of transcription; INF, Interferon; IKK, Inhibitor-κB kinase complex; NF-κB, Nuclear factor-kappa beta; TNM, Tumor (T), nodes (N), and metastases (M); LPS, Lipopolysaccharide; UTR, Untranslated region; ceRNA, Competing endogenous RNA; HbA1c, Glycated hemoglobin; KEGG, Kyoto Encyclopedia of Genes and Genomes; BMI, Body Mass Index; HOMA-IR, Homeostatic Model Assessment of Insulin Resistance; HOMA-B, Homeostatic Model Assessment of beta cell function; rpm, Revolutions per minute; cDNA, Complementary DNA; GAPDH, Glyceraldehyde 3 phosphate dehydrogenase; PCR, Polymerase chain reaction; Alb/Cr. Ratio, Albumin-to-Creatinine ratio ; AUC, Area under the curve; CT, Cycle threshold; ANOVA, Analysis of Variance.
References
1. Kadowaki T, Hara K, Yamauchi T, Terauchi Y, Tobe K, Nagai R. Molecular mechanism of insulin resistance and obesity. Exp Biol Med (2003) 228:1111–7. doi: 10.1177/153537020322801003
2. Jabeen K, Rehman K, Akash MS. Genetic mutations of APOEϵ4 carriers in cardiovascular patients lead to the development of insulin resistance and risk of alzheimer's disease. J Biochem Mol Toxicol (2022) 36(2):e22953. doi: 10.1002/jbt.22953
3. Henstridge DC, Abildgaard J, Lindegaard B, Febbraio MA. Metabolic control and sex: a focus on inflammatory-linked mediators. Br J Pharmacol (2019) 176:4193–207. doi: 10.1111/bph.14642
4. Sun H, Saeedi P, Karuranga S, Pinkepank M, Ogurtsova K, Dunca BB, et al. Diabetes Atlas: Global, regional and country-level diabetes prevalence estimates for 2021 and projections for 2045. Diabetes Research and Clinical Practice (2022) 183:109119.
5. Tinajero MG, Malik VS. An update on the epidemiology of type 2 diabetes: a global perspective. Endocrinol Metab Clinics. (2021) 50:337–55. doi: 10.1016/j.ecl.2021.05.013
6. Khan Y, Hamdy O. Type 2 diabetes in the middle east and north africa (MENA). In: Diabetes mellitus in developing countries and underserved communities. Cham: Springer (2017). p. 49–61. doi: 10.1007/978-3-319-41559-8_4
7. Tabák AG, Herder C, Rathmann W, Brunner EJ, Kivimäki M. Prediabetes: a high-risk state for diabetes development. Lancet (2012) 379:2279–90. doi: 10.1016/S0140-6736(12)60283-9
8. Akash MS, Rehman K, Liaqat A, Numan M, Mahmood Q, Kamal S. Biochemical investigation of gender-specific association between insulin resistance and inflammatory biomarkers in types 2 diabetic patients. Biomed pharmacother (2018) 106:285–91. doi: 10.1016/j.biopha.2018.06.044
9. Bansal N. Prediabetes diagnosis and treatment: a review. World J diabetes. (2015) 6:296. doi: 10.4239/wjd.v6.i2.296
10. Gao H, Luo Z, Ji Y, Tang K, Jin Z, Ly C, et al. Accumulation of microbial DNAs promotes to islet inflammation and β cell abnormalities in obesity in mice. Nat Commun (2022) 13:1–2. doi: 10.1038/s41467-022-28239-2
11. Rehman K, Akash MS. Mechanisms of inflammatory responses and development of insulin resistance: how are they interlinked? J Biomed science. (2016) 23(1):1–8. doi: 10.1186/s12929-016-0303-y
12. Decout A, Katz JD, Venkatraman S, Ablasser A. The cGAS–STING pathway as a therapeutic target in inflammatory diseases. Nat Rev Immunol (2021) 21:548–69. doi: 10.1038/s41577-021-00524-z
13. Motwani M, Pesiridis S, Fitzgerald KA. DNA Sensing by the cGAS–STING pathway in health and disease. Nat Rev Genet (2019) 20:657–74. doi: 10.1038/s41576-019-0151-1
14. Rehman K, Akash MS, Liaqat A, Kamal S, Qadir MI, Rasul A. Role of interleukin-6 in development of insulin resistance and type 2 diabetes mellitus. Crit Reviews™ Eukaryotic Gene Expression. (2017) 27(3):299–36. doi: 10.1615/CritRevEukaryotGeneExpr.2017019712
15. Keskitalo S, Haapaniemi E, Einarsdottir E, Rajamäki K, Heikkilä H, Ilander M, et al. Characterization of novel TMEM173 mutation with additive IFIH1 risk allele. bioRxiv (2018) 3:394353. doi: 10.1101/394353
16. Jin YG, Zhou H, Fan D, Che Y, Wang ZP, Wang SS, et al. TMEM173 protects against pressure overload-induced cardiac hypertrophy by modulating autophagy. J Cell Physiol (2021) 236, 3:, 5176–92. doi: 10.1002/jcp.30223
17. Bai J, Cervantes C, Liu J, He S, Zhou H, Zhang B, et al. DsbA-l prevents obesity-induced inflammation and insulin resistance by suppressing the mtDNA release-activated cGAS-cGAMP-STING pathway. Proc Natl Acad Sci (2017) 114:12196–201. doi: 10.1073/pnas.1708744114
18. Wu C, Wang Z, Song X, Feng XS, Abnet CC, He J, et al. Joint analysis of three genome-wide association studies of esophageal squamous cell carcinoma in Chinese populations. Nat Genet (2014) 46:1001–6. doi: 10.1038/ng.3064
19. Xia T, Konno H, Ahn J, Barber GN. Deregulation of STING signaling in colorectal carcinoma constrains DNA damage responses and correlates with tumorigenesis. Cell Rep (2016) 14:282–97. doi: 10.1016/j.celrep.2015.12.029
20. Li J, An S, Du Z. Familial interstitial lung disease caused by mutation of the STING1 gene. Front Pediatrics. (2020) 8:543. doi: 10.3389/fped.2020.00543
21. Picard C, Thouvenin G, Kannengiesser C, Dubus JC, Jeremiah N, Rieux-Laucat F, et al. Severe pulmonary fibrosis as the first manifestation of interferonopathy (TMEM173 mutation). Chest (2016) 150:e65–71. doi: 10.1016/j.chest.2016.02.682
22. Zhang H, Zeng L, Xie M, Liu J, Zhou B, Wu R, et al. TMEM173 drives lethal coagulation in sepsis. Cell Host Microbe (2020) 27:556–70. doi: 10.1016/j.chom.2020.02.004
23. Schertzer JD, Tamrakar AK, Magalhães JG, Pereira S, Bilan PJ, Fullerton MD, et al. NOD1 activators link innate immunity to insulin resistance. Diabetes (2011) 60:2206–15. doi: 10.2337/db11-0004
24. Li X, Hu Y. Attribution of NF-κB activity to CHUK/IKKα-involved carcinogenesis. Cancers (2021) 13:1411. doi: 10.3390/cancers13061411
25. Asselbergs FW, Guo Y, Van Iperen EP, Sivapalaratnam S, Tragante V, Lanktree MB, et al. Large-Scale gene-centric meta-analysis across 32 studies identifies multiple lipid loci. Am J Hum Genet (2012) 91:823–38. doi: 10.1016/j.ajhg.2012.08.032
26. Rehman K, Haider K, Jabeen K, Akash MS. Current perspectives of oleic acid: regulation of molecular pathways in mitochondrial and endothelial functioning against insulin resistance and diabetes. Rev Endocrine Metab Disord (2020) 21:631–43. doi: 10.1007/s11154-020-09549-6
27. Chi T, Lin J, Wang M, Zhao Y, Liao Z, Wei P. Non-coding RNA as biomarkers for type 2 diabetes development and clinical management. Front Endocrinol (2021) 12. doi: 10.3389/fendo.2021.630032
28. Formichi C, Nigi L, Grieco GE, Maccora C, Fignani D, Brusco N, et al. Non-coding RNAs: novel players in insulin resistance and related diseases. Int J Mol Sci (2021) 22:7716. doi: 10.3390/ijms22147716
29. Li X. MiR-375, a microRNA related to diabetes. Gene (2014) 533:1–4. doi: 10.1016/j.gene.2013.09.105
30. Faheem A, Rehman K, Jabeen K, Akash MS. Nicotine-mediated upregulation of microRNA-141 expression determines adipokine-intervened insulin resistance. Environ Toxicol Pharmacol (2020) 80:103506. doi: 10.1016/j.etap.2020.103506
31. Chen S, Zhang J, Sun L,. Li X, Bai J, Zhang H, Li T. miR-611 promotes the proliferation, migration and invasion of tongue squamous cell carcinoma cells by targeting FOXN3. Oral Dis (2019) 25:1906–18. doi: 10.1111/odi.13177
32. Noth I, Roy J, Schmid R, Vinisko R, Strobel B, Neely ML, et al. Relationship between MRNA-microRNA interactions and forced vital capacity in patients with idiopathic pulmonary fibrosis. InC108. Omics OF COPD AND IPF Am Thorac Soc (2020), A6145–5. doi: 10.1164/ajrccm-conference.2020.201.1_MeetingAbstracts.A6145
33. Akshaya RL, Akshaya N, Selvamurugan N. A computational study of non-coding RNAs on the regulation of activating transcription factor 3 in human breast cancer cells. Comput Biol Chem (2020) 89:107386. doi: 10.1016/j.compbiolchem.2020.107386
34. Schotte D, Moqadam FA, Lange-Turenhout EAM, Chen C, Van IJcken WFJ, Pieters R, et al. Discovery of new microRNAs by small RNAome deep sequencing in childhood acute lymphoblastic leukemia. Leukemia (2011) 25:1389–99. doi: 10.1038/leu.2011.105
35. Wang J, Ma G, Han X, Liang M, Wang X, Xia T, et al. The low expression of miR-1976 in plasma samples indicating its biological functions in the progression of breast cancer. Clin Trans Oncol (2020) 22:2111–20. doi: 10.1007/s12094-020-02361-3
36. Qiu F, Wu Y, Cole MH, Xie G, Cao H, Du M, et al. MiRNA-1976 regulates the apoptosis of dopaminergic neurons by targeting the PINK1 gene. J Integr Neurosci (2023) 22(2):45. doi: 10.31083/j.jin2202045
37. García-Lacarte M. Implication of miR-612 and miR-1976 in the regulation of TP53 and CD40 and their relationship in the response to specific weight-loss diets. PLoS ONE (2018) 13:e0201217. doi: 10.1371/journal.pone.0201217
38. DiStefano JK. The emerging role of long noncoding RNAs in human disease. Dis Gene Identificat (2018) 2:91–110. doi: 10.1007/978-1-4939-7471-9_6
39. Matthews DR, Hosker JP, Rudenski AS, Naylor BA, Treacher DF, Turner RC. Homeostasis model assessment: insulin resistance and β-cell function from fasting plasma glucose and insulin concentrations in man. Diabetologia (1985) 28:412–9. doi: 10.1007/BF00280883
40. Wallace TM, Levy JC, Matthews DR. Use and abuse of HOMA modeling. Diabetes Care (2004) 27:1487–95. doi: 10.2337/diacare.27.6.1487
41. Metsalu T, Vilo J. ClustVis: a web tool for visualizing clustering of multivariate data using principal component analysis and heatmap. Nucleic Acids Res (2015) 43:W566–70. doi: 10.1093/nar/gkv468
43. Marques-Vidal P, Mazoyer E, Bongard V, Gourdy P, Ruidavets JB, Drouet L, et al. Prevalence of insulin resistance syndrome in southwestern France and its relationship with inflammatory and haemostatic markers. Diabetes Care (2002) 25:1371–7. doi: 10.2337/diacare.25.8.1371
44. Esteghamati A, Ashraf H, Khalilzadeh O, Zandieh A, Nakhjavani M, Rashidi A, et al. Optimal cut-off of homeostasis model assessment of insulin resistance (HOMA-IR) for the diagnosis of metabolic syndrome: third national surveillance of risk factors of non-communicable diseases in Iran (SuRFNCD-2007). Nutr Metab (Lond). (2010) 7:7–26. doi: 10.1186/1743-7075-7-26
45. Lee JH, Kim DY, Pantha R, Lee EH, Bae JH, Han E, et al. Identification of pre-diabetic biomarkers in the progression of diabetes mellitus. Biomedicines (2021) 10:72. doi: 10.3390/biomedicines10010072
46. Bai J, Liu F. The cGAS-cGAMP-STING pathway: a molecular link between immunity and metabolism. Diabetes (2019) 68:1099–108. doi: 10.2337/dbi18-0052
47. Gray EE, Treuting PM, Woodward JJ, Stetson DB. Cutting edge: cGAS is required for lethal autoimmune disease in the Trex1-deficient mouse model of aicardi-Gou-tières syndrome. J Immunol (2015) 195:1939–43. doi: 10.4049/jimmunol.1500969
48. Akash MS, Rehman K, Liaqat A. Tumor necrosis factor-alpha: role in development of insulin resistance and pathogenesis of type 2 diabetes mellitus. J Cell Biochem (2018) 119(1):105–10. doi: 10.1002/jcb.26174
49. Hayden MS, Ghosh S. NF-κB, the first quarter-century: remarkable progress and outstanding questions. Genes Dev (2012) 26:203–34. doi: 10.1101/gad.183434.111
50. LaPierre MP, Stoffel M. MicroRNAs as stress regulators in pancreatic beta cells and diabetes. Mol Metab (2017) 6:1010–23. doi: 10.1016/j.molmet.2017.06.020
51. Seyhan AA, Nunez Lopez YO, Xie H, Yi F, Mathews C, Pasarica M. Pratley RE. Pancreas-enriched miRNAs are altered in the circulation of subjects with diabetes: a pilot cross-sectional study. Sci Rep (2016) 6:31479. doi: 10.1038/srep31479
52. Sathishkumar C, Prabu P, Mohan V, Balasubramanyam M. Linking a role of lncRNAs (long non-coding RNAs) with insulin resistance, accelerated senescence, and inflammation in patients with type 2 diabetes. Hum Genomics (2018) 12:1–9. doi: 10.1186/s40246-018-0173-3
53. O'Brien J, Hayder H, Zayed Y, Peng C. Overview of MicroRNA biogenesis, mechanisms of actions, and circulation. Front Endocrinol (Lausanne). (2018) 9:402. doi: 10.3389/fendo.2018.00402
54. Gao L, Zhao Y, Ma X, Zhang L. Integrated analysis of lncRNA–miRNA–mRNA ceRNA network and the potential prognosis indicators in sarcomas. BMC Med Genomics (2021) 14:1–3. doi: 10.1186/s12920-021-00918-x
55. Ortiz-Martínez M, González-González M, Martagón AJ, Hlavinka V, Willson RC, Rito-Palomares M. Recent developments in biomarkers for diagnosis and screening of type 2 diabetes mellitus. Curr Diabetes Rep (2022) 3:1–21. doi: 10.1007/s11892-022-01453-4
56. Pielok A, Marycz K. Non-coding RNAs as potential novel biomarkers for early diagnosis of hepatic insulin resistance. Int J Mol Sci (2020) 21:4182. doi: 10.3390/ijms21114182
57. American Diabetes Association Professional Practice Committee. 2. classification and diagnosis of diabetes: standards of medical care in diabetes. Diabetes Care (2022) 45:S17–38. doi: 10.2337/dc22-S002
58. Livak KJ, Schmittgen TD. Analysis of relative gene expression data using real-time quantitative PCR and the 2(-delta delta C(T)) method. Methods (2001) 25:402–8. doi: 10.1006/meth.2001.1262
Keywords: insulin resistance, pre-diabetes, type 2 diabetes mellitus, bioinformatics, biomarkers, non-coding RNA
Citation: Ali HS, Kamel MM, Agwa SHA, Hakeem MSA, Meteini MSE and Matboli M (2023) Analysis of mRNA-miRNA-lncRNA differential expression in prediabetes/type 2 diabetes mellitus patients as potential players in insulin resistance. Front. Endocrinol. 14:1131171. doi: 10.3389/fendo.2023.1131171
Received: 24 December 2022; Accepted: 10 April 2023;
Published: 08 May 2023.
Edited by:
Marcia Hiriart, Universidad Nacional Autonoma de Mexico, MexicoReviewed by:
Zhelong Liu, Huazhong University of Science and Technology, ChinaMuhammad Sajid Hamid Akash, Government College University, Faisalabad, Pakistan
Copyright © 2023 Ali, Kamel, Agwa, Hakeem, Meteini and Matboli. This is an open-access article distributed under the terms of the Creative Commons Attribution License (CC BY). The use, distribution or reproduction in other forums is permitted, provided the original author(s) and the copyright owner(s) are credited and that the original publication in this journal is cited, in accordance with accepted academic practice. No use, distribution or reproduction is permitted which does not comply with these terms.
*Correspondence: Hebatalla Said Ali, aGViYXRhbGxhaHNhaWRAbWVkLmFzdS5lZHUuZWc=; Marwa Mostafa Kamel, TWFyd2Eua2FtZWw4OEBtZWQuYXN1LmVkdS5lZw==; Marwa Matboli, ZHJtYXJ3YV9tYXRib2x5QG1lZC5hc3UuZWR1LmVn