 Ya-Nan Su1,2†
 Mei-Jiao Wang2,3†Jun-Pu Yang2Xiang-Lu Wu2Min Xia4
 Mei-Hua Bao5
 Yu-Bin Ding2Qian Feng2,4,6*
 Li-Juan Fu1,2,5*
- 1Department of Herbal Medicine, Chongqing Key Laboratory of Traditional Chinese Medicine for Prevention and Cure of Metabolic Diseases, School of traditional Chinese Medicine, Chongqing Medical University, Chongqing, China
- 2Joint International Research Laboratory of Reproduction and Development of the Ministry of Education of China, School of Public Health, Chongqing Medical University, Chongqing, China
- 3Department of Physiology, School of Basic Medicine, Chongqing Medical University, Chongqing, China
- 4Department of Gynecology, Chongqing Hospital of Traditional Chinese Medicine, Chongqing, China
- 5Department of Pharmacology, Academician Workstation, Changsha Medical University, Changsha, China
- 6Department of Obstetrics and Gynecology, Chongqing General Hospital, University of Chinese Academy of Sciences, Chongqing, China
Background: Polycystic ovarian syndrome (PCOS) is a common endocrine disorder characterized by hyperandrogenism, ovarian dysfunction and polycystic ovarian morphology. Gut microbiota dysbiosis and metabolite are associated with PCOS clinical parameters. Yulin Tong Bu formula (YLTB), a traditional Chinese medicine formula, has been recently indicated to be capable of ameliorating polycystic ovary symptoms and correcting abnormal glucose metabolism. However, the therapeutic mechanism of YLTB on PCOS has not been fully elucidated.
Methods: A pseudo sterile mouse model was established during this four-day acclimatization phase by giving the animals an antibiotic cocktail to remove the gut microbiota. Here, the therapeutic effects of YLTB on PCOS were investigated using dehydroepiandrosterone plus high-fat diet-induced PCOS mice model. Female prepuberal mice were randomly divided into three groups; namely, the control group, PCOS group and YLTB (38.68 g·kg-1·day-1) group. To test whether this effect is associated with the gut microbiota, we performed 16S rRNA sequencing studies to analyze the fecal microbiota of mice. The relationships among metabolites, gut microbiota, and PCOS phenotypes were further explored by using Spearman correlation analysis. Then, the effect of metabolite ferulic acid was then validated in PCOS mice.
Results: Our results showed that YLTB treatment ameliorated PCOS features (ovarian dysfunction, delayed glucose clearance, decreased insulin sensitivity, deregulation of glucolipid metabolism and hormones, etc.) and significantly attenuated PCOS gut microbiota dysbiosis. Spearman correlation analysis showed that metabolites such as ferulic acid and folic acid are negatively correlated with PCOS clinical parameters. The effect of ferulic acid was similar to that of YLTB. In addition, the bacterial species such as Bacteroides dorei and Bacteroides fragilis were found to be positively related to PCOS clinical parameters, using the association study analysis.
Conclusion: These results suggest that YLTB treatment systematically regulates the interaction between the gut microbiota and the associated metabolites to ameliorate PCOS, providing a solid theoretical basis for further validation of YLTB effect on human PCOS trials.

Graphical abstract
1 Introduction
Polycystic ovarian syndrome (PCOS) is a common endocrine disorder, from which 6-10% of reproductive females suffer severely (1, 2). The features of PCOS include hyperandrogenism, ovarian dysfunction and polycystic ovarian morphology (1–3). Usually, the disease is accompanied with insulin resistance (IR), obesity and metabolic disorders (4). Among metabolic disorders, dyslipidemia is characterized by increased levels of total cholesterol (TC), triglycerides (TG) and low-density lipoprotein cholesterol (LDL-C), but decreased levels of high-density lipoprotein cholesterol (HDL-C) (5).
The changes in those metabolites are often induced in human PCOS with high testosterone (T) levels (1) and obese (4) as well as gut microbiota disorder (6, 7). The gut microbiota is a complex ecosystem involved in host metabolic homeostasis, energy balance and immune modulation (8), which includes bacteria, fungi, viruses and protozoa (9). The diversity of gut microbiota can be divided into α or β diversity. The former refers to the species diversity within a community, and β diversity depicts the clustering of gut microbiota communities, mainly focusing the differences among different communities (10). The 16S rRNA sequencing studies have shown that disruption of the diversity and relative abundance of gut microbiota occurs during PCOS development (11). Gut microbiota dysbiosis is correlated with clinical parameters of PCOS women such as T, luteinizing hormone/follicle stimulating hormone (LH/FSH), LH, IR, fasting blood glucose (FBG), body mass index (BMI) and TG (12, 13). Fecal microbiota transplantation (FMT) of PCOS women into the germ-free mice led to variations in the levels of serum glucose, insulin (INS) and sex hormones (14). Consistently, increased Bacteroides vulgatus abundance resulted in ovarian dysfunction and metabolic disorders in the same germ-free mice (14).
In addition to those metabolites mentioned above, more have been reported to be associated with the gut microbiota of PCOS patients or rodent animals (14–16). For example, stachyose has a significantly negative correlation with Ruminococcus 2 and regulates estrous cycle disorder, polycystic ovary morphology and T levels in PCOS rats (15). The levels of short-chain fatty acids (SCFAs) are decreased in PCOS rats (17), which play key functional regulatory roles in inflammation dissipation (18), IR and glucose tolerance (19). In addition, the levels of glyodeoxycholic acid (GDCA) and taurine deoxycholic acid (TUDCA) are negatively correlated with the abundance of Bacteroides vulgatus in the intestinal microbiota of PCOS patients (14).
The relationships among metabolites, gut microbiota, and PCOS sheds light on the development of novel treatments against PCOS. Currently, gonadotropins, clomiphene citrate and metformin have been clinically applied (20), but with many side effects such as ovarian hyperstimulation syndrome (21), drug resistance (22) and gastrointestinal distress (23, 24). Some of these could be avoided by using traditional Chinese medicine (TCM), such as FuFang ZhenZhu TiaoZhi formula (25), Bu Shen Hua Zhuo formula (26) and Liuwei Dihuang Pills (27). In TCM theory, the key pathogenesis of PCOS is based on “phlegm-dampness block and spleen-kidney deficiency”. Based on Buzhong Yiqi Decoction, which derived from Fu Qing Zhu Nv Ke and the key pathogenesis of PCOS, we created a decoction named as Yulin Tong Bu formula (YLTB). Our research team has been using the YLTB formula in the clinical treatment of PCOS for many years, and earlier clinical trials have shown that YLTB formula could improve the therapeutic effect of metformin (28). YLTB is made of 12 traditional Chinese herbs (listed in Table 1). Out of them, Astragalus mongholicus Bunge, Actaea cimicifuga L., Citrus × aurantium L. and Poria cocos (Schw.)Wolf were reported to impact metabolite levels and gut microbiota (29–33). For example, Citrus × aurantium L., mainly containing nobiletin, could improve high-fat diet (HFD)-induced obesity, deregulate intestinal lipid metabolism, and reshape gut microbiota (29, 30). Astragalus mongholicus Bunge includes soyasaponin I and formononetin, which can reshape gut microbiota (34), inhibit obesity and dyslipidemia, reduce IR and improve glucose homeostasis (35–37). Although these studies suggest the potential therapeutic effect of YLTB against PCOS, the molecular mechanism underlying it remains unclear.
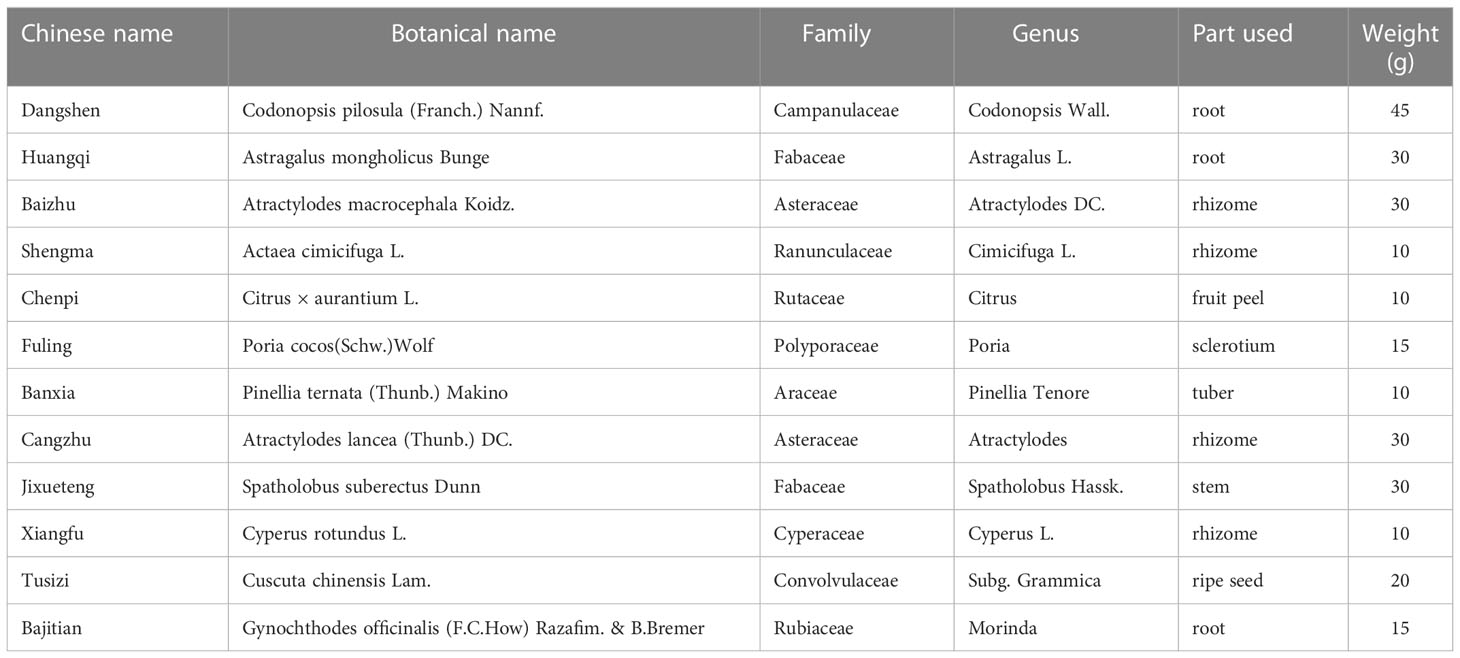
Table 1 The Chinese herb drugs contained in YLTB.
In this study, we determined the therapeutic effect of YLTB on PCOS using dehydroepiandrosterone (DHEA) plus HFD-induced PCOS mice model. The mechanism could be explained by the ability of YLTB to orchestrate gut microbiota and the related metabolites. Compared with the control mice, PCOS mice presented a series of syndromes such as ovarian dysfunction, delayed glucose clearance, decreased insulin sensitivity, and metabolic deregulation of lipid as well as hormones. Those syndromes in PCOS mice can be greatly ameliorated by YLTB treatment. The 16S rRNA sequencing analysis was applied to demonstrate the landscape of gut microbial composition in PCOS mice. We found that the dysbiosis of PCOS gut microbiota was significantly attenuated by YLTB treatment. The correlation between gut microbiota and fecal metabolites in mice was further investigated by the association study analysis, combined with LC−MS (liquid chromatography-mass sectromety)-based metabolic sequencing analysis. The analysis results predicted that metabolites such as ferulic acid, folic acid, menaquinone and phylloquinone are negatively correlated with bacterial species such as Bacteroides dorei and Bacteroides fragilis. These bacteria were positively correlated with the PCOS clinical parameters such as TC, LH, FBG, and insulin resistance index in the homeostasis model (HOMA-IR). In addition, the therapeutic effect of ferulic acid was validated in PCOS mice, similar to YLTB effect. Taken together, YLTB treatment systematically regulate the interaction between gut microbiota and the associated metabolites to ameliorate PCOS.
2 Materials and methods
2.1 Preparation of Yulin Tong Bu formula
The herb details of YLTB are presented in Table 1. The clinical dose of YLTB was 255g (28), 45 g Dangshen (Codonopsis pilosula (Franch.) Nannf.), 30 g Huangqi (Astragalus mongholicus Bunge), 30 g Baizhu (Atractylodes macrocephala Koidz.), 10 g Shengma (Actaea cimicifuga L.), 10 g Chenpi (Citrus × aurantium L.), 15 g Fuling (Poria Cocos (Schw.) Wolf.), 10 g Banxia (Pinellia ternata (Thunb.) Makino), 30 g Cangzhu (Atractylodes Lancea (Thunb.) Dc.), 30 g Jixueteng (Spatholobus Suberectus Dunn), 10 g Xiangfu (Cyperus rotundus L.), 20 g Tusizi (Cuscuta chinensis Lam.), and 15 g Bajitian (Gynochthodes officinalis (F.C.How) Razafim. & B.Bremer), respectively. The Chinese herbs were purchased from Chongqing Hospital of Traditional Chinese Medicine. They were then suspended in distilled water at room temperature for one hour to soften the raw materials and facilitate the extraction of water-soluble ingredients in subsequent steps. The herbs were boiled for two hours and passed through filter paper. The process lasted two times followed by concentrating a decoction at 100°C, to obtain the extracts of YLTB containing 2.55-g raw herbs/mL. In this paper, the dosages of YLTB used in mice were converted from clinical dosage using the following equation (38, 39):
Where Dm is the administrated dose of YLTB for mouse in the present work, Dh is the clinical dose of YLTB, W is the weight of human body, F is the dose conversion factor of mouse and human. W is set as 60 kg. Considering the dose conversion factor of 9.1 between mouse and human, the high dosage is 38.68 g/kg, the medium dosage is 19.34 g/kg, and the low dosage is 9.67 g/kg.
2.2 Liquid chromatography–mass spectrometry
ACQUITY UPLC HSS T3 (2.1 × 100 mm 1.8 m columns) was used for liquid chromatography–mass spectrometry (LC-MS) (Waters, UPLC; Thermo, Q Exactive). The following chromatographic separation conditions were used: column temperature, 40°C; flow rate, 0.30 mL/min; mobile phase A, water + 0.05 percent formic acid; mobile phase B, acetonitrile; injection volume, 2 μL; automatic injector temperature, 4°C. The MS parameters are as follow: ESI+: spray voltage, 3.0 (ESI+) or 3.2 (ESI-) kV; S-Lens RF level, 30% (ESI+) or 60% (ESI-); heater temperature, 300 °C; sheath gas flow rate, 45 arb; auxiliary gas flow rate, 15 arb; sweep gas flow rate, 1arb; capillary temperature, 350°C. Scan duration is 100 ms, interscan time is 50 ms, and the scan range is 70-1050 m/z. Data was analyzed using Compound Discoverer 3.1 software (Thermo Fisher Scientific,USA), normalized, and converted into a two-dimensional matrix using Excel 2010 software, containing retention time, compound molecular weight, observations (samples), and peak intensity (39, 40).
2.3 Animals and treatment
Female prepuberal C57BL/6 (21-d-old) mice (specific pathogen-free, Animal Qualification Certificate No.2022109) were purchased from the Animal Management Center of Chongqing Medical University. The mice were maintained under standard circumstances (22-24 °C, 50% relative humidity, 12-hour dark/light cycle) with unrestricted access to food and water. The Institutional Animal Care and Use Committee of Chongqing Medical University authorized all mouse experimental procedures (Chongqing, China). Mice were given four days to adjust to their new surroundings before being tested. A pseudo sterile mouse model was established during this four-day acclimatization phase by giving the animals an antibiotic cocktail (ABX) to remove the gut microbiota. Freshly prepared antibiotic cocktail comprised 1 mg mL−1 ampicillin sodium (1146GR005, Biofroxx, Einhausen, Germany), 1 mg mL−1 neomycin sulfate (N814740-5G, MACKUN, Shanghai, China), 1 mg mL−1 metronidazole (M1547-5G, Sigma−Aldrich, MO, USA), and 0.5 mg mL−1 vancomycin hydrochloride (#1161GR1001, Biofroxx, Einhausen, Germany) in drinking water, and the mice were given autoclaved drinking water four days later.
According to the preliminary experiment (Figure S1), 30 mice were randomly divided into six groups (n = 5) to optimize the dosage of YLTB: control group, PCOS group, high dosage YLTB group [YLTB (H), 38.68 g·kg-1·day-1], medium dosage YLTB group [YLTB (M), 19.34 g·kg-1·day-1], low dosage YLTB group [YLTB (L), 9.67 g kg-1·day-1], and metformin group (positive control, 250 mg kg-1·day-1, #D150959-5G, Sigma−Aldrich, MO, USA). To establish the PCOS group, mice were fed a high-fat diet (HFD, 60% kcal% fat; #D12492, Research Diets, Inc., NB, USA) and received daily subcutaneous injections of DHEA (#252805-10GM, Millipore, CA, USA; 60 mg/kg, dissolved in 0.1 ml of sesame oil) (41, 42). To determine the most effective YLTB dosage for PCOS, mice were fed an HFD, gavaged with various YLTB dosages, and injected with DHEA on the same day. The control group was fed a normal chow diet (NCD) and injected daily with sesame oil (#8008-74-0, Acros, BE, USA).
In order to verify the effects of high dose YLTB group on glucolipid metabolism, intestinal microbiota and fecal metabolism of PCOS mice, 30 mice were randomly divided into three groups (n = 10), namely, the control group, PCOS group and YLTB group (38.68 g·kg-1·day-1). To test the efficacy of the metabolite ferulic acid, 40 mice were randomly divided into four groups (n = 10), namely, the control group, PCOS group, FA1 group (50 mg·kg-1·day-1) and FA2 group (100 mg·kg-1·day-1) (33, 43). For FA groups, mice were fed an HFD and subcutaneously injected with DHEA daily, as well as administered ferulic acid (purity > 99.00%, #128708, Sigma−Aldrich, MO, USA, dissolved in lukewarm water) by oral gavage every day.
The mice mentioned above were all treated for 20 days. At the end of the experiment, mice were fasted over 12 hours and anesthetized by intraperitoneal injection of 10% chloral hydrate with 0.1 mL/10 g, and then weighed, measured to determine the distance from the tip of the nose to the anus, and tested for fasting blood glucose and oral glucose tolerance tests (OGTTs). The serum was collected and centrifuged for 20 minutes at 3,000 rpm to measure insulin and sex hormones. The ovaries and uteri of mice were collected, weighed, and wax-fixed or snap-frozen and stored at –80 °C for further use.
2.4 Estrous cycle determination
From the 11th to the 20th day of the gavage treatment, vaginal smears of mice were collected every day. The estrous cycle stage was determined by microscopic analysis of the predominant cell type in vaginal smears.
2.5 Measurement of serum biochemical markers
Enzyme-linked immunosorbent assay (ELISA) kits were used to determine serum testosterone, luteinizing hormone (LH), follicle stimulating hormone (FSH) and serum insulin levels (#JL25196, #JL10432, #JL10329, #JL11459, Shanghai Jianglai Biology, Shanghai, China). A glucometer was used to evaluate blood glucose. The homeostatic model assessment of IR (HOMA-IR) index was calculated using the formula: [FBG (mmol/L)] × [FINS (lU/mL)]/22.5. After an overnight fast, the oral glucose tolerance tests (OGTTs) were administered via oral gavage of 2 g/kg glucose. The blood glucose level of the mice was tested using blood glucose test paper at 0, 15, 30, 60, 90, and 120 minutes. At least 5 mice were used for these experiments.
2.6 Body weight, Lee’s index analysis, BMI and lipid profile analysis
Every four days, the mice weight was recorded. The length from the tip of the nose to the anus of the mouse was measured after anesthesia, and the Lee’s index and BMI were calculated (Lee’s index = [Body mass (g) × 1000]1/3/body length (cm), BMI=body weight (kg)/body length (m2)). Biochemical analysis kits were used to assess serum lipid profiles, including TC, TG, HDL-C, and LDL-C (#A111-1-1, #A110-1-1, #A112-1-1, #A113-1-1; Nanjing Jiancheng Bioengineering Institute, Nanjing, China).
2.7 Tissue processing and H&E staining
Mouse ovaries were harvested, fixed with 4% paraformaldehyde (#BL539A, Biosharp) and embedded in paraffin. Hematoxylin and eosin (H&E) kits were used to stain ovary sections to observe follicle changes. Sections of 5 μm were placed on glass slides, with 40 μm discarded between each section; six sections from each ovary were collected. These tests required at least 5 mice per group (44, 45).
2.8 16S rRNA sequencing
The fecal pellets were collected in sterile cryopreservation tubes immediately after being discharged before sacrifice. Before analysis, the fecal samples were snap-frozen and stored at –80 °C. Fecal samples were sent to Novogene (Beijing, China) for 16S RNA sequencing. DNA was extracted from mouse fecal samples using a Magnetic Soil and Stool DNA Kit (#DP712, Tiangen). DNA concentration and purity were measured on 1% agarose gels. DNA was diluted to 1 ng/μL in sterile water according to the concentration.
The V3–V4 hypervariable region of the 16S rRNA gene was amplified by PCR at 98 °C for 1 minute, followed by 30 cycles of denaturation at 98 °C for 10 seconds, annealing at 50 °C for 30 seconds, elongation at 72 °C for 30 seconds, and final incubation at 72 °C for 5 minutes. The common primer pair (515F5′-CCTAYGGGRBGCASCAG-3’; 806R5′-GGACTACNNGGGTATCTAAT-3′) was used to amplify the bacterial 16S rRNA gene. All PCRs were carried out with 15 µL of Phusion® High-Fidelity PCR Master Mix (#M0531S, New England Biolabs, MA, USA), 2 μM primers, and 10 ng template DNA. The amplification products were isolated using a 2% agarose gel and purified with a Universal DNA Purification Kit (#DP214, Tiangen, Beijing, China). The NEB Next® Ultra DNA Library Prep Kit (#E7370L, Illumina, CA, USA) was used for library construction. The established library was detected by an Agilent Bioanalyzer 5400 system and quantified by Q-PCR. Finally, the library was sequenced on an Illumina NovaSeq platform (Illumina Novaseq6000, Illumina, CA, USA), and 250 bp paired-end reads were generated (46).
2.9 Fecal metabolic profiling
Individual mouse feces samples (100 mg) were crushed in liquid nitrogen before being resuspended in prechilled 80% methanol using a well vortex (n = 6). The samples were placed on ice for 5 minutes before being centrifuged at 15,000 g and 4 °C for 20 minutes. LC−MS grade water was used to dilute some of the supernatant to a final concentration of 53% methanol. The samples were then transferred to a new tube and centrifuged at 15,000 g and 4 °C for 20 minutes. The supernatant was then injected into the LC−MS/MS apparatus for analysis.
UHPLC−MS/MS analyses were carried out using a Vanquish UHPLC system (ThermoFisher) paired with an Orbitrap Q ExactiveTM HF mass spectrometer (Thermo Fisher) by Novogene. Using a 17-min linear gradient at a flow rate of 0.2 mL/min, samples were injected onto a Hypersil Gold column (100 × 2.1 mm, 1.9 μm). Eluent A (0.1% formic acid in water) and eluent B (methanol) served as the eluents for the positive polarity mode. Eluent A (5 mM ammonium acetate, pH 9.0) and eluent B (methanol) were the eluents for the negative polarity mode. The solvent gradient was set as follows: 2% B, 1.5 min; 2-85% B, 3 min; 100% B, 10 min; 100-2% B, 10.1 min; 2% B, 12 min. The Q ExactiveTM HF mass spectrometer was operated in positive/negative polarity mode, with a spray voltage of 3.5 kV, capillary temperature at 320°C, sheath gas flow rate at 35 arb and aux gas flow rate at 10 arb, S-lens RF level at 60 and aux gas heater temperature at 350°C.
Compound Discoverer 3.1 (CD3.1, ThermoFisher) was used to analyze the raw data files produced by UHPLC−MS/MS to perform peak alignment, peak selection, and quantification for each metabolite. The primary parameters were established: retention time tolerance, 0.2 minutes; actual mass tolerance, 5 ppm; signal intensity tolerance, 30%; signal/noise ratio, 3; and minimum intensity. Peak intensities were then normalized to reflect the total spectral intensity. Based on additive ions, molecular ion peaks, and fragment ions, the normalized data were utilized to predict the molecular formula. To obtain correct qualitative and relative quantitative results, peaks were matched with the MassList, mzCloud (https://www.mzcloud.org/), and mzVault databases (46).
Statistical analyses were carried out using the statistical tools R (R version R-3.4.3), Python (Python 2.7.6 version) and CentOS (CentOS release 6.6). The KEGG, HMDB, and LIPIDMaps databases were used to annotate these metabolites. MetaX was used to perform partial least squares discriminant analysis (PLS-DA) and principal components analysis (PCA). Univariate analysis (t test) was used to determine statistical significance (P value). VIP > 1 and P value < 0.05, as well as fold change ≥ 2 or FC ≤ 0.5, were deemed to indicate differential metabolites. The data for clustering heatmaps were standardized using z scores of differential metabolite intensity areas and plotted using the Pheatmap package in R language.
2.10 Data and statistical analysis
GraphPad Prism version 8.3 was used to analyze all data, which were then displayed as the means ± standard error of the mean (SEM). When P < 0.05, the results were considered statistically significant. Each variable was tested for differences among three or more groups using one-way or two-way analysis of variance (ANOVA) followed by Tukey’s multiple comparisons test to assess statistical significance. The cor.test function from the stats R package was used to perform a Spearman correlation among the levels of fecal metabolites, phenotype, and relative abundance of species. We only performed the correlation for those species (P < 0.05), phenotypes (P < 0.05) and metabolites (P < 0.05 VIP>1) that were statistically significant across groups.
3 Results
3.1 Chemical composition and LC-MS analysis of YLTB
LC-MS analysis data of YLTB was performed using feature extraction and preprocessing with Compound Discoverer 3.1 software, normalized, and edited into a two-dimensional matrix using Excel 2010 software, including retention time, compound molecular weight, observations (samples), peak intensity and library matching (based on mzCloud and mzVault database, the mzVault include OTCML, KEGG and Chemspider database). The aim of this method was to complete the target screening without standard products. Several ingredients in YLTB were identified (Figure 1A, Table 2 and 3). The following seven important compounds were distinguishable, as shown in Figure 1B: (I) Nobiletin, (II) Tangeritin, (III) Berberine, (IV) Quercetin, (V) Catechin, (VI) Chlorogenic acid, and (VII) Liquiritigenin.
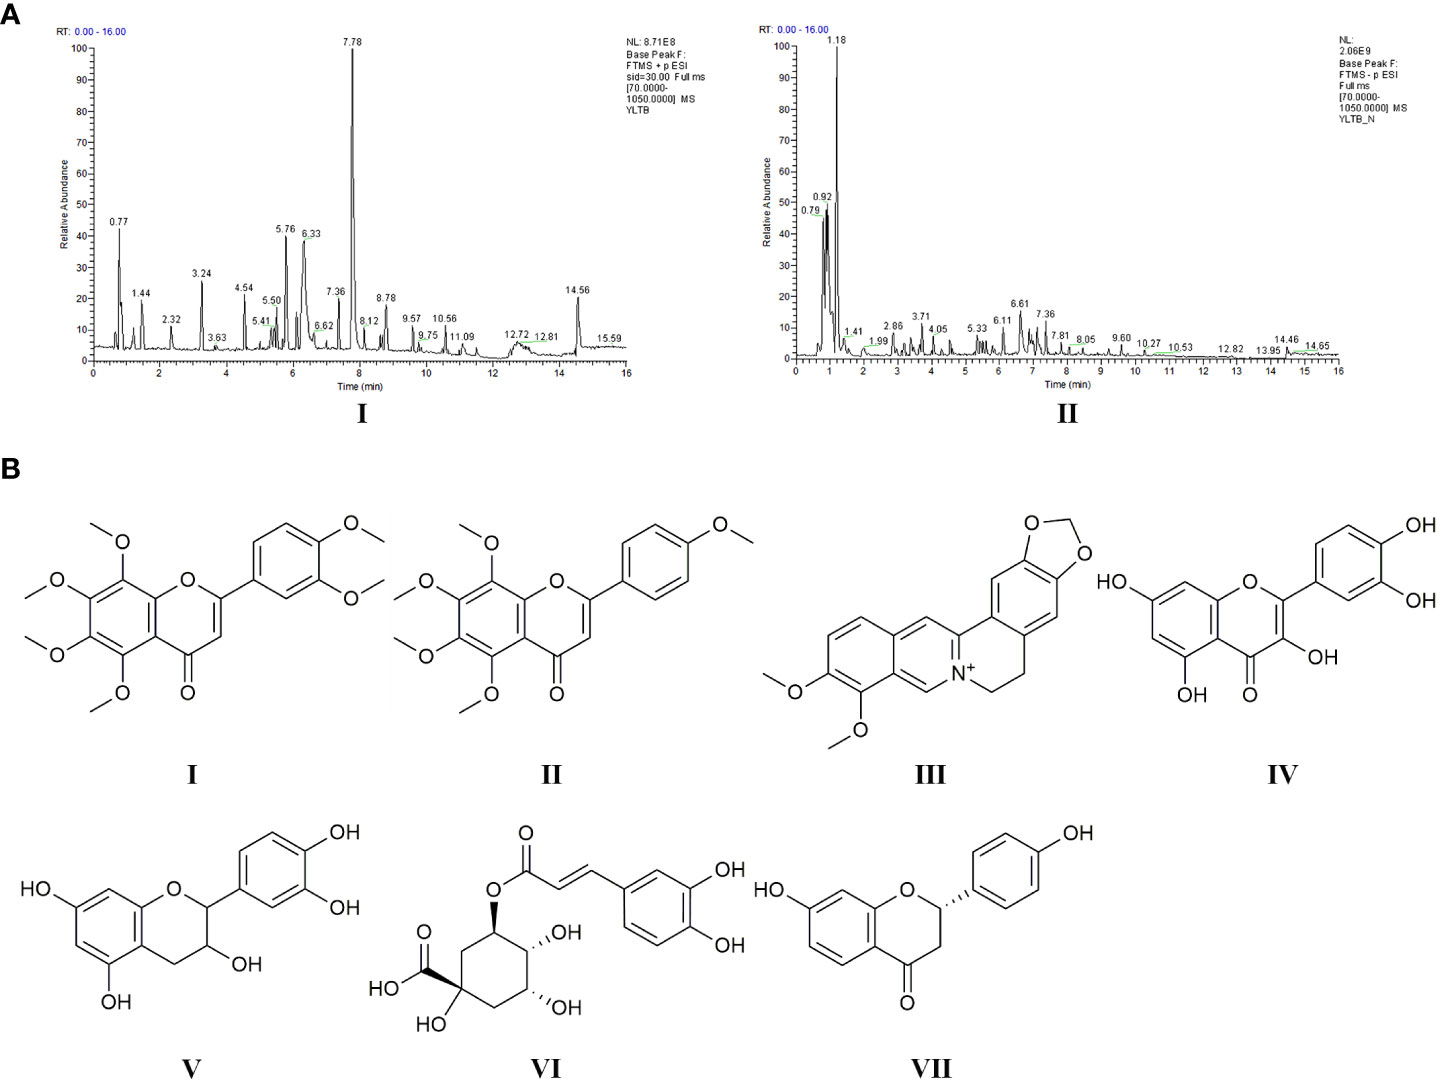
Figure 1 Chemical ingredients and LC-MS analysis of YLTB. (A) The total ion flow diagram for YLTB. I. Positive ion mode. II. Negative ion mode. (B) The molecular structures of seven important compounds identified in the analysis. I Nobiletin. II. Tangeritin. III. Berberine. IV. Quercetin. V;.Catechin. VI. Chlorogenic acid. VII. Liquiritigenin. RT, Run Time.
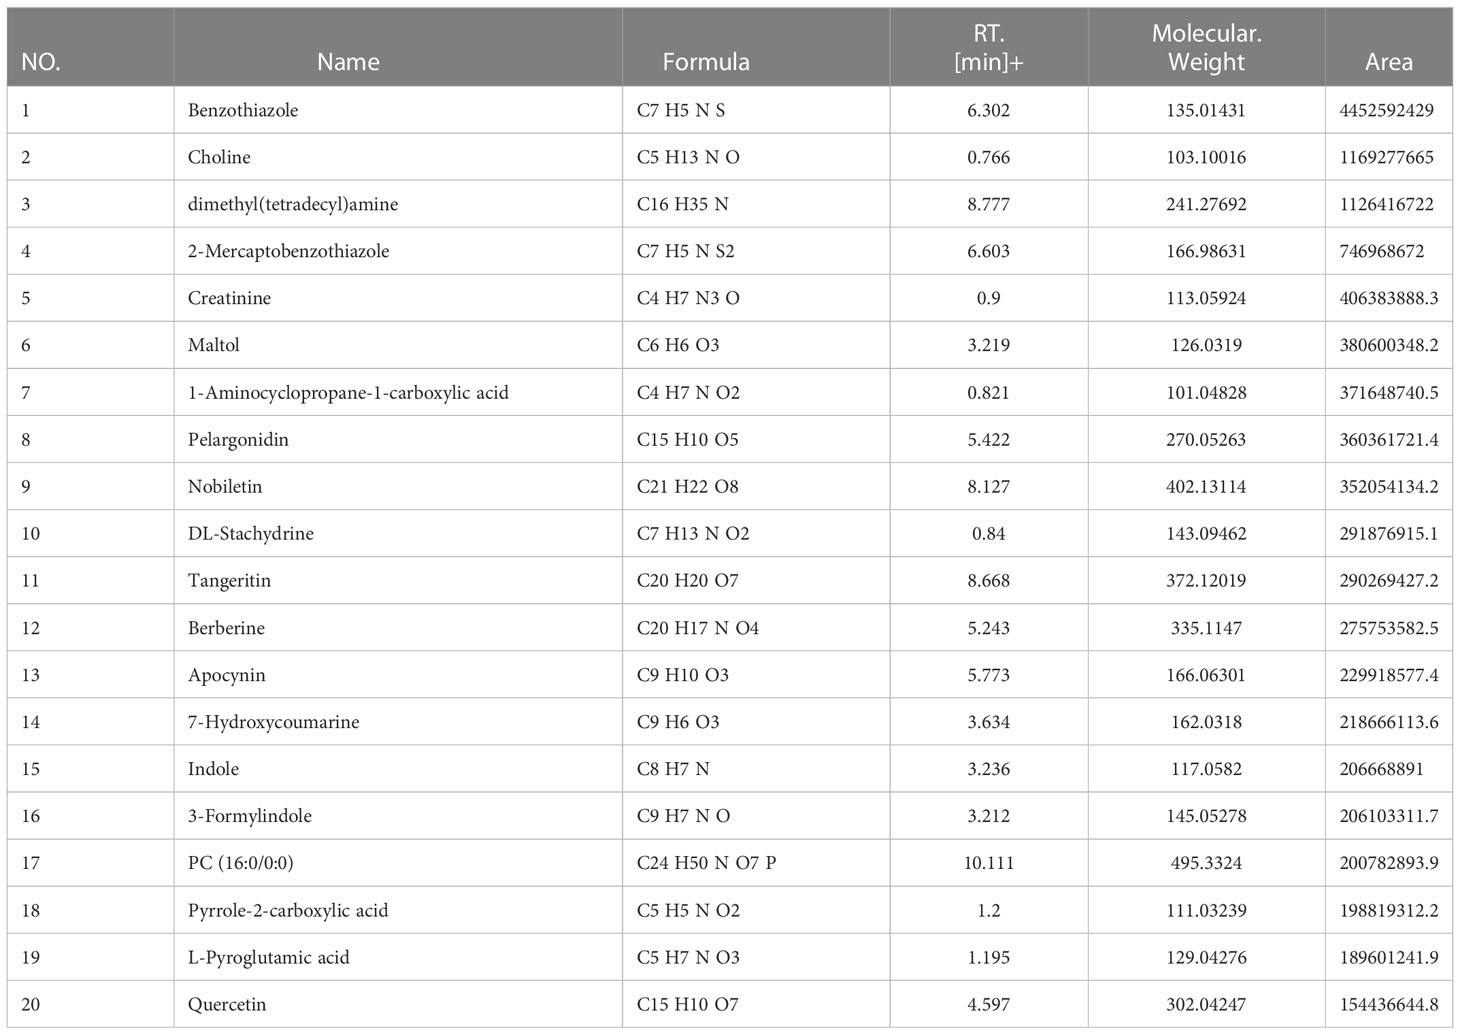
Table 2 LC-MS analysis data and the top 20 primary elemental composition of YLTB in positive ion mode.
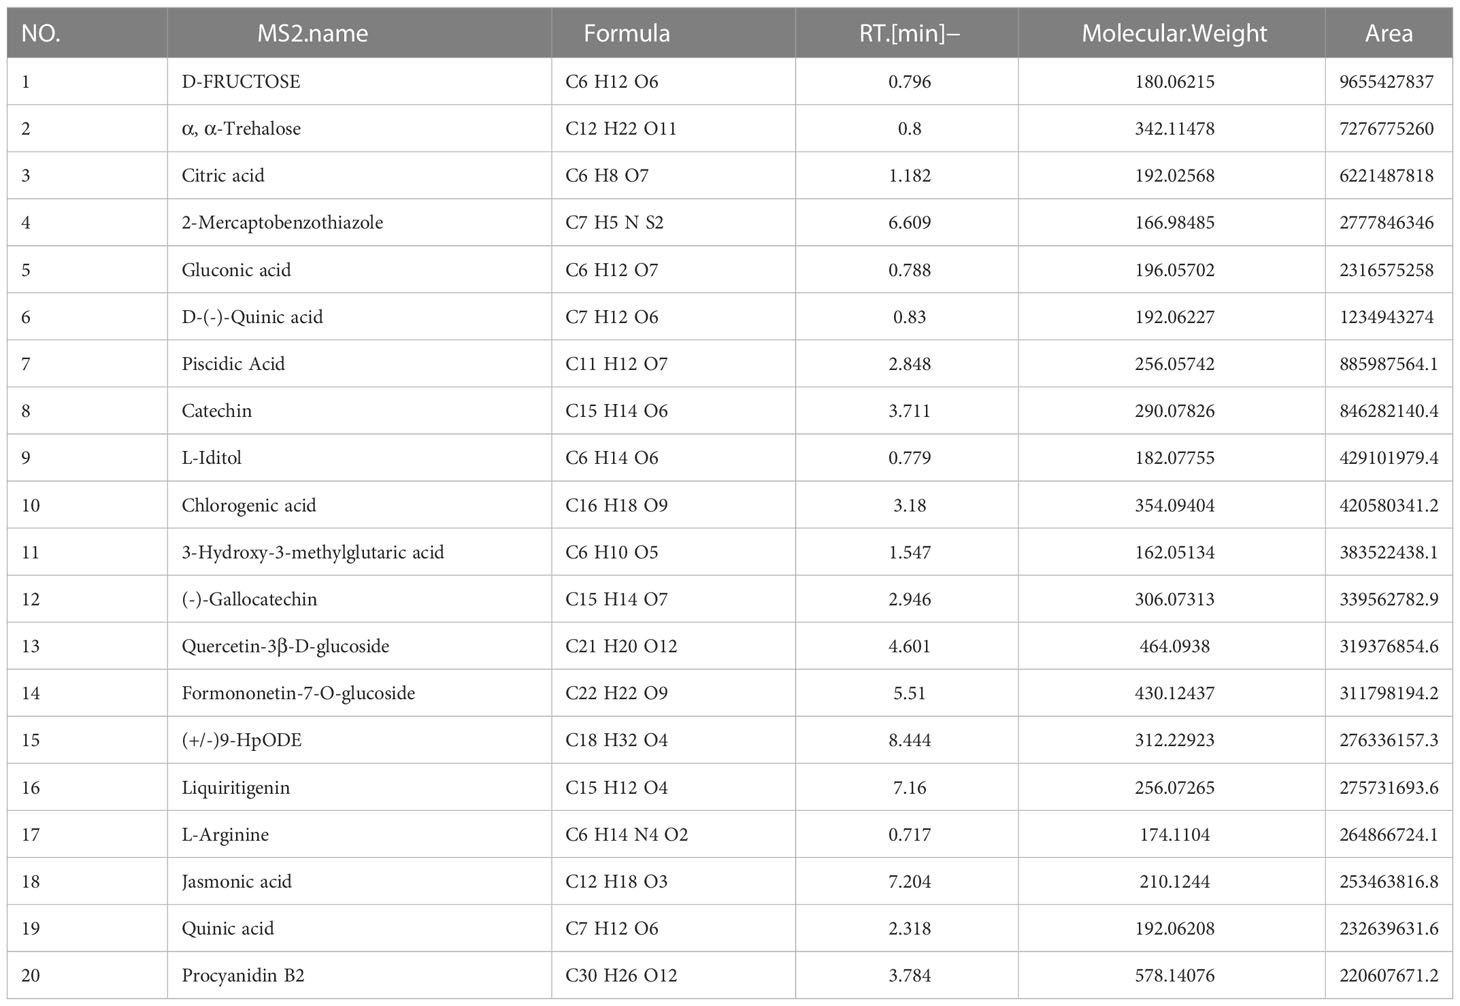
Table 3 LC-MS analysis data and the top 20 primary elemental composition of YLTB in negative ion mode.
3.2 YLTB formula attenuates ovarian dysfunction in DHEA plus HFD-induced PCOS mice
Before the effect of YLTB on PCOS was investigated, the PCOS mice were generated by a HFD and DHEA subcutaneous injections (60 mg/kg body weight) for 20 days. The YLTB group mice were additionally gavaged with YLTB (38.68 g·kg-1·day-1) at the same time. The usage of YLTB was optimized in our preliminary data, as shown in the Supplement Figure S1. The control group was only daily injected with sesame oil. The mouse intervention process was illustrated in the Figure 2A. To address the effect of YLTB on mice ovary function, multiple parameters were evaluated, including ovarian morphology, mice weight, wet weight of uterus and ovaries, and sex hormone changes.
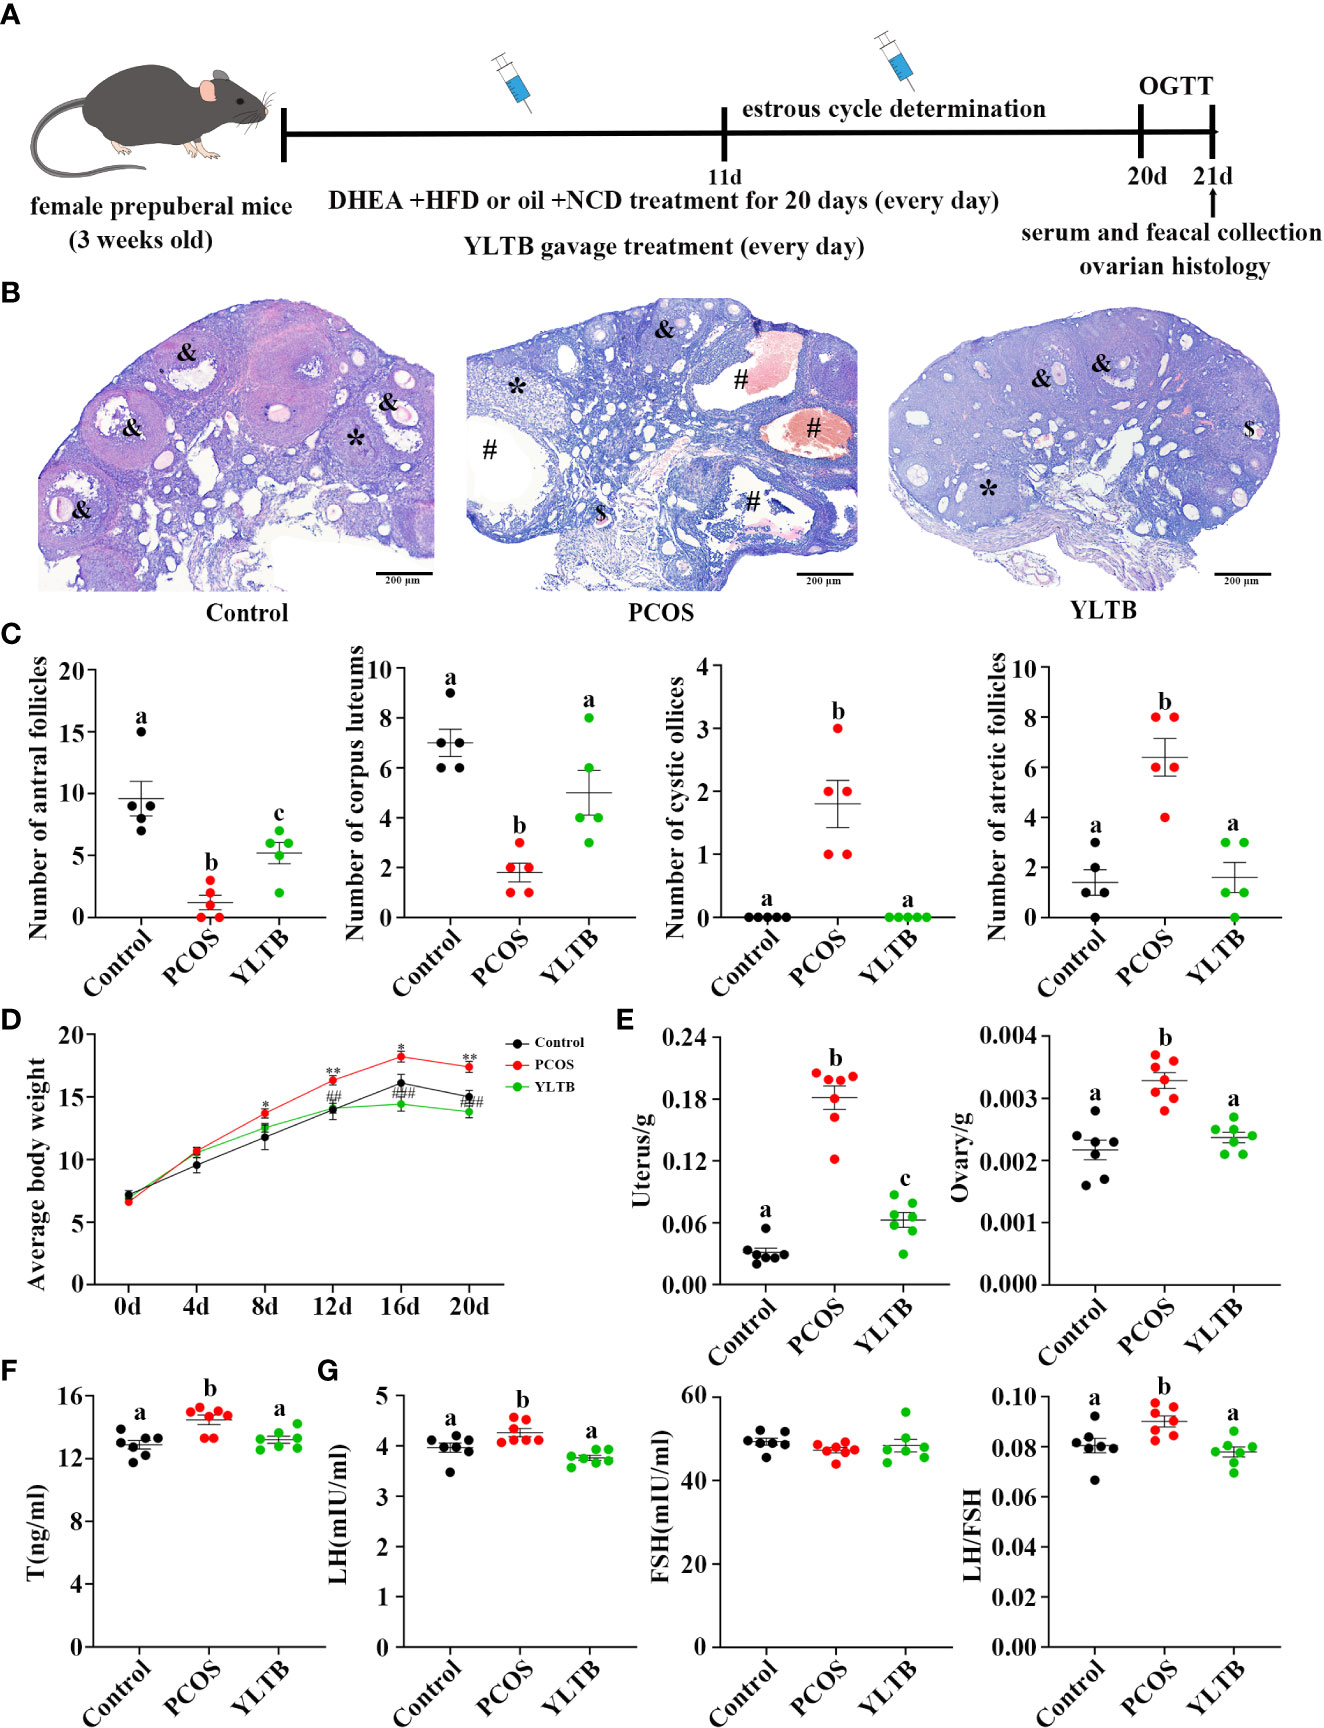
Figure 2 YLTB rescued ovarian dysfunction in PCOS mice. (A) The timeline of the experimental process. (B) Representative ovarian slices stained with hematoxylin and eosin (H&E). Scale bar = 200 μm; & indicates antral follicle; * indicates corpora luteum; # indicates cystic follicle; $ indicates atretic follicle. (C) The difference in the number of antral follicles, corpora lutea, cystic follicles, and atretic follicles among groups (n = 5/group). (D) Measurement of mouse body weight every four days among the three groups (n = 7/group, * P < 0.05; ** P < 0.01 compared with the control group, ## P < 0.01; ### P <0.001 compared with the PCOS group). (E) Measurement of the wet weight of the uterus and ovary among the three groups (n = 7/group). (F, G) Serum T, LH, and FSH levels were measured using an enzyme-linked immunosorbent assay kit, and the LH/FSH ratio was calculated (n = 7/group). Statistical significance was determined using one-way or two-way ANOVA with Tukey’s multiple comparisons test, and data are presented as the mean ± standard error of the mean (SEM). a, b and c indicate P < 0.05; if 2 groups have the same letter, it indicates no statistical significance.
Ovarian H&E staining were performed to ensure a successful PCOS establishment and to determine YLTB’s effect on ovarian morphology as well as follicle counts (Figure 2B). Many cystic and atretic follicles in the ovaries of the PCOS group were absent in the ovaries of the YLTB group. The PCOS group also showed fewer antral follicles and corpus luteum, while YLTB administration increased them (Figure 2C). Figure 2D illustrated that the mice body weight was significantly decreased in the YLTB group, compared to the PCOS group. There was no significant difference in mice body weight between the control group and YLTB group. The uterus and ovary weights of PCOS mice were also significantly reduced after YLTB therapy (Figure 2E). In addition, YLTB dramatically downregulated serum T and LH levels in PCOS mice. Consistently, the LH/FSH ratio was significantly lower in the YLTB group in comparison to the PCOS group (Figures 2F, G). In summary, the application of YLTB largely restored these ovarian parameters of the PCOS group to the normal levels. Although it could affect sex hormone levels, YLTB did not impact the estrus cycle of the PCOS group (Figure S2 A, B).
3.3 YLTB ameliorates the disorder of glucose and lipid metabolism in PCOS mice
To address whether YLTB ameliorates PCOS condition through alternation of glucose and lipid metabolism, the glucose levels, insulin levels, Lee’s index, BMI, lipid levels, and insulin sensitivity as well as the degree of obesity among the mice groups of the control, PCOS and YLTB were compared. Firstly, OGTTs were performed in those mice administered via oral gavage of 2 g/kg of glucose after 12 hours of fasting. The administered mice were sampled for the blood glucose levels using the test paper at 0, 15, 30, 60, 90, and 120 minutes. The glucose levels of the PCOS group were the highest, suggesting that the delayed glucose clearance in the PCOS group was removed in the YLTB group (Figure 3A). Consistently, YLTB significantly attenuated increases in the levels of fasting glucose, serum insulin and HOMA-IR in PCOS mice (Figures 3B–D). Meanwhile, the body size of the PCOS group was larger than the control group, assayed by Lee’s index and BMI, while the values of these two indexes were lowered down in the YLTB group (Figure 3E, F).
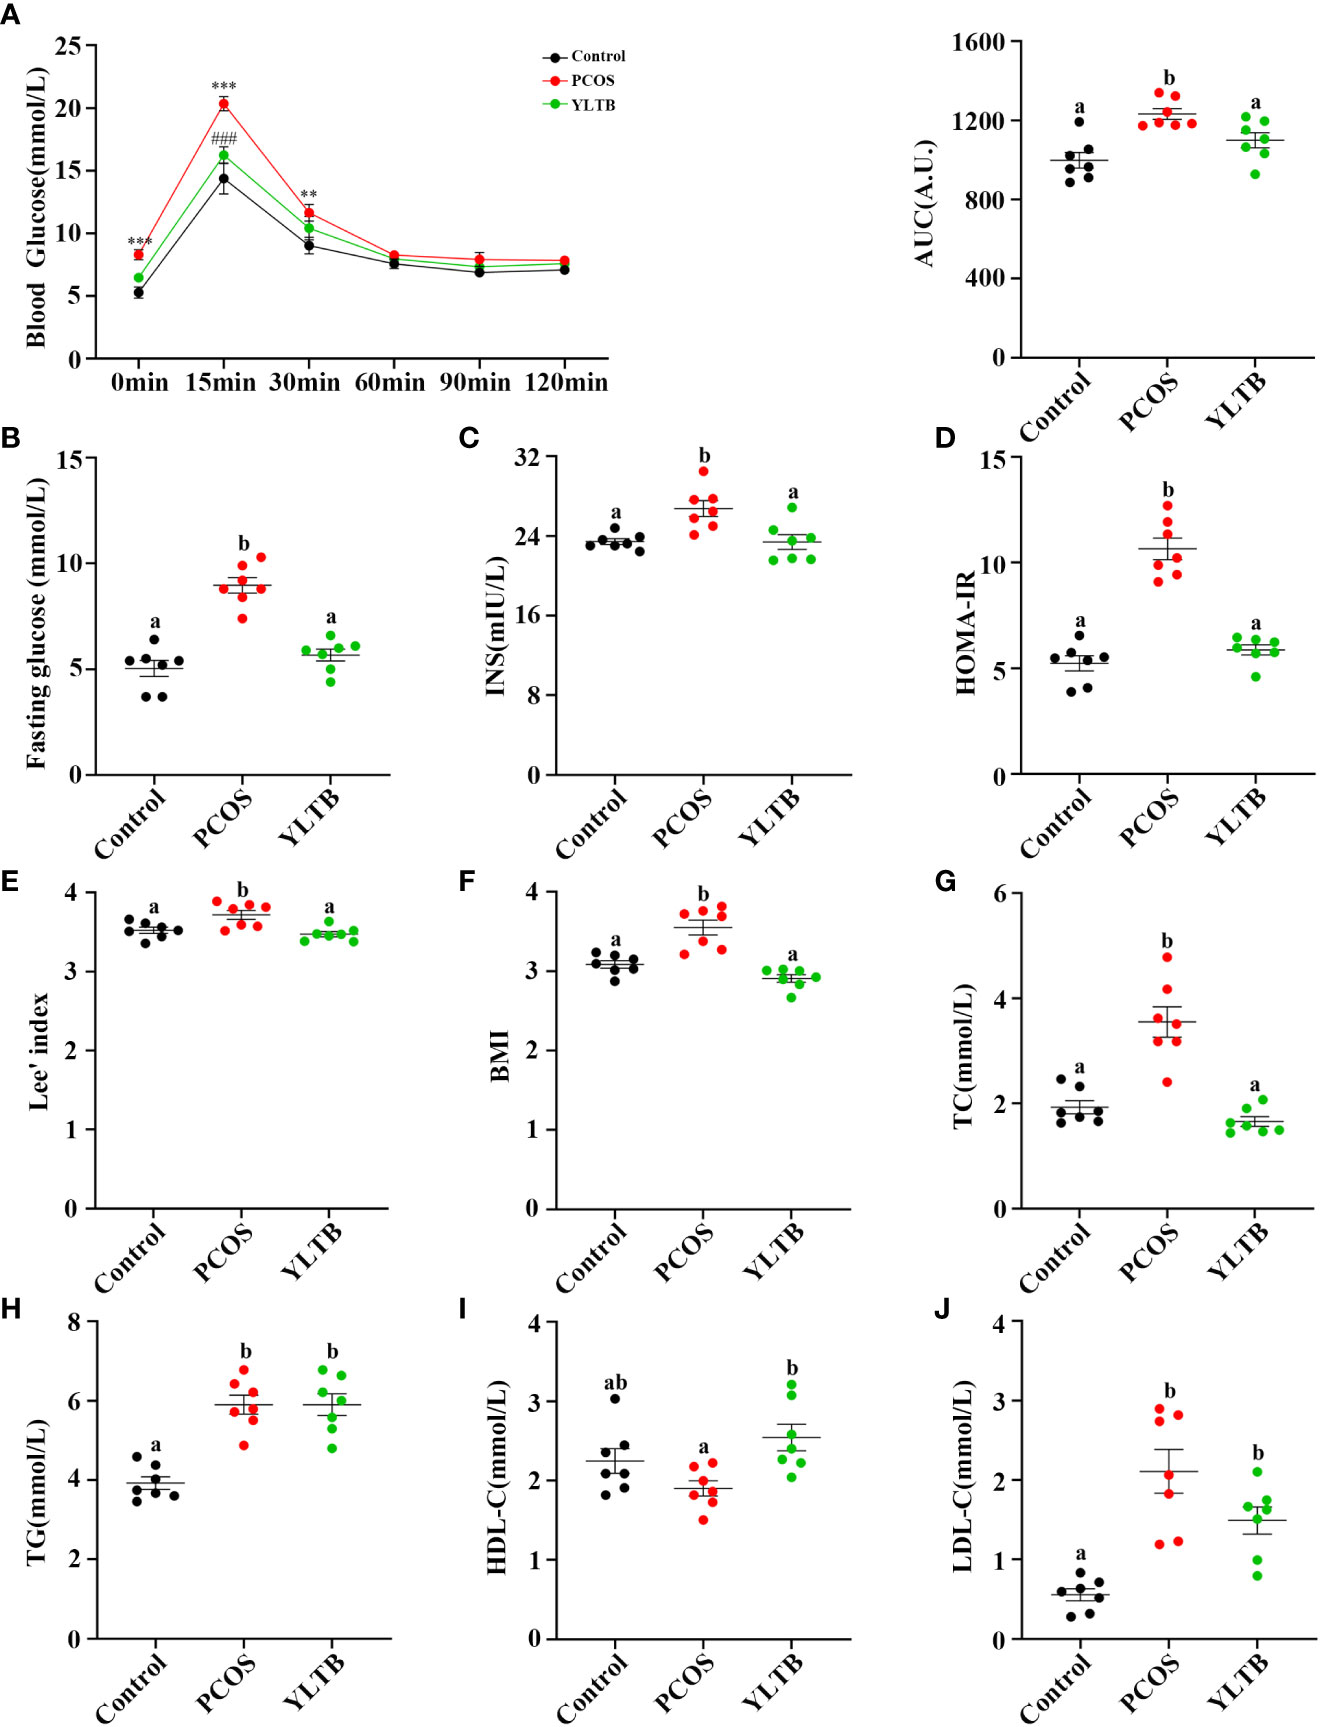
Figure 3 The effects of YLTB on glucose tolerance, insulin sensitivity and lipid metabolism in PCOS mice. (A) OGTTs in mice from the control, PCOS, and YLTB groups. The corresponding area under the curve (AUC) values of blood glucose levels in each group were calculated (** P < 0.01; *** P < 0.001 compared with the control group, ### P < 0.001 compared with the PCOS group). (B, C) Blood glucose and serum insulin level assessment after 12 h of fasting in mice from the control, PCOS, and YLTB (38.68 g·kg-1·day-1) groups. (D) The homeostasis model assessment of insulin resistance (HOMA-IR) index = [FBG (mmol/L)] × [FINS (lU/mL)]/22.5 in mice from the control, PCOS, and YLTB groups. (E, F) Lee’s index = [Body mass (g) × 1,000]1/3/body length (cm) and Body mass index (BMI = weight (kg)/height (m2) calculation. (G–J) Detection of TC, TG, HDL-C and LDL-C to evaluate the level of serum lipid metabolism in mice from the control, PCOS, and YLTB groups. n = 7/group, statistical significance was determined using one-way or two-way ANOVA with Tukey’s multiple comparisons test, and data are presented as the mean ± SEM. a and b indicate P < 0.05; if 2 groups have the same letter, it indicates no statistical significance.
The lipid profiles of the three groups were characterized by determination of levels of total TC, TG, LDL-C and HDL-C. Importantly, the TC levels in the YLTB group was lower than the one in the PCOS group (Figure 3G). In contrast, there was no significant changes of TG levels between the PCOS group and the YLTB group (Figure 3H). Notably, although the HDL-C levels in the YLTB group was higher than the one in the PCOS group (Figure 3I), the levels in the PCOS group were similar to in the control group (Figure 3I). On the other hand, LDL-C levels were significantly increased in the PCOS group compared to the control group (Figure 3J). However, YLTB had no significant impact on the elevated LDL-C levels in PCOS mice. This indicates that the mechanism by which YLTB acts on TC to affect PCOS is complicated.
3.4 YLTB attenuates gut microbiota dysbiosis in PCOS mice
Given that the gut microbiota can regulate many metabolites, we next investigated whether the gut microbiota contributes to YLTB manipulation on sex hormone levels and metabolism indicators in mice with PCOS. Before that, the profile of the gut microbiota, simulated by the fecal microbiota, was described for the control, PCOS, and YLTB groups. The 16S rRNA sequencing analysis was performed with fecal samples separately collected from the groups. The rarefaction curves (Figure 4A) and rank abundance curves (Figure 4B) of the three groups growed in a similar manner, reflecting that the amount of sequencing data and the species richness were qualified for further analysis.
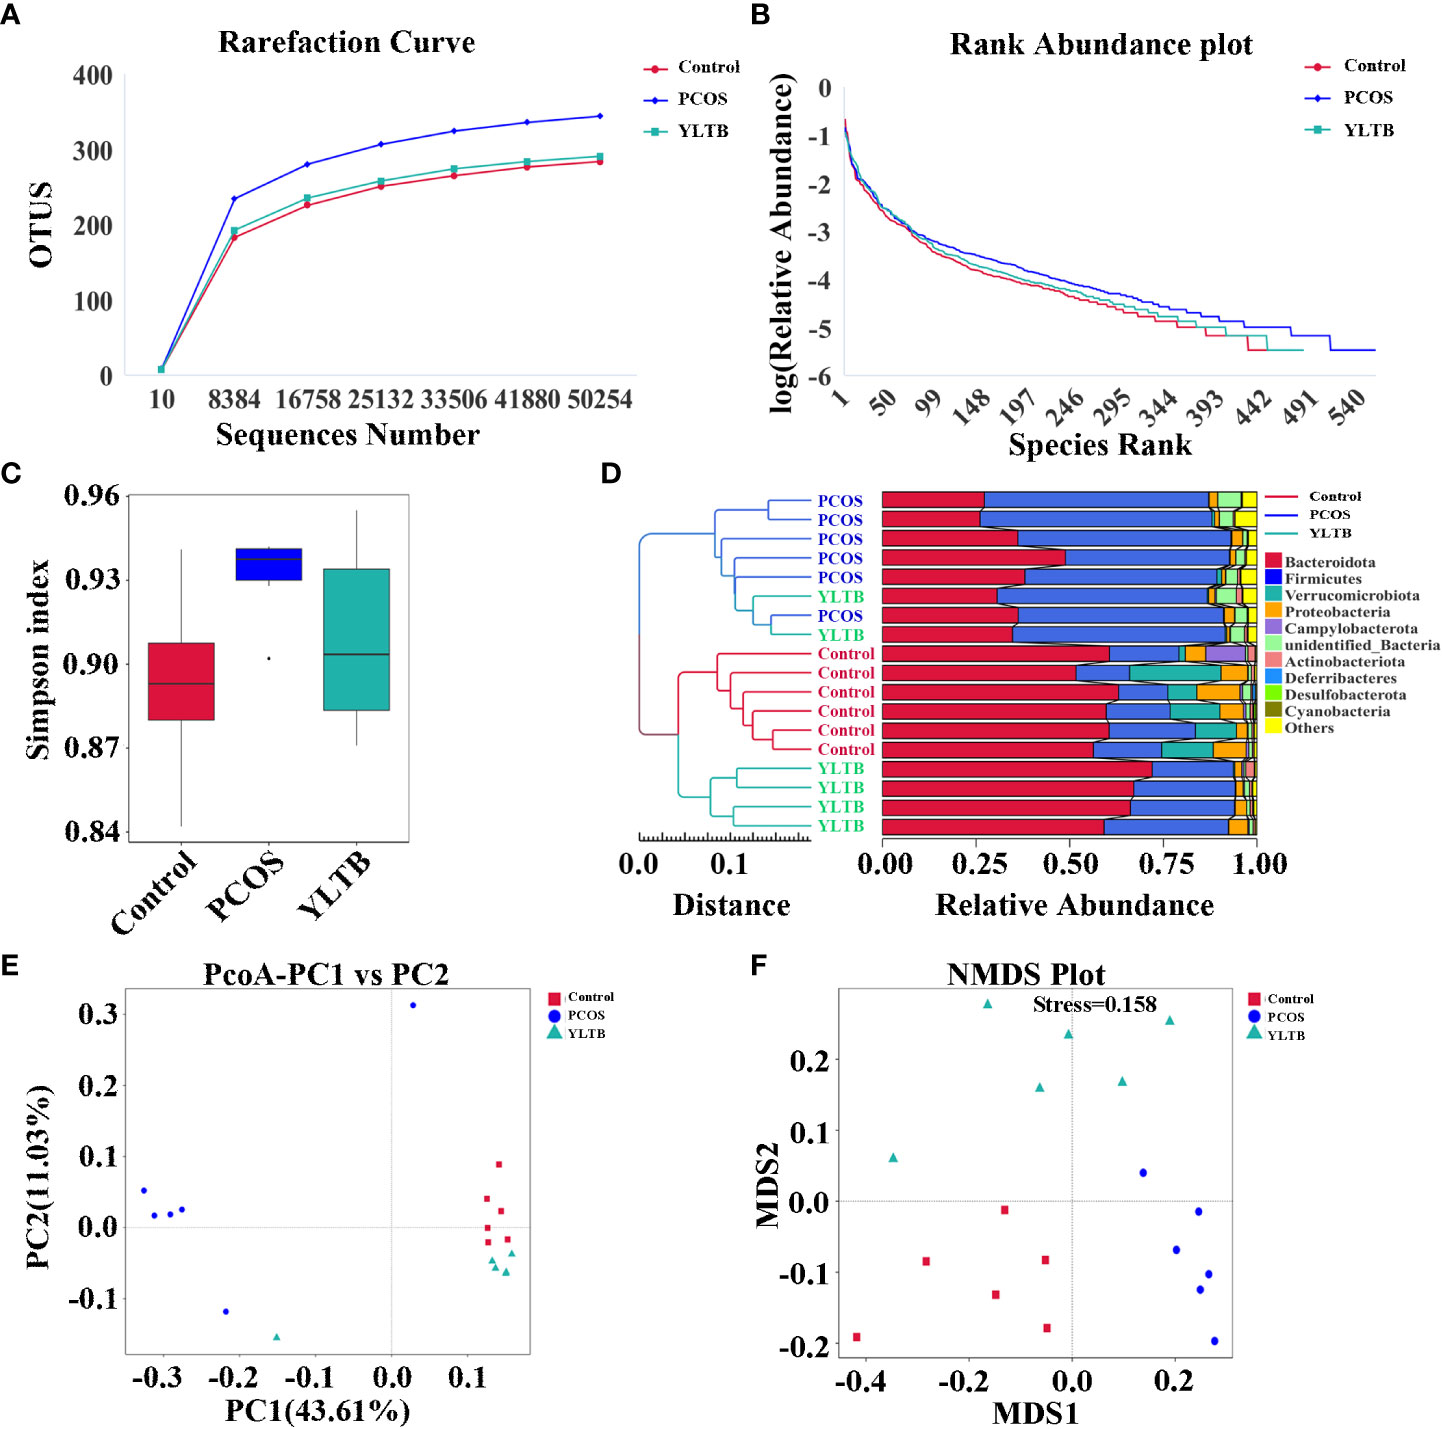
Figure 4 Effect of YLTB on α and β diversity of gut microbiota. (A, B) Analysis of gut microbial diversity was performed on the basis of 16S rRNA sequencing and was presented by rarefaction curves and rank abundance curves. (C) The α-diversity of gut bacterial assemblages with Simpson index in the mice receiving different treatments. (D) Evaluation of β-diversity with bacterial community compositional similarity using UPGMA cluster analysis, and the clustering result and the relative abundance of each sample at the phylum level were displayed. The left side is the UPGMA clustering tree structure, and the right side is the relative abundance distribution map of each sample at the phylum level. (E, F) Plots of unweighted UniFrac-based PCoA and nonmetric multidimensional scaling (NMDS) based on Bray-Curtis distance. Each point in the graph represents a sample, the distance between points indicates the degree of variation, and the samples of the same group are represented by the same color. n = 6 mice/group.
The α diversity indicator Simpson index scored closely for the three groups, showing no difference of species diversity across the three groups (Figure 4C). The β-diversity of the gut microbiota of the three groups were also determined using various approaches such as the UPGMA (unweighted pair group method with arithmetic mean) clustering method, principal coordinate analysis (PCoA), and nonmetric multidimensional scaling (NMDS). The weighted unifrac UPGMA clustering method classified the control and PCOS mice samples into two distinct groups (Figure 4D), implying that the gut microbial composition of the PCOS mice differed from that of the control mice. Although the YLTB group could not be completely separated from the PCOS group, it was significantly different from the PCOS group, demonstrating that YLTB administration alters the gut microbial composition of PCOS mice (Figure 4D). Based on the unweighted unifrac distance, PCoA analysis showed a clear separation among the three groups, with the principal component 1 (PC1) value of 43.61% and PC2 value of 11.03% (Figure 4E). In addition, the degree of variation among the three groups was illustrated using NMDS analysis based on Bray−Curtis distance, when stress is less than 0.2 (stress = 0.158, Figure 4F). Both PCoA and NMDS analyses revealed that the intergroup distances were greater than the intragroup distances, implying that PCOS and YLTB therapy have an effect on the β-diversity of gut microbiota.
3.5 YLTB alters the taxonomic composition of gut microorganism communities at the phylum, genus and species levels
In addition to diversity details, the abundance of gut microbiota of the control, PCOS and YLTB groups was analyzed, using the linear discriminant analysis (LDA) effect size (LEfSe) method. In our studies, the cut-off threshold of LDA was set at the score 4.0. Our data showed that the Bacteroidota phylum was enriched in the control mice, and the Firmicutes phylum was enriched in PCOS mice, as well as the Erysipelotrichales order in YLTB mice (Figures 5A, B). This observation demonstrated a great shift of gut microbiota composition from PCOS mice to YLTB mice.
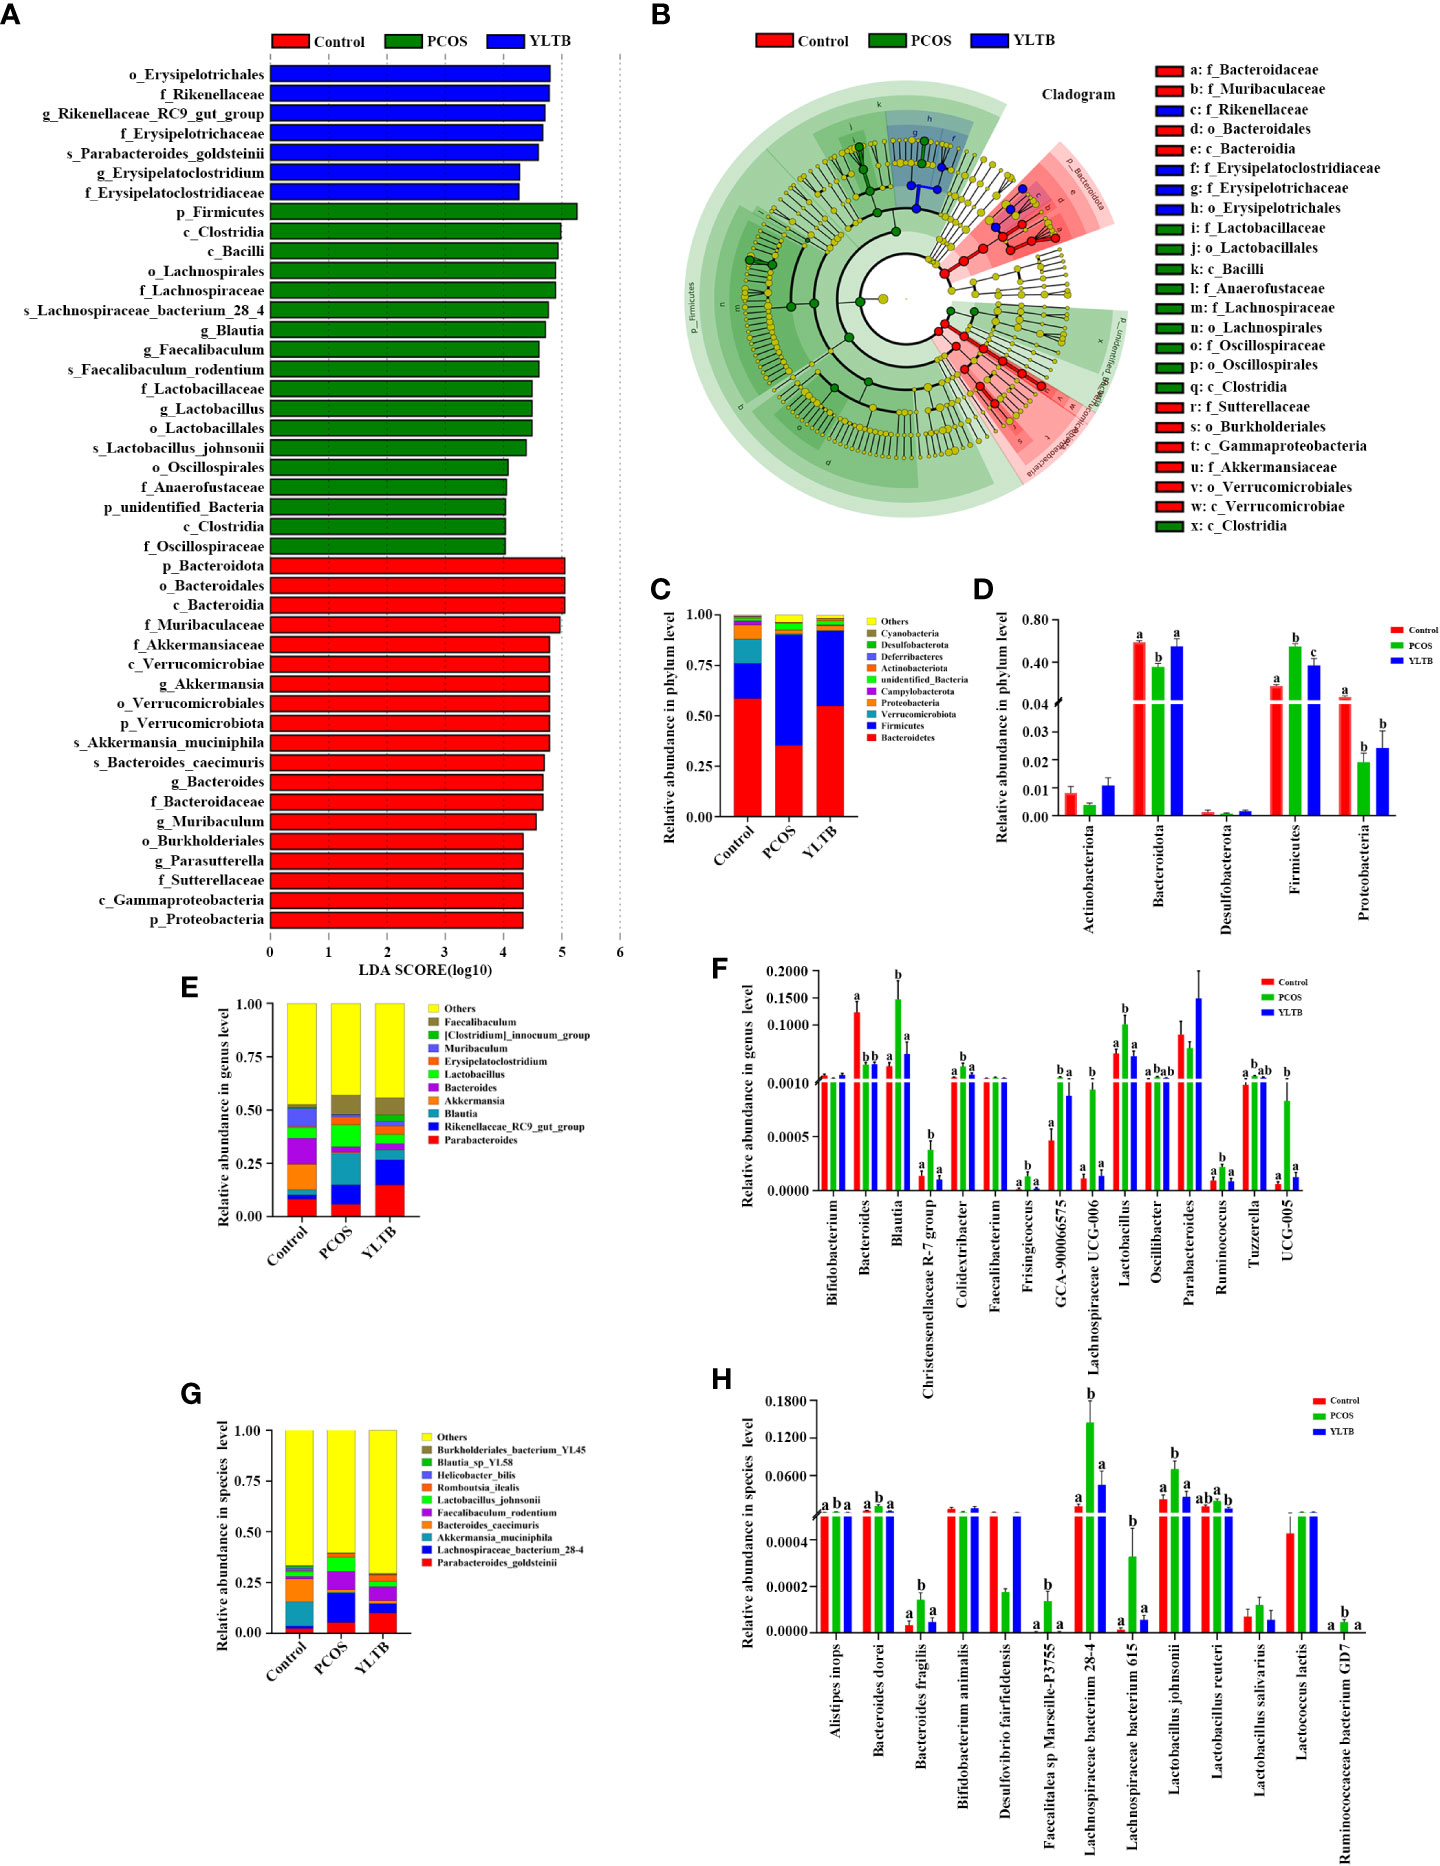
Figure 5 Changes in the taxonomic composition of gut microorganism communities at the phylum, genus and species levels. Statistical differences in the level of biomarkers between the control, PCOS, and YLTB groups were identified using the line discriminant analysis (LDA) effect size (LEfSe) method. (A) Taxa enrichment as indicated by discriminant analysis (LDA) scores in the control (red), PCOS (green), and YLTB (blue) treated groups. Only the taxa meeting an LDA significance threshold of four are displayed, and the length of the histogram represents the influence of different species. (B) The output of the LEfSe algorithm as visualized by cladograms. Significantly distinct taxonomic nodes are colored and the branch areas are shaded according to the effect size of each taxa. (C, E, G) The top ten bacteria with maximum abundance of intestinal bacteria at the phylum, genus and species levels among control, PCOS-treated and YLTB-treated mice. (D, F, H) Significant changes in abundance at the phylum, genus and species levels among the control, PCOS, and YLTB groups. N = 6 mice/group. For D, F, and H, statistical significance was determined using one-way ANOVA with Tukey’s multiple comparisons test, and data are presented as the mean ± SEM. a, b and c indicate P < 0.05; if 2 groups have the same letter, it indicates no statistical significance.
The detailed differences of the taxonomic composition of gut microbiota among the three groups were shown in the Figure 5C–H at the phylum, genus, and species levels. At the phylum levels, Firmicutes and Bacteroidota were dominant in all three groups (Figure 5C). Furthermore, the relative Firmicutes abundance levels were highest in PCOS mice, but the levels of Bacteroidota and Proteobacteria were lower than the ones in other two groups. These changes were attenuated in YLTB mice (Figure 5D). For Bacteroidota, the Bacteroides and Parabacteroides genus abundance levels were lower in the PCOS mice than in the control group (Figure 5E). For Firmicutes, the Blautia and Lactobacillus abundance levels in PCOS mice were restored to the normal levels by YLTB administration. The similar effects were observed with the abundance levels of Parabacteroides (Figure 5E). Besides Blautia and Lactobacillus, Lachnospiraceae UCG-005 and UCG-006 were greatly enriched in the PCOS group, which were also significantly reduced by YLTB (Figure 5F). Bacteroides, Blautia and Lactobacillus genera were further analyzed for the detailed information at the species levels (Figures 5G, H). The data showed that Bacteroides dorei, Bacteroides fragilis, Lactobacillus johnsonii and Lachnospiraceae bacterium 28-4 as well as Lachnospiraceae bacterium 615 were enriched in the PCOS group and could be reverted in the YLTB group (Figure 5H). These results suggested that YLTB can restore PCOS gut microbiota disturbances.
3.6 Association among fecal metabolites, gut microbiota and PCOS mice phenotypes
Since we have shown that YLTB administration greatly changed basal metabolism, ovary dysfunction, and the gut microbiota in PCOS mice, we next seek for more association information among fecal metabolites, gut microbiota and PCOS mice phenotypes using biostatistical approaches. Firstly, the fecal metabolite profile from mice was determined by the untargeted metabolomics. Principal component analysis (PCA) and partial least squares discrimination analysis (PLS-DA) showed a distinct separation of those metabolites among the three groups, with different PC1 and PC2 values (Figure 6A, B). The detailed relationship between the metabolites and the three groups were illustrated in Figure 6C. 44 fecal metabolites demonstrated that the abundances of fecal metabolites in PCOS mice were different from those in the control mice, which were significantly manipulated by YLTB. These metabolites mainly consist of hormones, vitamins, and organic acids. For example, hormones include cortisone, hydrocortisone, menaquinone, and etc; vitamins such as ascorbic acid, folic acid and phylloquinone, whereas organic acids include cis-aconitic acid, maleic acid, ferulic acid, and etc (Figure 6C).
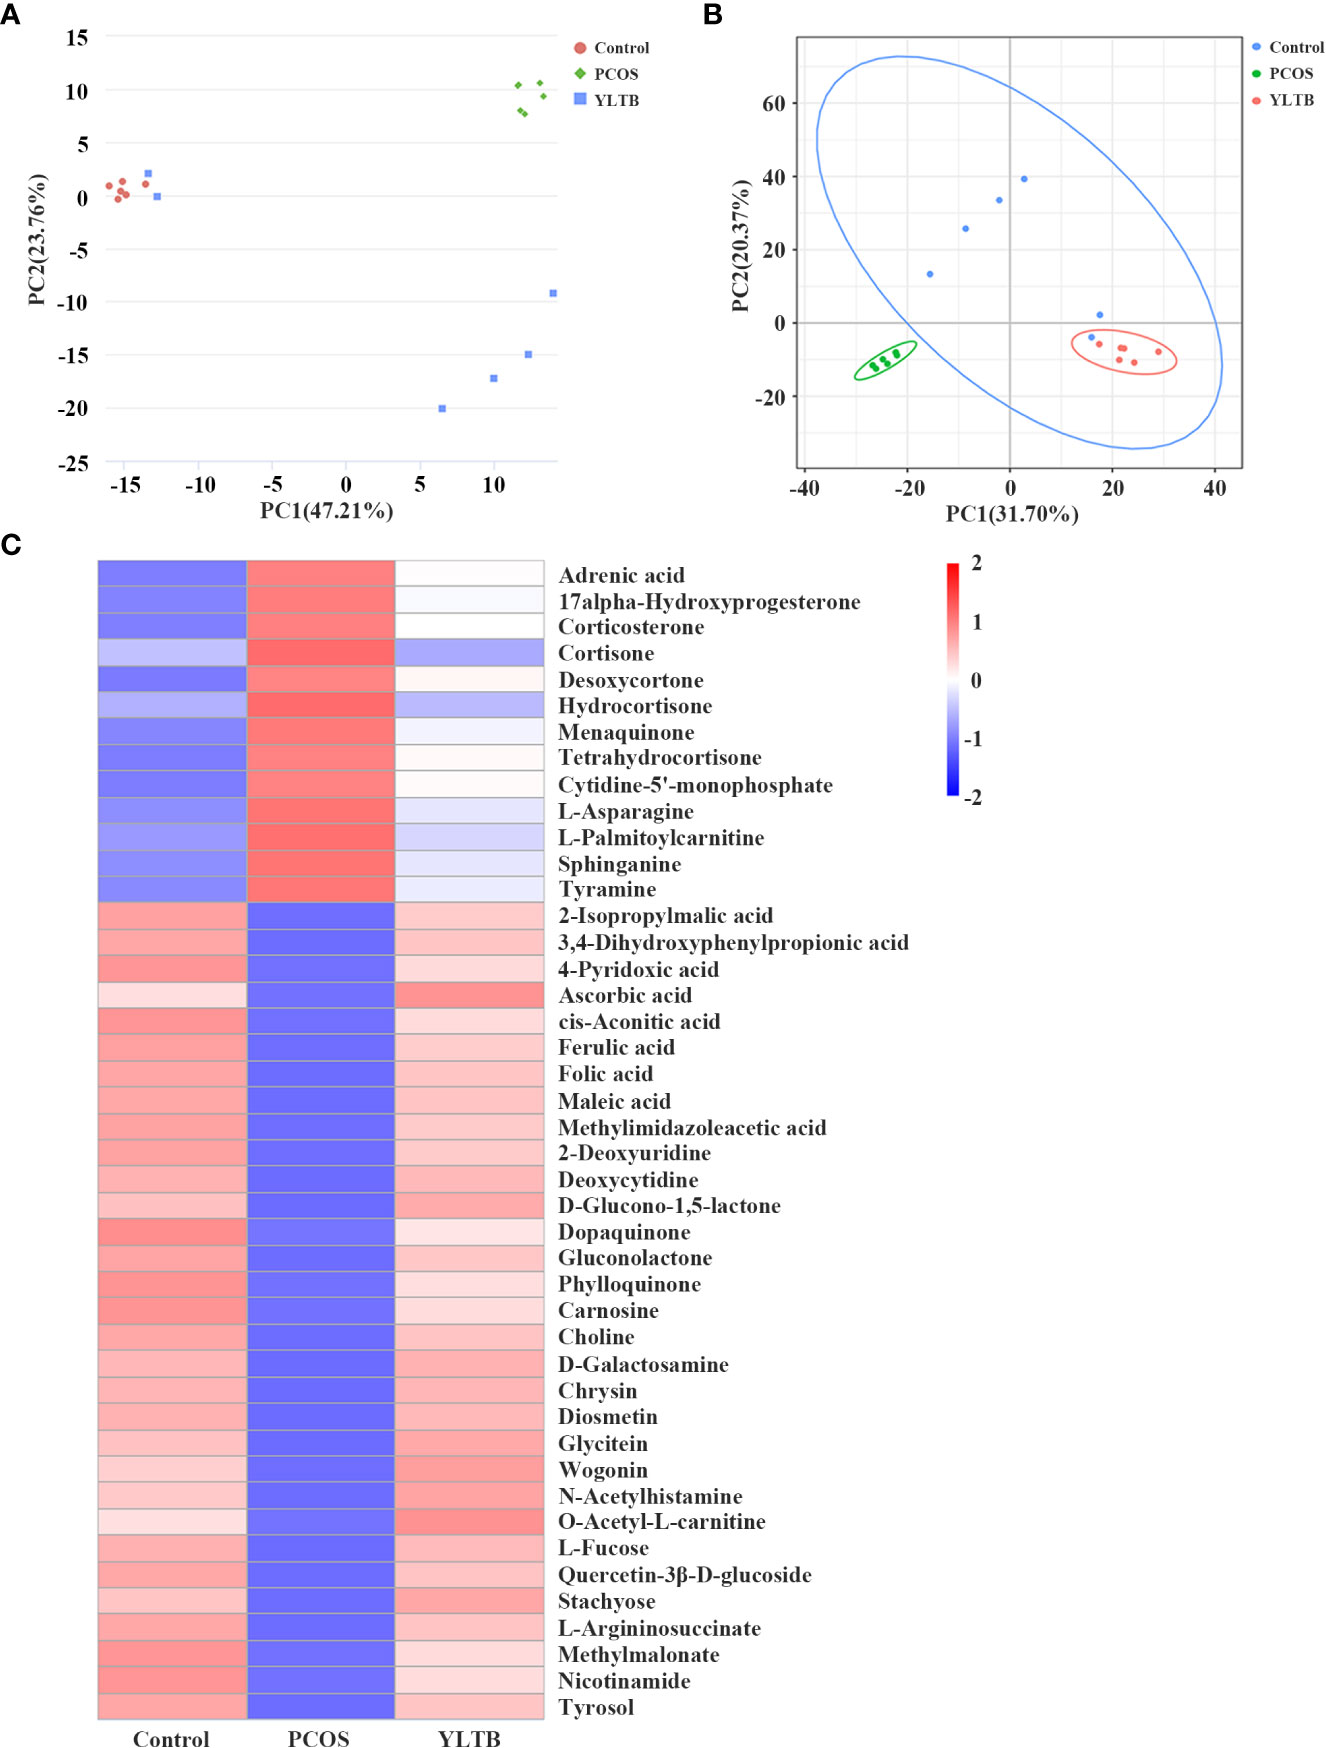
Figure 6 The effect of YLTB on the metabolomic profiles of mouse feces. (A, B) Principal component analysis (PCA) and partial least squares discrimination analysis (PLS-DA) were used to observe the overall distribution trends among the three groups of samples. The abscissa PC1 and the ordinate PC2 represent the scores of the first and second principal components, respectively. The scattered points of different colors represent samples of different experimental groups. (C) A heatmap of the hierarchical clustering analysis with respect to the relative abundances of 44 fecal metabolites among the three groups. Abscissas represent different experimental groups, ordinates represent different metabolites, and different colors represent the relative expression of metabolites at the corresponding position. N = 6 mice/group.
Spearman’s correlation analysis was next used to comprehensively analyze the correlations among fecal metabolites, the gut microbiota and host phenotypes (Figure 7). In the relationship between fecal metabolites and the gut microbiota, metabolites (such as ferulic acid, folic acid and methylmalonate) were negatively correlated with 9 bacterial species. Among those metabolites, ferulic acid (FA) was strongly correlated with basal metabolism. The correlations between the gut microbiota and host phenotypes were also shown in the Figure 7. Nine bacterial strains (Alistipes inops, Bacteroides dorei, Bacteroides fragilis, Clostridium sp Culture-54, Faecalitalea sp Marseille-P3755, Lachnospiraceae bacterium 615, Lactobacillus johnsonii, Lactococcus lactis, and Ruminococcaceae bacterium GD7) were positively correlated with the host parameters (including body weight, BMI, TC, T, LH, LH/FSH ratio, FBG, INS and HOMA-IR). Taken together, our findings showed a tight association among fecal metabolites, the gut microbiota and host phenotypes in PCOS mice administered with YLTB.
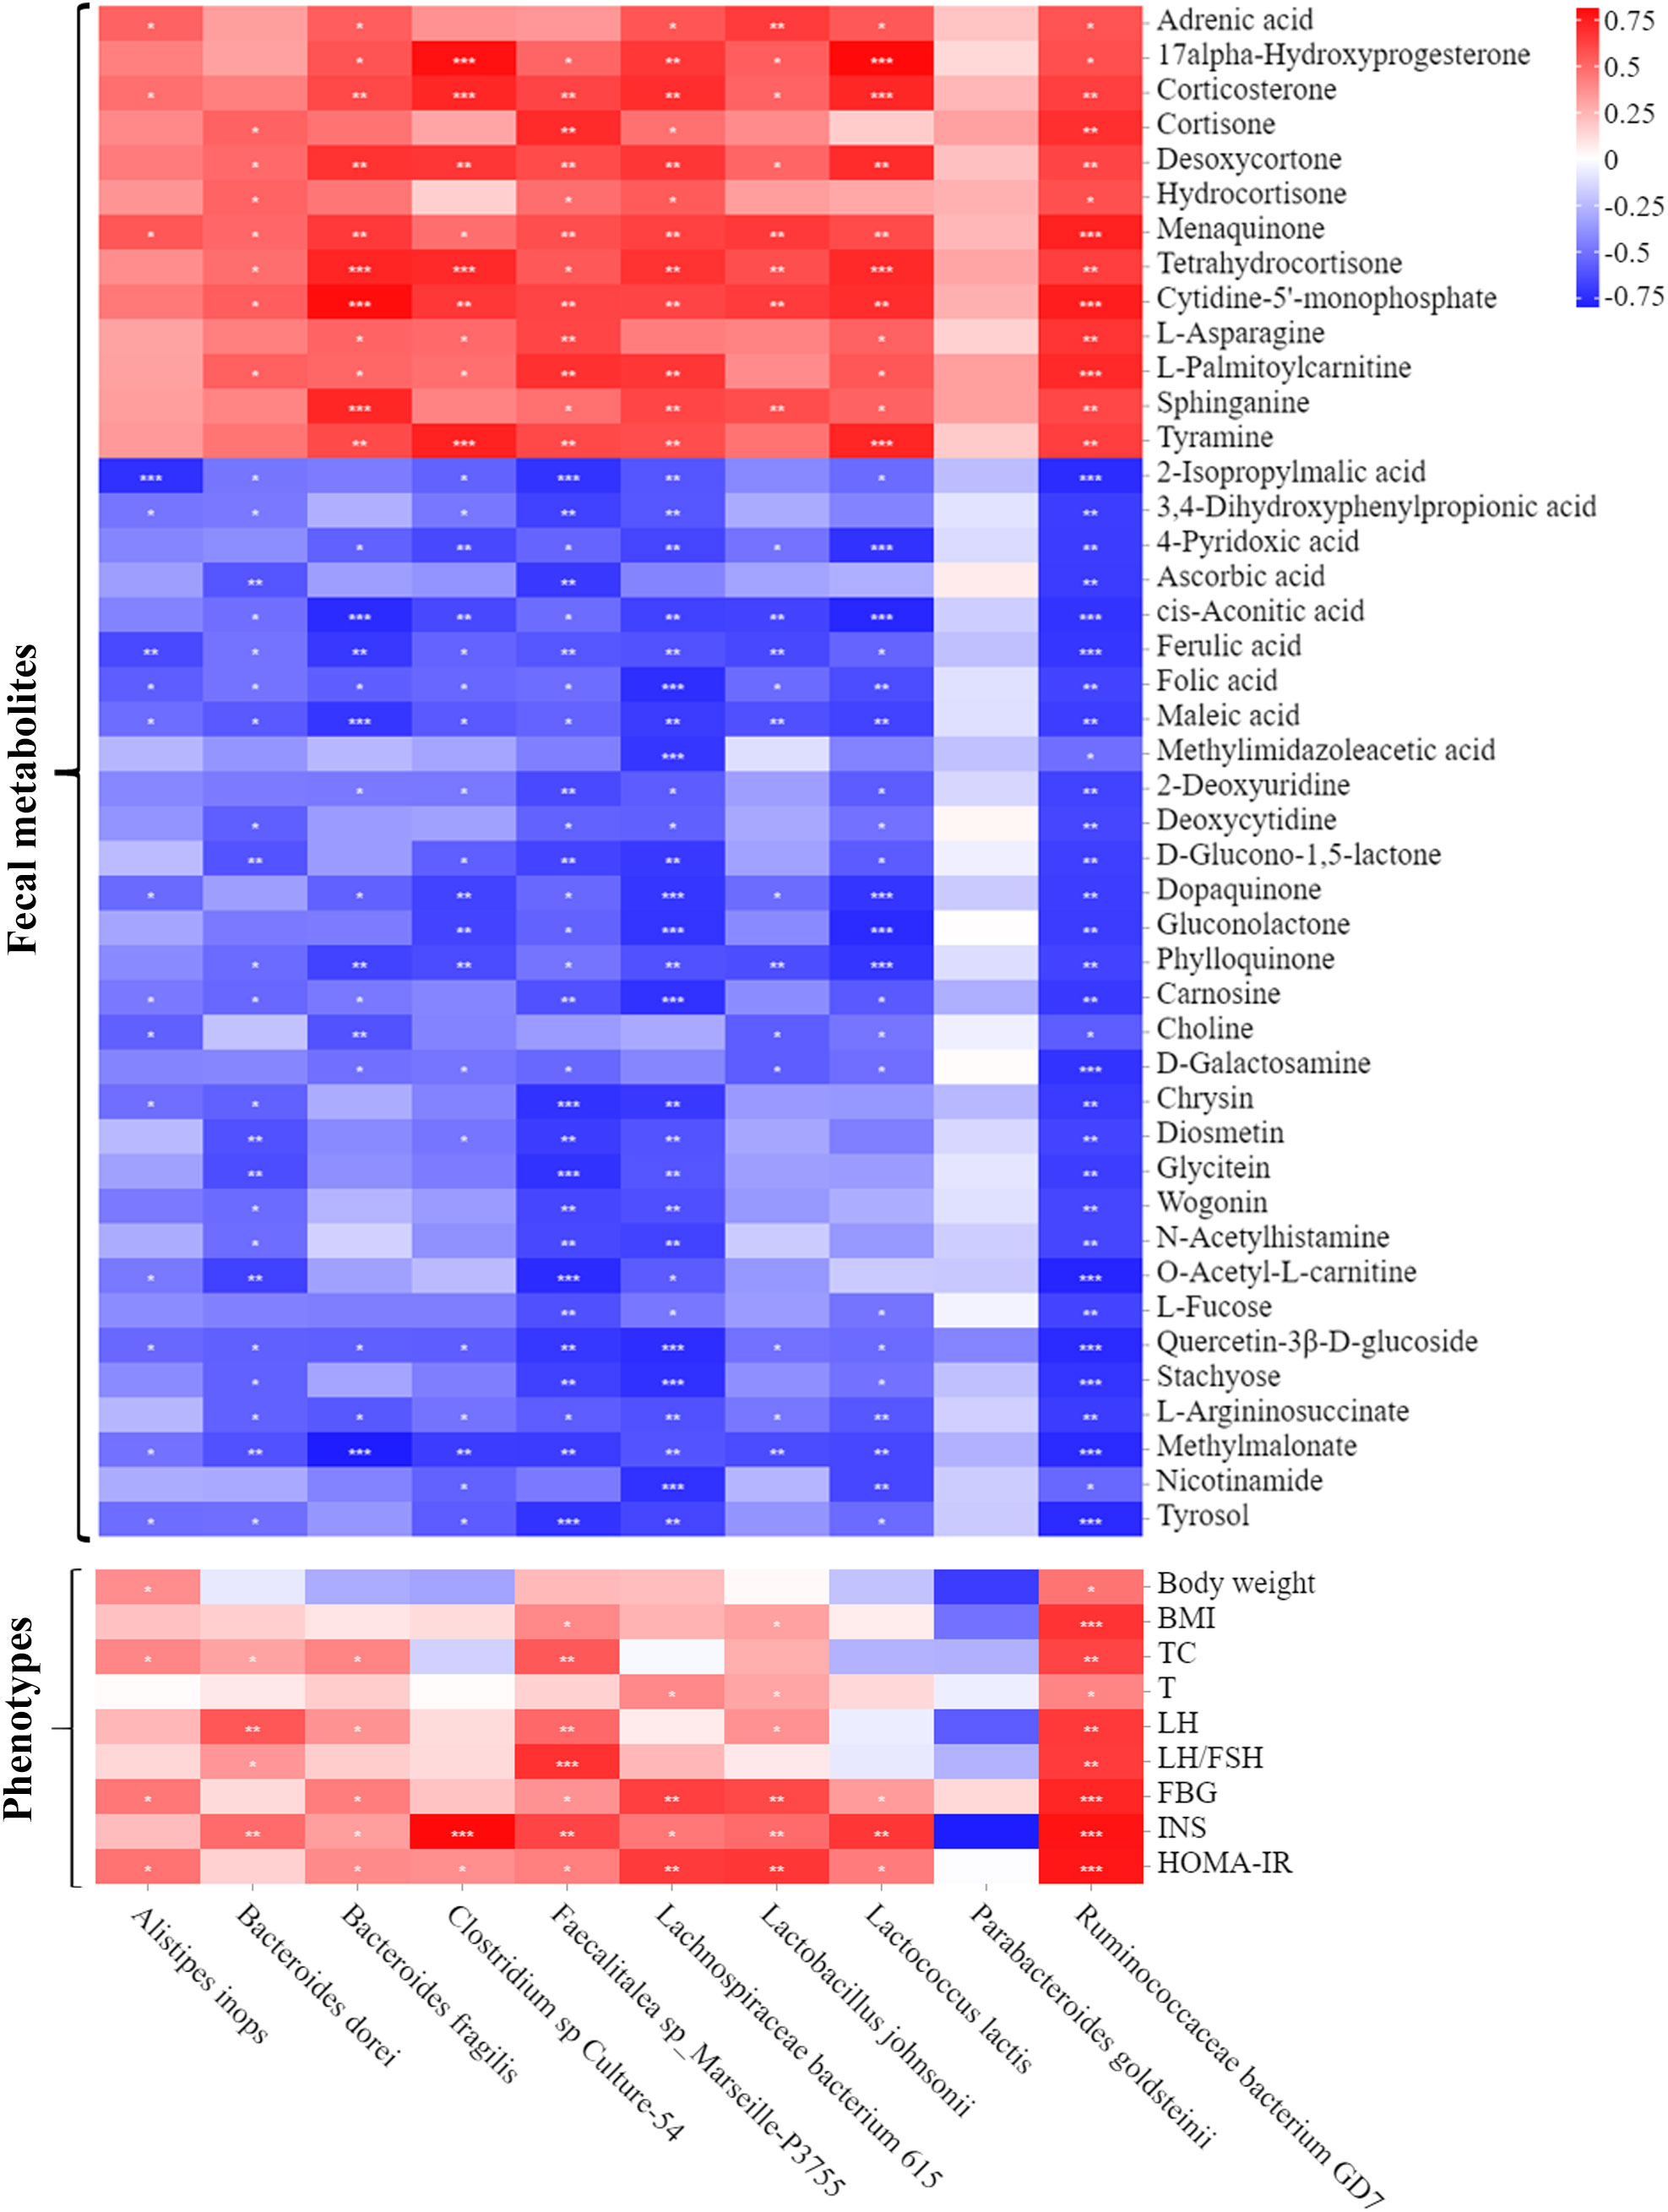
Figure 7 Associations among fecal microbiota, fecal metabolites and PCOS phenotypes. A heatmap of the three-tiered analyses integrating the gut microbiome, fecal metabolites and phenotypes measured by Spearman’s correlation coefficient in the control, PCOS, and YLTB group mice (n = 6/mouse). Associations between the 10 gut microbial species and 44 fecal metabolites are shown in the up panel. The down panel displays associations between 10 gut microbial species and 9 phenotypes. The value range of the correlation coefficient is (-0.75, 0.75). The degree of association is indicated by the color intensity (red represents positive correlations, and blue represents negative correlations). * indicates significant correlation, * P < 0.05; ** P < 0.01; *** P <0.001.
3.7 The addition of ferulic acid attenuated ovarian dysfunction in PCOS mice
The Figure 7 showed that FA is a critical metabolite that contribute to the effect of YLTB to the PCOS mice. Therefore, FA was then tested whether it regulates ovarian functions in PCOS mice. The DHEA-treated mice were administered with low-dose FA (FA1 group, 50 mg/kg) or high-dose FA (FA2 group, 100 mg/kg) for 20 days, before they were sampled for further analysis of ovarian function changes (process illustrated as Figure 8A). Next, we tested ovarian morphology, body weight, wet weight of the uterus and ovaries and sex hormone alterations among the control, PCOS, FA1 and FA2 groups. H&E staining revealed that the FA administration reduced the number of cystic and atretic follicles, while promoting the development of antral follicles and corpus lutea in the PCOS ovaries (Figures 8B, C). The body weight, as well as wet uterine and ovary weight, was significantly reduced in both high and low FA-gavaged mice (Figures 8D, E). Consistently, the decreased serum T levels were observed in FA-gavaged mice compared to PCOS mice (Figure 8F). However, FA had no impact on the estrus period (Figure S2C-D). These findings showed that FA alleviated ovarian dysfunction and reduced pathological damage to ovarian tissues in PCOS mice.
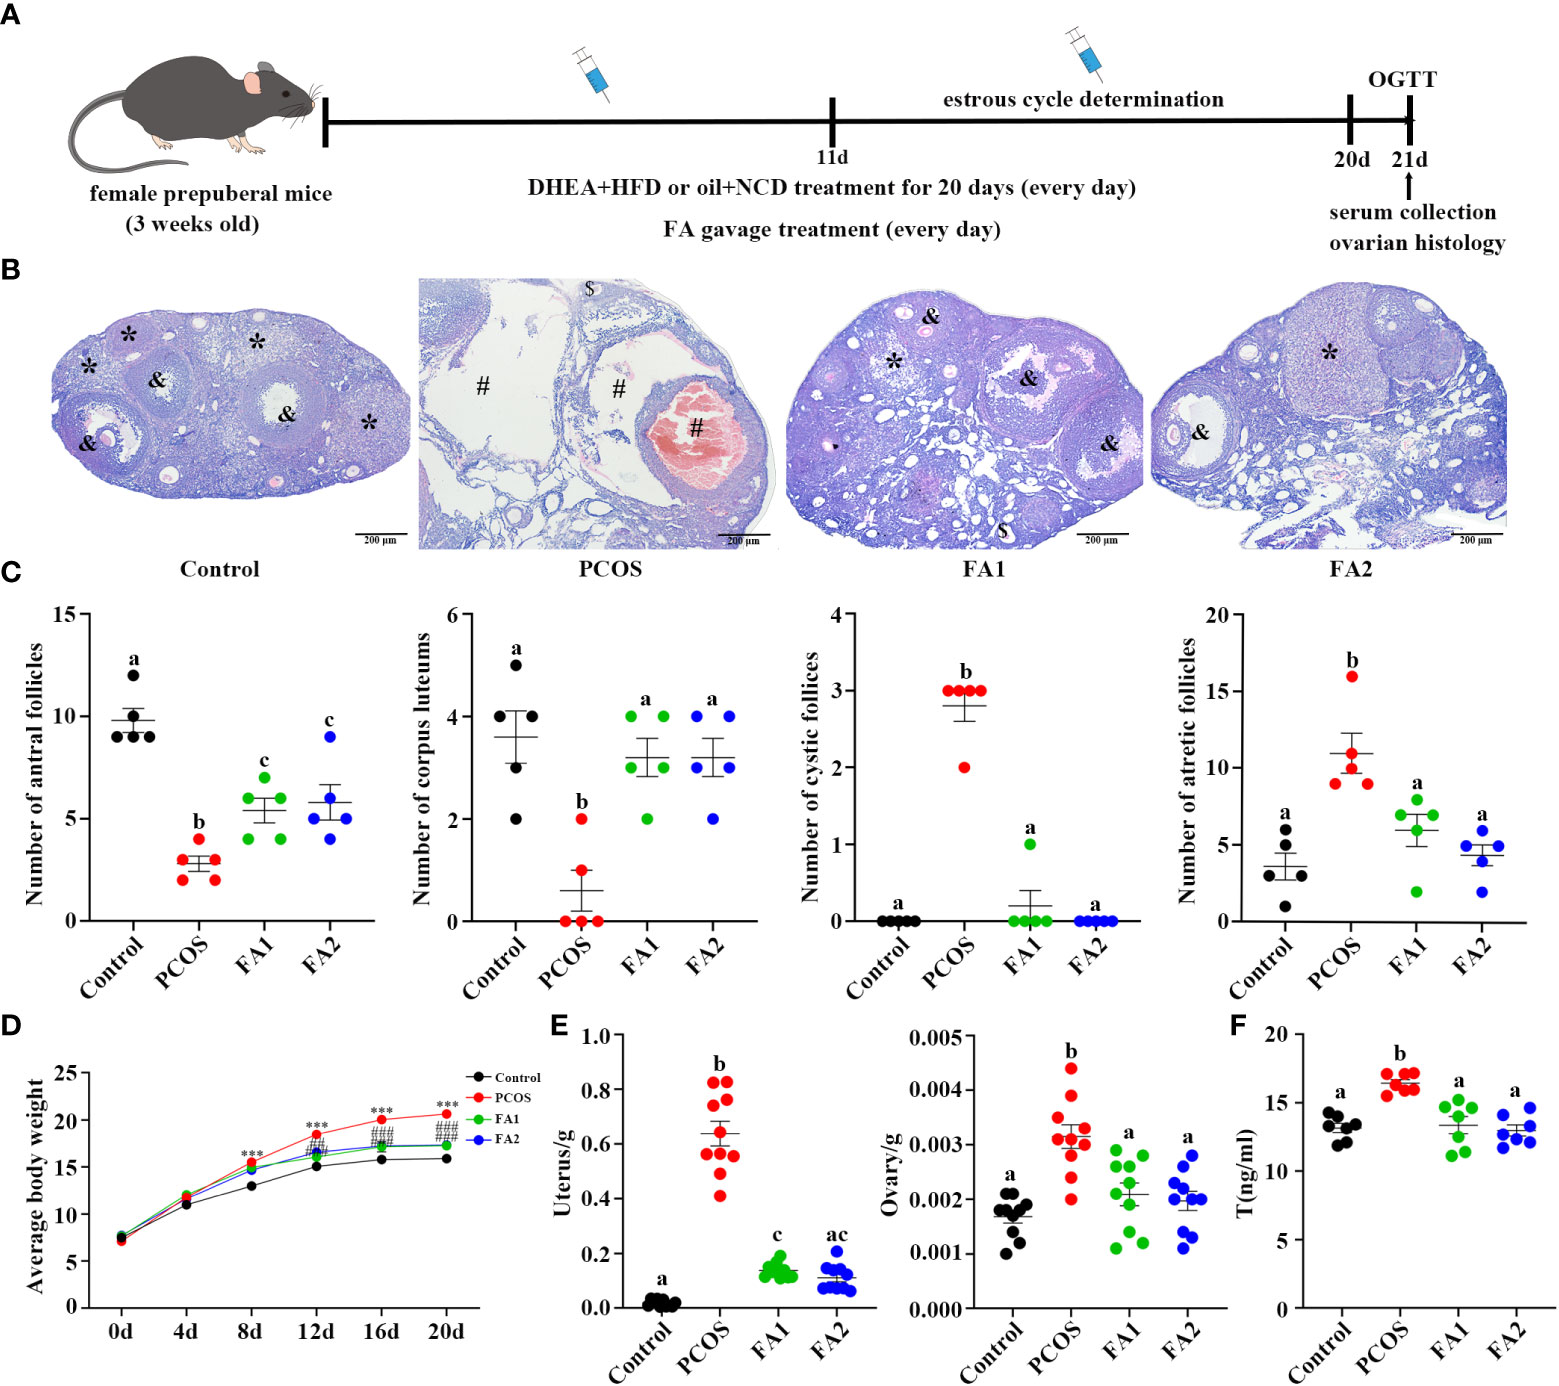
Figure 8 Amelioration of ovarian function in PCOS mice after ferulic acid administration. (A) Timeline of the experimental process. (B) Changes of ovary stained with Hematoxylin and eosin (H&E) (scale bar=200μm; & indicates antral follicle, * indicates corpora lutea; # indicates cystic follicles, $ indicates atretic follicle). (C) Changes in the numbers of antral follicles, corpora lutea, cyst-like follicles, and atretic follicles counted with H&E staining sections (n = 5/group). (D, E) Determination of weight of body, uterus and ovaries (n = 10/group, *** P <0.001 compared with the control group, ## P < 0.01; ### P < 0.001 compared with the PCOS group). (F) The levels of testosterone in the serum were determined using an enzyme-linked immunosorbent assay kit (n = 7/group). Statistical significance was determined using one-way or two-way ANOVA with Tukey’s multiple comparisons test and data are presented as the mean ± SEM, a, b and c indicate P < 0.05, if 2 groups have the same letter, it indicates no statistical significance.
3.8 Ferulic acid ameliorates glucose and lipid metabolism disorders in PCOS mice
FA was next tested for its regulatory effect on disrupted glucose and lipid metabolism in PCOS mice. The Figure 9A illustrated that FA administration largely corrected glucose tolerance impairment and dramatically reduced fasting glucose, serum insulin, and HOMA-IR levels in PCOS mice (Figure 9B–D). Besides, FA significantly lowered the values of BMI, Lee’s index, TC and LDL-C levels (Figure 9E, F, G, J). Consistently, the high FA dose significantly increased the HDL-C levels while decreased the TG levels (Figures 9H, I). Differently, the levels of TG and HDL-C in the low dose FA group were lower than the ones in the PCOS group but without statistical differences (Figures 9H, I). In general, these studies validated the effect of FA on PCOS similar to YLTB.
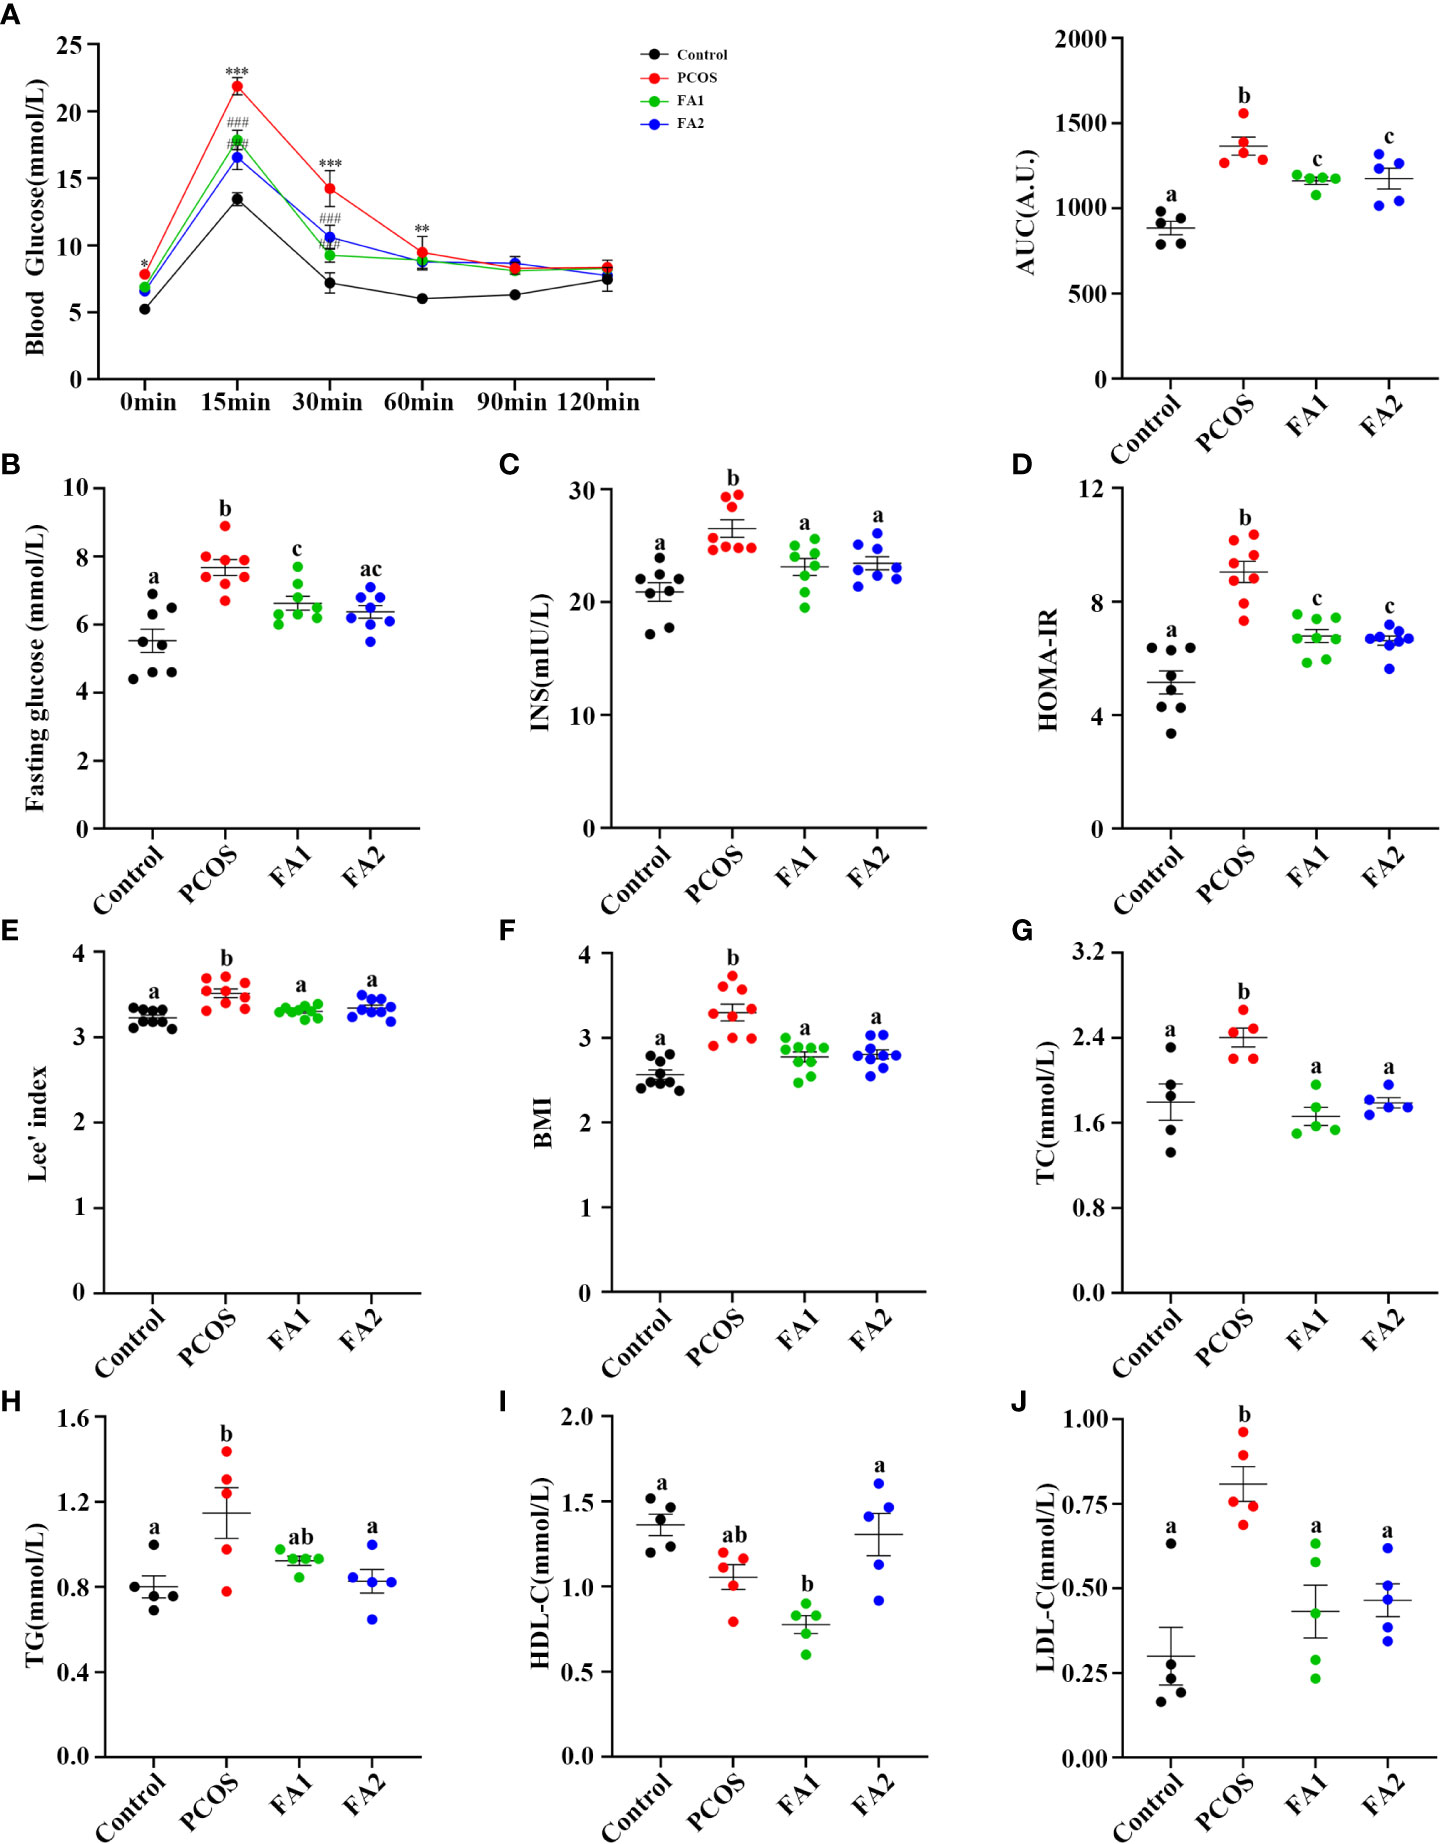
Figure 9 Ferulic acid ameliorated glucose and lipid metabolism disorders of PCOS mice. (A) Oral glucose tolerance tests (n = 5/group, ** P < 0.01; *** P < 0.001 compared with the control group, ### P < 0.001 compared with the PCOS group). (B, C) Blood glucose and serum insulin (n = 8/group) detection after a 12-hour fast in mice from the control, PCOS, and FA groups. (D) Changes of HOMA-IR index. HOMA-IR index = [FBG (mmol/L)] × [FINS (lU/mL)]/22.5 (n = 8/group). (E) Lee’s index and BMI calculation (n = 9/group). (G, H, I and J) Detection of plasma lipid metabolic indicators, TC, TG, HDL-C, and LDL-C in mice (n = 5/group). Statistical significance was determined using one-way or two-way ANOVA with Tukey’s multiple comparisons test and data are presented as the mean ± SEM, a, b and c indicate P < 0.05, if 2 groups have the same letter, it indicates no statistical significance.
4 Discussion
PCOS is a common endocrine disorder, which s characterized by ovarian dysfunction, hyperandrogenism and polycystic ovarian morphology. At present, TCM has been used to treat PCOS in Chinese women. The quality control of the YLTB used in this study was investigated by LC-MS (Figure 1A). The results showed that the positive and negative ion modes were respectively detected for the top 20 main compounds of YLTB detected, including nobiletin, berberine, quercetin, catechin, etc (Figure 1B, Table 2, Table 3). Numerous studies have found that the main components of YLTB (berberine, catechin, quercetin, and so on) have beneficial therapeutic effects in decreasing the levels of serum T (47, 48), TC (49), LH (48, 49), the ratio of LH/FSH (50), alleviating IR (47, 51, 52), dyslipidemia (51, 53) and other PCOS-related diseases.
With a focus on the therapeutic effects of YLTB on PCOS, our studies demonstrated the complicated association among the ovarian functions, the gut microbiota and metabolites in YLTB-gavaged PCOS mice, using 16S RNA sequencing combined with the non-targeted metabolomics. The ovarian dysfunction in PCOS mice was clearly attenuated by YLTB administration. Consistently, YLTB greatly restored the levels of fasting glucose, serum insulin and total cholesterol from PCOS condition to the normal. Other metabolites such as ferulic acid, folic acid and stachyose were regulated in a similar manner. In the PCOS group, the Firmicutes phylum was enriched whereas the Bacteroidota phylum was dominant in the YLTB group. Moreover, YLTB suppressed the abundance of the species of Bacteroides dorei, Bacteroides fragilis, and Lactobacillus johnsonii that were all enriched in PCOS mice. The enrichment of these bacteria species was tightly associated with metabolism of many metabolites, as well as host phenotypes in PCOS mice. Among the fecal metabolites, ferulic acid was validated to be effective against PCOS due to its capabilities of reducing ovarian dysfunction, improving disorders of glycolipid metabolism, and associating with the bacterial species.
YLTB ameliorates the host features of PCOS including glucose tolerance, insulin insensitivity, lipid metabolic disorder, and obesity. It is natural to propose that YLTB could substitute current medicines to treat PCOS patients. This idea can be supported by some other TCM studies targeting PCOS (54, 55). For instance, the formula Dang gui shao yao san treatment can significantly reduce plasma LH levels and increase estradiol levels as well as the ovulation rates in PCOS patients (54). Buzhong Yiqi prescription reduces serum androgen levels and regulates lipid metabolism in PCOS patients (55). It is not known yet whether YLTB is better than these two TCM treatments, which might be compared in future. Although ferulic acid has been identified as a critical component, it is not excluded that other possibilities might play important roles.
The therapeutic effect of YLTB on PCOS mice is also related to the amelioration of the gut microbiota dysbiosis. Transplantation with fecal microbiota of healthy control women has been shown to improve PCOS conditions via restoration of gut microbiota dysbiosis. (56). Our data demonstrated that the genus of Blautia, and species of Bacteroides dorei, Bacteroides fragilis were all enriched in PCOS mice and that YLTB administration attenuated the enrichment of these bacteria species. Consistent with our findings, others reported that Blautia was significantly increased in PCOS animals (57) and positively correlated with testosterone concentration, cysts in the ovaries, bodyweight and serum lipids (57, 58). Bacteroides fragilis was enriched in PCOS patients, and that clinical indicators such as BMI, T, and LH were positively correlated with it (59–61). In addition, enriched in the intestinal microbiota of PCOS patients, Bacteroides vulgatus caused ovarian dysfunction and metabolic disorders in mice (14). Therefore, the present study indicated that YLTB might ameliorate several PCOS disorders in mice by reversing disturbances in the gut microbiota.
Our analysis demonstrated a strong correlation among the fecal metabolites, the host phenotypes and the gut microbiota in PCOS or YLTB mice. FA was prioritized to be investigated for its association with the gut microbiota and PCOS. In our studies, PCOS resulted in a decrease in FA abundance, whereas YLTB reverted it significantly. FA improved disorders of glucose or lipid metabolism in PCOS mice. This is consistent with others’ observations that FA ameliorates lipid profiles and insulin sensitivity (62). Furthermore, our data demonstrated that FA is negatively correlated with 9 bacteria species, all of which were positively correlated with the host phenotypes, such as body weight, BMI, TC,T, LH, FBG, INS and HOMA-IR. Consistently, previous studies shown that FA improves a variety of disorders through modulating gut microbiota (31, 32, 63, 64). Our untargeted metabolomics predicted the roles of some metabolites, and we showed that ferulic acid and the other metabolites (such as folic acid, stachyose, etc.) may have crucial roles, which we will investigate deeply in our in our future studies.
5 Conclusion
The current study focuses on the therapeutic effects of YLTB administration on PCOS via modulating the gut microbiota and the associated metabolites. YLTB administration clearly attenuated ovarian dysfunction, restored glucose and lipid metabolism, and suppressed the abundance of several bacteria species such as Bacteroides dorei, Bacteroides fragilis, and Lactobacillus johnsonii of PCOS mice. These bacteria were strongly associated with many metabolites. Among the fecal metabolites, the effect of FA against PCOS was similar to that of YLTB.
Data availability statement
The datasets presented in this study can be found in online repositories. The names of the repository/repositories and accession number(s) can be found below: http://www.ncbi.nlm.nih.gov/bioproject/914098 (accession number PRJNA914098), http://www.ebi.ac.uk/metabolights/MTBLS6736 ( identifier MTBLS6736).
Ethics statement
The animal study was reviewed and approved by Institutional Animal Care and Use Committee of Chongqing Medical University (Animal Qualification Certificate No.2022109).
Author contributions
L-JF, QF designed and edited the experiments. Y-NS wrote the manuscript. Y-NS performed the experiments of PCOS model and M-JW conducted data analysis. Y-BD finalized the manuscript. J-PY and X-LW assisted the study. MX and M-HB contributed to experimental design. All authors have read, discussed and approved the final manuscript.
Funding
This work was funded by grants from National Natural Science of Foundation of China (Nos. 82104923, 82171624), Natural Science of Foundation of Chongqing (Nos. cstc2021jcyj-msxmX0236, cstc2021jcyj-msxmX0900, cstc2019jxjl130030) and Chongqing medical scientific research project (Joint project of Chongqing Health Commission and Science and Technology) (No.2022QNXM042), Chongqing Municipal Health Bureau Chinese Medicine Technology Project (serial number: ZY201802044).
Conflict of interest
The authors declare that the research was conducted in the absence of any commercial or financial relationships that could be construed as a potential conflict of interest.
Publisher’s note
All claims expressed in this article are solely those of the authors and do not necessarily represent those of their affiliated organizations, or those of the publisher, the editors and the reviewers. Any product that may be evaluated in this article, or claim that may be made by its manufacturer, is not guaranteed or endorsed by the publisher.
Supplementary material
The Supplementary Material for this article can be found online at: https://www.frontiersin.org/articles/10.3389/fendo.2023.1122709/full#supplementary-material
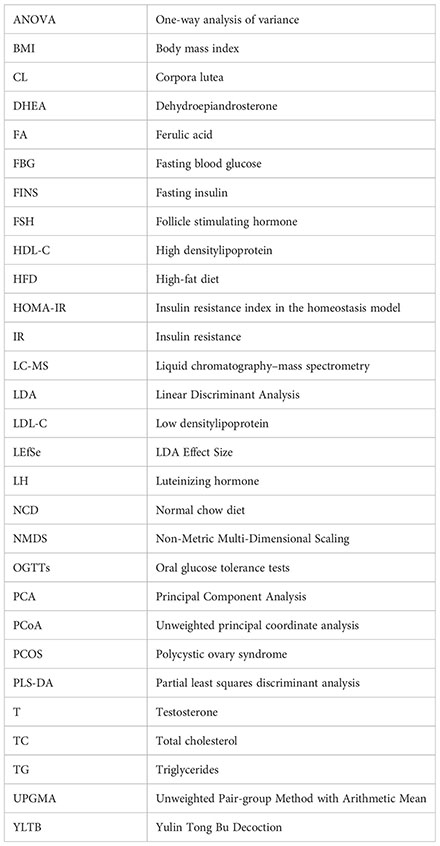
Glossary
References
1. Norman RJ, Dewailly D, Legro RS, Hickey TE. Polycystic ovary syndrome. Lancet (2007) 370:685–97. doi: 10.1016/S0140-6736(07)61345-2
2. March WA, Moore VM, Willson KJ, Phillips DI, Norman RJ, Davies MJ. The prevalence of polycystic ovary syndrome in a community sample assessed under contrasting diagnostic criteria. Hum Reprod (2010) 25:544–51. doi: 10.1093/humrep/dep399
3. Han Q, Wang J, Li W, Chen ZJ, Du Y. Androgen-induced gut dysbiosis disrupts glucolipid metabolism and endocrinal functions in polycystic ovary syndrome. Microbiome (2021) 9:101. doi: 10.1186/s40168-021-01046-5
4. Escobar-Morreale HF. Polycystic ovary syndrome: Definition, aetiology, diagnosis and treatment. Nat Rev Endocrinol (2018) 14:270–84. doi: 10.1038/nrendo.2018.24
5. Schmidt TH, Khanijow K, Cedars MI, Huddleston H, Pasch L, Wang ET, et al. Cutaneous findings and systemic associations in women with polycystic ovary syndrome. JAMA Dermatol (2016) 152:391–98. doi: 10.1001/jamadermatol.2015.4498
6. Insenser M, Murri M, Del CR, Martinez-Garcia MA, Fernandez-Duran E, Escobar-Morreale HF. Gut microbiota and the polycystic ovary syndrome: Influence of sex, sex hormones, and obesity. J Clin Endocrinol Metab (2018) 103:2552–62. doi: 10.1210/jc.2017-02799
7. He FF, Li YM. Role of gut microbiota in the development of insulin resistance and the mechanism underlying polycystic ovary syndrome: A review. J Ovarian Res (2020) 13:73. doi: 10.1186/s13048-020-00670-3
8. Janssen AW, Kersten S. The role of the gut microbiota in metabolic health. FASEB J (2015) 29:3111–23. doi: 10.1096/fj.14-269514
9. Martinez LE, Segura CM. Effect of ultra-processed diet on gut microbiota and thus its role in neurodegenerative diseases. Nutrition (2020) 71:110609. doi: 10.1016/j.nut.2019.110609
10. Xia WJ, Xu ML, Yu XJ, Du MM, Li XH, Yang T, et al. Antihypertensive effects of exercise involve reshaping of gut microbiota and improvement of gut-brain axis in spontaneously hypertensive rat. Gut Microbes (2021) 13:1–24. doi: 10.1080/19490976.2020.1854642
11. Thackray VG. Sex, microbes, and polycystic ovary syndrome. Trends Endocrinol Metab (2019) 30:54–65. doi: 10.1016/j.tem.2018.11.001
12. Liu R, Zhang C, Shi Y, Zhang F, Li L, Wang X, et al. Dysbiosis of gut microbiota associated with clinical parameters in polycystic ovary syndrome. Front Microbiol (2017) 8:324. doi: 10.3389/fmicb.2017.00324
13. Torres PJ, Siakowska M, Banaszewska B, Pawelczyk L, Duleba AJ, Kelley ST, et al. Gut microbial diversity in women with polycystic ovary syndrome correlates with hyperandrogenism. J Clin Endocrinol Metab (2018) 103:1502–11. doi: 10.1210/jc.2017-02153
14. Qi X, Yun C, Sun L, Xia J, Wu Q, Wang Y, et al. Gut microbiota-bile acid-interleukin-22 axis orchestrates polycystic ovary syndrome. Nat Med (2019) 25:1225–33. doi: 10.1038/s41591-019-0509-0
15. Li T, Zhang T, Gao H, Liu R, Gu M, Yang Y, et al. Tempol ameliorates polycystic ovary syndrome through attenuating intestinal oxidative stress and modulating of gut microbiota composition-serum metabolites interaction. Redox Biol (2021) 41:101886. doi: 10.1016/j.redox.2021.101886
16. Zhang J, Sun Z, Jiang S, Bai X, Ma C, Peng Q, et al. Probiotic bifidobacterium lactis V9 regulates the secretion of sex hormones in polycystic ovary syndrome patients through the gut-brain axis. Msystems (2019) 4:e17–19. doi: 10.1128/mSystems.00017-19
17. Wang T, Sha L, Li Y, Zhu L, Wang Z, Li K, et al. Dietary alpha-linolenic acid-rich flaxseed oil exerts beneficial effects on polycystic ovary syndrome through sex steroid hormones-Microbiota-Inflammation axis in rats. Front Endocrinol (Lausanne) (2020) 11:284. doi: 10.3389/fendo.2020.00284
18. Richards JL, Yap YA, McLeod KH, Mackay CR, Marino E. Dietary metabolites and the gut microbiota: an alternative approach to control inflammatory and autoimmune diseases. Clin Transl Immunol (2016) 5:e82. doi: 10.1038/cti.2016.29
19. De Vadder F, Kovatcheva-Datchary P, Goncalves D, Vinera J, Zitoun C, Duchampt A, et al. Microbiota-generated metabolites promote metabolic benefits via gut-brain neural circuits. Cell (2014) 156:84–96. doi: 10.1016/j.cell.2013.12.016
20. Wang R, Kim BV, van Wely M, Johnson NP, Costello MF, Zhang H, et al. Treatment strategies for women with WHO group II anovulation: systematic review and network meta-analysis. Bmj (2017) 356:j138. doi: 10.1136/bmj.j138
21. Weiss NS, Kostova E, Nahuis M, Mol B, van der Veen F, van Wely M. Gonadotrophins for ovulation induction in women with polycystic ovary syndrome. Cochrane Database Syst Rev (2019) 1:D10290. doi: 10.1002/14651858.CD010290.pub3
22. Mitwally M, Casper RF. Reprint of: Use of an aromatase inhibitor for induction of ovulation in patients with an inadequate response to clomiphene citrate. Fertil Steril (2019) 112:e178–82. doi: 10.1016/j.fertnstert.2019.08.087
23. Morley LC, Tang T, Yasmin E, Norman RJ, Balen AH. Insulin-sensitising drugs (metformin, rosiglitazone, pioglitazone, d-chiro-inositol) for women with polycystic ovary syndrome, oligo amenorrhoea and subfertility. Cochrane Database Syst Rev (2017) 11:D3053. doi: 10.1002/14651858.CD003053.pub6
24. Penzias A, Bendikson K, Butts S, Coutifaris C, Falcone T, Fossum G, et al. Role of metformin for ovulation induction in infertile patients with polycystic ovary syndrome (PCOS): a guideline. Fertil Steril (2017) 108:426–41. doi: 10.1016/j.fertnstert.2017.06.026
25. Xu Y, Tang J, Guo Q, Xu Y, Yan K, Wu L, et al. Traditional Chinese medicine formula FTZ protects against polycystic ovary syndrome through modulating adiponectin-mediated fat-ovary crosstalk in mice. J Ethnopharmacol (2021) 268:113587. doi: 10.1016/j.jep.2020.113587
26. Wang Y, Xiao H, Liu Y, Tong Q, Yu Y, Qi B, et al. Effects of bu shen hua zhuo formula on the LPS/TLR4 pathway and gut microbiota in rats with letrozole-induced polycystic ovary syndrome. Front Endocrinol (Lausanne) (2022) 13:891297. doi: 10.3389/fendo.2022.891297
27. Qiu Z, Dong J, Xue C, Li X, Liu K, Liu B, et al. Liuwei dihuang pills alleviate the polycystic ovary syndrome with improved insulin sensitivity through PI3K/Akt signaling pathway. J Ethnopharmacol (2020) 250:111965. doi: 10.1016/j.jep.2019.111965
28. Chen J, Feng Q, Fu LJ, Xia M. Yulin tongbu decoction in the treatment of spleen and kidney deficiency, phlegm-dampness block type therapeutic effect analysis of PCOS. Asia-Pacific Traditional Med (2022) 18:129–32. doi: 10.11954/ytctyy.202206027
29. Kou G, Li P, Hu Y, Chen H, Nyantakyiwaa AA, Seydou TS, et al. Nobiletin activates thermogenesis of brown and white adipose tissue in high-fat diet-fed C57BL/6 mice by shaping the gut microbiota. FASEB J (2021) 35:e21267. doi: 10.1096/fj.202002197R
30. Morrow NM, Trzaskalski NA, Hanson AA, Fadzeyeva E, Telford DE, Chhoker SS, et al. Nobiletin prevents high-fat diet-induced dysregulation of intestinal lipid metabolism and attenuates postprandial lipemia. Arterioscler Thromb Vasc Biol (2022) 42:127–44. doi: 10.1161/ATVBAHA.121.316896
31. Tian B, Geng Y, Wang P, Cai M, Neng J, Hu J, et al. Ferulic acid improves intestinal barrier function through altering gut microbiota composition in high-fat diet-induced mice. Eur J Nutr (2022) 61:3767–83. doi: 10.1007/s00394-022-02927-7
32. Gu Y, Zhang Y, Li M, Huang Z, Jiang J, Chen Y, et al. Ferulic acid ameliorates atherosclerotic injury by modulating gut microbiota and lipid metabolism. Front Pharmacol (2021) 12:621339. doi: 10.3389/fphar.2021.621339
33. Ghosh S, Chowdhury S, Sarkar P, Sil PC. Ameliorative role of ferulic acid against diabetes associated oxidative stress induced spleen damage. Food Chem Toxicol (2018) 118:272–86. doi: 10.1016/j.fct.2018.05.029
34. Naudhani M, Thakur K, Ni ZJ, Zhang JG, Wei ZJ. Formononetin reshapes the gut microbiota, prevents progression of obesity and improves host metabolism. Food Funct (2021) 12:12303–24. doi: 10.1039/d1fo02942h
35. Ma C, Xia R, Yang S, Liu L, Zhang J, Feng K, et al. Formononetin attenuates atherosclerosis via regulating interaction between KLF4 and SRA in apoE(-/-) mice. Theranostics (2020) 10:1090–106. doi: 10.7150/thno.38115
36. Oza MJ, Kulkarni YA. Formononetin treatment in type 2 diabetic rats reduces insulin resistance and hyperglycemia. Front Pharmacol (2018) 9:739. doi: 10.3389/fphar.2018.00739
37. Xie Q, Gu X, Chen J, Liu M, Xiong F, Wu X, et al. Soyasaponins reduce inflammation and improve serum lipid profiles and glucose homeostasis in high fat diet-induced obese mice. Mol Nutr Food Res (2018) 62:e1800205. doi: 10.1002/mnfr.201800205
38. Ren Y, Chen X, Li P, Zhang H, Su C, Zeng Z, et al. Si-Miao-Yong-An decoction ameliorates cardiac function through restoring the equilibrium of SOD and NOX2 in heart failure mice. Pharmacol Res (2019) 146:104318. doi: 10.1016/j.phrs.2019.104318
39. Ye Y, Zhang B, Li Y, Xu HD, Liu XM, Huang SM, et al. Yin huo tang, a traditional Chinese herbal formula, relives ovariectomy and empty bottle stimulation-induced menopause-like symptoms in mice. Front Endocrinol (Lausanne) (2022) 13:994642. doi: 10.3389/fendo.2022.994642
40. Pan X, Liu Y, Liu L, Pang B, Sun Z, Guan S, et al. Bushen jieyu tiaochong formula reduces apoptosis of granulosa cells via the PERK-ATF4-CHOP signaling pathway in a rat model of polycystic ovary syndrome with chronic stress. J Ethnopharmacol (2022) 292:114923. doi: 10.1016/j.jep.2021.114923
41. Wang M, Zhao D, Xu L, Guo W, Nie L, Lei Y, et al. Role of PCSK9 in lipid metabolic disorders and ovarian dysfunction in polycystic ovary syndrome. Metabolism (2019) 94:47–58. doi: 10.1016/j.metabol.2019.02.002
42. Lai H, Jia X, Yu Q, Zhang C, Qiao J, Guan Y, et al. High-fat diet induces significant metabolic disorders in a mouse model of polycystic ovary syndrome. Biol Reprod (2014) 91:127. doi: 10.1095/biolreprod.114.120063
43. Vashistha B, Sharma A, Jain V. Ameliorative potential of ferulic acid in vincristine-induced painful neuropathy in rats: An evidence of behavioral and biochemical examination. Nutr Neurosci (2017) 20:60–70. doi: 10.1179/1476830514Y.0000000165
44. Benrick A, Chanclon B, Micallef P, Wu Y, Hadi L, Shelton JM, et al. Adiponectin protects against development of metabolic disturbances in a PCOS mouse model. Proc Natl Acad Sci U S (2017) 114:E7187–96. doi: 10.1073/pnas.1708854114
45. Kyei G, Sobhani A, Nekonam S, Shabani M, Ebrahimi F, Qasemi M, et al. Assessing the effect of MitoQ(10) and vitamin D3 on ovarian oxidative stress, steroidogenesis and histomorphology in DHEA induced PCOS mouse model. Heliyon (2020) 6:e4279. doi: 10.1016/j.heliyon.2020.e04279
46. Xiao HW, Cui M, Li Y, Dong JL, Zhang SQ, Zhu CC, et al. Gut microbiota-derived indole 3-propionic acid protects against radiation toxicity via retaining acyl-CoA-binding protein. Microbiome (2020) 8:69. doi: 10.1186/s40168-020-00845-6
47. Zhang SW, Zhou J, Gober HJ, Leung WT, Wang L. Effect and mechanism of berberine against polycystic ovary syndrome. BioMed Pharmacother (2021) 138:111468. doi: 10.1016/j.biopha.2021.111468
48. Khorshidi M, Moini A, Alipoor E, Rezvan N, Gorgani-Firuzjaee S, Yaseri M, et al. The effects of quercetin supplementation on metabolic and hormonal parameters as well as plasma concentration and gene expression of resistin in overweight or obese women with polycystic ovary syndrome. Phytother Res (2018) 32:2282–89. doi: 10.1002/ptr.6166
49. Wang Z, Nie K, Su H, Tang Y, Wang H, Xu X, et al. Berberine improves ovulation and endometrial receptivity in polycystic ovary syndrome. Phytomedicine (2021) 91:153654. doi: 10.1016/j.phymed.2021.153654
50. Hong G, Wu H, Ma ST, Su Z. Catechins from oolong tea improve uterine defects by inhibiting STAT3 signaling in polycystic ovary syndrome mice. Chin Med (2020) 15:125. doi: 10.1186/s13020-020-00405-y
51. Mulvihill EE, Assini JM, Lee JK, Allister EM, Sutherland BG, Koppes JB, et al. Nobiletin attenuates VLDL overproduction, dyslipidemia, and atherosclerosis in mice with diet-induced insulin resistance. Diabetes (2011) 60:1446–57. doi: 10.2337/db10-0589
52. Gandhi GR, Vasconcelos A, Wu DT, Li HB, Antony PJ, Li H, et al. Citrus flavonoids as promising phytochemicals targeting diabetes and related complications: A systematic review of In vitro and In vivo studies. Nutrients (2020) 12:2907. doi: 10.3390/nu12102907
53. Mulvihill EE, Burke AC, Huff MW. Citrus flavonoids as regulators of lipoprotein metabolism and atherosclerosis. Annu Rev Nutr (2016) 36:275–99. doi: 10.1146/annurev-nutr-071715-050718
54. Ushiroyama T, Hosotani T, Mori K, Yamashita Y, Ikeda A, Ueki M. Effects of switching to wen-jing-tang (unkei-to) from preceding herbal preparations selected by eight-principle pattern identification on endocrinological status and ovulatory induction in women with polycystic ovary syndrome. Am J Chin Med (2006) 34:177–87. doi: 10.1142/S0192415X06003746
55. Ni Z, Cheng W, Ding J, Yao R, Zhang D, Zhai D, et al. Impact of buzhong yiqi prescription on the gut microbiota of patients with obesity manifesting polycystic ovarian syndrome. Evid Based Complement Alternat Med (2021) 2021:6671367. doi: 10.1155/2021/6671367
56. Quaranta G, Sanguinetti M, Masucci L. Fecal microbiota transplantation: A potential tool for treatment of human female reproductive tract diseases. Front Immunol (2019) 10:2653. doi: 10.3389/fimmu.2019.02653
57. Liyanage G, Inoue R, Fujitani M, Ishijima T, Shibutani T, Abe K, et al. Effects of soy isoflavones, resistant starch and antibiotics on polycystic ovary syndrome (PCOS)-like features in letrozole-treated rats. Nutrients (2021) 13:3759. doi: 10.3390/nu13113759
58. Zeng Q, Li D, He Y, Li Y, Yang Z, Zhao X, et al. Discrepant gut microbiota markers for the classification of obesity-related metabolic abnormalities. Sci Rep (2019) 9:13424. doi: 10.1038/s41598-019-49462-w
59. Chu W, Han Q, Xu J, Wang J, Sun Y, Li W, et al. Metagenomic analysis identified microbiome alterations and pathological association between intestinal microbiota and polycystic ovary syndrome. Fertil Steril (2020) 113:1286–98. doi: 10.1016/j.fertnstert.2020.01.027
60. Liang Z, Di N, Li L, Yang D. Gut microbiota alterations reveal potential gut-brain axis changes in polycystic ovary syndrome. J Endocrinol Invest (2021) 44:1727–37. doi: 10.1007/s40618-020-01481-5
61. Dong S, Jiao J, Jia S, Li G, Zhang W, Yang K, et al. 16S rDNA full-length assembly sequencing technology analysis of intestinal microbiome in polycystic ovary syndrome. Front Cell Infect Microbiol (2021) 11:634981. doi: 10.3389/fcimb.2021.634981
62. Senaphan K, Kukongviriyapan U, Sangartit W, Pakdeechote P, Pannangpetch P, Prachaney P, et al. Ferulic acid alleviates changes in a rat model of metabolic syndrome induced by high-carbohydrate, high-fat diet. Nutrients (2015) 7:6446–64. doi: 10.3390/nu7085283
63. Song Y, Wu MS, Tao G, Lu MW, Lin J, Huang JQ. Feruloylated oligosaccharides and ferulic acid alter gut microbiome to alleviate diabetic syndrome. Food Res Int (2020) 137:109410. doi: 10.1016/j.foodres.2020.109410
Keywords: polycystic ovary syndrome, YLTB formula, gut microbiota, metabolites, ferulic acid
Citation: Su Y-N, Wang M-J, Yang J-P, Wu X-L, Xia M, Bao M-H, Ding Y-B, Feng Q and Fu L-J (2023) Effects of Yulin Tong Bu formula on modulating gut microbiota and fecal metabolite interactions in mice with polycystic ovary syndrome. Front. Endocrinol. 14:1122709. doi: 10.3389/fendo.2023.1122709
Received: 13 December 2022; Accepted: 24 January 2023;
Published: 06 February 2023.
Edited by:
Shunfeng Cheng, Qingdao Agricultural University, ChinaReviewed by:
Wen-Xiang Liu, Inner Mongolia University, ChinaGuruswami Gurusubramanian, Mizoram University, India
Copyright © 2023 Su, Wang, Yang, Wu, Xia, Bao, Ding, Feng and Fu. This is an open-access article distributed under the terms of the Creative Commons Attribution License (CC BY). The use, distribution or reproduction in other forums is permitted, provided the original author(s) and the copyright owner(s) are credited and that the original publication in this journal is cited, in accordance with accepted academic practice. No use, distribution or reproduction is permitted which does not comply with these terms.
*Correspondence: Li-Juan Fu, ZnVsaWp1YW5AY3FtdS5lZHUuY24=; Qian Feng, NDY5MjgwNDk3QHFxLmNvbQ==
†These authors have contributed equally to this work and share first authorship