
95% of researchers rate our articles as excellent or good
Learn more about the work of our research integrity team to safeguard the quality of each article we publish.
Find out more
ORIGINAL RESEARCH article
Front. Endocrinol. , 08 May 2023
Sec. Translational and Clinical Endocrinology
Volume 14 - 2023 | https://doi.org/10.3389/fendo.2023.1111614
This article is part of the Research Topic Non-Alcoholic Fatty Liver Disease Across Endocrine Diseases: From Pathophysiology to Novel Therapeutic Approaches View all 5 articles
 Diogo Pellegrina1†
 Khairunnadiya Prayitno2†
 Amirhossein Azhie2Elisa Pasini2
 Cristina Baciu2
 Sandra Fischer3
 Jüri Reimand1,4,5*‡
 Mamatha Bhat2,6,7*‡
Background: Non-alcoholic steatohepatitis (NASH) has become a leading indication for liver transplantation. However, it often recurs in the graft and can also arise de novo in individuals transplanted for other indications. Post-transplant NASH (PT-NASH) is more aggressive and leads to accelerated fibrosis. The mechanistic basis of PT-NASH has not yet been defined and no specific therapeutic strategies are currently available.
Methods: Here, we profiled the transcriptomes of livers with PT-NASH from liver transplant recipients to identify dysregulated genes, pathways, and molecular interaction networks.
Results: Transcriptomic changes in the PI3K-Akt pathway were observed in association with metabolic alterations in PT-NASH. Other significant changes in gene expression were associated with DNA replication, cell cycle, extracellular matrix organization, and wound healing. A systematic comparison with non-transplant NASH (NT-NASH) liver transcriptomes indicated an increased activation of wound healing and angiogenesis pathways in the post-transplant condition.
Conclusion: Beyond altered lipid metabolism, dysregulation of wound healing and tissue repair mechanisms may contribute to the accelerated development of fibrosis associated with PT-NASH. This presents an attractive therapeutic avenue to explore for PT-NASH to optimize the benefit and survival of the graft.
Non-alcoholic fatty liver disease (NAFLD) is rising alongside the global epidemics of diabetes and obesity. One fourth of the global population and one third of North Americans are estimated to have NAFLD, encompassing a disease spectrum ranging from steatosis to non-alcoholic steatohepatitis (NASH) and cirrhosis (1, 2). Fat accumulation leads to inflammation, whereby wound healing is induced to repair tissue damage that, if left unchecked, can slowly develop into scarring and liver failure (3).
The increasing incidence of NASH has increased the necessity for liver transplantation (LT). In fact, NASH has become one of the top indications of LT globally (4). Accordingly, post-transplant NAFLD and NASH (PT-NASH) are common and associated with compromised survival after LT (2). While non-transplant NAFLD and NASH (NT-NASH) remain silent and progress at a rate of one stage per 14 years and seven years respectively (2), post-transplant diseases develop more rapidly, with almost half of recipients with NAFLD/NASH presenting recurrence with stage three fibrosis within five years (5).
PT-NASH is an aggressive disease that develops in a “normal” graft of LT recipients, but its molecular basis is not well understood. Previous studies have compared NT-NASH livers to healthy livers and found transcriptomic correlations with disease progression (6–8). Liver signatures of NT-NASH are largely overlapping with NAFLD but distinct from healthy livers. These signatures have been related to the dysregulation of lipid metabolism, immunomodulation, extracellular matrix remodeling, and cell cycle control (6). Here, we highlight transcriptomic changes that occur in human PT-NASH.
Adult LT recipients with post-transplant biopsies performed at University Health Network (UHN) (Toronto, ON, Canada) during 2016-2020 were selected by a pathologist and classified using the NAFLD activity scoring (NAS) (9) and METAVIR scoring for fibrosis (10). Archived fresh-frozen liver biopsy samples were collected from the Multi-Organ Transplant Biobank, including four samples with evidence of PT-NASH (two recurrent and two de novo), two with PT-steatosis (both de novo), and four controls with normal liver histology. This protocol was approved by the UHN Institutional Research Ethics Board (REB #17-5102).
RNA was isolated from fresh-frozen tissue using the RNeasy Mini Kit (Qiagen) and evaluated on a Bioanalyzer (Agilent). Libraries were prepared using the KAPA RNA HyperPrep Kit with RiboErase (Roche) and sequenced on Illumina NovaSeq 6000 at the genomics core of Ontario Institute for Cancer Research (OICR). Sequencing runs were performed at 2x151 bps to the depth of 100 million paired end reads. Raw data are available in ArrayExpress (accession E-MTAB-11688).
Unstranded paired reads with inward orientation were pseudo-aligned using Salmon method (version 1.5.1) (11) and the human genome GRCh38.p13 (Ensembl) with default parameters. Genes were quantified as transcript per million (TPM) values.
The DESeq2 R package (12) with tximport was used for differential expression analysis using a binary design comparing PT-NASH samples with controls. Differentially expressed genes (DEGs) were filtered for false discovery rate (FDR) ≤ 0.05. Genes with small fold changes (|log2 FC| ≤ 1), low expression (mean ≤ 0.1 TPM) and/or missing P-values were removed. To study changes in disease progression, we defined the genes as monotonic or non-monotonic, by comparing average TPM values in control, PT-steatosis, and PT-NASH samples. Genes classified as monotonic showed increasing or decreasing TPM changes in disease progression while non-monotonic genes showed extreme values in the PT-steatosis group. Pearson correlation distance was used for clustering.
To compare our data with NT-NASH transcriptomes, we reanalyzed a previously published RNA-seq dataset of human livers with NAFL (steatosis), NT-NASH, and healthy controls (GSE126848) (6). We performed the DESeq2 differential gene expression analysis using the read counts dataset of the original study and converted these to TPM values using Ensembl GRCh38 for transcript lengths. Significant DEGs were identified using the following filters: FDR ≤ 0.01, |log2 FC| ≥ 1, TPM ≥ 0.1. Due to the increased size and statistical power of this dataset, we performed down-sampling and DESeq2 analysis of 1000 sets of four control and four NT-NASH samples, and conservatively assigned each gene the median down-sampled P-value followed by FDR correction.
Pathway enrichment analysis was performed using the ActivePathways method (version 1.0.2) (13) and its default parameters. Gene sets of Gene Ontology (GO), wikipathways, and REACTOME were used for functional annotations (retrieved from the g:Profiler website, 2021-11-07). Significantly enriched pathways (FDR < 0.2) were visualized using EnrichmentMap and Cytoscape with standard protocols (14).
We constructed a protein-protein interaction (PPI) network of all DEGs found in PT-NASH and NT-NASH using BioGRID (15). The primary PPI network included the interactions of DEGs defined above. To study additional sub-significant genes, we included a secondary PPI network of interactions with less-stringent DEGs (FDR < 0.2).
We identified six available samples from LT recipients diagnosed with PT-steatosis or PT-NASH by liver biopsy, and four control recipients who had no signs of either condition on PT protocol biopsy. The average PT-BMI (range) across the groups were similar with controls at 31 (24-42), PT-steatosis at 29 (27-31), and PT-NASH at 31 (24-34). Other patient characteristics and histological findings are summarized in Table 1.
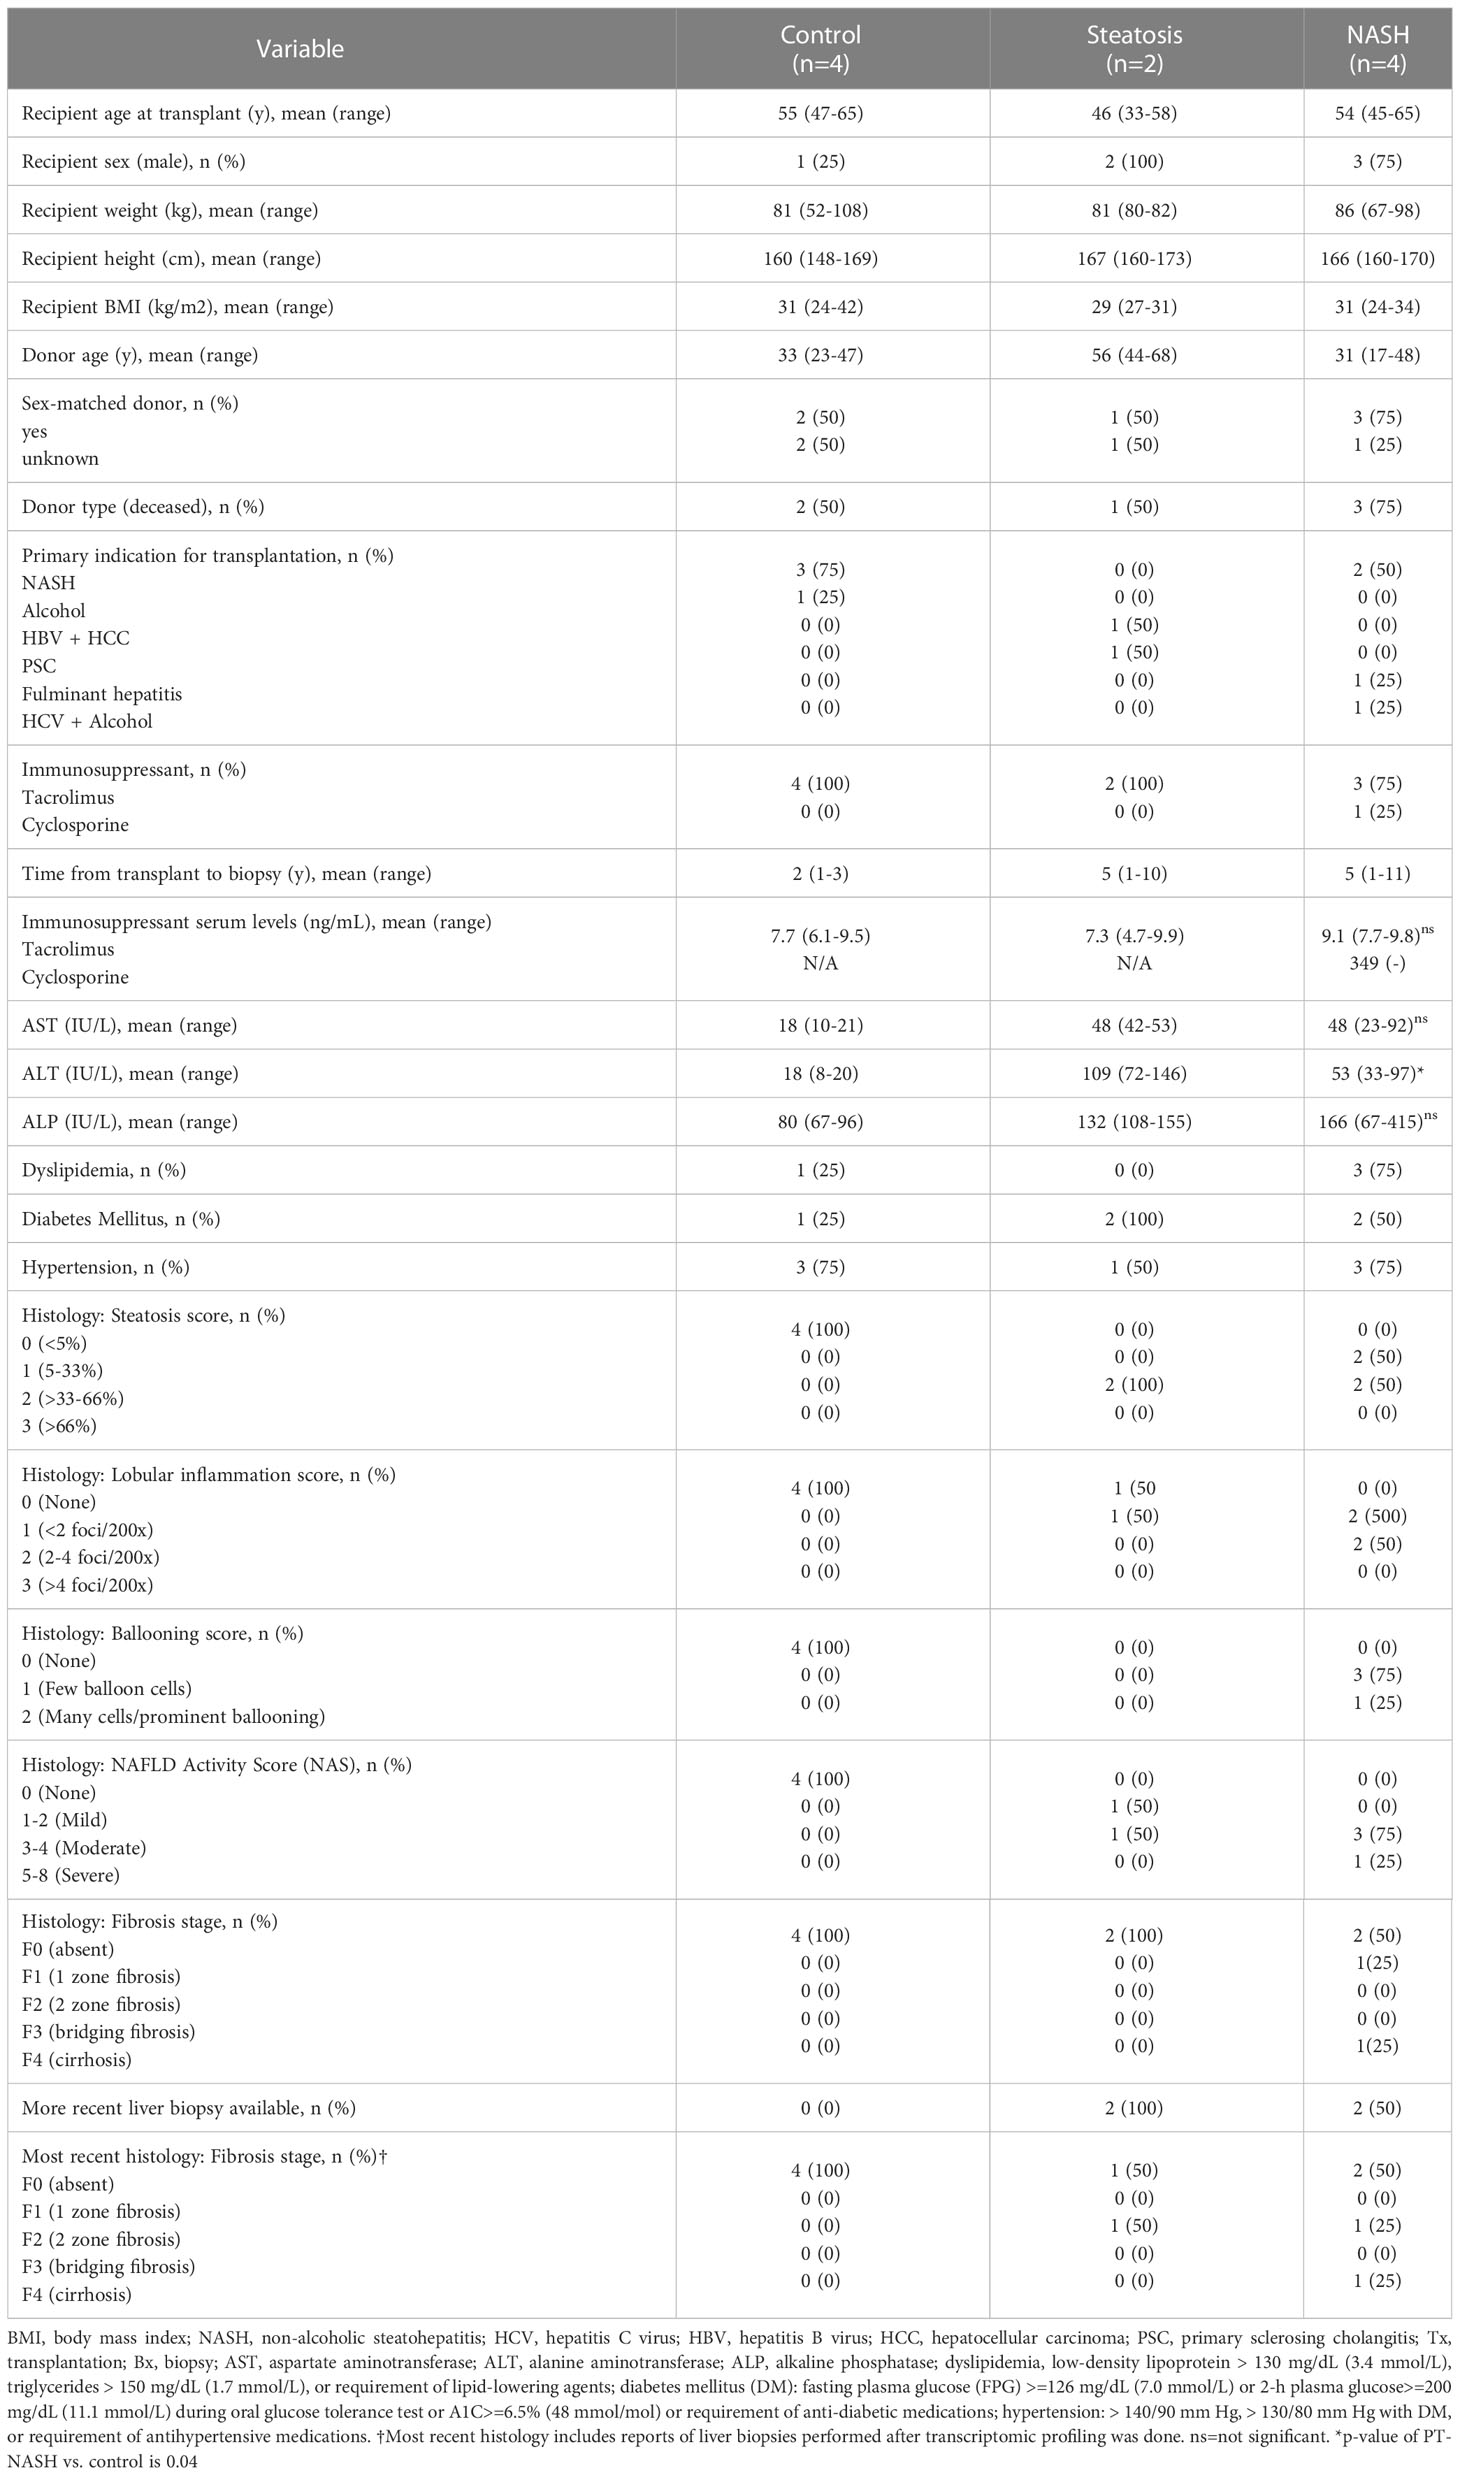
Table 1 Clinicopathological characteristics of transplant recipients included in the study.
We sequenced the transcriptomes of liver biopsies and identified 98 upregulated and 20 downregulated differentially expressed genes (DEGs) in PT-NASH samples compared to controls (Figure 1A, Supplementary Table 1). Principal component analysis (PCA) of the DEGs revealed that PT-NASH and control samples can be separated using the (PC2) = (PC1)/2 equation, while the principal component analysis with all genes placed all NASH samples linearly with the formula (PC2) = -(PC1)/6 ± 10000 (Supplementary Figure 1). Among the top 25 DEGs, protein phosphatase 1 regulatory subunit 10 (PPP1R10), IQ motif containing GTPase activating protein 3 (IQGAP3), and triggering receptor expressed on myeloid cells 2 (TREM2) were upregulated. Meanwhile, ribonuclease/angiogenin inhibitor 1 (RNH1) and nuclear receptor NR0B2 were downregulated. We also identified two novel lncRNA genes: ENSG00000278996 was exclusively expressed in PT-NASH while ENSG00000273184 was only expressed in control.
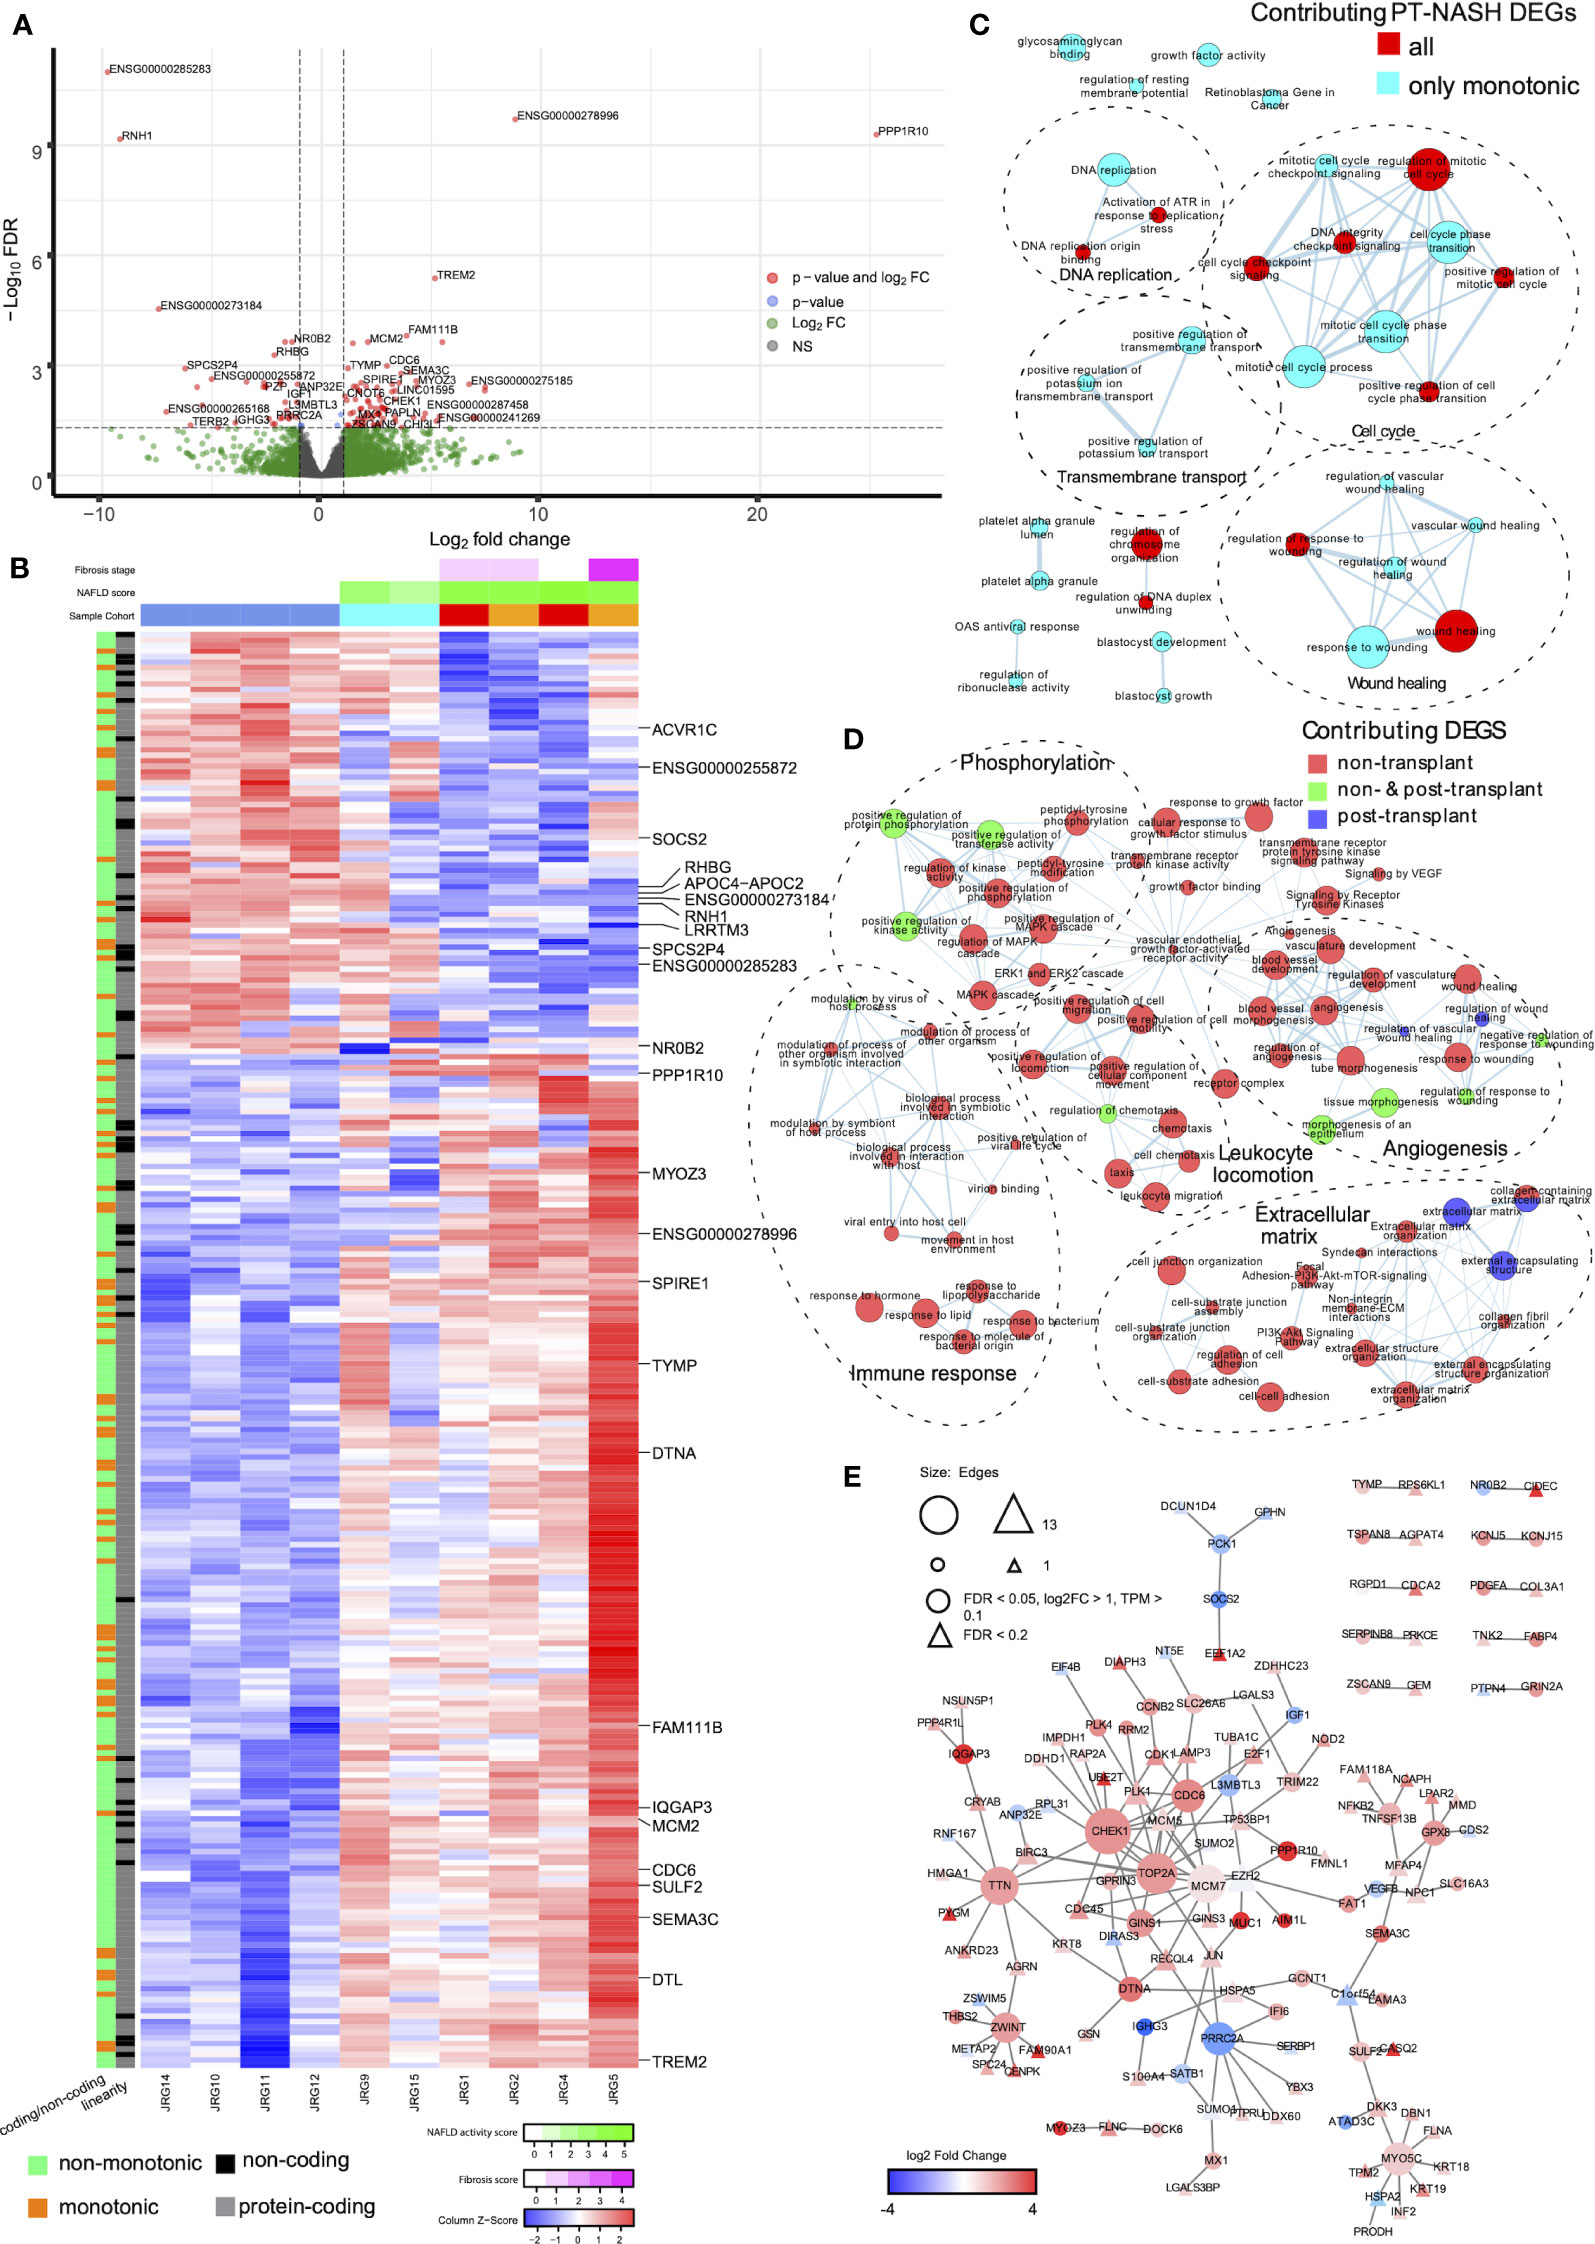
Figure 1 Gene expression patterns, enriched pathways, and protein-protein interaction (PPI) networks in livers with post-transplant and non-transplant NASH. (A) Volcano plot of differential gene expression in PT-NASH compared to control. Green: log2 FC ≥ 1; blue: FDR ≤ 0.05; red: log2 FC ≥ 1 and FDR ≤ 0.05. (B) Heatmap of TPM values of all PT-NASH DEGs. Sample annotations are shown at the top. The first row represents fibrosis score (purple), the second row represents NAFLD activity score (NAS, green); and the third row represents sample group (blue: control; cyan: steatosis; orange: de novo NASH; red: recurrent NASH). Gene annotations are shown on the left (orange: monotonic; green: non-monotonic; grey: protein-coding genes; black: lncRNAs). The 25 top DEGs are labelled on the right. (C) Enrichment map of pathways found in monotonic and non-monotonic PT-NASH expression patterns (ActivePathways, FDR < 0.2). Each pathway is a node, edges connect pathways sharing many genes, and colors indicate DEGs contribution to pathway enrichments (cyan: monotonic; red: combined monotonic and non-monotonic). Subnetworks were annotated manually to combine similar pathways (dashed circles). (D) Map of enriched pathways in PT-NASH and NT-NASH (ActivePathways, FDR < 0.2). Colors indicate disease type contributing to pathway enrichment (red: NT-NASH; blue: PT-NASH; green: combined). (E) PPI network interactions with DEGs in PT-NASH. Color indicates expression fold-change (PT-NASH vs. control livers), and circles show the most significant DEGs. Triangles indicate additional less-significant genes (FDR < 0.2).
To decipher the transcriptomic changes occurring throughout the disease course, we classified genes as having consistent increase or decrease in expression (i.e., monotonic) or no consistent change (i.e., non-monotonic) based on the changes in transcript abundance from control to PT-steatosis to PT-NASH states (Figure 1B, Supplementary Figure 2). Overall, 45% of genes (8,875) were classified as monotonic and 55% (10,972) as non-monotonic (Supplementary Figure 3). In contrast, the majority of significant DEGs (83% or 98/118) were monotonic, suggesting consistent increases or decreases of these differential expression patterns through disease evolution (Supplementary Figure 3).
To systematically compare our findings, we reanalyzed the previously published transcriptomes of NT-NASH with fibrosis (6) and identified 206 upregulated and 242 downregulated DEGs in NT-NASH (Supplementary Table 2). Interestingly, only 16% (19/118) of genes we identified as DEGs in PT-NASH were also found in NT, indicating differences in molecular disease phenotypes. The fractions of monotonic and non-monotonic gene expression patterns were similar in NT-NASH (41% monotonic), and most DEGs were classified as monotonic (61%, 274/448) (Supplementary Figure 3), confirming our observations in PT-NASH. Most DEGs shared between NT and PT were also monotonic (89%, 17/19).
To identify dysregulated pathways in the disease samples, we performed joint functional enrichment analyses combining DEGs identified in our transcriptomics experiment (PT-NASH) and from an earlier study of NT-NASH (6). We identified collagen-containing ECM, extracellular organization, wound healing, and phosphoinositide-3-kinase-protein kinase B (PI3K-Akt) signaling pathways that were dysregulated regardless of transplantation status (Table 2, Figure 1C, Supplementary Figures 4A, B). Dysregulated pathways specific to PT-NASH included ECM (extracellular matrix, external encapsulating structure), vascular wound healing (regulation and response to wounding, angiogenesis, platelet alpha granule, glycosaminoglycan binding, heparin binding), and cell cycle (mitotic cell cycle, checkpoint signaling, DNA replication) (Table 3, Figure 1D, Supplementary Figures 4C, D). All significantly dysregulated pathways in PT-NASH and NT-NASH are provided in Supplementary Tables 3, 4. To examine the common and distinct features of the identified pathways, we studied the shared DEGs found in the GO biological processes “collagen-containing extracellular matrix”, “extracellular structure organization”, “extracellular matrix organization”, “wound healing”, and “response to wounding” (Supplementary Figure 5). While the DEGs involved in “wound healing” and “response to wounding” were often shared (Jaccard coefficient 0.75), the DEGs involved in wound healing were mostly distinct from ECM-related genes (Jaccard coefficient 0.15). However, a few multifunctional genes were found in both types of processes, such as serpin family E member 1 (SERPINE1), SPARC-related modular calcium binding protein 2 (SMOC2), and collagen type III alpha 1 chain (COL3A1).
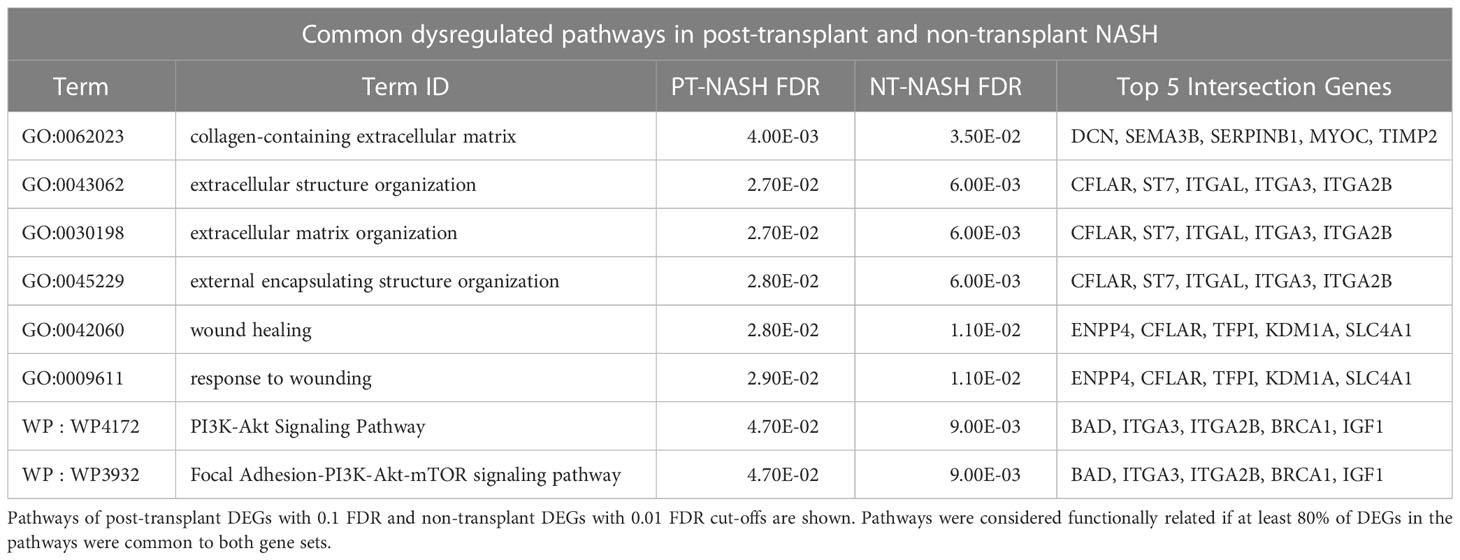
Table 2 Significantly enriched pathways common to PT-NASH and NT-NASH.
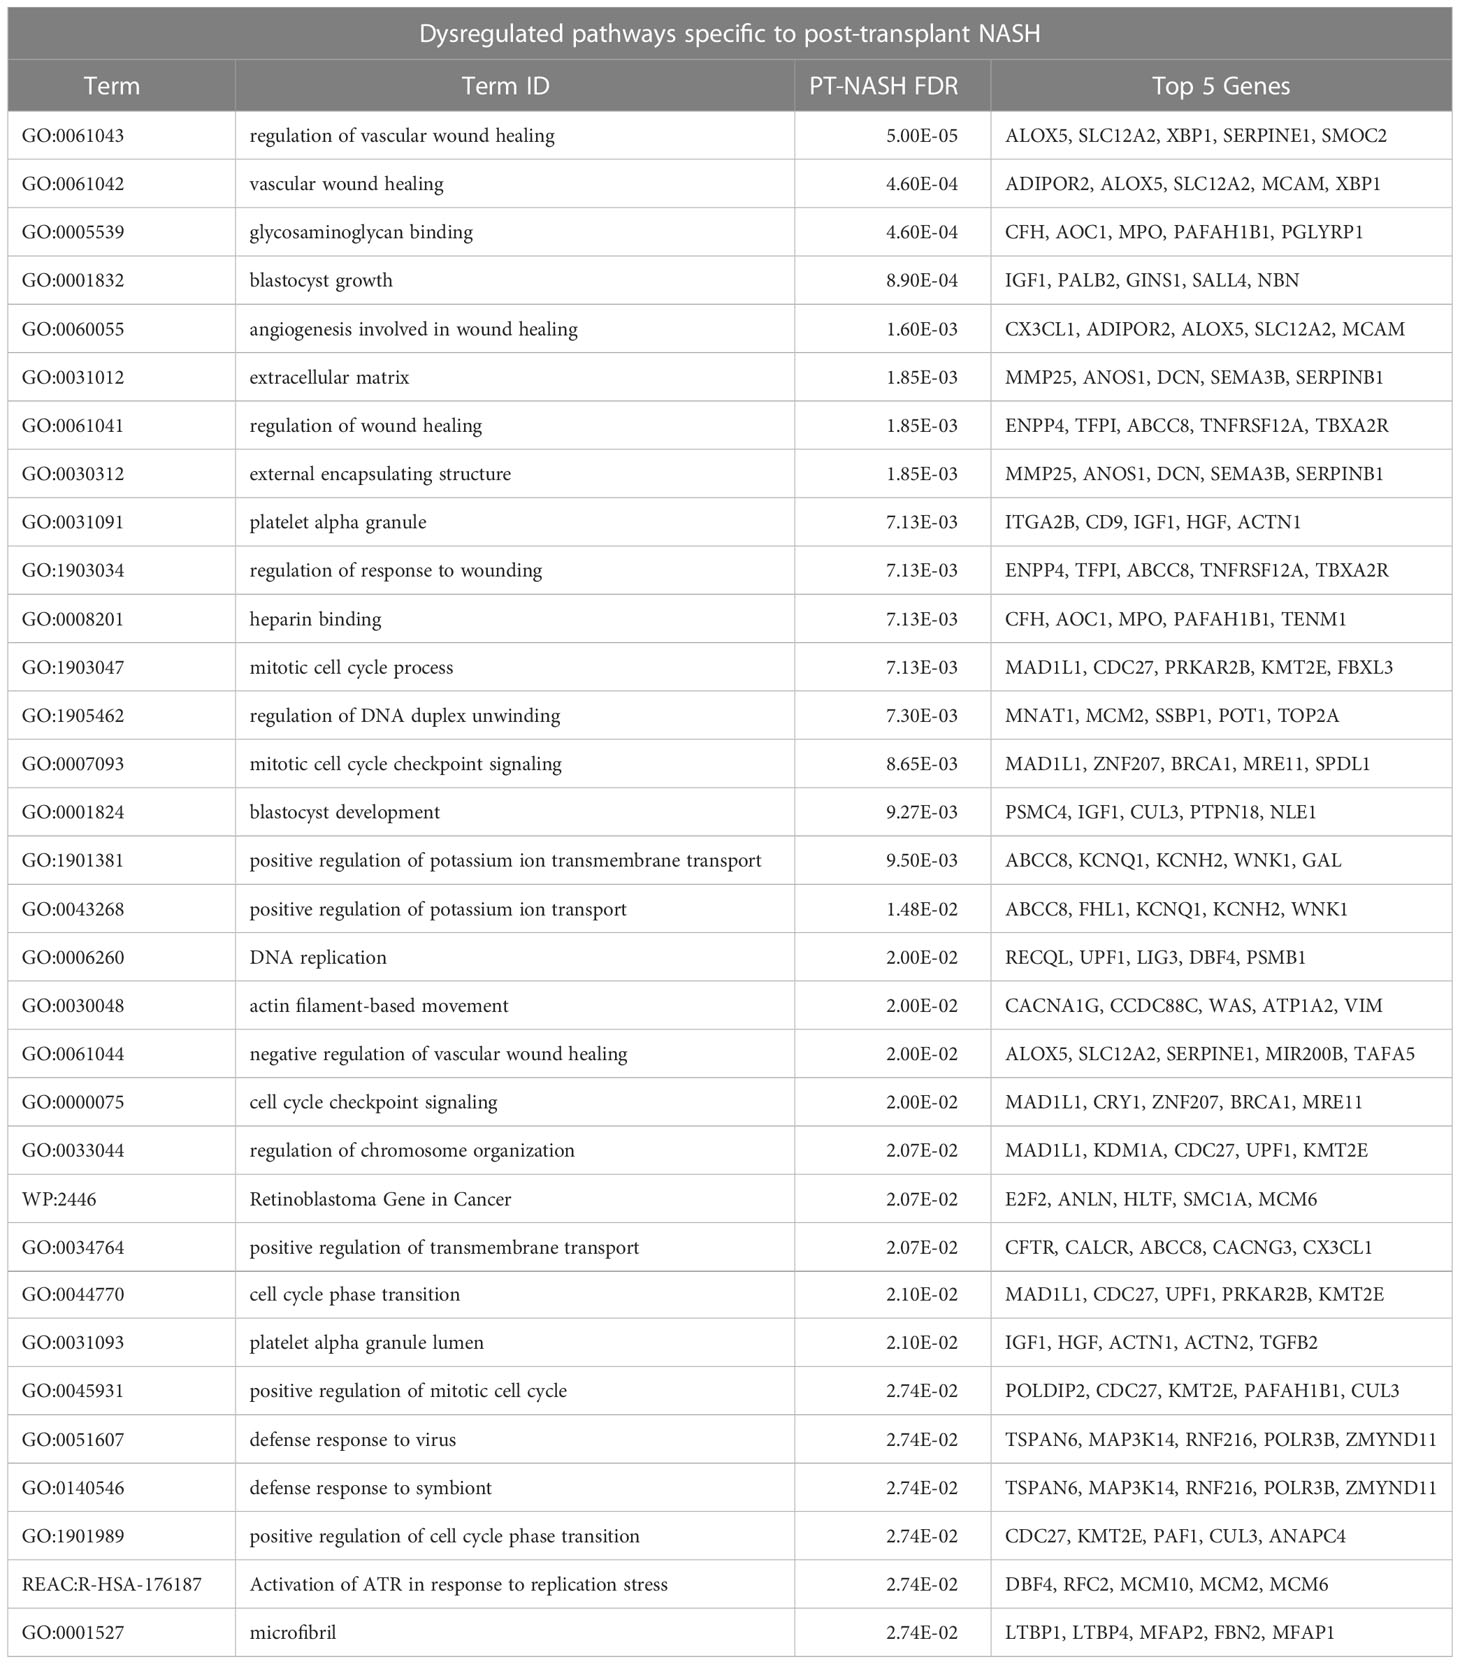
Table 3 Significantly enriched pathways specific to PT-NASH. Post-transplant DEGs with 0.1 FDR cut-offs are shown.
Next, we analyzed the protein-protein interaction (PPI) networks of the DEGs identified in PT-NASH transcriptomes (Figure 1E). The network analysis highlighted mucin 1 (MUC1), absent in melanoma 1-like gene (AIM1L), and thrombospondin 2 (THBS2) among the upregulated genes, while the downregulated genes included insulin-growth factor 1 (IGF1), phosphoenolpyruvate carboxykinase 1 (PCK1), and suppressor of cytokine signaling 2 (SOCS2).
In our comparison of PT-NASH to NT-NASH, we identified dysregulation of the PI3K-Akt signaling pathway, which has been associated with metabolic dysfunction, including obesity, metabolic syndrome, and NAFLD (16). Blocking PI3K signaling in hepatic stellate cells inhibits ECM deposition and reduces profibrotic factor expression (17). We also found processes of ECM organization to be affected regardless of transplantation status. Upregulated genes in PT-NASH included known biomarkers of NASH and advanced liver fibrosis, i.e., MUC1, AIM1L and THBS2 (18–20). Among the downregulated genes were IGF1, a hormone-like insulin that is inversely associated with liver fibrosis in diabetes patients (21), PCK1, an activator of the PI3K pathway, whose downregulation causes aggravated fibrosis and inflammation in a NASH model (22), and SOCS2, a negative regulator of cytokine signaling that suppresses inflammation during NASH progression (23).
While our findings reiterate the molecular similarities of PT-NASH and NT-NASH, they also highlight the likely contribution of dysregulated tissue repair, i.e., wound healing and fibrosis, to the aggressive and faster progression of PT-NASH. Indeed, a comparison of our top 25 DEGs with an earlier meta-analysis of NT-NASH of 206 NAFLD patients (7) revealed greater overlap of wound healing or liver fibrosis and cirrhosis-related genes, including dystrobrevin alpha (DTNA) and sulfatase 2 (SULF2). Of note, none of our LT recipients received mTOR inhibitors as immunosuppressants, which are known to inhibit wound healing. Instead, these patients were treated with calcineurin inhibitors. Thus, the dysregulation of PI3K signaling and wound healing-related mechanisms we observed in PT-NASH were likely not a side effect of the immunosuppression therapy.
We found pathways related to wound healing to share numerous genes, and similar observation is true for ECM-related pathways. This is in part expected, as GO terms are structured in hierarchies, and those of the lower hierarchy will likely be identified separately despite belonging to a hierarchically higher pathway. Nonetheless, fewer genes were shared between pathways involved in wound healing and ECM processes, indicating that our pathway analysis of DEGs provides complementary findings.
The recent INTERLIVER study describes the molecular phenotypes of parenchymal injury of liver transplant biopsies and reports associations of steatohepatitis, fibrosis classifiers, and time since transplantation (24). Although the INTERLIVER cohort contained patients with other liver conditions coinciding with the development of de novo or recurrent NASH, such as recurrent hepatitis C, we were able to identify shared genes between our significant DEGs with their fibrosis classifier genes. These include members of the phosphoprotein phosphatase (PPP), family with sequence similarity (FAM), insulin-like growth factor (IGF), immunoglobulin heavy constant (IGH), solute carrier family (SLC), and sodium leak channel (NALCN) gene classes (24).
Most of the DEGs in PT-NASH that we identified are well-annotated protein-coding genes; however, two of the most significant results, ENSG00000285283 and ENSG00000278996, are novel lncRNA genes that have not been well described. A third novel lncRNA ENSG00000273184 was previously associated with angiogenesis and inflammation in major depressive disorder (25). miRNAs have been linked to NASH; therefore, as the differential expression of these lncRNAs correlates with disease status, they may serve as candidates for future PT-NASH experimental studies.
Transcriptomic data on NASH is scarce and publicly available datasets are often not well annotated clinically. This is further constrained in the case of liver transplantation. Although our study is limited by a low sample size, potential sampling biases, and disease heterogeneity, we believe our findings are of interest in the field of NASH. We profiled four cases of PT-NASH, including two recurrent and two de novo cases. Factors that contribute to the development of NASH are similar to those for PT-NASH (5, 26–28). Although the risk factors of recurrent and de novo PT-NASH are shared and include age, ethnicity, and the use of immunosuppressants, patients transplanted for NASH are at a higher risk of developing recurrence in the new liver graft. They are likely to have other metabolic syndromes such as obesity or diabetes mellitus, which are co-morbidities of NASH (29, 30). In fact, both our recurrent PT-NASH have high BMI (≥30) and a history of diabetes mellitus. On the other hand, donor-related factors including baseline steatosis and genetic makeup of the liver graft can contribute to both recurrent and de novo PT-NASH. Several genetic polymorphisms and miRNAs are associated with NT-NASH and the differential contribution of these factors originating from the donor or the recipient are currently of interest in studying PT-NASH (31, 32).
PT-NAFLD is a common complication attributed to the metabolic side effects of immunosuppressive medications, including weight gain and insulin resistance. A previous study reported a mean incidence of 57% and 40% for recurrent and de novo NAFLD at 3 years after LT, respectively (5). More importantly, PT-NAFLD and PT-NASH have accelerated fibrosis progression compared to NT patients with similar conditions (5). Our study, although limited with sample availability and variability, indicates that fibrosis may contribute to both the accelerated progression of PT-NASH. Organ fibrosis is a common debilitating process and previous studies have indicated the efficacy of fibrosis-targeting therapies in other organs (33, 34). Given the rapid acceleration of fibrosis in LT recipients diagnosed with PT-NASH, the use of fibrosis-targeting drugs to impede liver fibrosis and attenuate NASH development should be explored.
Raw data are available in ArrayExpress (accession E-MTAB-11688).
The studies involving human participants were reviewed and approved by University Health Network Research Ethics Board. The ethics committee waived the requirement of written informed consent for participation.
MB and JR conceptualized the research design. AA identified eligible patient samples. EP contributed to sample acquisition. CB contributed to data analysis. SF performed histological assessment. DP and KP performed the research and data analysis. KP, DP, MB, and JR wrote the manuscript. All authors contributed to the article and approved the submitted version.
This work was supported by the American Society of Transplantation granted to MB, the Project Grant of Canadian Institutes of Health Research (CIHR) to JR, and the Investigator Award from the Ontario Institute for Cancer Research (OICR) to JR. Funding to OICR is provided by the Government of Ontario.
We thank Marc Angeli for his technical assistance and the OICR Genomics core facility for sequencing services.
The authors declare that the research was conducted in the absence of any commercial or financial relationships that could be construed as a potential conflict of interest.
All claims expressed in this article are solely those of the authors and do not necessarily represent those of their affiliated organizations, or those of the publisher, the editors and the reviewers. Any product that may be evaluated in this article, or claim that may be made by its manufacturer, is not guaranteed or endorsed by the publisher.
The Supplementary Material for this article can be found online at: https://www.frontiersin.org/articles/10.3389/fendo.2023.1111614/full#supplementary-material
Supplementary Table 1 | Significant DEGs identified in PT-NASH compared to post-transplant control.
Supplementary Table 2 | Significant DEGs identified in NT-NASH compared to non-transplant control.
Supplementary Table 3 | Significantly dysregulated pathways specific to PT-NASH.
Supplementary Table 4 | Significantly dysregulated pathways specific to NT-NASH.
1. Dufour J-F, Scherer R, Balp M-M, McKenna SJ, Janssens N, Lopez P, et al. The global epidemiology of nonalcoholic steatohepatitis (NASH) and associated risk factors–a targeted literature review. Endoc Metab Sci (2021) 3. doi: 10.1016/j.endmts.2021.100089
2. Kim H, Lee DS, An TH, Park HJ, Kim WK, Bae KH, et al. Metabolic spectrum of liver failure in type 2 diabetes and obesity: from NAFLD to NASH to HCC. Int J Mol Sci (2021) 22(9). doi: 10.3390/ijms22094495
3. Schwabe RF, Tabas I, Pajvani UB. Mechanisms of fibrosis development in nonalcoholic steatohepatitis. Gastroenterology (2020) 158(7):1913–28. doi: 10.1053/j.gastro.2019.11.311
4. Younossi ZM, Marchesini G, Pinto-Cortez H, Petta S. Epidemiology of nonalcoholic fatty liver disease and nonalcoholic steatohepatitis: implications for liver transplantation. Transplantation (2019) 103(1):22–7. doi: 10.1097/TP.0000000000002484
5. Saeed N, Glass L, Sharma P, Shannon C, Sonnenday CJ, Tincopa MA. Incidence and risks for nonalcoholic fatty liver disease and steatohepatitis post-liver transplant: systematic review and meta-analysis. Transplantation (2019) 103(11):e345–54. doi: 10.1097/TP.0000000000002916
6. Suppli MP, Rigbolt KTG, Veidal SS, Heeboll S, Eriksen PL, Demant M, et al. Hepatic transcriptome signatures in patients with varying degrees of nonalcoholic fatty liver disease compared with healthy normal-weight individuals. Am J Physiol Gastrointest Liver Physiol (2019) 316(4):G462–72. doi: 10.1152/ajpgi.00358.2018
7. Govaere O, Cockell S, Tiniakos D, Queen R, Younes R, Vacca M, et al. Transcriptomic profiling across the nonalcoholic fatty liver disease spectrum reveals gene signatures for steatohepatitis and fibrosis. Sci Transl Med (2020) 12(572). doi: 10.1126/scitranslmed.aba4448
8. Ryaboshapkina M, Hammar M. Human hepatic gene expression signature of non-alcoholic fatty liver disease progression, a meta-analysis. Sci Rep (2017) 7(1):12361. doi: 10.1038/s41598-017-10930-w
9. Kleiner DE, Brunt EM, Van Natta M, Behling C, Contos MJ, Cummings OW, et al. Design and validation of a histological scoring system for nonalcoholic fatty liver disease. Hepatology (2005) 41(6):1313–21. doi: 10.1002/hep.20701
10. Bedossa P, Poynard T. An algorithm for the grading of activity in chronic hepatitis c. the METAVIR cooperative study group. Hepatology (1996) 24(2):289–93. doi: 10.1002/hep.510240201
11. Patro R, Duggal G, Love MI, Irizarry RA, Kingsford C. Salmon provides fast and bias-aware quantification of transcript expression. Nat Methods (2017) 14(4):417–9. doi: 10.1038/nmeth.4197
12. Love MI, Huber W, Anders S. Moderated estimation of fold change and dispersion for RNA-seq data with DESeq2. Genome Biol (2014) 15(12):550. doi: 10.1186/s13059-014-0550-8
13. Paczkowska M, Barenboim J, Sintupisut N, Fox NS, Zhu H, Abd-Rabbo D, et al. Integrative pathway enrichment analysis of multivariate omics data. Nat Commun (2020) 11(1):735. doi: 10.1038/s41467-019-13983-9
14. Reimand J, Isserlin R, Voisin V, Kucera M, Tannus-Lopes C, Rostamianfar A, et al. Pathway enrichment analysis and visualization of omics data using g:Profiler, GSEA, cytoscape and EnrichmentMap. Nat Protoc (2019) 14(2):482–517. doi: 10.1038/s41596-018-0103-9
15. Stark C, Breitkreutz BJ, Reguly T, Boucher L, Breitkreutz A, Tyers M. BioGRID: a general repository for interaction datasets. Nucleic Acids Res (2006) 34(Database issue):D535–9. doi: 10.1093/nar/gkj109
16. Matsuda S, Kobayashi M, Kitagishi Y. Roles for PI3K/AKT/PTEN pathway in cell signaling of nonalcoholic fatty liver disease. ISRN Endocrinol (2013) 2013:472432. doi: 10.1155/2013/472432
17. Son G, Hines IN, Lindquist J, Schrum LW, Rippe RA. Inhibition of phosphatidylinositol 3-kinase signaling in hepatic stellate cells blocks the progression of hepatic fibrosis. Hepatology (2009) 50(5):1512–23. doi: 10.1002/hep.23186
18. Koop AC, Thiele ND, Steins D, Michaelsson E, Wehmeyer M, Scheja L, et al. Therapeutic targeting of myeloperoxidase attenuates NASH in mice. Hepatol Commun (2020) 4(10):1441–58. doi: 10.1002/hep4.1566
19. Asgharpour A, Cazanave SC, Pacana T, Seneshaw M, Vincent R, Banini BA, et al. A diet-induced animal model of non-alcoholic fatty liver disease and hepatocellular cancer. J Hepatol (2016) 65(3):579–88. doi: 10.1016/j.jhep.2016.05.005
20. Kozumi K, Kodama T, Murai H, Sakane S, Govaere O, Cockell S, et al. Transcriptomics identify thrombospondin-2 as a biomarker for NASH and advanced liver fibrosis. Hepatology (2021) 74(5):2452–66. doi: 10.1002/hep.31995
21. Miyauchi S, Miyake T, Miyazaki M, Eguchi T, Niiya T, Yamamoto S, et al. Insulin-like growth factor-1 is inversely associated with liver fibrotic markers in patients with type 2 diabetes mellitus. J Diabetes Investig (2019) 10(4):1083–91. doi: 10.1111/jdi.13000
22. Ye Q, Liu Y, Zhang G, Deng H, Wang X, Chen C, et al. Deficiency of gluconeogenic enzyme PCK1 promotes murine NASH progression and fibrosis by activation PI3K/AKT/PDGF axis. bioRxiv (2021). doi: 10.1101/2021.01.12.426294
23. Li S, Han S, Jin K, Yu T, Chen H, Zhou X, et al. SOCS2 suppresses inflammation and apoptosis during NASH progression through limiting NF-kappaB activation in macrophages. Int J Biol Sci (2021) 17(15):4165–75. doi: 10.7150/ijbs.63889
24. Madill-Thomsen KS, Abouljoud M, Bhati C, Ciszek M, Durlik M, Feng S, et al. The molecular phenotypes of injury, steatohepatitis, and fibrosis in liver transplant biopsies in the INTERLIVER study. Am J Transplant (2022) 22(3):909–26. doi: 10.1111/ajt.16890
25. Mahajan GJ, Vallender EJ, Garrett MR, Challagundla L, Overholser JC, Jurjus G, et al. Altered neuro-inflammatory gene expression in hippocampus in major depressive disorder. Prog Neuropsychopharmacol Biol Psychiatry (2018) 82:177–86. doi: 10.1016/j.pnpbp.2017.11.017
26. Cotter TG, Charlton M. Nonalcoholic steatohepatitis after liver transplantation. Liver Transpl (2020) 26(1):141–59. doi: 10.1002/lt.25657
27. Spiritos Z, Abdelmalek MF. Metabolic syndrome following liver transplantation in nonalcoholic steatohepatitis. Transl Gastroenterol Hepatol (2021) 6:13. doi: 10.21037/tgh.2020.02.07
28. Galvin Z, Rajakumar R, Chen E, Adeyi O, Selzner M, Grant D, et al. Predictors of De Novo nonalcoholic fatty liver disease after liver transplantation and associated fibrosis. Liver Transpl. Jan (2019) 25(1):56–67. doi: 10.1002/lt.25338
29. Minich A, Arisar FAQ, Shaikh NS, Herman L, Azhie A, Orchanian-Cheff A, et al. Predictors of patient survival following liver transplant in non-alcoholic steatohepatitis: a systematic review and meta-analysis. EClinicalMedicine (2022) 50:101534. doi: 10.1016/j.eclinm.2022.101534
30. Taneja S, Roy A. Nonalcoholic steatohepatitis recurrence after liver transplant. Transl Gastroenterol Hepatol (2020) 5:24. doi: 10.21037/tgh.2019.10.12
31. Lonardo A, Mantovani A, Petta S, Carraro A, Byrne CD, Targher G. Metabolic mechanisms for and treatment of NAFLD or NASH occurring after liver transplantation. Nat Rev Endocrinol (2022) 18(10):638–50. doi: 10.1038/s41574-022-00711-5
32. Satapathy SK, Tran QT, Kovalic AJ, Bontha SV, Jiang Y, Kedia S, et al. Clinical and genetic risk factors of recurrent nonalcoholic fatty liver disease after liver transplantation. Clin Transl Gastroenterol (2021) 12(2):e00302. doi: 10.14309/ctg.0000000000000302
33. Watson CJ, Horgan S, Neary R, Glezeva N, Tea I, Corrigan N, et al. Epigenetic therapy for the treatment of hypertension-induced cardiac hypertrophy and fibrosis. J Cardiovasc Pharmacol Ther (2016) 21(1):127–37. doi: 10.1177/1074248415591698
Keywords: liver transplantation, non-alcoholic fatty liver disease, non-alcoholic steatohepatitis, disease pathogenesis, fibrosis, wound healing, transcriptomics (RNA-seq), computational biology & bioinformatics
Citation: Pellegrina D, Prayitno K, Azhie A, Pasini E, Baciu C, Fischer S, Reimand J and Bhat M (2023) Transcriptomic changes in liver transplant recipients with non-alcoholic steatohepatitis indicate dysregulation of wound healing. Front. Endocrinol. 14:1111614. doi: 10.3389/fendo.2023.1111614
Received: 29 November 2022; Accepted: 12 April 2023;
Published: 08 May 2023.
Edited by:
Melania Gaggini, National Research Council (CNR), ItalyReviewed by:
Yosuke Yoneyama, Tokyo Medical and Dental University, JapanCopyright © 2023 Pellegrina, Prayitno, Azhie, Pasini, Baciu, Fischer, Reimand and Bhat. This is an open-access article distributed under the terms of the Creative Commons Attribution License (CC BY). The use, distribution or reproduction in other forums is permitted, provided the original author(s) and the copyright owner(s) are credited and that the original publication in this journal is cited, in accordance with accepted academic practice. No use, distribution or reproduction is permitted which does not comply with these terms.
*Correspondence: Mamatha Bhat, TWFtYXRoYS5CaGF0QHVobi5jYQ==; Jüri Reimand, SnVyaS5SZWltYW5kQHV0b3JvbnRvLmNh
†These authors have contributed equally to this work and share first authorship
‡These authors have contributed equally to this work and share last authorship
Disclaimer: All claims expressed in this article are solely those of the authors and do not necessarily represent those of their affiliated organizations, or those of the publisher, the editors and the reviewers. Any product that may be evaluated in this article or claim that may be made by its manufacturer is not guaranteed or endorsed by the publisher.
Research integrity at Frontiers
Learn more about the work of our research integrity team to safeguard the quality of each article we publish.