 Yi Zhang1,2,3†
 Min Tan1,4†Boyu Liu1,5Manxia Zeng1
 You Zhou1Mengru Zhang1Yikai Wang1
 Jing Wu1,3,6*
 Min Wang1,3,6*
- 1Department of Endocrinology, Xiangya Hospital, Central South University, Changsha, Hunan, China
- 2Department of Orthopaedics, Xiangya Hospital, Central South University, Changsha, Hunan, China
- 3National Clinical Research Center for Geriatric Disorders, Xiangya Hospital, Changsha, Hunan, China
- 4Department of Hyperbaric Oxygen, People’s Hospital of Hunan Province, Hunan Normal University, Changsha, Hunan, China
- 5Department of Endocrinology, Yiyang Central Hospital, Yiyang, Hunan, China
- 6Hunan Engineering Research Center for Obesity and its Metabolic Complications, Xiangya Hospital, Central South University, Changsha, Hunan, China
Background: Obesity is an increasingly severe global public health issue. This study aims to estimate the cross-sectional association between bone mineral density (BMD) and hyperuricemia (HU) in obesity.
Method: A total of 275 obese subjects (126 men and 149 women) participated in this cross-sectional study. Obesity was diagnosed as body mass index (BMI) ≥28 kg/m2, whereas HU was defined as the blood uric acid level of 416 μmol/L in men and 360 μmol/L in women. The BMD of the lumbar spine and right hip was measured by dual-energy X-ray absorptiometry (DXA). The multivariable logistic regressions were employed to examine the relationship between BMD and HU in obesity, with the adjustment of gender, age, fasting blood glucose, fasting insulin, homeostasis model assessment of insulin resistance (HOMA-IR), cholesterol, triglycerides, low-density lipoprotein, high-density lipoprotein, creatinine, blood urea nitrogen, high-sensitivity C-reactive protein (hs-CRP), cigarette smoking, and alcohol drinking status.
Result: The overall prevalence of HU was 66.9% in this obese population. The mean age and BMI of this population were 27.9 ± 9.9 years and 35.2 ± 5.2 kg/m2, respectively. The multivariable-adjusted OR (the highest vs. lowest BMD quartile) demonstrated a negative relationship between BMD and HU in total (OR = 0.415, 95%CI: 0.182–0.946; p = 0.036), L1 (OR = 0.305, 95%CI: 0.127–0.730; p = 0.008), L2 (OR = 0.405, 95%CI: 0.177–0.925; p = 0.032), and L3 (OR = 0.368, 95%CI: 0.159–0.851; p = 0.020) lumbar vertebrae. In the subgroup analysis for the male population, the BMD was also negatively associated with HU in total (OR = 0.077, 95%CI: 0.014–0.427; p = 0.003), L1 (OR = 0.019, 95%CI: 0.002–0.206; p = 0.001), L2 (OR = 0.161, 95%CI: 0.034–0.767; p = 0.022), L3 (OR = 0.186, 95%CI: 0.041–0.858; p = 0.031), and L4 (OR = 0.231, 95%CI: 0.056–0.948; p = 0.042) lumbar vertebrae. However, such findings did not exist in women. In addition, there was no significant relationship between hip BMD and HU in obesity.
Conclusion: Our results showed that the lumbar BMD was negatively associated with HU in obesity. However, such findings only existed in men, rather than women. In addition, no significant relationship between hip BMD and HU existed in obesity. Due to the limited sample size and nature of the cross-sectional design, further large prospective studies are still needed to clarify the issues.
Introduction
Obesity is an increasingly severe clinical and public health issue. Unfortunately, more than 100 million patients suffer from obesity worldwide (1). More importantly, obesity has become a major public health concern in China. It was estimated that more than half of Chinese adults are either overweight or obese in a recent national survey (2, 3). Emerging evidence indicated that obesity is associated with a higher risk of hyperuricemia (HU) (4). Uric acid is an end product of purine metabolism in the human body, and HU is always recognized as the precursor of gout (5). In addition, HU is also considered to be related to metabolic syndromes/indices (3, 6), renal injury (7), inflammation, and endothelial dysfunction (8) in obesity. Therefore, the identification of modifiable factors for HU appears to be an important step in the clinical management of obesity.
Generally speaking, bone mineral density (BMD) is an important and common clinical indicator for the diagnosis of osteoporosis (9). As far as we know, a large number of studies have examined the association between HU and BMD. However, no final conclusion can be obtained (9–20). The potential reasons for such discrepancy may be attributed to the variety of population characteristics, including genetic background, age, body fat proportion or confounders adjusted, and different lifestyle factors (14). Therefore, it is significant and necessary to consider the issue in different sub-populations. Obesity is a health issue with special clinical characteristics. Importantly, a causal relationship between obesity and lower BMD was confirmed in a two-sample Mendelian randomization study recently (21). Indeed, increased marrow adiposity is attributed to the shift from osteogenic to adipogenic differentiation of bone marrow mesenchymal stem cells (22). However, obesity is also positively associated with HU (23, 24). Experimental evidence did suggest that purine catabolism in adipose tissue could be enhanced in obesity (25). It is interesting and necessary to reveal how BMD is involved in HU in the context of obesity. Therefore, this study was performed to investigate the relationship between BMD and HU in the obese population.
Materials and methods
Study population
This cross-sectional study was reviewed and approved by the Medical Ethics Committee of Xiangya Hospital, Central South University (202103043). A total of 275 obese patients (126 men and 149 women) were recruited from Xiangya Hospital (from August 2019 to December 2021). The inclusion criteria were as follows: 1) BMI ≥ 28 kg/m2, 2) available completed clinical data, and 3) patients agreeing to participate in the study. The exclusion criteria were as follows: 1) postmenopausal women; 2) bone disease (new fractures and malignancies), severe hepatic and renal insufficiency, thyroid and parathyroid disorders, and some other diseases involved in bone metabolism; 3) long-term drug users with affected bone or uric acid metabolism (e.g., glucocorticoids, anticoagulants, thyroid hormones, proton pump inhibitors, antiepileptics, allopurinol, and benzbromarone); 4) those who have undergone iodine, barium, or nuclear medicine isotope tests in the past week (bone scan, kidney scan, PET-CT, enhanced CT, etc.); 5) subjects with implanted materials that affect BMD assessment (bone cement, surgical nails, steel stents, metal implants, pacemaker lead wires, etc.).
Blood biochemistry
The blood biochemical indices of subjects who fasted for 8–12 h were obtained. The fasting venous blood was collected in the morning. Blood uric acid, fasting blood glucose, fasting insulin, cholesterol, triglyceride, low-density lipoprotein, high-density lipoprotein, serum creatinine, blood urea nitrogen, and high-sensitivity C-reactive protein (hs-CRP) were collected and recorded. Moreover, the homeostasis model assessment of insulin resistance (HOMA-IR) was also calculated. The blood biochemical indices were tested using the automatic biochemical analyzer. Uric acid was determined by the uricase–peroxidase method. Fasting blood glucose and insulin were determined by hexokinase and chemiluminescence methods. Cholesterol was determined by the enzyme method, triglyceride was determined by the GPO-POD method, and low-density lipoprotein and high-density lipoprotein were determined by a direct method. Moreover, creatinine was determined by the basic picric acid method, urea nitrogen was determined by the glutamate dehydrogenase method, and hs-CRP was determined by the immunoturbidimetric method. HOMA-IR was calculated by the following formula: fasting blood glucose (mmol/L) * fasting insulin (mIU/L)/22.5. HU was defined as a blood uric acid level of 416 μmol/L in men and 360 μmol/L in women.
Measurement of bone mineral density
The BMD of the lumbar spine and right hip was measured by dual-energy X-ray absorptiometry (DXA) (U.S. Lunar), which is commonly used in clinical and scientific research due to its small repeatability and diagnostic error. The BMD was measured by the same experienced senior doctor, and quality control testing was carried out properly. Lumbar spine BMD measurements included the first, second, third, and fourth lumbar vertebrae (L1 to L4) and total lumbar vertebra, whereas right hip BMD measurements included the femoral neck, trochanter, Ward’s triangle, and total hip (Figure 1). Anatomically,. Ward’s triangle is a fragile triangular area formed by the cross of the femoral neck between the medial pressure bone trabecula, lateral tension bone trabecula, and intertrochanteric line of the femoral neck (a common site for fracture). The BMD levels were expressed as BMD values (g/cm2) directly.
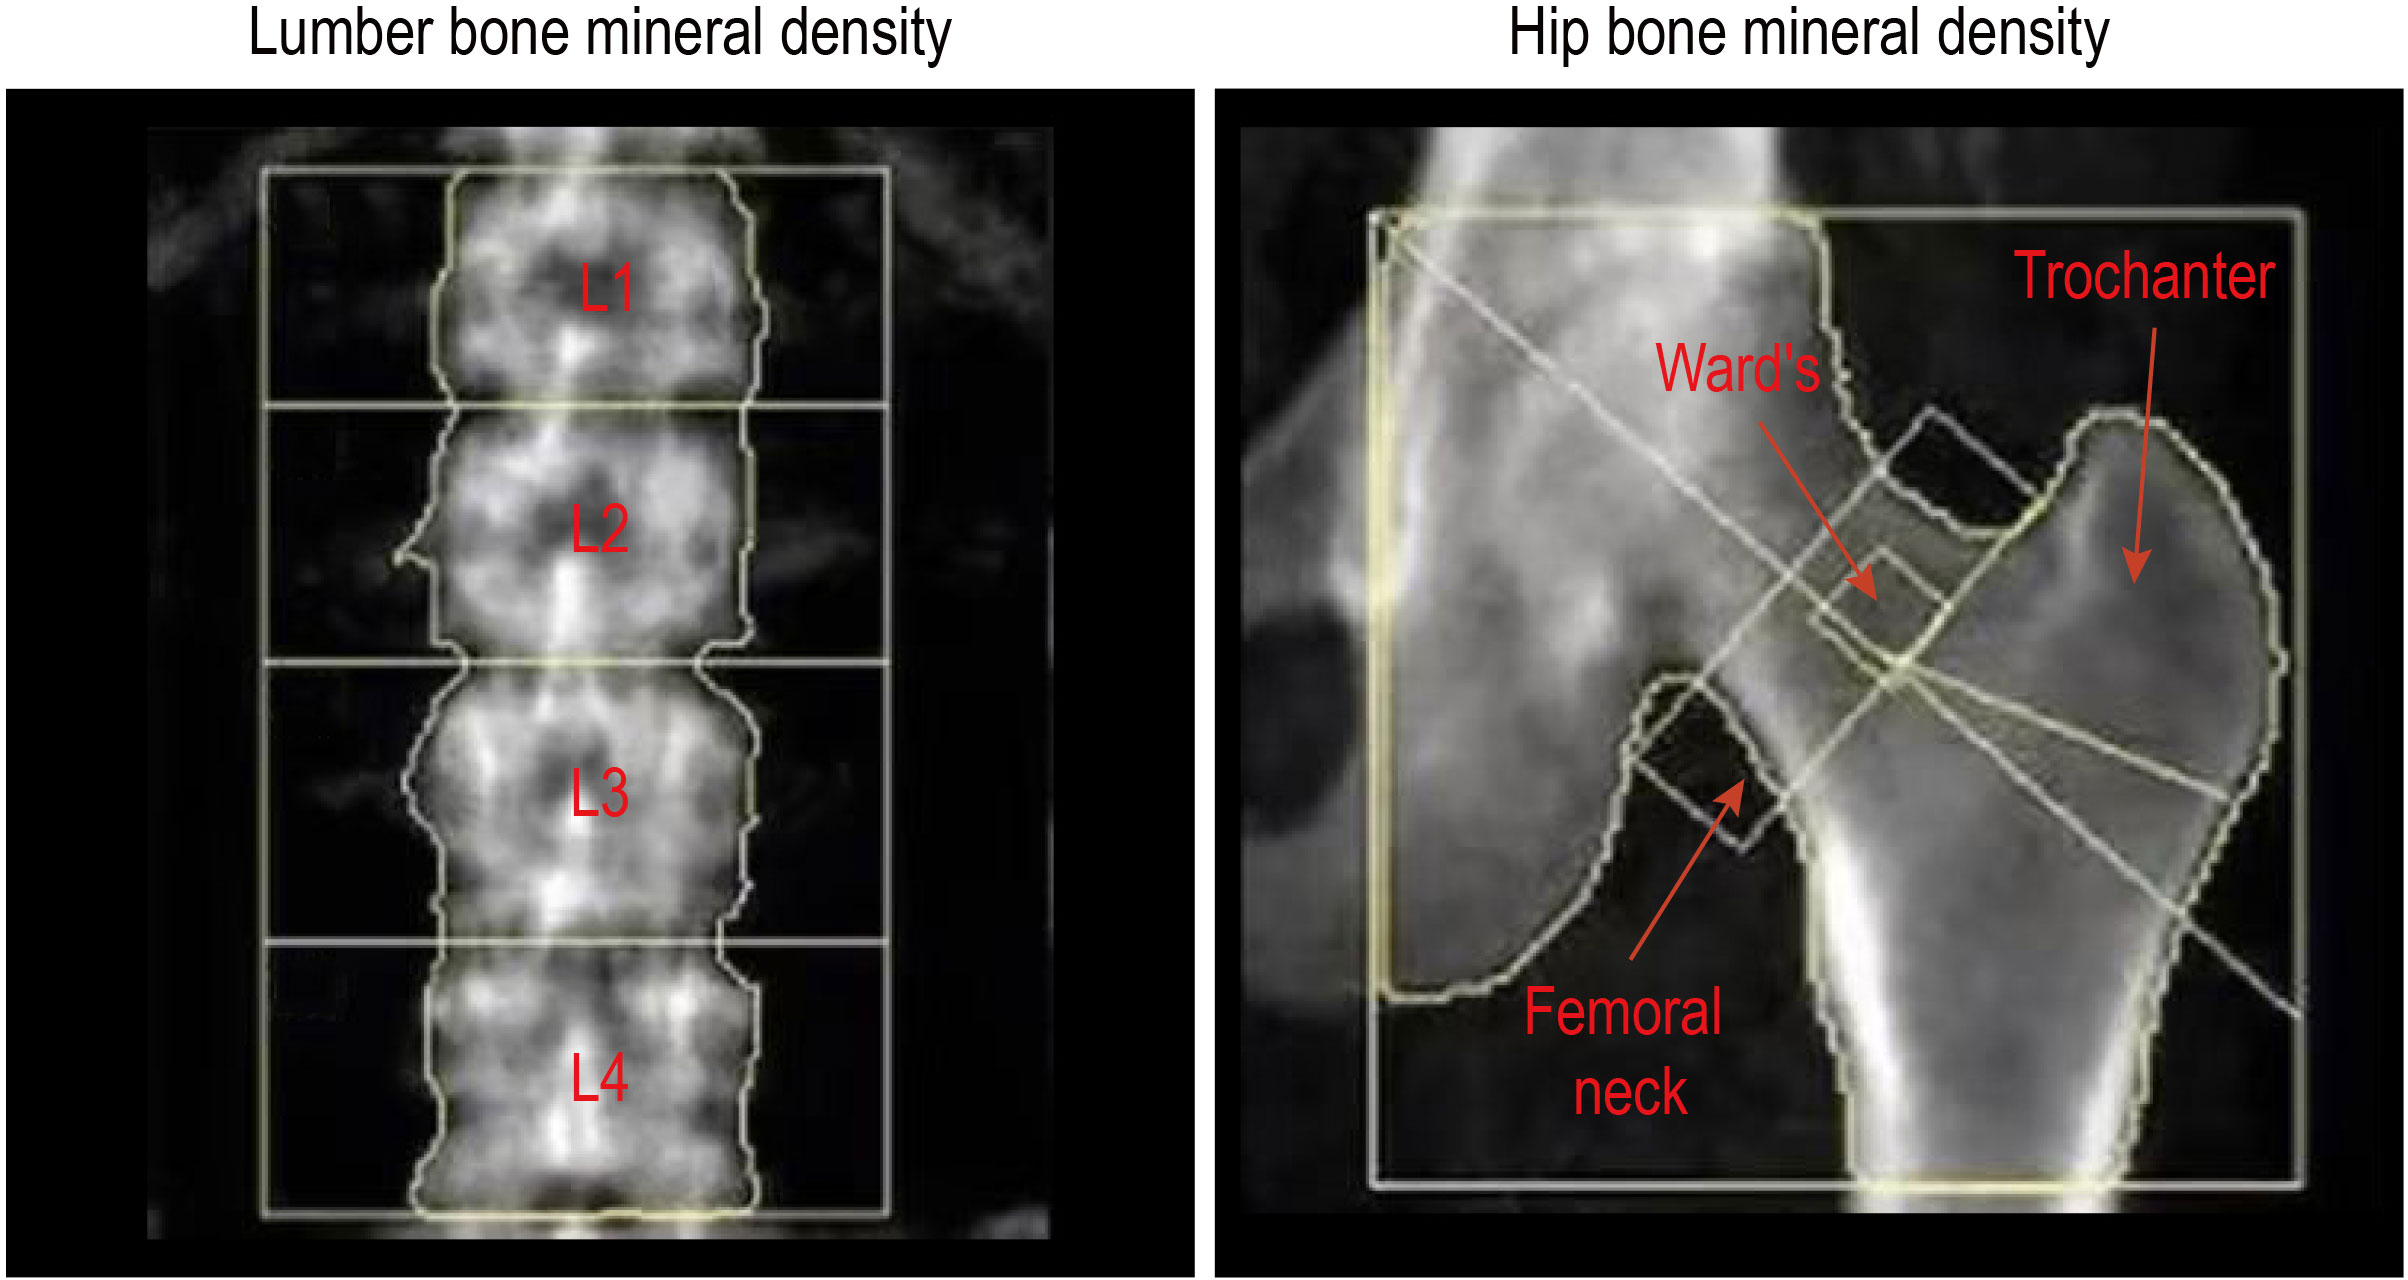
Figure 1 The assessment of bone mineral density in the lumbar spine and hip.
General information collection
The gender, age, height, and weight of the included subjects were collected and recorded. The body mass index (BMI) was calculated by the following formula: BMI (kg/m2) = weight (kg)/height (m)2. Both cigarette smoking and alcohol drinking status were evaluated by the questions “Do you smoke/drink? Yes/No”.
Statistical analysis
The SPSS 23.0 software was utilized for the analysis. The normal distribution data are expressed by means and standard deviation, whereas the skewness distribution data are expressed by median and interquartile spacing. The classified data are expressed as percentage. The t-test was employed for normal distribution data, whereas the chi-square test was used for classified data. The rank sum test was used for skewed distribution data. Moreover, multiple logistic regression was used for correlation analysis. The differences in general data, blood biochemical indicators, and BMD between obese men and women were also compared. The BMD and HU served as exposure and outcome, respectively. The BMD was divided into quartiles from low to high, with the lowest quartile as the reference. The following covariates were adjusted: gender, age, fasting blood glucose, fasting insulin, HOMA-IR, cholesterol, triglycerides, low-density lipoprotein, high-density lipoprotein, creatinine, blood urea nitrogen, hs-CRP, cigarette smoking, and alcohol drinking status. p < 0.05 was considered statistically significant.
Results
The main characteristics of the obese population
The main characteristics of the obese population are presented in Table 1. A total of 275 subjects were included in our study: 126 and 149 were men and women, respectively. The mean age and BMI of this population were 27.9 ± 9.9 years and 35.2 ± 5.2 kg/m2, respectively. The BMI, uric acid, triglyceride, HDL cholesterol, creatinine, cigarette smoking, alcohol drinking, total hip BMD, femoral neck BMD, and trochanter BMD were all significantly different between men and women.
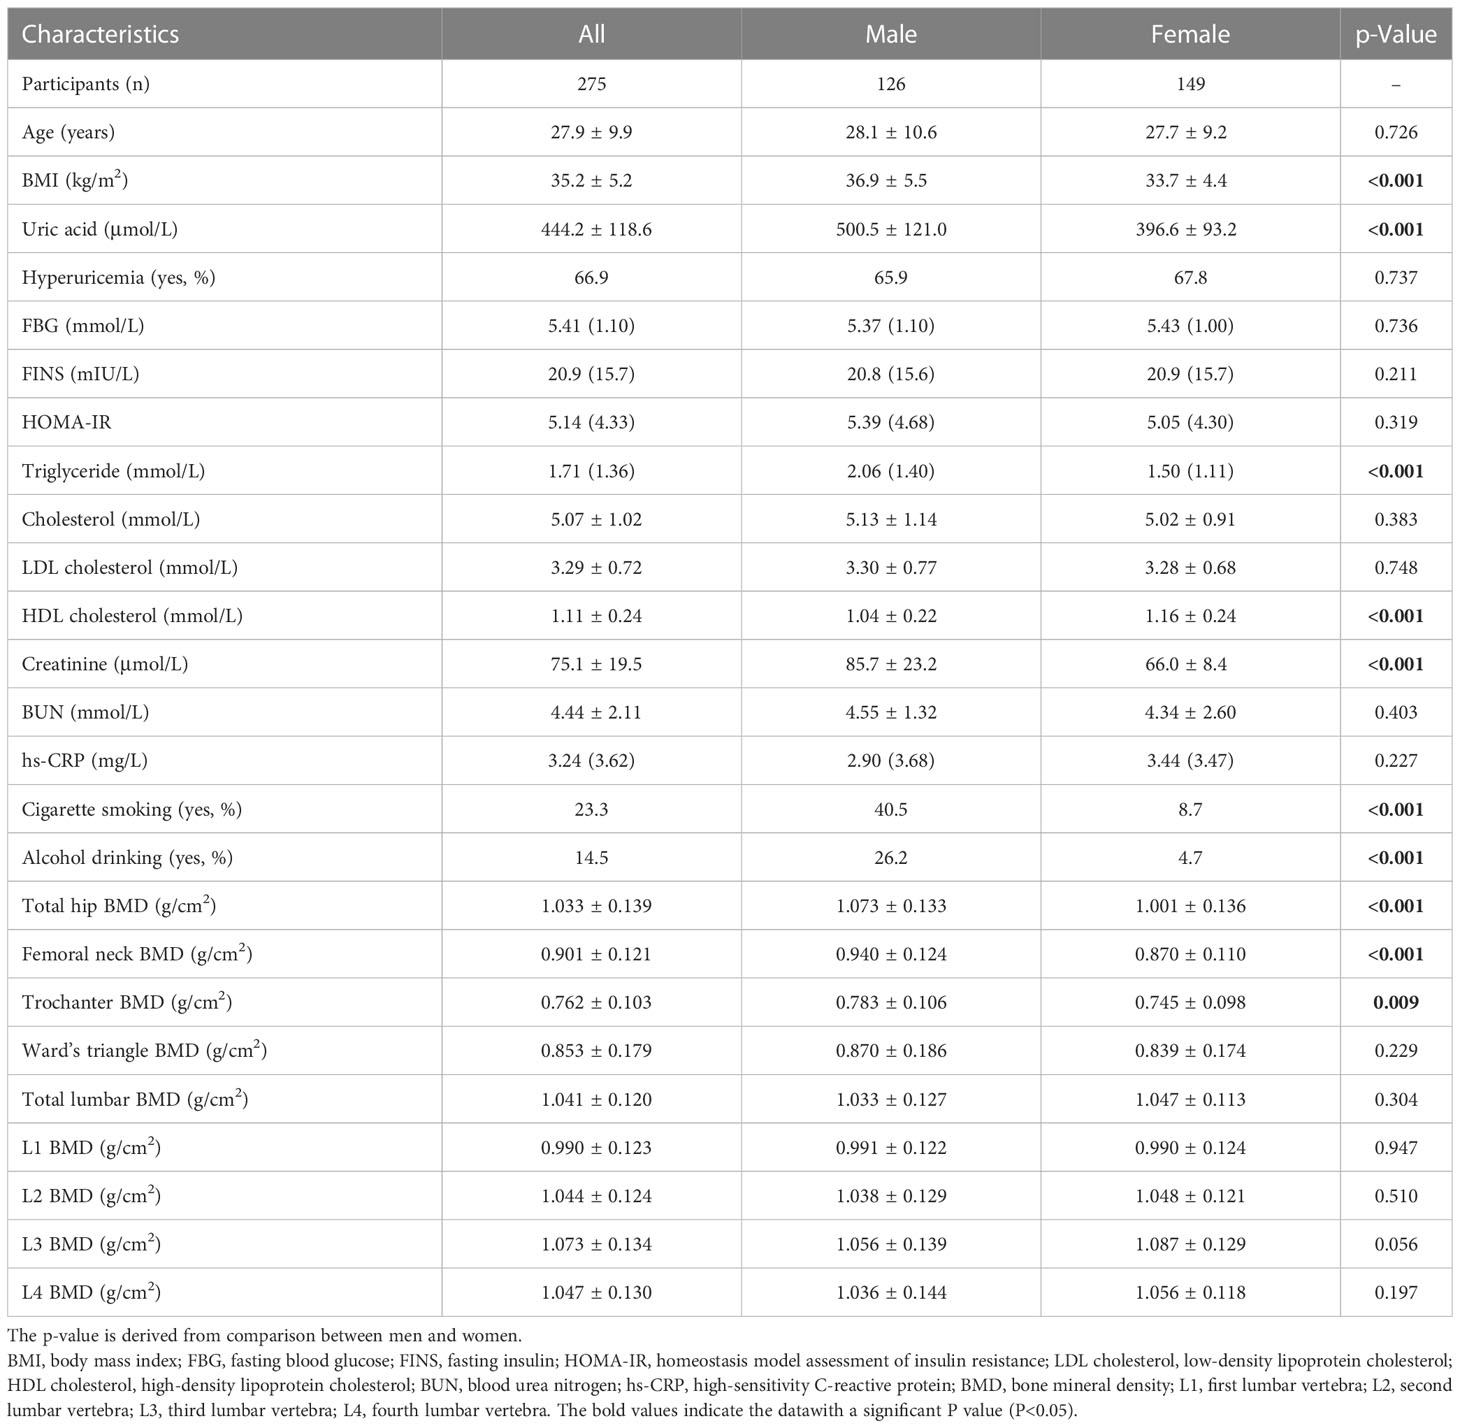
Table 1 The main characteristics of the obese population.
The relationship between lumbar BMD and hyperuricemia in obesity
The results of the relationship between lumbar BMD and HU in obesity are presented in Table 2. The multivariable-adjusted OR (the highest vs. lowest BMD quartile) demonstrated a negative relationship between BMD and HU in total (OR = 0.415, 95%CI: 0.182–0.946; p = 0.036), L1 (OR = 0.305, 95%CI: 0.127–0.730; p = 0.008), L2 (OR = 0.405, 95%CI: 0.177–0.925; p = 0.032), and L3 (OR = 0.368, 95%CI: 0.159–0.851; p = 0.020) lumbar vertebrae. In the subgroup analysis for the men population, the BMD was also negatively associated with HU in total (OR = 0.077, 95%CI: 0.014–0.427; p = 0.003), L1 (OR = 0.019, 95%CI: 0.002–0.206; p = 0.001), L2 (OR = 0.161, 95%CI: 0.034–0.767; p = 0.022), L3 (OR = 0.186, 95%CI: 0.041–0.858; p = 0.031), and L4 (OR = 0.231, 95%CI: 0.056–0.948; p = 0.042) lumbar vertebrae. On the contrary, no significant relationship between lumbar BMD and HU was obtained in women.
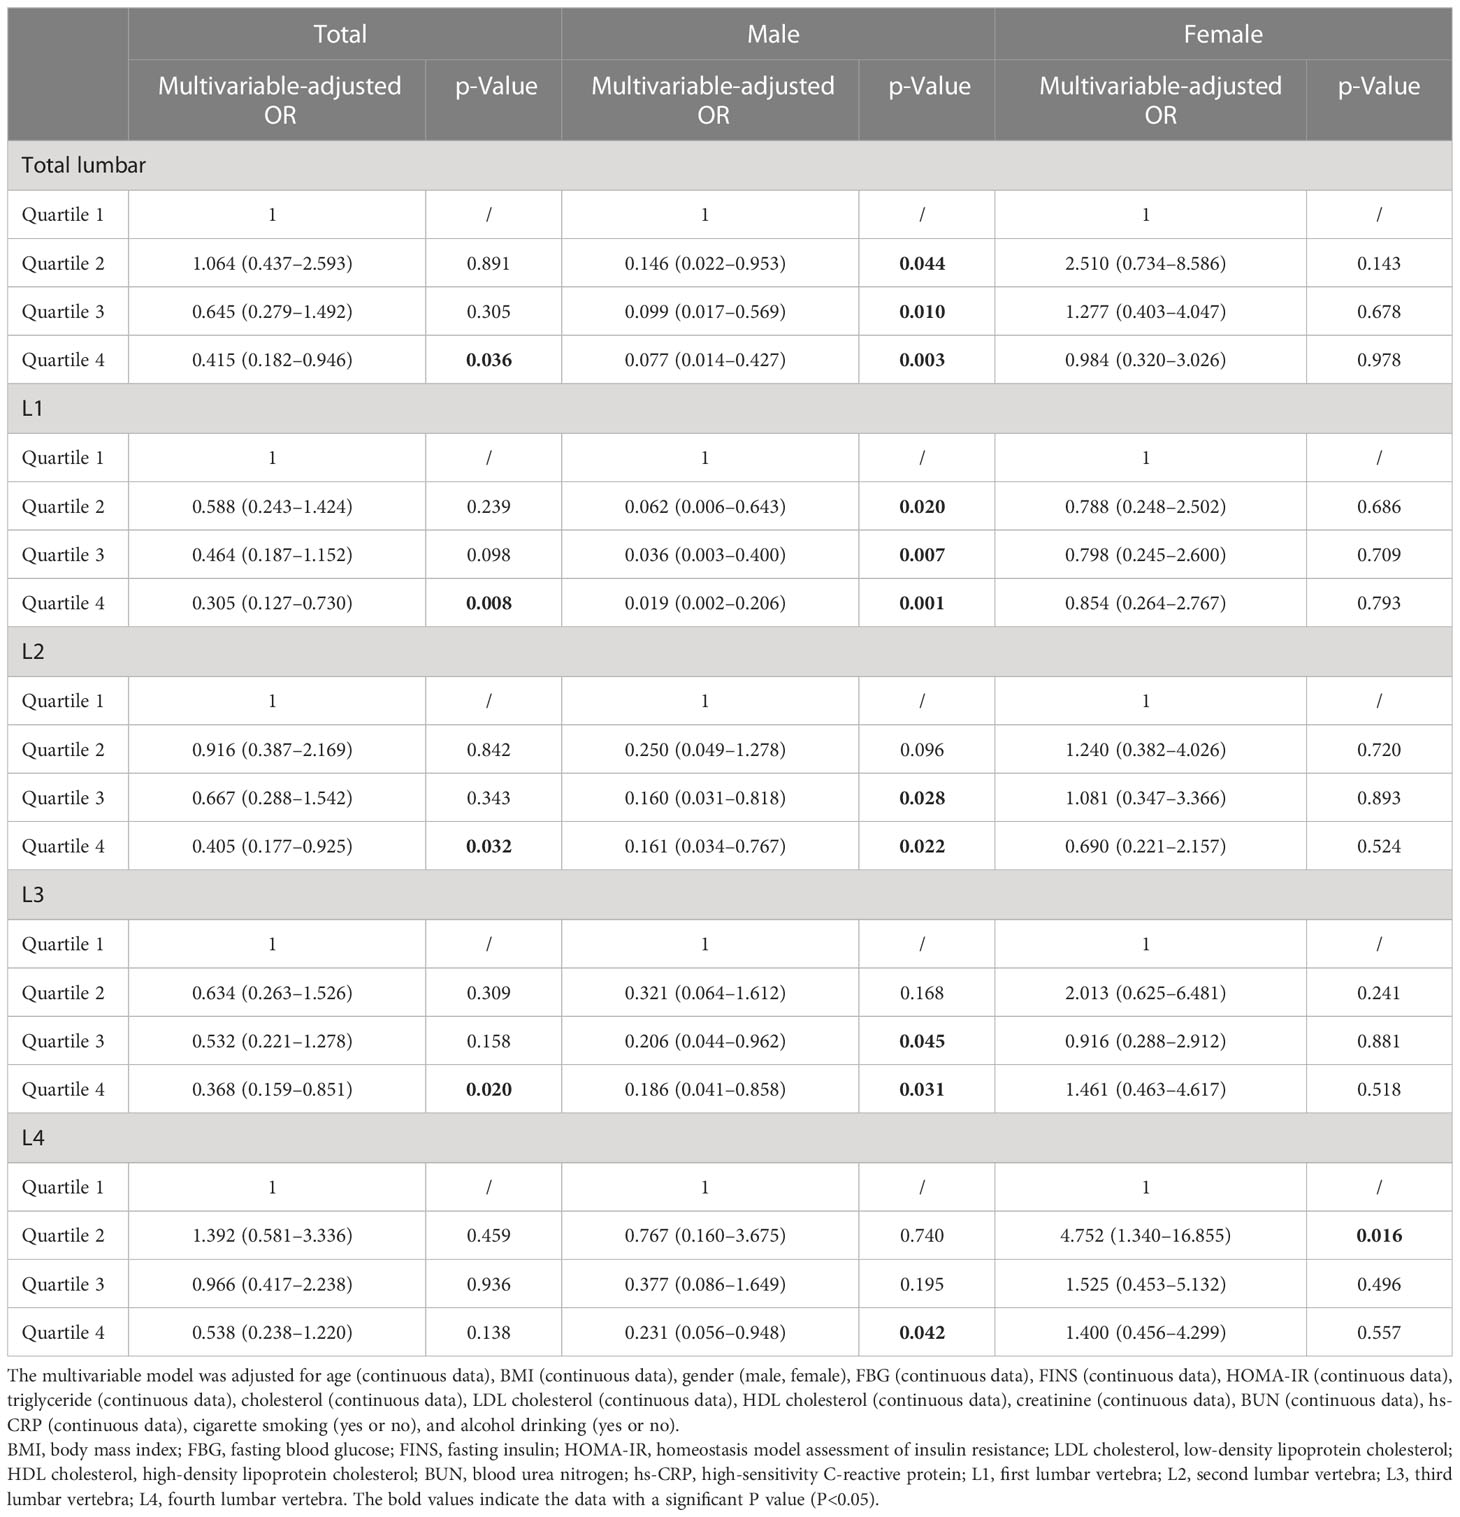
Table 2 Multivariable-adjusted ORs of hyperuricemia according to lumbar bone mineral density level in obese subjects.
The relationship between hip BMD and hyperuricemia in obesity
The results of the relationship between hip BMD and HU in obesity are presented in Table 3. The multivariable-adjusted OR (the highest vs. lowest BMD quartile) demonstrated no significant relationship between BMD and HU in the total hip (OR = 0.996, 95%CI: 0.365–2.718; p = 0.994), femoral neck (OR = 1.086, 95%CI: 0.377–3.129; p = 0.879), trochanter (OR = 0.986, 95%CI: 0.375–2.590; p = 0.976), and Ward’s triangle (OR = 1.965, 95%CI: 0.695–5.556; p = 0.203). In the subgroup analysis, no significant relationship between BMD and HU was obtained in the male and female populations.
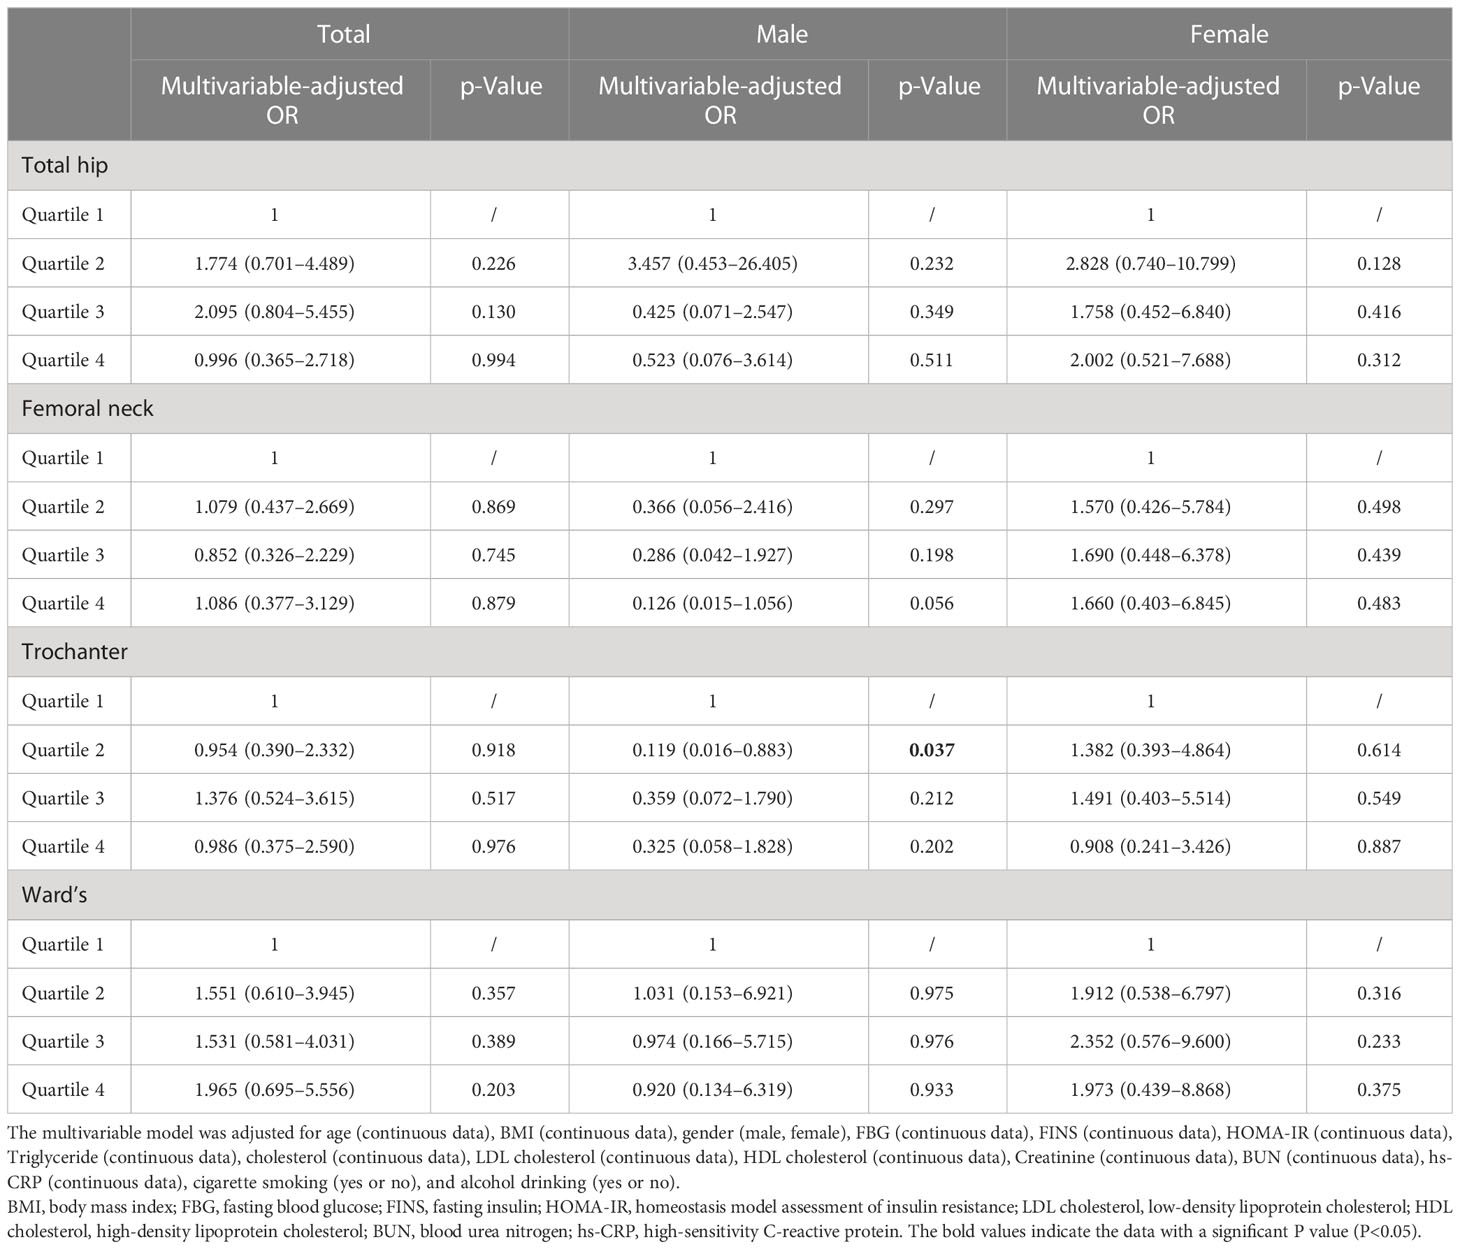
Table 3 Multivariable-adjusted ORs of hyperuricemia according to hip bone mineral density level in obese subjects.
Discussions
Our results showed that the lumbar BMD was negatively associated with HU in obesity. However, such findings only existed in men, rather than women. On the contrary, no significant relationship between hip BMD and HU was obtained.
Generally speaking, the relationship between BMD and HU is conflicting. Several studies found a positive association between BMD and HU in postmenopausal and older women (16, 26–31). Furthermore, a positive association between lumbar spine BMD and serum uric acid (SUA) was confirmed in postmenopausal women, rather than men (32). On the contrary, no significant relationship between lumbar spine BMD and SUA was obtained in US participants over 30 years (33). Therefore, the relationship between BMD and HU may vary depending on the population. In consideration of the special characteristics of obesity, it is necessary to be concerned about such issues in the context of obesity. It was reported that obesity was associated with a lower level of BMD (21) and a higher prevalence of HU (2), which might partly contribute to the inverse relationship between BMD and HU in obesity (especially the BMI in this population is extremely high: 35.2 ± 5.2). Interestingly, such findings were not found in women, which was in contrast to the previous evidence regarding postmenopausal and older women. It should be noted that the women in our study are relatively young (27.7 ± 9.2 years old). It is reported that estrogen is associated with a higher level of BMD and a lower level of serum uric acid. In this condition, a higher level of estrogen in our women population may contribute to a potential negative relationship between BMD and HU. The aforementioned positive relationship between BMD and HU regarding postmenopausal and older women may be neutralized in the context of young women. Therefore, a final combined null relationship was obtained in our results. Moreover, the BMI in men is significantly higher than that in women (36.9 vs. 33.7). Thus, the potential obesity-derived negative relationship between BMD and HU may be much stronger in men, which may partly contribute to the sex difference results in our study. However, our results should be carefully interpreted due to the limited sample size and potential residual confounding with unmeasured variables. Furthermore, the results regarding the lumbar and hip were totally different. Moreover, the L1 lumbar BMD seems to contribute mostly. Therefore, the location for analysis may be involved in the relationship between BMD and HU. Moreover, the lumbar BMD seems to be more sensitive to reflect the issue of obesity. Nevertheless, our results may be restricted by the nature of the cross-sectional design and limited sample size, and more large prospective studies are still needed.
The underlying mechanism behind the inverse relationship between BMD and HU can be listed as follows. The hydrophobic lipid layer of the cell membrane may interfere with the antioxidant properties of uric acid (it mainly acts in human plasma) (34, 35). The intracellular free oxygen radicals are generated during uric degradation, which further enhances intracellular superoxide generation by interacting with NADPH oxidase. It inhibits osteoblast bone formation and stimulates osteoclast bone resorption (36–38). In addition, uric acid might exert adverse effects on bone health by affecting 25-OH-D (1,25D) and parathyroid hormone (PTH) levels. An inverse correlation between 1,25D concentrations and uric acid has been revealed in the HU model and chronic kidney disorder subjects (39–41). However, this association could be reversed by allopurinol, a drug that lowers uric acid levels (41). Similarly, serum uric acid was positively correlated with PTH levels (39, 42). Furthermore, the proinflammatory cytokines causing acute gout attack, including tumor necrosis factor-α, interleukin-1, interleukin-6, and interleukin-8, promote osteoclast differentiation and increases bone resorption (36). However, the issue of obesity has not been considered in current experimental evidence, which should be addressed by further study.
Our study has several advantages. To begin with, this is the first study on the association between BMD and HU in obesity so far. In addition, our study has specified that the relationship between BMD and HU may be varied depending on the bone location. Finally, our results may appeal to the public to pay more attention to bone health in the obese population: an increased level of BMD may be beneficial to the clinical management of obesity. However, the limitations of our study should also be acknowledged. First, the cross-sectional design precludes causal relationships, and further prospective studies are still needed to clarify the concerns. Second, the questionnaire surveys are used to collect some clinical data (smoking and alcohol drinking status, etc.). The potential recall bias cannot be excluded. Third, the sample size of the obese subjects is relatively small, which may inevitably influence the reliability of our results. Fourth, the included subjects are relatively young. Therefore, our results may not reflect the issue at all ages. Finally, some residual or unmeasured confounder remains possible.
In conclusion, our results showed that the lumbar BMD was negatively associated with HU in obesity. However, such findings only existed in men, rather than women. In addition, no significant relationship between hip BMD and HU was obtained. Further large well-designed prospective studies are still needed.
Data availability statement
The raw data supporting the conclusions of this article will be made available by the authors, without undue reservation.
Ethics statement
The studies involving human participants were reviewed and approved by The Medical Ethics Committee of Xiangya Hospital, Central South University (202103043). The patients/participants provided their written informed consent to participate in this study.
Author contributions
MW and YiZ decided and conceptualized this article and revised the draft. YiZ and MT wrote the manuscript. MT and JW collected and analyzed the data. YiZ and JW prepared the figures and tables. MW and JW were the guarantors of the overall content. All authors contributed to the article and approved the submitted version.
Funding
This study was supported by the National Natural Science Foundation of China (82102581, 82170849, 82270930), National Postdoctoral Science Foundation of China (2021M693562), Provincial Natural Science Foundation of Hunan (2022JJ40843), Science and Technology Program of Changsha, China (kh2003010), National Clinical Research Center for Geriatric Disorders Foundation (2021LNJJ04), Provincial Outstanding Postdoctoral Innovative Talents Program of Hunan (2021RC2020), Young Investigator Grant of Xiangya Hospital, Central South University (2020Q14), FuQing Postdoc Program of Xiangya Hospital, Central South University (176), Fund of Reform and Practice of Ideological and Political in Xiangya Hospital, Central South University (36), Teaching Reform Project of Hunan Province Regular Universities (HNJG-2021-0313), and Hunan Provincial Degree and Postgraduate Teaching Reform Project (2021JGYB033).
Conflict of interest
The authors declare that the research was conducted in the absence of any commercial or financial relationships that could be construed as a potential conflict of interest.
Publisher’s note
All claims expressed in this article are solely those of the authors and do not necessarily represent those of their affiliated organizations, or those of the publisher, the editors and the reviewers. Any product that may be evaluated in this article, or claim that may be made by its manufacturer, is not guaranteed or endorsed by the publisher.
References
1. Abarca-Gómez L, Abdeen ZA, Hamid ZA, Abu-Rmeileh NM, Acosta-Cazares B, Acuin C, et al. Worldwide trends in body-mass index, underweight, overweight, and obesity from 1975 to 2016: A pooled analysis of 2416 population-based measurement studies in 128.9 million children, adolescents, and adults. Lancet (2017) 390:2627–42. doi: 10.1016/S0140-6736(17)32129-3
2. Cheang C, Law S, Ren J, Chan W, Wang C, Dong Z. Prevalence of hyperuricemia in patients with severe obesity and the relationship between serum uric acid and severe obesity: A decade retrospective cross-section study in Chinese adults. Front Public Health (2022) 10:986954. doi: 10.3389/fpubh.2022.986954
3. Li F, Chen S, Qiu X, Wu J, Tan M, Wang M. Serum uric acid levels and metabolic indices in an obese population: A cross-sectional study. Diabetes Metab Syndr Obes (2021) 14:627–35. doi: 10.2147/DMSO.S286299
4. Rospleszcz S, Dermyshi D, Müller-Peltzer K, Strauch K, Bamberg F, Peters A. Association of serum uric acid with visceral, subcutaneous and hepatic fat quantified by magnetic resonance imaging. Sci Rep (2020) 10(1):1–9. doi: 10.1038/s41598-020-57459-z
5. Zhang Y, Yang T, Zeng C, Wei J, Li H, Xiong Y-L, et al. Is coffee consumption associated with a lower risk of hyperuricaemia or gout? a systematic review and meta-analysis. BMJ Open (2016) 6(7):e009809. doi: 10.1136/bmjopen-2015-009809
6. Foster C, Smith L, Alemzadeh R. Excess serum uric acid is associated with metabolic syndrome in obese adolescent patients. J Diabetes Metab Disord (2020) 19(1):535–43. doi: 10.1007/s40200-020-00507-2
7. Kızılay DÖ, Şen S, Ersoy B. Associations between serum uric acid concentrations and cardiometabolic risk and renal injury in obese and overweight children. J Clin Res Pediatr Endocrinol (2019) 11(3):262–9. doi: 0.4274/jcrpe.galenos.2018.2019.0241
8. Valle M, Martos R, Cañete MD, Valle R, Donkelaar ELv, Bermudo. F. Association of serum uric acid levels to inflammation biomarkers and endothelial dysfunction in obese prepubertal children. Pediatr Diabetes (2015) 16(6):441–7. doi: 10.1111/pedi.12199
9. Li X, Li L, Yang L, Yang J, Lu. H. No association between serum uric acid and lumbar spine bone mineral density in US adult males: A cross sectional study. Sci Rep (2021) 11(1):15588. doi: 10.1038/s41598-021-95207-z
10. Ibrahim WN, Younes N, Shi Z, Abu-Madi MA. Serum uric acid level is positively associated with higher bone mineral density at multiple skeletal sites among healthy qataris. Front Endocrinol (2021) 12:653685. doi: 10.3389/fendo.2021.653685
11. Hwang J, Hwang JH, Ryu S, Ahn JK. Higher serum uric acid is associated with higher lumbar spine bone mineral density in male health-screening examinees: A cross-sectional study. J Bone Miner Metab (2019) 37:142–51. doi: 10.1007/s00774-018-0905-4
12. Veronese N, Carraro S, Bano G, Trevisan C, Solmi M, Luchini C, et al. Hyperuricemia protects against low bone mineral density, osteoporosis and fractures: A systematic review and meta-analysis. Eur J Clin Investig (2016) 46:920–30. doi: 10.1111/eci.12677
13. Yao X, Chen L, Xu H, Zhu. Z. The association between serum uric acid and bone mineral density in older adults. Int J Endocrinol (2020) 7:3082318. doi: 10.1155/2020/3082318
14. Robles-Rivera K, Argoty-Pantoja AD, Hidalgo-Bravo A, Quezada-Sánchez AD, León-Reyes G, Flores YN, et al. Uric acid levels are associated with bone mineral density in Mexican populations: A longitudinal study. Nutrients (2022) 14(20):4245.
15. Xiao J, Chen W, Feng X, Liu W, Zhang Z, He L, et al. Serum uric acid is associated with lumbar spine bone mineral density in healthy Chinese males older than 50 years. Clin Interv Aging (2017) 12:445–52. doi: 10.2147/CIA.S130690
16. Chen F, Wang Y, Guo Y, Wang J, Yang A, Lv Q, et al. Specific higher levels of serum uric acid might have a protective effect on bone mineral density within a Chinese population over 60 years old: A cross-sectional study from northeast China. Clin Interv Aging (2019) 14:1065–73. doi: 10.2147/CIA.S186500
17. Pan K, Yao X, Liu M, Zhu Z. Association of serum uric acid status with bone mineral density in adolescents aged 12-19 years. Front Med (Lausanne) (2020) 7:255. doi: 10.3389/fmed.2020.00255
18. Kang S, Kwon D, Lee J, Chung Y-J, Kim M-R, Namkung J, et al. Association between serum uric acid levels and bone mineral density in postmenopausal women: A cross-sectional and longitudinal study. Healthcare (Basel) (2021) 9(12):1681. doi: 10.3390/healthcare9121681
19. Zhao X, Yu X, Zhang X. Association between uric acid and bone mineral density in postmenopausal women with type 2 diabetes mellitus in China: A cross-sectional inpatient study. J Diabetes Res (2020) 3982831. doi: 10.1155/2020/3982831
20. Dong X-W, Tian H-Y, He J, Wang C, Qiu R, Chen Y-M. Elevated serum uric acid is associated with greater bone mineral density and skeletal muscle mass in middle-aged and older adults. PloS One (2016) 11(5):e0154692. doi: 10.1371/journal.pone.0154692
21. Wang X-X, Lin K-N, Xu W-C, Chen. H. The causal relationship between abdominal obesity and lower bone mineral density: A two-sample mendelian randomization study. Front Genet (2022) 13:970223. doi: 10.3389/fgene.2022.970223
22. Huang X, Chen W, Gu C, Liu H, Hou M, Qin W, et al. Melatonin suppresses bone marrow adiposity in ovariectomized rats by rescuing the imbalance between osteogenesis and adipogenesis through SIRT1 activation. J Orthop Translat (2022) 38:84–97. doi: 10.1016/j.jot.2022.10.002
23. Jørgensen RM, Bøttger B, Vestergaard ET, Kremke B, Bahnsen RF, Nielsen BW, et al. Uric acid is elevated in children with obesity and decreases after weight loss. Front Pediatr (2022) 9:814166. doi: 10.3389/fped.2021.814166
24. Zeng J, Lawrence WR, Yang J, Tian J, Li C, Lian W, et al. Association between serum uric acid and obesity in Chinese adults: A 9-year longitudinal data analysis. BMJ Open (2021) 11(2):e041919. doi: 10.1136/bmjopen-2020-041919
25. Tsushima Y, Nishizawa H, Tochino Y, Nakatsuji H, Sekimoto R, Nagao H, et al. Uric acid secretion from adipose tissue and its increase in obesity. J Biol Chem (2013) 288(38):27138–49. doi: 10.1074/jbc.M113.485094
26. Han W, Bai X, Wang N, Han L, Sun X, Chen X. Association between lumbar bone mineral density and serum uric acid in postmenopausal women: a cross-sectional study of healthy Chinese population. Arch Osteoporos (2017) 12(1):50. doi: 10.1007/s11657-017-0345-0
27. Chen L, Peng Y, Fang F, Chen J, Pan L, You L. Correlation of serum uric acid with bone mineral density and fragility fracture in patients with primary osteoporosis: A single-center retrospective study of 253 cases. Int J Clin Exp Med (2015) 8(4):6291–4.
28. Ishii S, Miyao M, Mizuno Y, Tanaka-Ishikawa M, Akishita M, Ouchi. Association between serum uric acid Y. And lumbar spine bone mineral density in peri- and postmenopausal Japanese women. Osteoporos Int (2014) 25(3):1099–105. doi: 10.1007/s00198-013-2571-7
29. Ahn SH, Lee SH, Kim B-J, Lim K-H, Bae SJ, Kim EH, et al. Higher serum uric acid is associated with higher bone mass, lower bone turnover, and lower prevalence of vertebral fracture in healthy postmenopausal women. Osteoporos Int (2013) 24(12):2961–70. doi: 10.1007/s00198-013-2377-7
30. Babaei M, Shamsi R, Heidari B, Bijani A, Hosseini SR. Serum uric acid status and its association with bone mineral density in the elderly people aged 60 years and more. Int J Endocrinol Metab (2019) 17(3):e80780. doi: 10.5812/ijem.80780
31. Lee YJ, Hong JY, Kim SC, Joo JK, Na YJ, Lee KS. The association between oxidative stress and bone mineral density according to menopausal status of Korean women. Obstet Gynecol Sci (2015) 58(1):46–52. doi: 10.5468/ogs.2015.58.1.46
32. Yan D-D, Wang J, Hou X-H, Bao Y-Q, Zhang Z-L, Hu C, et al. Association of serum uric acid levels with osteoporosis and bone turnover markers in a Chinese population. Acta Pharmacol Sin (2018) 39(4):626–32. doi: 10.1038/aps.2017.165
33. Zhang D, Bobulescu IA, Maalouf NM, Adams-Huet B, Poindexter J, Park S. Relationship between serum uric acid and bone mineral density in the general population and in rats with experimental hyperuricemia. . J Bone Miner Res (2015) 30(6):992–9. doi: 10.1002/jbmr.2430
34. Sautin YY, Johnson RJ. Uric acid: The oxidant-antioxidant paradox. nucleosides nucleotides nucleic acids. Nucleosides Nucleotides Nucleic Acids (2008) 27(6):608–19. doi: 10.1080/15257770802138558
35. Bagnati M, Perugini C, Cau C, Bordone R, Albano E, Bellomo. G. When and why a water-soluble antioxidant becomes pro-oxidant during copper-induced low-density lipoprotein oxidation: A study using uric acid. Biochem J (1999) 340:143–52. doi: 10.1042/bj3400143
36. Lin K-M, Lu C-L, Hung K-C, Wu P-C, Pan C-F, Wu C-J, et al. The paradoxical role of uric acid in osteoporosis. Nutrients (2019) 11(9):2111. doi: 10.3390/nu11092111
37. Steinbeck MJ, Appel WH Jr., Verhoeven AJ, Karnovsky. MJ. NADPH-oxidase expression and in situ production of uperoxide by osteoclasts actively resorbing bone. J Cell Biol (1994) 126(3):765–72. doi: 10.1083/jcb.126.3.765
38. Garrett IR, Boyce BF, Oreffo RO, Bonewald L, Poser J, Mundy GR. Oxygen-derived free radicals stimulate osteoclastic bone resorption in rodent bone in vitro and in vivo. J Clin Invest (1990) 85(3):632–9. doi: 10.1172/JCI114485
39. Chen W, Roncal-Jimenez C, Lanaspa M, Smits G, Chonchol M, Johnson RJ, et al. Uric acid suppresses 1 alpha hydroxylase in vitro and in vivo. Metabolism (2014) 63(1):150–60. doi: 10.1016/j.metabol.2013.09.018
40. Vanholder R, Patel S, Hsu CH. Efect of uric acid on plasma levels of 1,25(OH)2D in renal failure. J Am Soc Nephrol (1993) 4(4):1035–8. doi: 10.1681/ASN.V441035
41. Mohammed AA, Mohamed AM, Abdulazim DO, Hassan M, Shaker O, Ayeldeen G, et al. Serum urate lowering therapy using allopurinol improves serum 25 hydroxy vitamin d in stage 3-5 CKD patients: A pilot study. Nephron (2021) 145(2):133–6. doi: 10.1159/000512340
Keywords: bone mineral density, hyperuricemia, obesity, cross-sectional, uric acid
Citation: Zhang Y, Tan M, Liu B, Zeng M, Zhou Y, Zhang M, Wang Y, Wu J and Wang M (2023) Relationship between bone mineral density and hyperuricemia in obesity: A cross-sectional study. Front. Endocrinol. 14:1108475. doi: 10.3389/fendo.2023.1108475
Received: 26 November 2022; Accepted: 13 March 2023;
Published: 28 March 2023.
Edited by:
Mikiko Watanabe, Sapienza University of Rome, ItalyReviewed by:
Muthukumaran Jayachandran, Tongji University, ChinaJiqiu Wang, Shanghai Jiao Tong University, China
Ji Hu, Second Affiliated Hospital of Soochow University, China
Bin Lu, Fudan University, China
Copyright © 2023 Zhang, Tan, Liu, Zeng, Zhou, Zhang, Wang, Wu and Wang. This is an open-access article distributed under the terms of the Creative Commons Attribution License (CC BY). The use, distribution or reproduction in other forums is permitted, provided the original author(s) and the copyright owner(s) are credited and that the original publication in this journal is cited, in accordance with accepted academic practice. No use, distribution or reproduction is permitted which does not comply with these terms.
*Correspondence: Min Wang, bWlud2FuZ0Bjc3UuZWR1LmNu; Jing Wu, d3VqaW5nMDczMUAxNjMuY29t
†These authors have contributed equally to this work and share the first authorship