 Qingying Si
 Jinxiu Guo
 Xiumei Yang1
 Linlin Wu
 Dadi Xie
 Pei Jiang
95% of researchers rate our articles as excellent or good
Learn more about the work of our research integrity team to safeguard the quality of each article we publish.
Find out more
ORIGINAL RESEARCH article
Front. Endocrinol. , 24 January 2023
Sec. Clinical Diabetes
Volume 14 - 2023 | https://doi.org/10.3389/fendo.2023.1107162
This article is part of the Research Topic Practice Innovation and Outcome Evaluation in Diabetes View all 13 articles
Purpose: Type 1 diabetes is characterized by elevated blood glucose levels, which negatively impacts multiple organs and tissues throughout the body, and its prevalence is on the rise. Prior reports primarily investigated the serum and urine specimen from diabetic patients. However, only a few studies examined the overall metabolic profile of diabetic animals or patients. The current systemic investigation will benefit the knowledge of STZ-based type 1 diabetes pathogenesis.
Methods: Male SD rats were arbitrarily separated into control and streptozotocin (STZ)-treated diabetic rats (n = 7). The experimental rats received 50mg/kg STZ intraperitoneal injection daily for 2 consecutive days. Following 6 weeks, metabolites were assessed via gas chromatography-mass spectrometry (GC-MS), and multivariate analysis was employed to screen for differentially expressed (DE) metabolites between the induced diabetic and normal rats.
Results: We identified 18, 30, 6, 24, 34, 27, 27 and 12 DE metabolites in the serum, heart, liver, kidney, cortex, renal lipid, hippocampus, and brown fat tissues of STZ-treated diabetic rats, compared to control rats. Based on our analysis, the largest differences were observed in the amino acids (AAs), B-group vitamin, and purine profiles. Using the metabolic pathway analysis, we screened 13 metabolic pathways related to the STZ-exposed diabetes pathogenesis. These pathways were primarily AA metabolism, followed by organic acids, sugars, and lipid metabolism.
Conclusion: Based on our GC-MS analysis, we identified potential metabolic alterations within the STZ-exposed diabetic rats, which may aid in the understanding of diabetes pathogenesis.
Diabetes is an endocrine disease characterized by elevated blood glucose level, which can be divided into type 1 diabetes and type 2 diabetes according to the different pathogenesis. Among them, type 1 diabetes is caused by the destruction of pancreatic beta cells, insufficient insulin secretion, leading to hyperglycemia and even ketosis (1). Studies have shown that there will be approximately 8 million type 1 diabetes patients worldwide in 2021, and the prevalence of type 1 diabetes is predicted to increase by 60-107% to reach 135 million to 174 million in 2040. The substantial missing prevalence highlights the premature mortality from type 1 diabetes. Acute complications include diabetic ketoacidosis, which requires urgent management. Chronic complications include microvascular and macrovascular diseases (2). Type 1 diabetes can occur at any age, and while its onset peak incidence still in early adolescence, it is more common in adulthood, with the majority of incident and prevalent cases occurring in adult population. Macrovascular and microvascular complications are the greatest cause of excess morbidity and mortality in the adult population (3). The increasing global burden of type 1 diabetes, particularly in resource-limited low- and middle-income countries, calls for targeted interventions to optimize blood glucose control to reduce acute and chronic complications (4). Diabetes is also a metabolic disease, affecting the body’s metabolism of matter and energy. It is speculated that the metabolomics findings of diabetes may reveal biological pathways, aid in the understanding of pathophysiological mechanisms, identify individuals at risk of disease, and benefit the development of novel treatments for type 1 diabetes (5).
Genomics and proteomics offer information about what is likely to happen. In contrast, metabolomics provides data on what is actually happening (Bill Lasley, UC Davis). Metabolomics employs high-throughput detection and data analysis to examine the cellular metabolome, which includes all low molecular weight metabolites (molecular weight <1000) within the cell, aims to realize information modeling and system integration in a branch of systems biology. Metabolomics is a research method based on mass spectrometry, and the common separation approaches are as follows: gas chromatography (GC), liquid chromatography (LC), capillary electrophoresis (CE), and so on (6). Metabolomics is a profitable tool for the identification of novel risk markers. Diabetes differential metabolites identification may highlight underlying mechanisms regulating diabetes pathogenesis. Moreover, it can screen patients at risk of disease, which can be a predictive platform for related warning signals (5, 7).
In recent years, there were multiple metabolomics investigations involving diabetic serum and other tissues, such as the heart (8), liver (9), kidney (10), and hippocampus (11). Based on our search of literature, the present article is the first to comprehensively analyze the metabolomics of STZ-treated diabetic rats. Herein, we employed GC-MS, along with univariate and multivariate analyses to elucidate STZ-based alterations in the serum, heart, liver, kidney, cortex, renal lipid, hippocampus, and brown fat metabolites of diabetic rats. Our findings further our understanding of STZ-based diabetes pathogenesis, and may lead to a new perspective on type 1 diabetes treatments and complications management.
8 week-old male Sprague-Dawley (SD) rats, averaging 200-230 gram in body weight, were maintained in typical polypropylene cages (three rats/cage), under regulated room temperature (RT) and humidity, with 12/12-hour light-dark cycle. All rats were given ample water as well pelleted regular chow diet for two weeks. Fasting glucose and body weight were measured weekly. Subsequently, the rats were arbitrarily separated into two groups, namely, control (n=7) and STZ-exposed diabetic rats (n=7). Following fasting for 12 hours, each rat in the STZ group was intraperitoneally injected daily with streptozotocin (STZ 50 mg/kg, resuspended in newly prepared 0.1 M, pH 4.5 citrate buffer, and kept on ice prior to usage, low dose STZ model) for two consecutive days to induce diabetes (12). The control rats were provided with the same volume and duration of citrate buffer alone. The STZ dosage was selected based on earlier report (13). In addition, the fasting glucose was measured on the second day after STZ injections to assess the success of the established type 1 diabetes model. Rats with blood glucose ≥11.1mmol/L were considered diabetic. The blood glucose and body weight assessments were performed once a week for 6 consecutive weeks. Our work received ethical approval from the Translational pharmaceutical laboratory, Jining First People’s Hospital (protocol number JNRM-2022-DW-011), and followed the animal care and experimentation guidelines of the National Institutes of Health.
STZ, citric acid, and sodium citrate were acquired from Yisheng Biotechnology Co., LTD (Shanghai, China). O-methylhydroxylamine hydrochloride (the purity of 98%) was acquired from J&K Scientific Ltd. (Beijing, China). Heptadecanoic acid (an internal standard, IS, purity ≥98%), N, O-bis (trimethylsilyl) trifluoroacetamide (BSTFA) with 1% trimethyl-chlorosilne (TMCS) were acquired from Sigma-Aldrich (Saint Louis, USA). Pyridine was provided by Macklin Biochemical (Shanghai, China). Chromatographic-grade methanol came from Thermo Fisher Scientific (Waltham, MA,USA). Water was bought from Wahaha Company (Hangzhou, China).
Following euthanasia, we extracted blood samples and obtained serum samples using centrifugation (4500×g, 5 min). Next, 100 μL serum was combined with 350 μL methanol and 100 μg/mL heptadecanoic acid, prior to centrifugation at 20913 × g at 4°C for 10 min. The resulting supernatants were placed in 2-mL tubes, prior to drying at 37°C under nitrogen gas, then combined with 80μL O-methylhydroxylamine hydrochloride (resuspended in pyridine at 15 mg/mL), and maintained at 70°C for 90 min. Next, 100 μL BSTFA carrying 1% TMCS was introduced to the extracts, and maintained at 70°C for 60 min. This was followed by vortexing, centrifugation (20913 × g, 4°C, 2 min), filter filtration using 0.22-μm membrane filter, and analysis using GC-MS.
Tissue samples (50mg; heart, liver, kidney, cortex, renal lipid, hippocampus, and brown fat) underwent homogenization in 1 methanol and 1 mg/mL IS, prior to transfer to 2-mL tubes and centrifugation at 20913 × g at 4°C for 10 min. The rest of the protocol mirrored that of the serum samples.
The quality control (QC) samples were described as a combination of control and STZ-treated diabetic rat samples.
An Agllent 7890B 7000C MSD GC-MS was used to conduct GC-MS analysis. Samples were separated with an HP-5MS fused silica capillary column. Using the carrier helium, 1 μL derivative mixture was operated in split mode (50:1), with flow rates of 3 mL/min front inlet purge and 1 mL/min gas. The temperatures associated with the transfer line, administration, and ion source were 250°C, 280°C, and 230°C, respectively. The GC temperature regimen was as follows: 60°C for 5min, elevation to 300°C, at 8°C/min, then maintenance at 300°C for 5 min. The MS setting employed electron ionization with 20 spectra/s acquisition rate. MS identification was carried out in full scan mode using electrospray ionization (ESI) with m/z range of 50-800.
MassHunter Workstation Unknown Analysis (Agilent, B.06.00) was employed for QC sample data analysis in GC-MS to generate a spectrum library. Next, the MassHunter Quantitative (Agilent, B.06.00) was employed to select the spectrum library to verify compounds.
SMICA-P 14.1 (Sartorius, Sweden) was employed for differential compound analysis. The original GC-MC-based data was preprocessed in Excel with arrangement and area ratio normalization, and the data set was sorted into a pattern that could be directly imported into SIMCA-P software for analysis. The principal component (PCA), partial least squares discriminant (PLS-DA), and orthogonal partial least squares discriminant analyses (OPLS-DA) were employed for model generation, and the model was fitted automatically. The score and load diagrams were viewed for data analysis, and permutation testing (200 permutations) was performed to verify whether the model was over-fitted. To further identify the differential compounds between control and experimental rats, IBM SPSS (Statistical Package for Social Science) version 26.0 (IBM Corp., Armonk, NY, USA) was employed to perform two-tailed Student’s t-tests. Variable importance in projection (VIP) value >1.0 and computed p-value <0.05 were set as the significance threshold.
Pathway assessments were done via the MetaboAnalyst 5.0 (https://www.metaboanalyst.ca) and Kyoto Encyclopedia of Genes and Genomes (KEGG; https://www.kegg.jp) analyses. Raw p < 0.05 and impact > 0 were set as significance threshold.
Following two intraperitoneal injections of STZ, the blood glucose of experimental rats was markedly enhanced, relative to control rats, and the body weight showed no gain during the entire experiment (Table 1).
Table 1 The metabolic parameters of control (CON) and STZ-treated diabetic (STZ) rats.
All chromatograms involving the QC serum and tissue samples displayed strong signals. Typical GC-MS total ion chromatograms (TIC) representatives of the serum, heart, liver, kidney, cortex, renal lipid, hippocampus, and brown fat are displayed in Figure 1.
Figure 1 Typical gas chromatography–mass spectrometry (GC–MS) total ion chromatograms (TIC) of the quality control (QC) from serum (A), heart (B), liver (C), kidney (D), cortex (E), renal lipid (F), hippocampus (G), and brown fat (H).
The GC-MS results were further verified with the SMICA software, and fitted via the OPLS model to identify significant metabolites. IBM SPSS version 26 (IBM Corp., Armonk, NY, USA) was employed for forecasting. Based on our analyses, 18, 30, 6, 24, 34, 27, 27, and 12 metabolites were DE between the control and STZ-treated diabetic rat serum, heart, liver, kidney, cortex, renal lipid, hippocampus, and brown fat tissues, respectively. These parameters (serum: R2X = 0.607, R2Y = 0.981, Q2 = 0.910; heart: R2X = 0.626, R2Y = 0.995, Q2 = 0.906; liver: R2X = 0.554, R2Y = 0.964, Q2 = 0.581; kidney: R2X = 0.734, R2Y = 0.991, Q2 = 0.929; cortex: R2X = 0.739, R2Y = 0.996, Q2 = 0.955; renal lipid: R2X = 0.629, R2Y = 0.993, Q2 = 0.824; hippocampus: R2X = 0.709, R2Y = 0.997, Q2 = 0.969; brown fat: R2X = 0.605, R2Y = 0.996, Q2 = 0.815) clearly separated the control from the STZ-treated rats (VIP > 1, p < 0.05).
For all parameters, a value closer to 1 represented a better explanatory rate and prediction ability of the overall model. The permutation test carried out sequential replacement of samples, recalculated the statistical test quantity, constructed the empirical distribution, and lastly, computed the OPLS-DA model parameters for judgment. In total, 200 replacement tests were conducted for internal model validation, and to avoid the model from over-fitting. The judgment criterion was as follows: the Q2 intercept on the Y-axis was negative, indicating that over-fitting did not occur (Figure 2).
Figure 2 Orthogonal projections to the latent structural (OPLS) scores and 200 permutation tests for the OPLS-discriminant analysis (OPLS-DA) models: serum (A), heart (B), liver (C), kidney (D), cortex (E), renal lipid (F), hippocampus (G), and brown fat (H).
Using SMICA 14.1 and SPSS 26.0 analyses, VIP > 1.0 and p < 0.05 were set as the significance threshold. The corresponding compounds were considered as differential compounds between the control and STZ-treated rats. There were 18, 30, 7, 24, 34, 27, 27 and 12 DE metabolites between the control and STZ-treated diabetic rat serum, heart, liver, kidney, cortex, renal lipid, hippocampus, and brown fat tissues, respectively (Table 2). The relative distributions of all differential metabolites in all tissues are expounded in Figure 3.
Table 2 A summary of the statistically significant differential metabolites expressed in each tissue of the control and experimental rats.
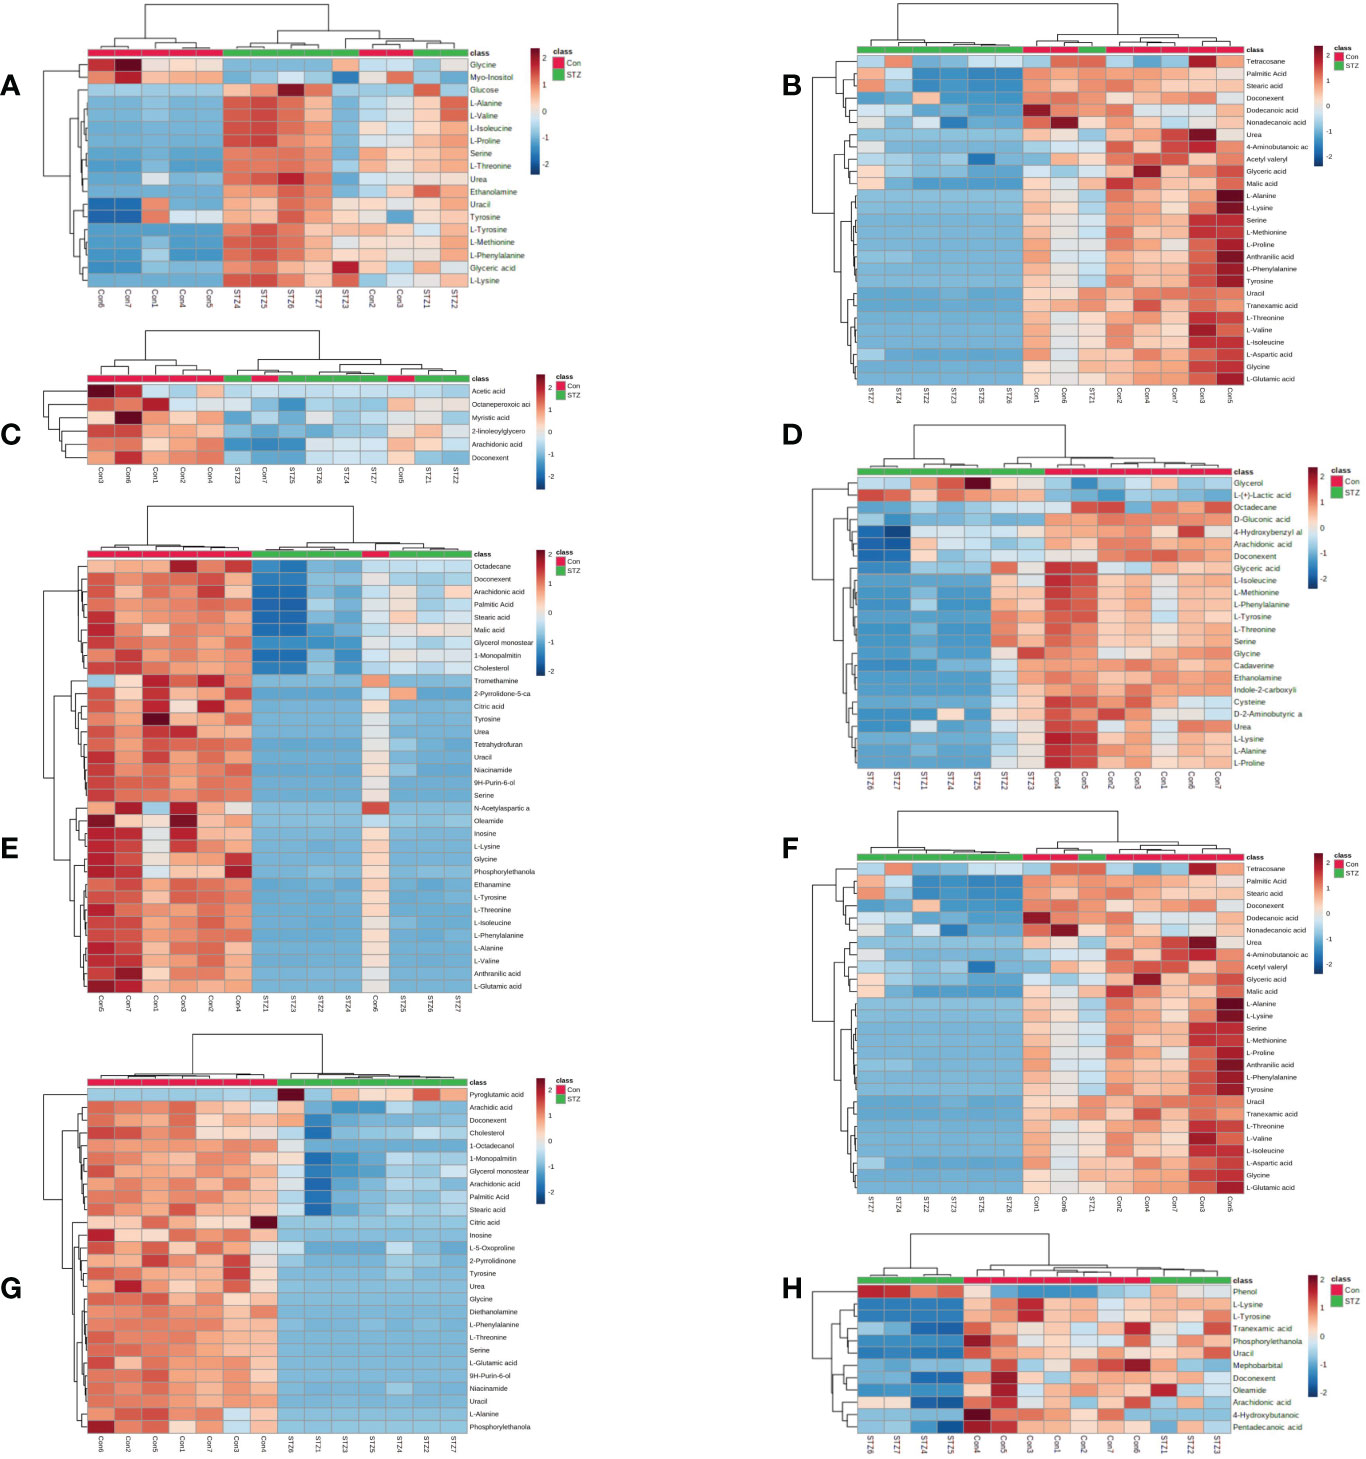
Figure 3 significance (red, elevated; blue, diminished). Rows denote samples, columns denote metabolites.The heatmap of differentially regulated metabolites from the serum (A), heart (B), liver (C), kidney (D), cortex (E), renal lipid (F), hippocampus (G), and brown fat (H) of STZ and control rats. The color of each section signifies its alteration.
Using metaboAnalyst 5.0, we identified 13 major pathways that were modulated by the DE metabolites (Raw p < 0.05, impact > 0). In the serum, they were phenylalanine (Phe), tyrosine (Tyr) and tryptophan (Trp) biosynthesis; Phe metabolism; glycine (Gly), serine (Ser), and threonine (Thr) metabolism; as well as glyoxylate (Glyox) and dicarboxylate (DIC) metabolism. In the heart, they were glutathione (GSH) metabolism; Gly, Ser, and Thr metabolism; nicotinate and nicotinamide (NAM) metabolism. In the kidney, they were Gly, Ser, and Thr metabolism; Phe, Tyr, and Trp biosynthesis; GSH, Phe, glycerolipid (GL) metabolism; and pentose phosphate pathway(PPP). In the cortex, they were alanine (Ala), aspartate (Asp) and glutamate (Glu) metabolism; Phe, Tyr, and Trp biosynthesis; D-glutamine and D-glutamate metabolism; Phe, Glyox and DIC metabolism; and arginine (Arg) biosynthesis. In the renal lipid, they were Ala, Asp, and Glu metabolism; Arg, Phe, Tyr, and Trp biosynthesis; Phe metabolism; Glyox and DIC metabolism; Gly, Ser, and Thr, Arg and proline (Pro), and butanoate metabolism. In the hippocampus, they were Phe, Tyr, and Trp biosynthesis, Phe metabolism; Ala, Asp, Glu, Glyox, DIC, and GSH metabolism; and Arg biosynthesis.In brown fat, they were Phe, Tyr, and Trp biosynthesis. The network analyses are detailed in Table 3 and Figure 4, and the information is summarized in Figure 5. Furthermore, all network flowcharts are available at KEGG.
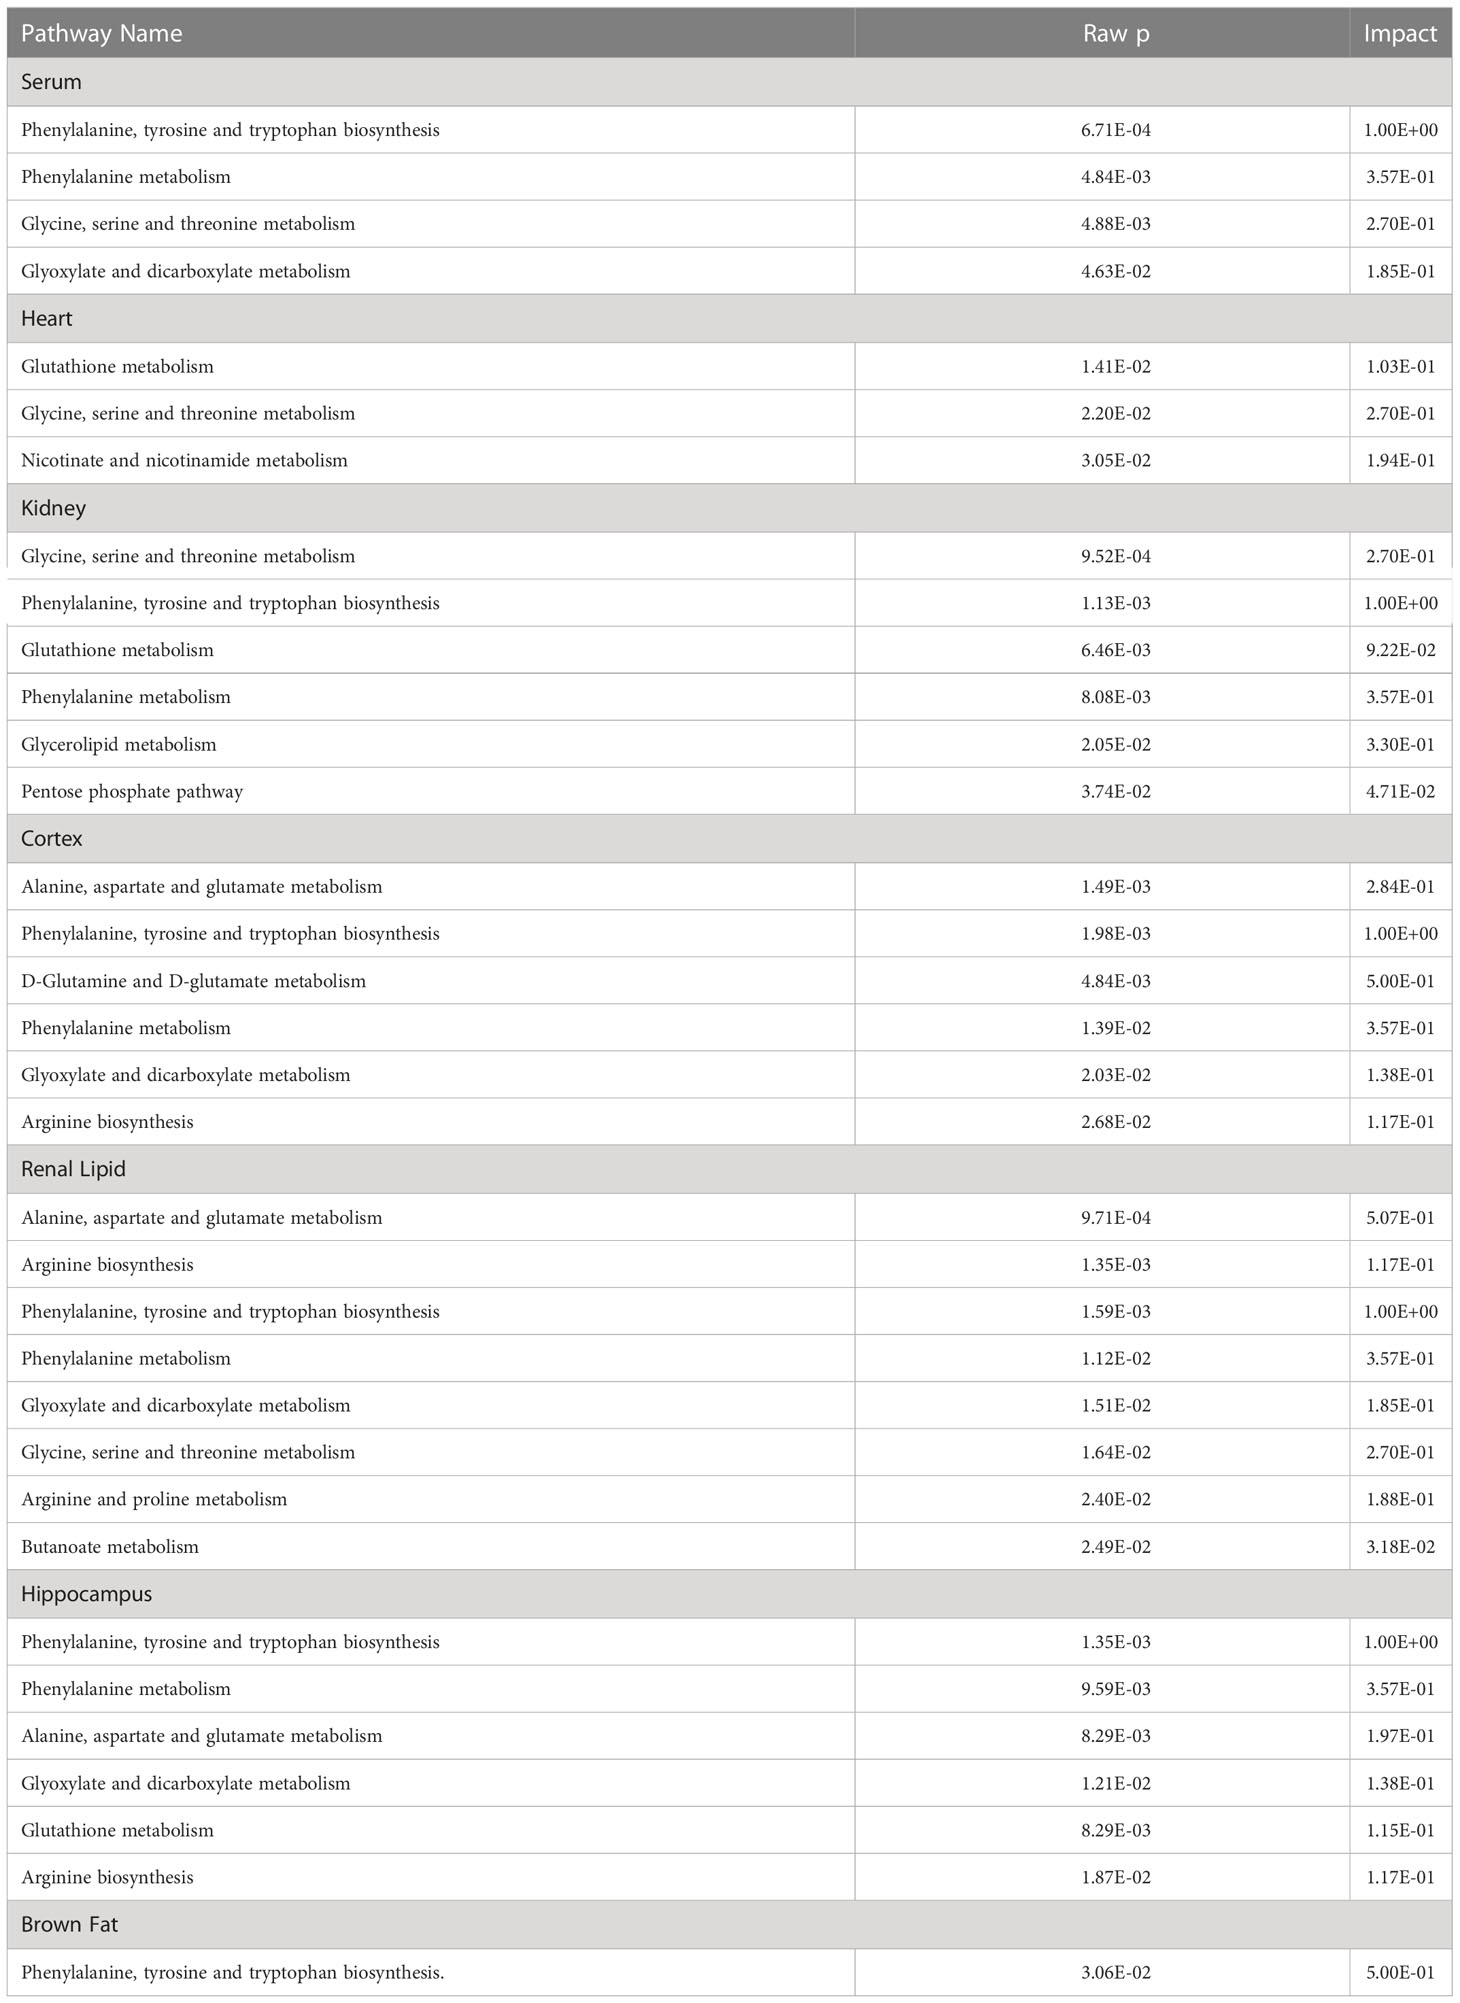
Table 3 List of metabolic pathways, as evidenced by MetaboAnalyst5.0.
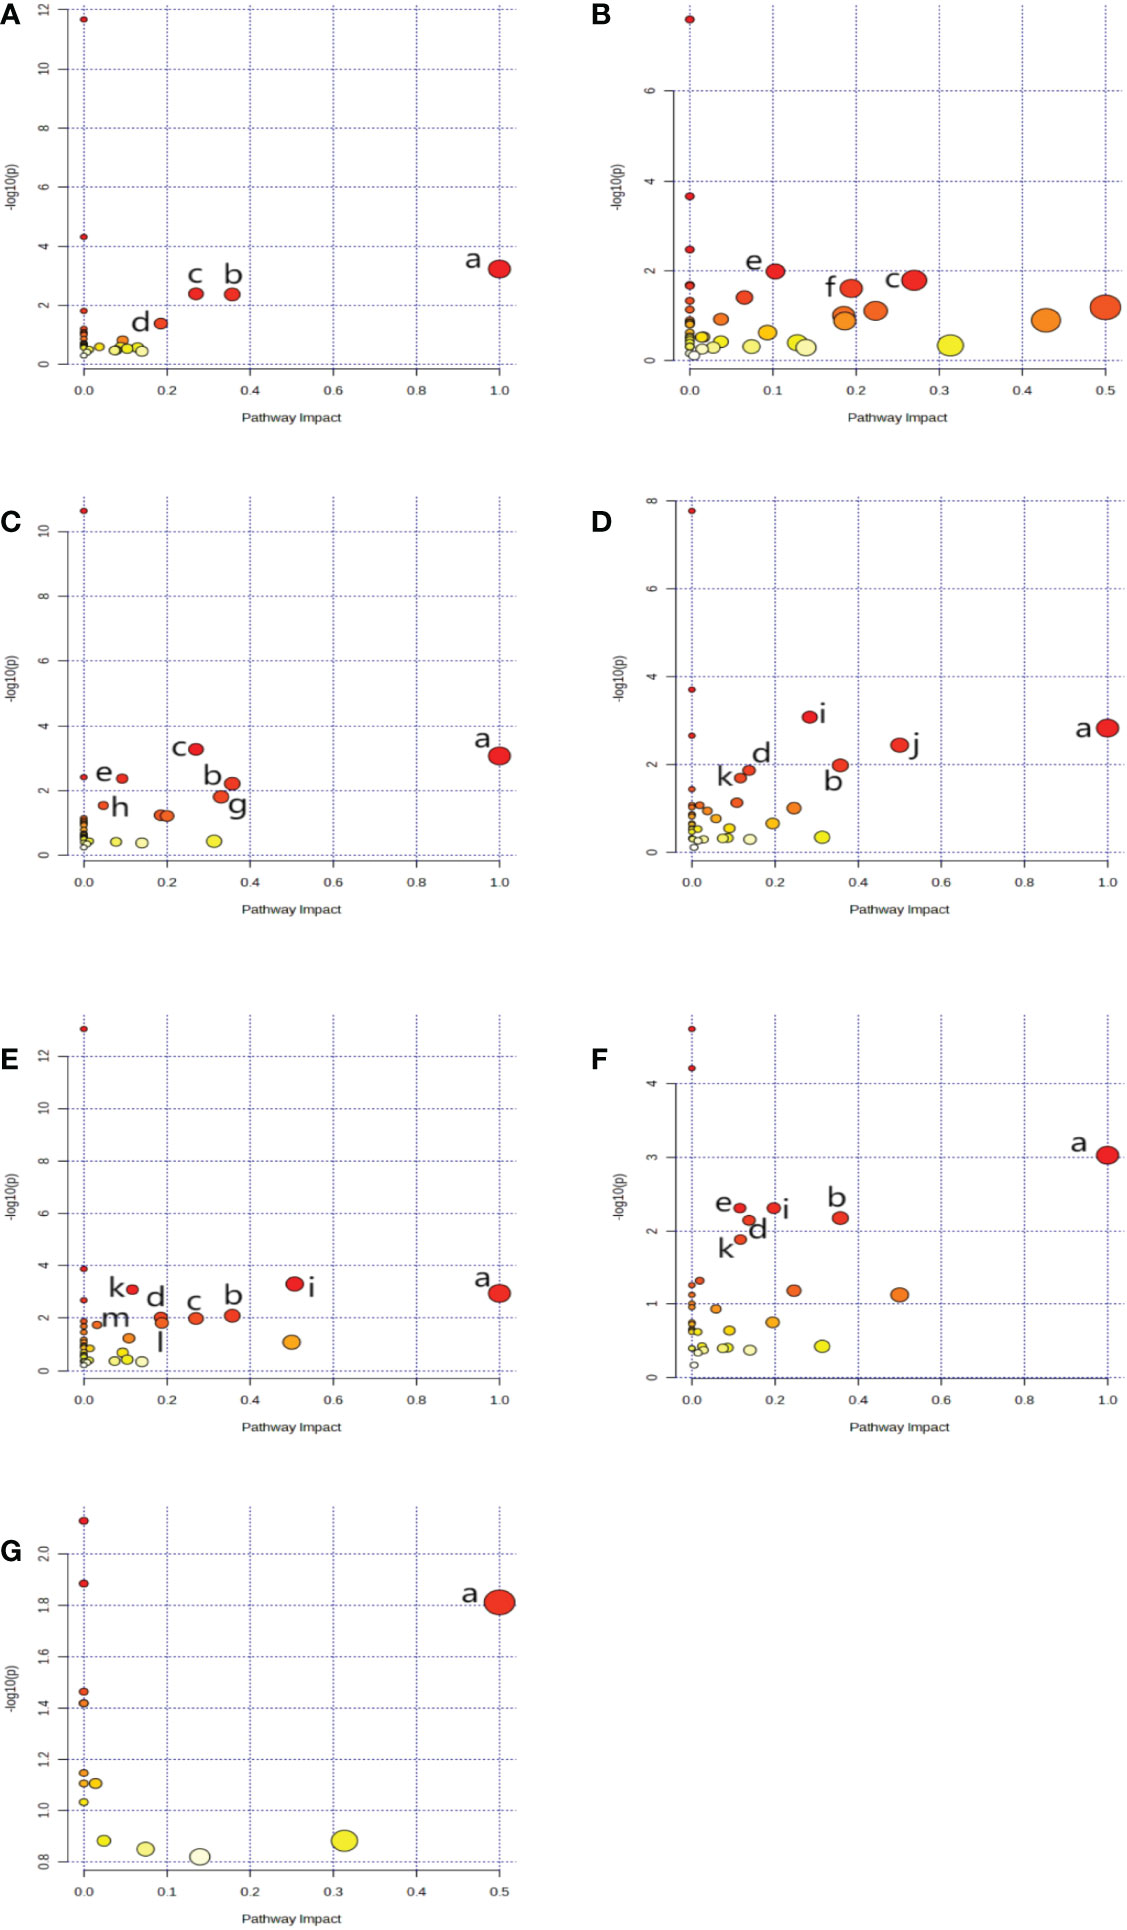
Figure 4 A network analysis summary, as evidenced by MetaboAnalyst 5.0. Serum (A), Heart (B), kidney (C), cortex (D), renal lipid (E), hippocampus (F), and brown fat (G). Metabolisms or biosynthesis of (a) Phenylalanine, tyrosine, and tryptophan, (b) Phenylalanine, (c) Glycine, serine, and threonine, (d) Glyoxylate and dicarboxylate, (e) Glutathione (f) Nicotinate and nicotinamide, (g) Glycerolipid, (h) Pentose phosphate, (i) Alanine, aspartate, and glutamate, (j) D-Glutamine and D-glutamate, (k) Arginine, (l) Arginine and proline, (m) Butanoate.
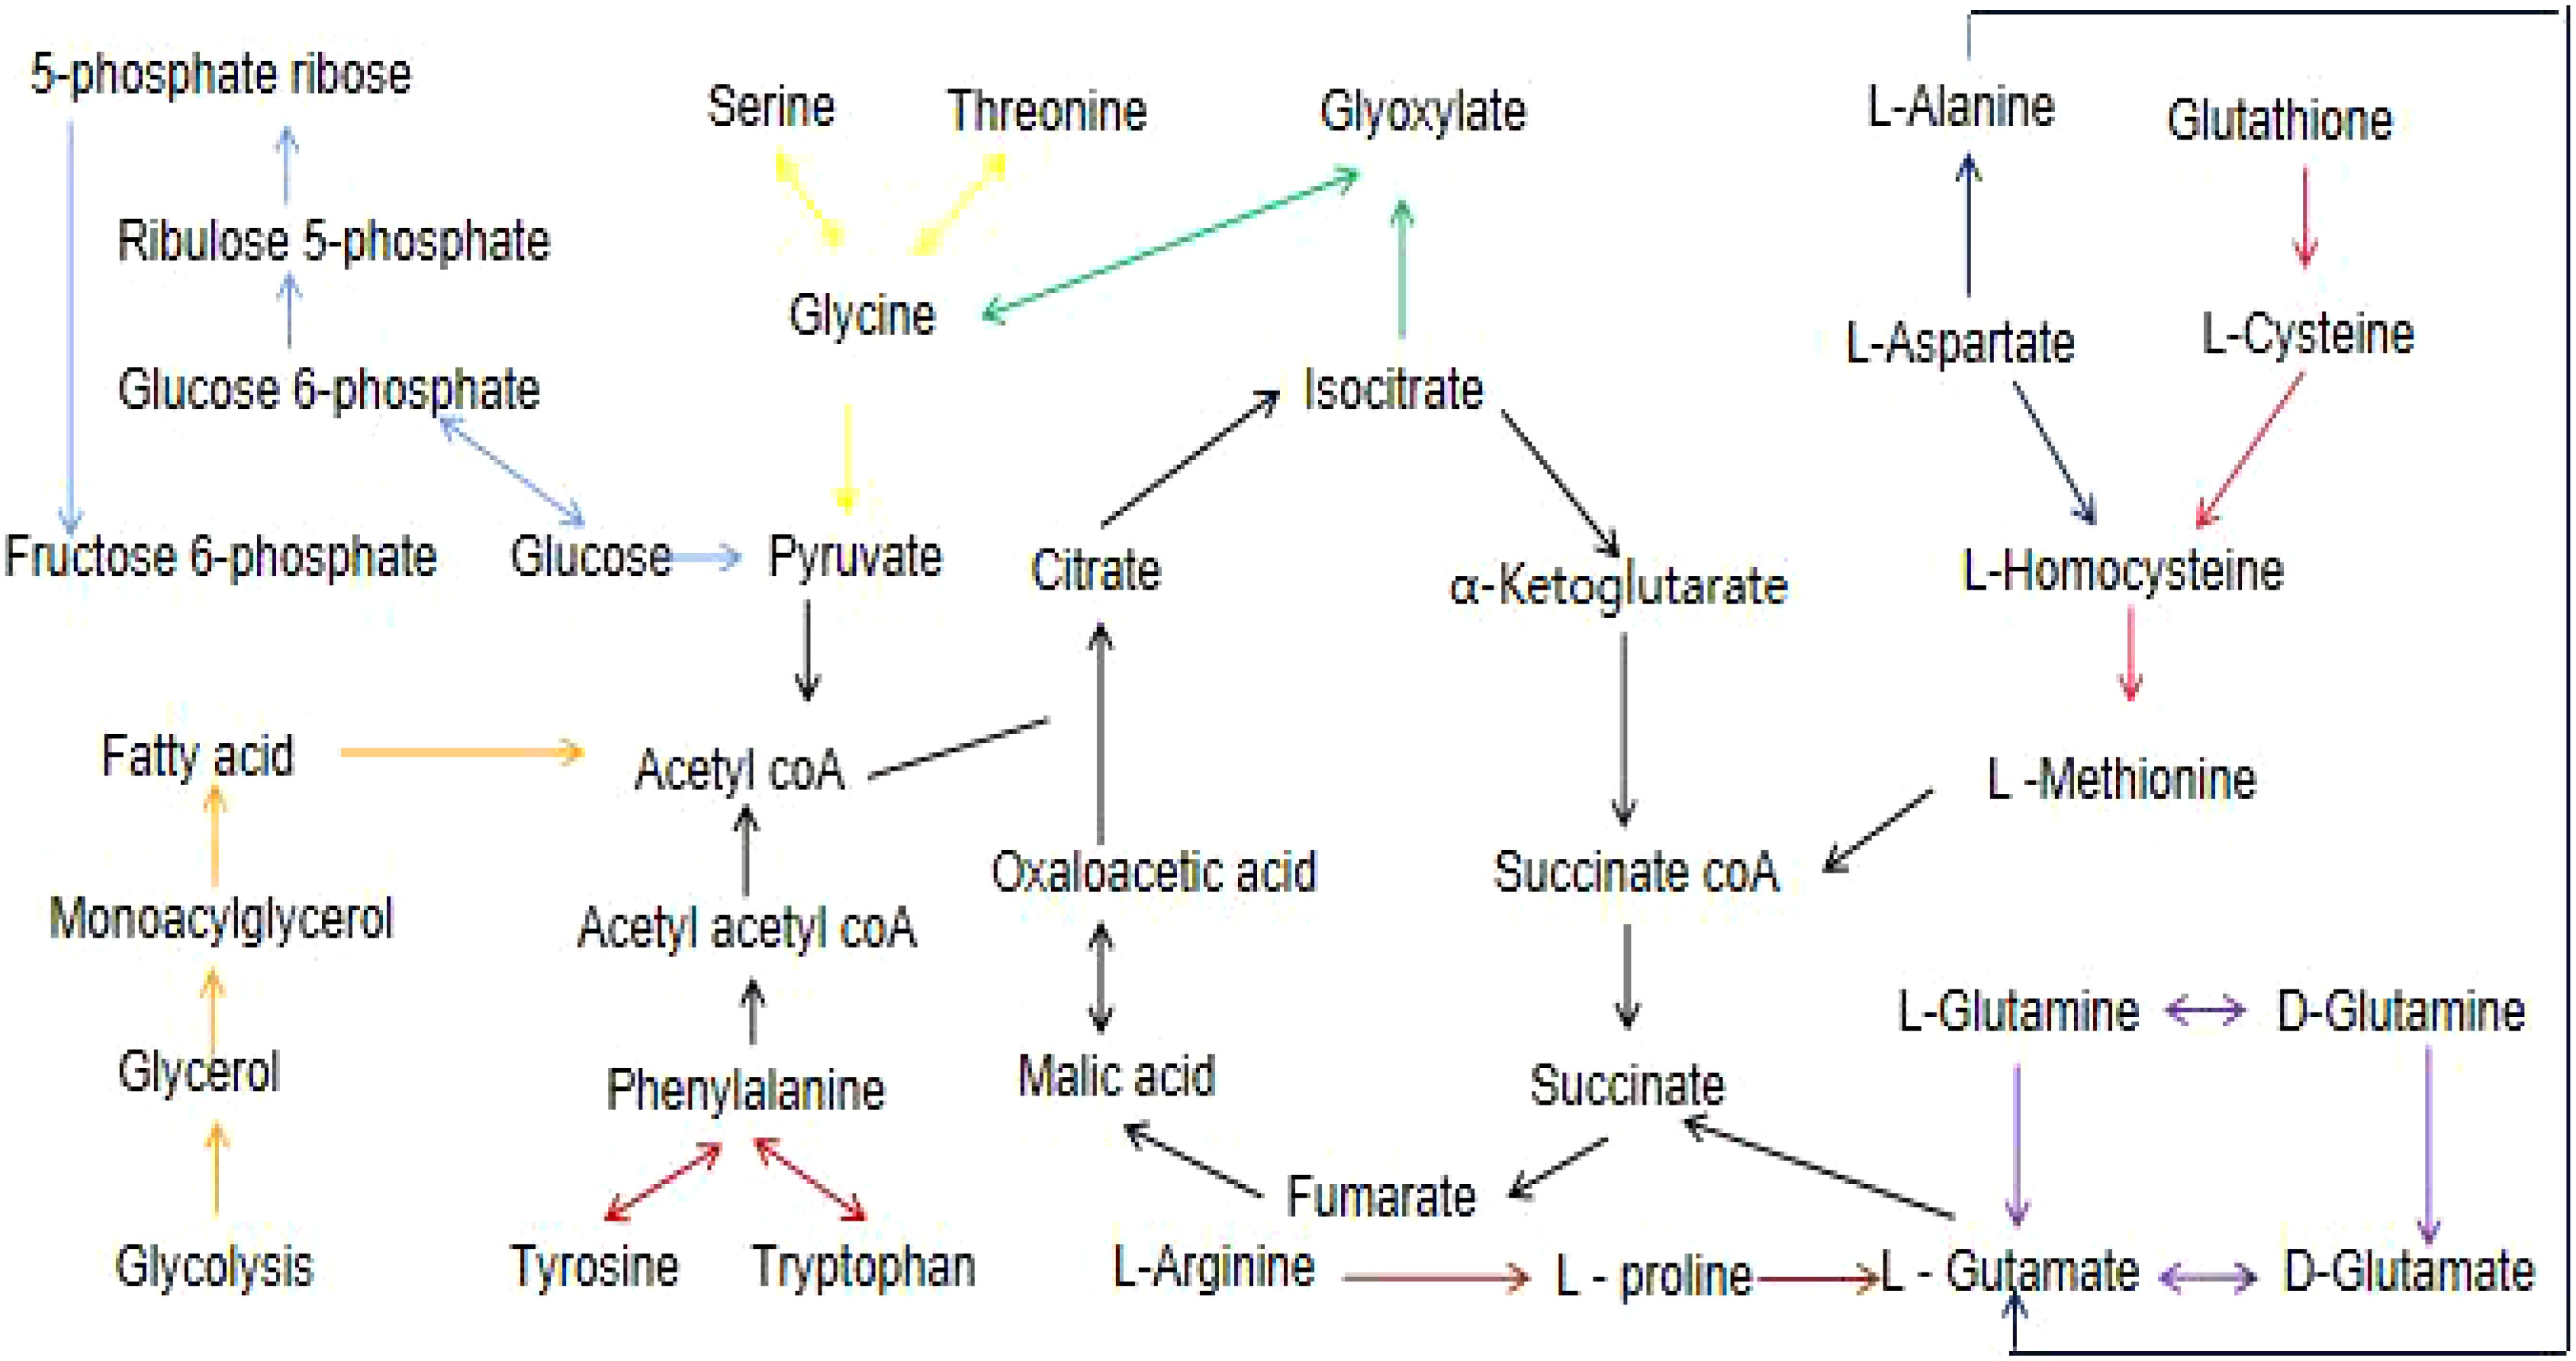
Figure 5 A flow chart of the metabolites and their associated networks in the target tissues of STZ-treated diabetic rats versus controls. Red arrows: phenylalanine, tyrosine and tryptophan biosynthesis; light blue arrows: pentose phosphate pathway; yellow arrows: glycine,serine, and threonine metabolism; green arrows: glyoxylate and dicarboxylate metabolism; blue arrows: alanine, aspartate, and glutamate metabolism; pink arrows: glutathione metabolism; purple arrows: D-glutamine and D-glutamate metabolism; orange arrows: glycerolipid metabolism; brown arrows: arginine and proline metabolism.
There is an almost complete lack of insulin in type 1 diabetes (14), which acts as an anabolic hormone with multiple effects on sugar, lipid, protein metabolism, growth and development. Patients with type 1 diabetes need to use insulin throughout their life to maintain life, and even regular use of insulin cannot simulate the physiological endogenous insulin secretion pattern (15), resulting in large fluctuations in blood sugar, enhanced health care costs (16), and reduced quality of life (17). STZ is an antitumor antibiotic produced from a certain type of streobasidium pullulans. It possesses a targeted destructive effect on pancreatic β cells, and it compromises insulin production to induce diabetes (18). Different dosages of STZ is known to induce different models of diabetes (19). Metabolomics involves an extensive analysis of metabolites within biological systems, namely, low-molecular weight biochemical compounds like sugars, lipids, amino acids (AAs), organic acids, and nucleotides (20). In this study, STZ-treated type 1 diabetic rats were employed for the analysis of compounds with varying performances in the serum and key target tissues of control and experimental rats, under conditions of hyperglycemia. Our goal was to better understand the type 1 diabetes pathogenesis in order to develop novel targets that prevent and/or treat type 1 diabetes and its complications.
As seen in Table 1, type 1 diabetic rat models were generated via two intraperitoneal injections of STZ (50mg/kg) in ice-cold citrate buffer (pH7.4). Roche blood glucose meter was used to monitor blood glucose weekly, and a blood glucose value greater than 11.1mmol/L was considered to indicate diabetes. The above data revealed that the rat models were successfully established.
We are the first to report an analysis of metabolic alterations in the serum, heart, liver, kidney, cortex, renal lipid, hippocampus, and brown fat of STZ-induced type 1 diabetic rats versus controls. This study revealed that, compared to controls, there were 18, 30, 6, 24, 34, 27, 27, and 12 DE compounds in the serum, heart, liver, kidney, cortex, renal lipid, hippocampus, and brown adipocytes of STZ rats, respectively. These compounds are related to one another, and they participate in metabolic networks associated with sugars, AAs, and energy metabolism. Based on our analysis of these DE compounds and related pathways, we gained a deeper understanding of the metabolic alterations caused by type 1 diabetes. These metabolites and metabolic networks are potential candidate for the indication of early alterations with diabetes, which may enable us to comprehensively understand type 1 diabetes pathogenesis, and provide new targets for its management.
Our analyses uncovered that AAs serve critical functions in STZ-treated type 1 diabetes conditions. Herein, a variety of AA metabolites were DE in the STZ-treated diabetes rats, relative to the controls. These included Cysteine (Cys), Gly, L-5-Oxoproline, L-Ala, L-Asp, L-Glu, L-Isoleucine (Ile), L-Lysine, L-Methionine (Met), L-Phe, L-Proline (Pro), L-Thr, L-Tyr, L-Valine (Val), Pyroglutamic acid, Ser, and Tyr. The associated metabolic networks were as follows: Ala, Asp, Glu, Arg, Pro, Arg, D-glutamine, D-glutamate, Gly, Ser, Thr, Phe, Tyr, and Trp biosynthesis.
Type 1 diabetes occurs in the absence or insufficiency of insulin secretion (21). This often accompanies oxidative stress and alterations in the glucose and lipid metabolism (22–24). Branched-chain AAs (BCAAs) include Leucine (Leu), Ile, and Val, as well as aromatic AAs (AAAs) like Phe, Tyr, and Trp. Previous studies suggested that the serum concentration of BCAAs and AAAs are related to insulin resistance (25–28), and that they can predict future type 2 diabetes development (29). In addition to adverse effects on insulin sensitivity, elevated plasma BCAAs stimulate insulin secretion, deplete insulin reserves in early type 1 diabetes, impair pancreatic β cell function, and ultimately leads to insulin deficiency (30). The levels of BCAAs are also elevated in model animals with type 1 diabetes. The mechanism may be that in the state of insulin deficiency, the amination of BCAAs in the visceral tissue liver is activated, the absorption of BCAAs in the muscle tissue is reduced, the hydrolysis of total muscle protein is increased, the concentration of BCAAs is increased (31). In this study, the levels of BCAAs (Ile, Val) and AAAs (Phe, Tyr) in the serum of STZ rats were markedly elevated, compared to controls, thus corroborating the data from previous investigations. Some investigations also revealed that alterations in BCAAs and AAAs levels also precede increases in blood sugar (32).
Gluconeogenesis is essential for glucose homeostasis (33). We observed elevated serum glycolic AAs (Ala, Met, Pro, Val, and Ser) levels in STZ-treated diabetic rats, which may induce hyperglycemia via hepatic or renal gluconeogenesis. Meanwhile, the circulating ketogenic AAs (Lys) and ketogenic and glycolic AAs (lle, Phe, Thr, and Tyr) concentrations increased, suggesting that the body weight of STZ rats was lower, compared to the control rats likely due to insufficient energy synthesis, reduced anabolism, and enhanced catabolism during diabetes. As previously revealed, Ile, Phe, Tyr, and Val all have “dual” identities, which further affect Phe, Tyr, and Trp biosynthesis, as well as Gly, Ser, and Thr metabolic networks. This causes a series of metabolic alterations mediated by diabetes. Our study supported the relationship between AA concentrations and diabetes risk observed in recent years (32, 34), and it facilitated the identification of a potential mechanism to explain this relationship in the future. Alterations in Ala concentration, observed in our study, were related to the metabolic pathways of Glyox and DIC. Using the Glyox cycle, fats are converted to sugars, and the resulting DIC is used as a supplement for compounds in the tricarboxylic acid (TCA) cycle, thereby affecting energy metabolism (4). Elevated Glyox levels may be a new metabolic feature of type 1 diabetes mellitus and its pathophysiology. These findings may help in treating STZ-induced type 1 diabetes.
Gly, one of the simplest AAs and a substrate for GSH biosynthesis, is known to enhance antioxidant defenses. Our study observed a decrease in Gly levels in the serum, heart, kidney, cortex, renal lipids, and hippocampus of STZ-treated type 1 diabetic rats, suggesting that the antioxidant defenses were weakened when the blood glucose was elevated (35). Asp serves as a carrier for K+ and Mg2+ ions, and it delivers these electrolytes to the myocardium to improve myocardial systolic activity, while lowering oxygen consumption. This has a protective effect on the myocardium, particularly during hypoxia. A previous study revealed that Asp protects the heart (36). A decrease in the cardiac Asp levels in experimental rats suggests that the protective mechanism of the myocardia was affected in presence of elevated blood glucose. Glu provides energy to the brain tissue, and improves the maintenance of brain function (37). The levels of L-Glu in the hippocampal tissue of experimental rats diminished, suggesting that the energy metabolism of the brain was inhibited during hyperglycemia. In addition, a recent study revealed that the levels of plasma Glu also dropped significantly in people with type 1 diabetes (38). Taurine, a sulfurated amino acid derivative, alleviates hyperglycemia induced by STZ in type 1 diabetic mice, inhibits oxidative stress, and improves diabetes and its complications by upregulating glucose transporter (GLUT-2) expression (39). The reduction of taurine levels in the heart of STZ rats will lead to further studies on what role taurine plays.
Type 1 diabetes exhibits mild dyslipidemia (40), and vascular sclerosis (41). Changes in lipid metabolism have important effects on cell function, metabolism, inflammation and oxidative stress (42). Cardiovascular disease is the leading cause of morbidity and mortality in patients with type 1 diabetes (43). Free fatty acids (FFAs) have been concerned to replace glucose as the main energy source for the heart of patients with type 1 diabetes (44). FFAs are typically categorized as either saturated or unsaturated FFA. Unsaturated FFA are further separated into mono- and polyunsaturated FA (PUFA). Based on our analysis, relative to the control, no FFA alterations were detected in the serum of STZ-treated rats. However, the contents of PUFA arachidonic (ARA) and docosahexaenoic acids (DHA) were reduced in the heart, liver, kidney, cortex, renal lipid, hippocampus, and brown fat of STZ-treated rats. DHA is an omega-3 essential fatty acid, which is essential for brain structure and activity maintenance (45), and it is known to reduce the risk of heart disease (46). ARA is a PUFA that serves as a substrate for a range of bioactive compounds synthesis, such as, prostaglandins, thrombutane, and leukotrienes (47). Many brain disorders, such as, Alzheimer’s disease and bipolar disorder (48, 49), appear to be related to PUFA metabolic disorders. The levels of ARA and DHA were reduced in the target organs of diabetic rats. The lipotoxicity hypothesis is widely accepted (50), and it may be related to the involvement of saturated FA. In this study, the levels of palmitic, stearic(also known as octadecanoic acid or C18:0), arachidonic, myristic (also known as tetracanoic acid or C14:0), and pentacarboxylic in the heart, liver, cortex, kidney lipid, hippocampus, and brown adipose tissue of STZ-treated diabetic rats were markedly diminished, compared to controls. Other lipids 1-monoflavin-MG (0:0/18:2(9Z,12Z)/0:0) and glycerin monostearate MG (0:0/18:0/0:0) in the above target tissues were also reduced, relative to controls. The serum exhibited no abnormality of lipid metabolism. It is speculated that in the early stages of type 1 diabetes, each key target organ actively self-regulates to maintain a normal lipid metabolism in the blood. Alterations in these tissue metabolites occur earlier than the detectable alterations in the blood. Thus, the tissue metabolites hold great potential as candidate differential metabolites for predicting type 1 diabetes-related vascular complications.
The TCA or citric acid cycle (51), is a robust biological system of producing energy via sugar or other substances oxidization. It is the final metabolic network of the three nutrients (sugars, lipids and AAs), and the hub of metabolic interactions among sugars, lipids, AAs, nucleic acids, and energy metabolism. Type 1 diabetes is often associated with energy metabolism disorders. In this study, we also revealed that the serum Glu levels in STZ rats were elevated, the citric acid levels in the cortex and hippocampus were diminished, and the lactic acid content in the kidney was increased, compared to controls. This likely involved the pentose phosphate pathway and Ala-Asp-Glu metabolism. The aforementioned data suggested that, when insulin deficiency causes hyperglycemia, glucose decomposition and utilization become impaired, Ala is transformed into pyruvate and glutamic acid via joint deamination in the body, and pyruvate is acted upon by pyruvate dehydrogenase complex to generate acetyl coenzyme A, which enters the TCA cycle and generates ATP to energize the body.
Glu, Gly, and Cys combine to form GSH (52). GSH metabolism interacts with toxins or drugs to eliminate their toxic effects from the body, and being a strong reducing agent, GSH also participates in a variety of REDOX reactions in vivo. In STZ rats, we demonstrated diminished contents of Glu in the cortex, renal lipid, and hippocampus; Gly in the serum, heart, kidney, cortex, renal lipid, hippocampus; and cysteine in the kidney. The raw materials for GSH synthesis were thus reduced, therefore diminishing the antioxidant capacity of the body.
In addition, we also observed marked decreases in the levels of hypoxanthine (9h-Purin-6-ol), hypoxanthosine(inosine), and uracil in the heart, kidney, cortex, renal lipid, hippocampus, and brown adipocytes of STZ rats. These metabolites are strongly correlated with nucleotide synthesis and inflammation prevention. Thus, hypoxanthine, hypoxanthosine, and Ura are excellent candidates as indicators of early type 1 diabetes.
Among the limitations of our research are the following: we only employed a singular metabolomics platform, GC-MS. To better understand type 1 diabetes pathogenesis, additional investigations, based on a combination of metabolomics, proteomics, and transcriptomics, are required to validate our findings. In addition, it is critical to elucidate the effect of STZ on other tissues, such as, lungs, spleen, stomach, pancreas, skin, bladder, and nerves, to fully understand the mechanisms of STZ-induced diabetes.
Using GC-MS analysis, we extensively evaluated the metabolic alterations occurring within STZ-treated type 1 diabetic rat serum, heart, liver, kidney, cortex, renal lipid, hippocampus, and brown fat. We observed marked alterations related to the AAs, sugars, lipids, and energy metabolism in the STZ-treated rats versus controls. Overall, our data provided the first systematic analysis of STZ-induced type 1 diabetes, which may aid in the enhanced comprehension of STZ-induced type 1 diabetes and related complications pathogenesis. Type 1 diabetes has multifactorial etiology, and it demands further investigations based on the metabolic examinations in humans, animals, and cells.
The original contributions presented in the study are included in the article/supplementary material. Further inquiries can be directed to the corresponding authors.
The animal study was reviewed and approved by the Ethics Committeee of Jining First People’s Hospital (No. JNRM-2022-DW-011, Jining, China).
All authors listed have made a substantial, direct and intellectual contribution to the work, and approved it for publication.
This work was supported by the National Natural Science Foundation of China (82272253, 81602846), Natural Science Foundation of Shandong Province (ZR2021MH145, ZR2020MH37); Taishan Scholar Project of Shandong Province (tsqn201812159); China International Medical Foundation(No. Z-2018-35-2002); Traditional Chinese Medicine Science and Technology Development Plan of Shandong Province (M-2022066); Bethune Charitable Foundation (B-19-H-20200622).
Thanks for Jiang Pei, Director of Translational Pharmacy Laboratory, Jining First People’s Hospital for his guidance and support in this study.
The authors declare that the research was conducted in the absence of any commercial or financial relationships that could be construed as a potential conflict of interest.
All claims expressed in this article are solely those of the authors and do not necessarily represent those of their affiliated organizations, or those of the publisher, the editors and the reviewers. Any product that may be evaluated in this article, or claim that may be made by its manufacturer, is not guaranteed or endorsed by the publisher.
1. Syed FZ. Type 1 diabetes mellitus. Ann Intern Med (2022) 175(3):ITC33–48. doi: 10.7326/AITC202203150
2. Gregory GA, Robinson TIG, Linklater SE, Wang F, Colagiuri S, de Beaufort C, et al. Global incidence, prevalence, and mortality of type 1 diabetes in 2021 with projection to 2040: a modelling study. Lancet Diabetes Endocrinol (2022) 10(10):741–60. doi: 10.1016/S2213-8587(22)00218-2
3. Vanderniet JA, Jenkins AJ, Donaghue KC. Epidemiology of type 1 diabetes. Curr Cardiol Rep (2022) 24(10):1455–65. doi: 10.1007/s11886-022-01762-w
4. Guo SJ, Shao H. Growing global burden of type 1 diabetes needs multitiered precision public health interventions. Lancet Diabetes Endocrinol (2022) 10(10):688–9. doi: 10.1016/S2213-8587(22)00257-1
5. Floegel A, Stefan N, Yu Z, Mühlenbruch K, Drogan D, Joost HG, et al. Identification of serum metabolites associated with risk of type 2 diabetes usinga targeted metabolomic approach. Diabetes (2013) 62(2):639–48. doi: 10.2337/db12-0495
6. Kell DB, Oliver SG. The metabolome 18 years on: a concept comes of age. Metabolomics (2016) 12(9):148. doi: 10.1007/s11306-016-1108-4
7. Sas KM, Karnovsky A, Michailidis G, Pennathur S. Metabolomics and diabetes: Analytical and computational approaches. Diabetes (2015) 64(3):718–32. doi: 10.2337/db14-0509
8. Li W, Yao M, Wang R, Shi Y, Hou L, Hou Z, et al. Profile of cardiac lipid metabolism in STZ-induced diabetic mice. Lipids Health Disease (2018) 17:231. doi: 10.1186/s12944-018-0872-8
9. Chen M, Zheng H, Xu M, Zhao L, Zhang Q, Song J, et al. Changes in hepatic metabolic profile during the evolution of STZ-induced diabetic rats via an 1HNMR-based metabonomic investigation. Biosci Rep (2019) 39(4):BSR20181379. doi: 10.1042/BSR20181379
10. Wu T, Qiao S, Shi C, Wang S, Ji G. Metabolomics window into diabetic complications. J Diabetes Invest (2018) 9:244–55. doi: 10.1111/jdi.12723
11. Zhou Y, Lian S, Zhang J, Lin D, Huang C, Liu L, et al. Mitochondrial perturbation contributing to cognitive decline in streptozotocin induced type 1 diabetic rats. Cell Physiol Biochem (2018) 46:1668–82. doi: 10.1159/000489243
12. Adebayo AA, Oboh G, Ademosun AO. Almond-supplemented diet improves sexual functions beyond phosphodiesterase-5 inhibition in diabetic male rats. Heliyon (2019) 5(12):e03035. doi: 10.1016/j.heliyon.2019.e03035
13. Rebolledo-Solleiro D, Araiza LFO, Broccoli L, Hansson AC, Rocha-Arrieta LL, Aguilar-Roblero R, et al. Dopamine D1 receptor activity is involved in the increased anxiety levels observed in STZ-induced diabetes in rats. Behav Brain Res (2016) 313:293–301. doi: 10.1016/j.bbr.2016.06.060
14. Rogol AD, Laffel LM, Bode B, Sperling MA. Celebration of a century of insulin therapy in children with type 1 diabetes. Arch Dis Child (2023) 108(1):3–10. doi: 10.1136/archdischild-2022-323975
15. Chen S, Du K, Zou C. Current progress in stem cell therapy for type 1 diabetes mellitus. Stem Cell Res Ther (2020) 11(1):275. doi: 10.1186/s13287-020-01793-6
16. Guasch-Ferré M, Hruby A, Toledo E, Clish CB, Martínez-González MA, Salas-Salvadó J, et al. Metabolomics in prediabetes and diabetes: A systematic review and meta-analysis. Diabetes Care (2016) 39(5):833–46. doi: 10.2337/dc15-2251
17. Hu FB, Satija A, Manson JE. Curbing the diabetes pandemic: The need for global policy solutions. JAMA (2015) 313(23):2319–20. doi: 10.1001/jama.2015.5287
18. Yang DK, Kang H-S. Anti-diabetic effect of cotreatment with quercetin and resveratrol in streptozotocin-induced diabetic rats. Biomolecules Ther (2018) 26(2):130–8. doi: 10.4062/biomolther.2017.254
19. Magalhães DADE, Kume WT, Correia FS, Queiroz TS, Neto EWA, Santos MPD, et al. High-fat diet and streptozotocin in the induction of type 2 diabetes mellitus: a new proposal. Biol Sci • An Acad Bras Ciênc (2019) 91(1):e20180314. doi: 10.1590/0001-3765201920180314
20. Roberts LD, Koulman A, Griffin JL. Towards metabolic biomarkers of insulin resistance and type 2 diabetes: Progress from the metabolome. Lancet Diabetes Endocrinol (2014) 2(1):65–75. doi: 10.1016/S2213-8587(13)70143-8
21. Erendor F, Eksi YE, Sahin EO, Balci MK, Griffith TS, Sanlioglu S. Lentivirus mediated pancreatic beta-Cell-Specific insulin gene therapy for STZ-induced diabetes. Mol Ther (2021) 29(1):149–61. doi: 10.1016/j.ymthe.2020.10.025
22. Machha A, Achike FI, Mustafa AM, Mustafa MR. Quercetin, a ffavonoid antioxidant, modulates endothelium-derived nitric oxide bioavailability in diabetic rat aortas. Nitric Oxide (2007) 16(4):442–7. doi: 10.1016/j.niox.2007.04.001
23. Gupta D, Raju J, Prakash J, Baquer NZ. Change in the lipid profile, lipogenic and related enzymes in the livers of experimental diabetic rats: effect of insulin and vanadate. Diabetes Res Clin Practice. (1999) 46(1):1–7. doi: 10.1016/s0168-8227(99)00067-4
24. Ramesh B, Pugalendi KV. Antihyperglycemic effect of umbelliferone in streptozotocin-diabetic rats. J Medicinal Food (2006) 9(4):562–6. doi: 10.1089/jmf.2006.9.562
25. Würtz P, Mäkinen VP, Soininen P, Kangas AJ, Tukiainen T, Kettunen J, et al. Metabolic signatures of insulin resistance in 7,098 young adults. Diabetes (2012) 61(6):1372–80. doi: 10.2337/db11-1355
26. Yoon MS. The emerging role of branched-chain amino acids in insulin resistance and metabolism. Nutrients (2016) 8(7):405–17. doi: 10.3390/nu8070405
27. Gaggini M, Carli F, Rosso C, Buzzigoli E, Marietti M, Latta VD, et al. Altered amino acid concentrations in NAFLD: Impact of obesity and insulin resistance. Hepatology (2018) 67(1):145–58. doi: 10.1002/hep.29465
28. Jang C, Oh SF, Wada S, Rowe GC, Liu L, Chan MC, et al. A branched-chain amino acid metabolite drives vascular fatty acid transport and causes insulin resistance. Nat Med (2016) 22(4):421–6. doi: 10.1038/nm.4057
29. Wang TJ, Larson MG, Vasan RS, Cheng S, Rhee EP, McCabe E, et al. Metabolite profiles and the risk of developing diabetes. Nat Med (2011) 17(4):448–53. doi: 10.1038/nm.2307
30. Karusheva Y, Strassburger K, Markgraf DF, Zaharia OP, Bódis K, Kössler T, et al. Branched-chain amino acids associate negatively with postprandial insulin secretion in recent-onset diabetes. J Endocr Soc (2021) 5(6):bvab 067. doi: 10.1210/jendso/bvab067
31. Holeček M. Branched-chain amino acids in health and disease: metabolism, alterations in blood plasma, and as supplements. Nutr Metab (Lond) (2018) 15:33. doi: 10.1186/s12986-018-0271-1
32. Würtz P, Tiainen M, Mäkinen VP, Kangas AJ, Soininen P, Saltevo J, et al. Circulating metabolite predictors of glycemiain middle-aged men and women. Diabetes Care (2012) 35(8):1749–56. doi: 10.2337/dc11-1838
33. Hatting M, Tavares CDJ, Sharabi K, Rines AK, Puigserver P. Insulin regulation of gluconeogenesis. Ann N Y Acad Sci (2018) 1411(1):21–35. doi: 10.1111/nyas.13435
34. Bi X, Henry CJ. Plasma-free amino acid profiles are predictors of cancer and diabetes development. Nutr Diabetes (2017) 7(3):e249. doi: 10.1038/nutd.2016.55
35. Zhang P, Li T, Wu X, Nice EC, Huang C, Zhang Y. Oxidative stress and diabetes: Antioxidative strategies. Front Med (2020) 14(5):583–600. doi: 10.1007/s11684-019-0729-1
36. Ritterhoff J, Young S, Villet O, Shao D, Neto FC, Bettcher LF, et al. Metabolic remodeling promotes cardiac hypertrophy by directing glucose to aspartate biosynthesis. Circ Res (2020) 17,126(2):182–96. doi: 10.1161/CIRCRESAHA.119.315483
37. Zhou Y, Danbolt NC. Glutamate as a neurotransmitter in the healthy brain. J Neural Transm (Vienna) (2014) 121(8):799–817. doi: 10.1007/s00702-014-1180-8
38. Kawamori D, Kageyama Y, Tanaka T, Ishizaka Y, Hosoe S, Katakami N, et al. Characteristic changes in plasma glutamate levels and free amino acid profiles in Japanese patients with type 1 diabetes mellitus. J Diabetes Investig (2023) 14(1):111–21. doi: 10.1111/jdi.13911
39. Murakami S, Funahashi K, Tamagawa N, Ning M, Ito T. Taurine ameliorates streptozotocin-induced diabetes by modulating hepatic glucose metabolism and oxidative stress in mice. Metabolites (2022) 12(6):524. doi: 10.3390/metabo12060524
40. Afshinnia F, Rajendiran TM, He C, Byun J, Montemayor D, Darshi M, et al. Circulating free fatty acid and phospholipid signature predicts early rapid kidney function decline in patients with type 1 diabetes. Diabetes Care (2021) 44(9):2098–106. doi: 10.2337/dc21-0737
41. Haas AV, McDonnell ME. Pathogenesis of cardiovascular disease in diabetes. Endocrinol Metab Clin North Am (2018) 47(1):51–63. doi: 10.1016/j.ecl.2017.10.010
42. Sobczak AIS, Pitt SJ, Smith TK, Ajjan RA, Stewart AJ. Lipidomic profiling of plasma free fatty acids in type-1 diabetes highlights specific changes in lipid metabolism. Biochim Biophys Acta Mol Cell Biol Lipids (2021) 1866(1):158823. doi: 10.1016/j.bbalip.2020.158823
43. Cree-Green M, Stuppy JJ, Thurston J, Bergman BC, Coe GV, Baumgartner AD, et al. Youth with type 1 diabetes have adipose, hepatic, and peripheral insulin resistance. J Clin Endocrinol Metab (2018) 103(10):3647–57. doi: 10.1210/jc.2018-00433
44. Ritchie RH, Zerenturk EJ, Prakoso D, Calkin AC. Lipid metabolism and its implications for type 1 diabetes-associated cardiomyopathy. J Mol Endocrinol (2017) 58:R225–40. doi: 10.1530/JME-16-0249
45. von Schacky C. Importance of EPA and DHA blood levels in brain structure and function. Nutrients (2021) 13(4):1074. doi: 10.3390/nu13041074
46. Abdelhamid AS, Brown TJ, Brainard JS, Biswas P, Thorpe GC, Moore HJ, et al. Omega-3 fatty acids for the primary and secondary prevention of cardiovascular disease. Cochrane Database Systematic Rev (2018) 7(7):CD003177. doi: 10.1002/14651858.CD003177
47. Martin SA, Brash AR, Murphy RC. The discovery and early structural studies of arachidonic acid. J Lipid Res (2016) 57(7):1126–32. doi: 10.1194/jlr.R068072
48. Sanchez-Mejia RO, Mucke L. Phospholipase A2 and arachidonic acid in alzheimer's disease. Biochim Biophys Acta (2010) 1801(8):784–90. doi: 10.1016/j.bbalip.2010.05.013
49. Bavaresco DV, Uggioni MLR, Simon CS, Colonetti T, Ferraz SD, Cruz MVB, et al. Evaluation of the arachidonic acid pathway in bipolar disorder: a systematic review. Mol Biol Rep (2020) 47(10):8209–17. doi: 10.1007/s11033-020-05785-w
50. Briaud I, Harmon JS, Kelpe CL, Segu VB, Poitout V. Lipotoxicity of the pancreatic beta-cell is associated with glucose-dependent esterification of fatty acids into neutral lipids. Diabetes (2001) 50(2):315–21. doi: 10.2337/diabetes
51. Alabduladhem TO, Bordoni B. Physiology, Krebs cycle. In: StatPearls [Internet]. Treasure Island (FL): StatPearls Publishing LLC (2022).
Keywords: streptozotocin (STZ), diabetes, gas chromatography mass spectrometry (GC-MS), metabolites, metabolomics
Citation: Si Q, Guo J, Yang X, Guo Y, Wu L, Xie D and Jiang P (2023) Systematic assessment of streptozotocin-induced diabetic metabolic alterations in rats using metabolomics. Front. Endocrinol. 14:1107162. doi: 10.3389/fendo.2023.1107162
Received: 24 November 2022; Accepted: 09 January 2023;
Published: 24 January 2023.
Edited by:
Shusen Sun, Western New England University, United StatesReviewed by:
Shengyu Tan, Second Xiangya Hospital, Central South University, ChinaCopyright © 2023 Si, Guo, Yang, Guo, Wu, Xie and Jiang. This is an open-access article distributed under the terms of the Creative Commons Attribution License (CC BY). The use, distribution or reproduction in other forums is permitted, provided the original author(s) and the copyright owner(s) are credited and that the original publication in this journal is cited, in accordance with accepted academic practice. No use, distribution or reproduction is permitted which does not comply with these terms.
*Correspondence: Yujin Guo, Z3VveXVqaW45OUAxMjYuY29t; Pei Jiang, amlhbmdwZWljc3VAc2luYS5jb20=
†These authors have contributed equally to this work and share first authorship
Disclaimer: All claims expressed in this article are solely those of the authors and do not necessarily represent those of their affiliated organizations, or those of the publisher, the editors and the reviewers. Any product that may be evaluated in this article or claim that may be made by its manufacturer is not guaranteed or endorsed by the publisher.
Research integrity at Frontiers
Learn more about the work of our research integrity team to safeguard the quality of each article we publish.