 Wanyu Yang
 Chenye Jin2
 Yaxin Lai
 Jiashu Li
 Zhongyan Shan
- 1Department of Geriatric Medicine, The First Hospital of China Medical University, Shenyang, Liaoning, China
- 2Department of Rheumatology Immunology, The First Hospital of China Medical University, Shenyang, Liaoning, China
- 3Department of Endocrinology and Metabolism and The Institute of Endocrinology, National Health Commission (NHC) Key Laboratory of Diagnosis and Treatment of Thyroid Diseases, The First Hospital of China Medical University, Shenyang, Liaoning, China
Objective: To investigate the effect of simple subclinical hypothyroidism (SCH) and type 2 diabetes mellitus (T2DM) combined with SCH on insulin resistance.
Design and methods: A total of 622 people with newly diagnosed T2DM were selected as the study subjects, and 621 normoglycemic people were selected as control subjects. According to the diagnostic criteria of thyroid diseases, the subjects were divided into a normal thyroid function group and a subclinical hypothyroidism group. Both groups received a physical examination, and blood samples were collected. The measurement indexes included FPG, FINS, OGTT2hPG, OGTT2hINS, HbA1c, TC, TG, HDL-C, LDL-C, TSH, FT3 and FT4. HOMA-IR, HOMA-β, and TFQI (thyroid feedback quantile index) were calculated.
Results: There was no significant difference in age or sex distribution between the T2DM group and the normoglycemic group (P>0.05). The prevalence of thyroid dysfunction in the T2DM group was significantly higher than that in the normoglycemic group (16.39% vs. 11.27%, P<0.05), and among the different types of thyroid dysfunction, the prevalence of SCH was the highest at 14.95% (P<0.05). There was no significant difference in BMI, waist-hip ratio, blood lipid profile, HOMA-β, and HOMA-IR values between the T2DM with subclinical hypothyroidism group (T2DM+SCH+ group) and the normal thyroid function group (T2DM+SCH- group) (P>0.05). The BMI, waist-hip ratio and HOMA-IR values of the normoglycemic group with subclinical hypothyroidism (T2DM-SCH+ group) were significantly higher than those of the normoglycemic group with normal thyroid function (T2DM-SCH- group) (P<0.05), and there were no significant differences between the T2DM+SCH- and T2DM+SCH+ groups (P>0.05). HOMA-β values were significantly higher in the T2DM-SCH+ group than in the T2DM-SCH-, T2DM+SCH- and T2DM+SCH+ groups (P<0.05). As the TFQI value increased, the body weight, waist-hip ratio, diastolic blood pressure, FPG, OGTT2hPG and HbA1c values gradually increased in the T2DM group and normoglycemic group (P<0.05). HDL-C, FINS, OGTT2hINS and HOMA-β values gradually decreased (P<0.05).
Conclusion: Subclinical hypothyroidism only increases insulin resistance in normoglycemic people. As the sensitivity of the central thyroid decreases, the risk of developing diabetes increases.
1 Introduction
At present, the incidence of diabetes mellitus (DM) is rapidly increasing worldwide. Diabetes has become an important public health problem worldwide. According to the latest epidemiological survey in China, the prevalence of diabetes is 12.8%, and the number of people aged 18 years and above with diabetes has reached 129.8 million (70.4 million males and 59.4 million females) (1). Type 2 diabetes mellitus (T2DM) is a complex condition that results from interactions between genetic factors and the environment. Insulin resistance and insulin secretion decline are the core features of T2DM.
Diabetes and thyroid disease are two of the most common types of endocrine metabolic diseases. A large amount of data shows a strong relationship between diabetes and thyroid disease. The proportion of patients with T2DM with thyroid disease is significantly higher than that of healthy people (2–4), and subclinical hypothyroidism (SCH) accounts for the largest proportion of these cases (5, 6). SCH is a pathological condition in which the levels of thyroid stimulating hormone (TSH) in the blood are increased and the levels of thyroid hormones (FT3 and FT4) are in the normal range. The thyroid feedback quantile index (TFQI) is a newly calculated thyroid hormone central sensitivity index and quantifies the deviation of the pituitary response to thyroid hormone in a continuous manner (7). The TFQI converts the probability distributions of TSH and FT4 into a probability quantile between 0 and 1 through the principle of the empirical cumulative distribution function. After calculating the formula, the TFQI values range from -1 to 1. The advantage of this index is that it does not produce extreme values in the case of thyroid dysfunction and is relatively stable.
SCH can affect lipid metabolism, insulin sensitivity and other aspects and cause a series of metabolic disorders. A study by Eirini Maratou found that SCH patients had an increased insulin resistance index and a decreased insulin sensitivity index compared with those of individuals with normal thyroid function (8). Another case-control study similarly suggested the same results.Compared to the control group.Homeostatic model assessment of insulin resistance (HOM-IR) significantly elevated in patients with SCH (9).However, other studies have found that SCH is not associated with the insulin resistance index (10). Therefore, the correlation between SCH and insulin resistance needs to be further explored. Clarifying the relationship between SCH and insulin resistance will lead to a better understanding of the pathogenesis and treatment of thyroid disease and diabetes, therefor we designed the current clear and simple clinical study with sufficient sample size to investigate the mentioned correlations properly.The aim of this study was to investigate the effects of SCH alone and T2DM combined with SCH on insulin resistance.
2 Materials and methods
2.1 Study population
The case group included 622 patients who were newly diagnosed with T2DM according to 1999 WHO criteria and attended the outpatient clinic of the Department of Endocrinology and Metabolic Diseases, the First Affiliated Hospital of China Medical University between December 2018 to December 2019. These patients had a course of disease of less than 12 months, did not use hypoglycemic drugs, or had a history of medication of less than 1 month, and they did not use drugs in the 3 months before enrollment. These patients also had a glycosylated hemoglobin (HbA1c) level between 7% and 10% and a fasting plasma glucose (FPG) level < 11.1 mmol/L. There were 621 people in the normoglycemic group from the community epidemiological survey population in Shenyang, Liaoning, China, during the same time period. For both groups, the exclusion criteria were as follows: severe heart, liver, and kidney diseases and obvious hematological diseases; pregnancy, expecting to become pregnant or breastfeeding; previous thyroid disease and use of drugs that affect thyroid function (including thyroid hormone supplementation and antithyroid medications); and the use of insulin for the treatment of diabetic ketoacidosis and hyperosmolar nonketotic coma. This study was approved by the ethics committee, and all subjects signed informed consent forms.
2.2 Data collection
Detailed information on medical history, medication history and other general conditions was collected. Both groups underwent physical examination and blood sampling. The physical examination included height (cm), weight (kg), waist circumference (cm), hip circumference (cm), and blood pressure (mm/hg) measurements. Fasting venous blood was collected, and fasting plasma glucose (FPG, 3.90-6.10 mmol/L), fasting insulin (FINS, 4.03-23.46 mIU/L), glycosylated hemoglobin (HbA1c, 3.90%-6.10%), total cholesterol (TC, 0.00-5.72 mmol/L), triglyceride (TG, 0.00-1.70 mmol/L), high-density lipoprotein cholesterol (HDL-C, 0.91-1.92 mmol/L), low-density lipoprotein cholesterol (LDL-C, 0.00-3.64 mmol/L), thyroid-stimulating hormone (TSH), free triiodothyronine (FT3), and free thyroxine (FT4) levels were measured. All participants underwent a 75 g oral glucose tolerance test to measure 2-hour intravenous plasma glucose (OGTT2hPG) and insulin (OGTT2hINS) levels. Homeostasis model assessment of insulin resistance (HOMA-IR), islet β function index (HOMA-β), thyroid feedback quantile index (TFQI, values range from -1 to 1), body mass index (BMI) and waist-hip ratio (WHR) were calculated. The relevant indexes were calculated as follows: BMI = weight/height2; WHR = waist/hip circumference; HOMA-IR = fasting plasma glucose*fasting insulin/22.5; HOMA-β = 20*fasting insulin/(fasting plasma glucose-3.5); TFQI = cdfFT4 - (1- cdfTSH).
2.3 Laboratory measurements
TSH, FT3, and FT4 levels were measured by an electrochemiluminescence immunoassay (Cobas Elesys601, Roche Diagnostics, Switzerland). Plasma glucose levels were measured by the hexokinase endpoint method (Olympus, Japan), and glycosylated hemoglobin levels were measured by Bio-Rad reagent (Bio-Rad, USA). Serum insulin levels were determined by the chemiluminescence method using a Maglumi2000 automatic luminescence immunoanalyzer (Shenzhen New Industry Kit, China), and serum lipid levels (TC, TG, HDL-C, and LDL-C) were determined by Mindray (BS-180) reagent (Mindray, China).
2.4 Diagnostic criteria
Subclinical hypothyroidism: TSH>4.2 mIU/L, FT4 normal (12-22 pmol/L). Subclinical hyperthyroidism: TSH<0.27 mIU/L, FT4 normal, FT3 normal (3.1-6.8 pmol/L). Clinical hypothyroidism: TSH>4.2 mIU/L, FT4<12 pmol/L. Clinical hyperthyroidism: TSH<0.27 mIU/L, FT4>22 pmol/L and/or FT3>6.8 pmol/L.
2.5 Study population grouping
According to the diagnostic criteria of T2DM and thyroid diseases, the subjects were divided into a normoglycemic thyroid function group (T2DM-SCH- group), normoglycemic subclinical hypothyroidism group (T2DM-SCH+ group), T2DM euthyroidism group (T2DM+SCH- group), and subclinical hypothyroidism group (T2DM+SCH+ group) for people with T2DM.
2.6 Statistical analyses
The PASS software was used to calculate the statistical power and determine the sample size (11) (Figure 1).All data were entered into an Excel spreadsheet and used for statistical analysis using SPSS 19.0 software. The measurement data conforming to a normal distribution are expressed as the “mean ± standard deviation”. The independent sample T test was used for comparisons between two groups, and ANOVA was used for comparisons among more than two groups. The nonnormally distributed measurements are expressed as medians (interquartile ranges), and the Mann−Whitney test was used for comparisons between groups. The count data are expressed as quantities and percentages. The comparison of count data rates and composition ratios was performed by chi-square analysis, and correlation and multiple linear regression analysis were applied for correlation analysis. P<0.05 indicated that a difference was statistically significant.
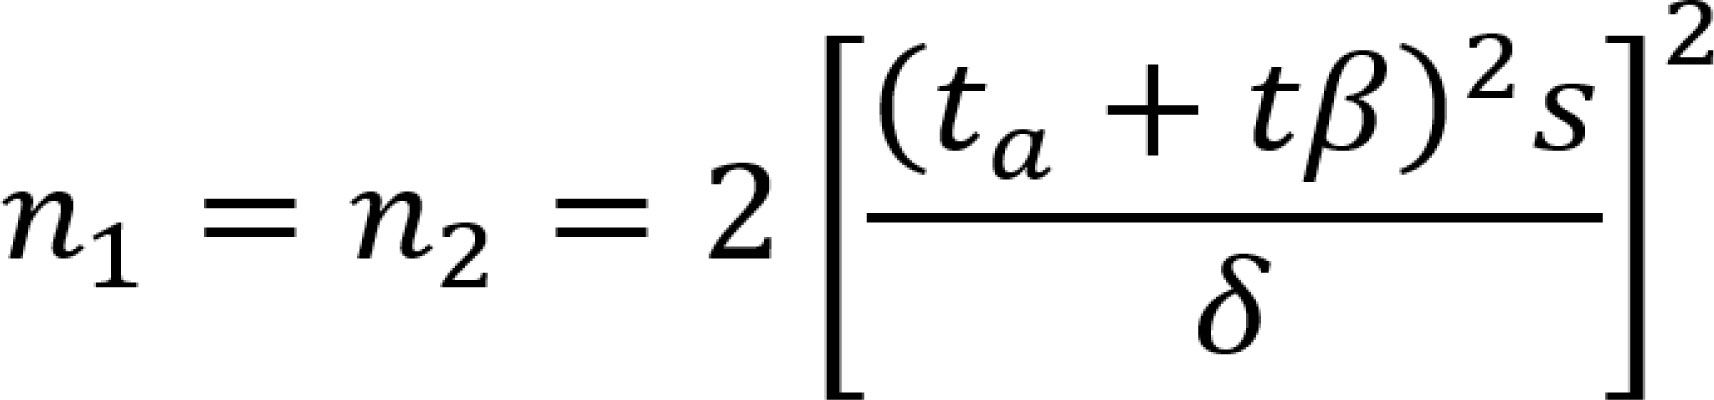
Figure 1 Sample size calculation formula.
3 Results
3.1 Comparison of general data between the normoglycemic group and the type 2 diabetes mellitus group
The demographic, anthropometric and biochemical parameters were compared between the normoglycemic (N=621) and T2DM individuals (N=622). As shown in Table 1, there were no significant differences in age, sex composition or blood pressure between the two groups (P>0.05). BMI, WC, HC, WHR, TC, TG, FPG, OGTT2hPG, HbA1c, HOMA-IR and TFQI values in the T2DM group were significantly higher than those in the normoglycemic group (P<0.05). HDL-C, FINS, OGTT2hINS and HOMA-β values in the T2DM group were significantly lower than those in the normoglycemic group (P<0.05).
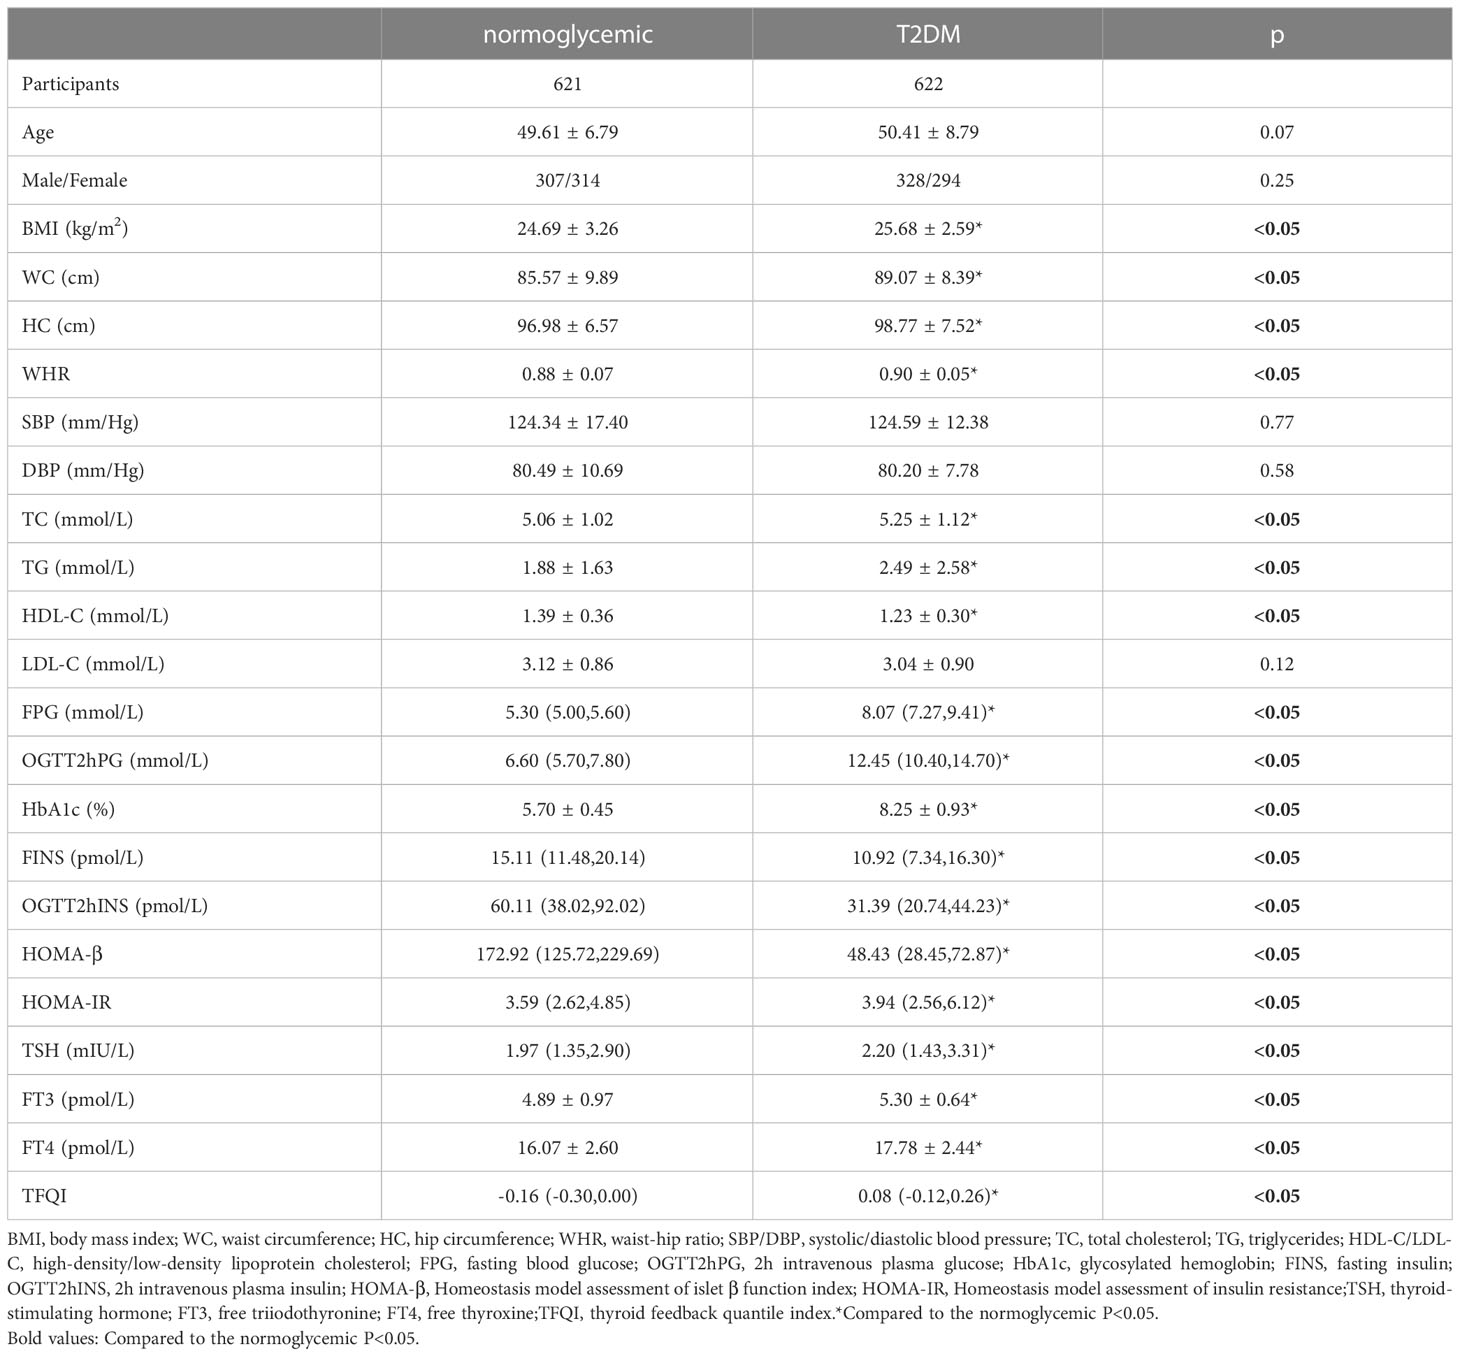
Table 1 Comparison of general data between the normoglycemic group and T2DM group.
3.2 Prevalence of thyroid disease in the normoglycemic and T2DM groups
The levels of thyroid function indicators and thyroid dysfunction prevalence were compared between the groups with or without T2DM. As shown in Table 2, the prevalence of thyroid dysfunction in the T2DM group was significantly higher than that in the normoglycemic group (16.39% vs. 11.27%, P<0.05), and among the different types of thyroid dysfunction, the prevalence of SCH was the highest at 14.95% (P<0.05).

Table 2 Prevalence of thyroid disease in the normoglycemic and T2DM group.
3.3 Comparison of general, anthropometric and biochemical characteristics in subjects with different TFQI values
As the TFQI value increased, the BMI, WC, HC, WHR, DBP, FPG, OGTT2hPG and HbA1c values of the two groups gradually increased (P<0.05). HDL-C, FINS, OGTT2hINS and HOMA-β values gradually decreased (P<0.05) (Table 3).
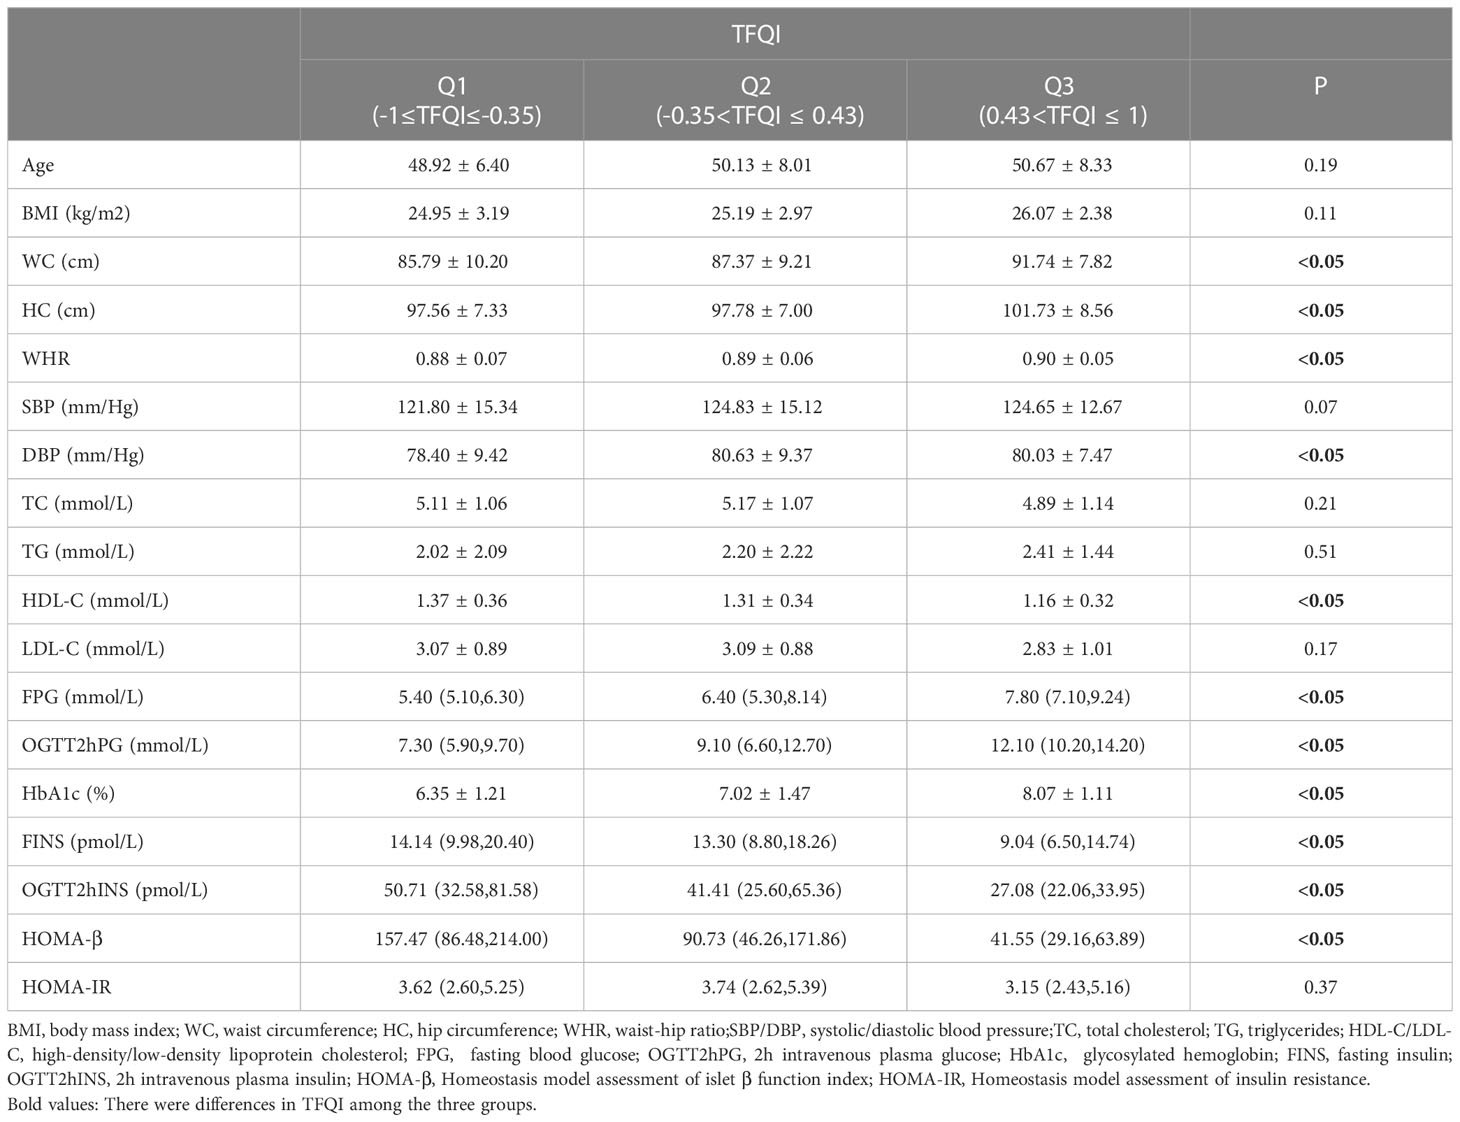
Table 3 Comparison of data in subjects with different TFQI values.
3.4 Comparison of insulin resistance in subjects with or without SCH
There were no significant differences in BMI, WC, HC, WHR, TC, TG, LDL-C, HDL-C, FINS, OGTT2hINS, HOMA-β, or HOMA-IR values between the T2DM+SCH+ group and the T2DM+SCH- group (P>0.05) (Table 4), suggesting that SCH did not increase insulin resistance in newly diagnosed T2DM patients.

Table 4 Comparison of insulin resistance in subjects with or without SCH.
The BMI, WC, WHR and HOMA-IR values in the T2DM-SCH+ group were significantly higher than those in the T2DM-SCH- group (P<0.05), but no significant difference was found between the T2DM+SCH- group and the T2DM+SCH+ group (P>0.05). These findings suggest that T2DM-SCH+ group have insulin resistance similar to those in T2DM.
The FINS, OGTT2hINS and HOMA-β values in the T2DM-SCH+ group were significantly higher than those in the T2DM-SCH-, T2DM+SCH- and T2DM+SCH+ groups (P<0.05). These findings suggest that subclinical hypothyroidism insulin compensates for the increase in normal blood glucose levels.
3.5 Multiple regression analysis of HOMA-IR in euthyroid and SCH groups within normoglycemic subjects
In the case of normal blood glucose levels, multiple regression analysis of HOMA-IR in the euthyroid and SCH groups showed that BMI, TSH and HbA1c were risk factors for increased HOMA-IR (Figure 2).
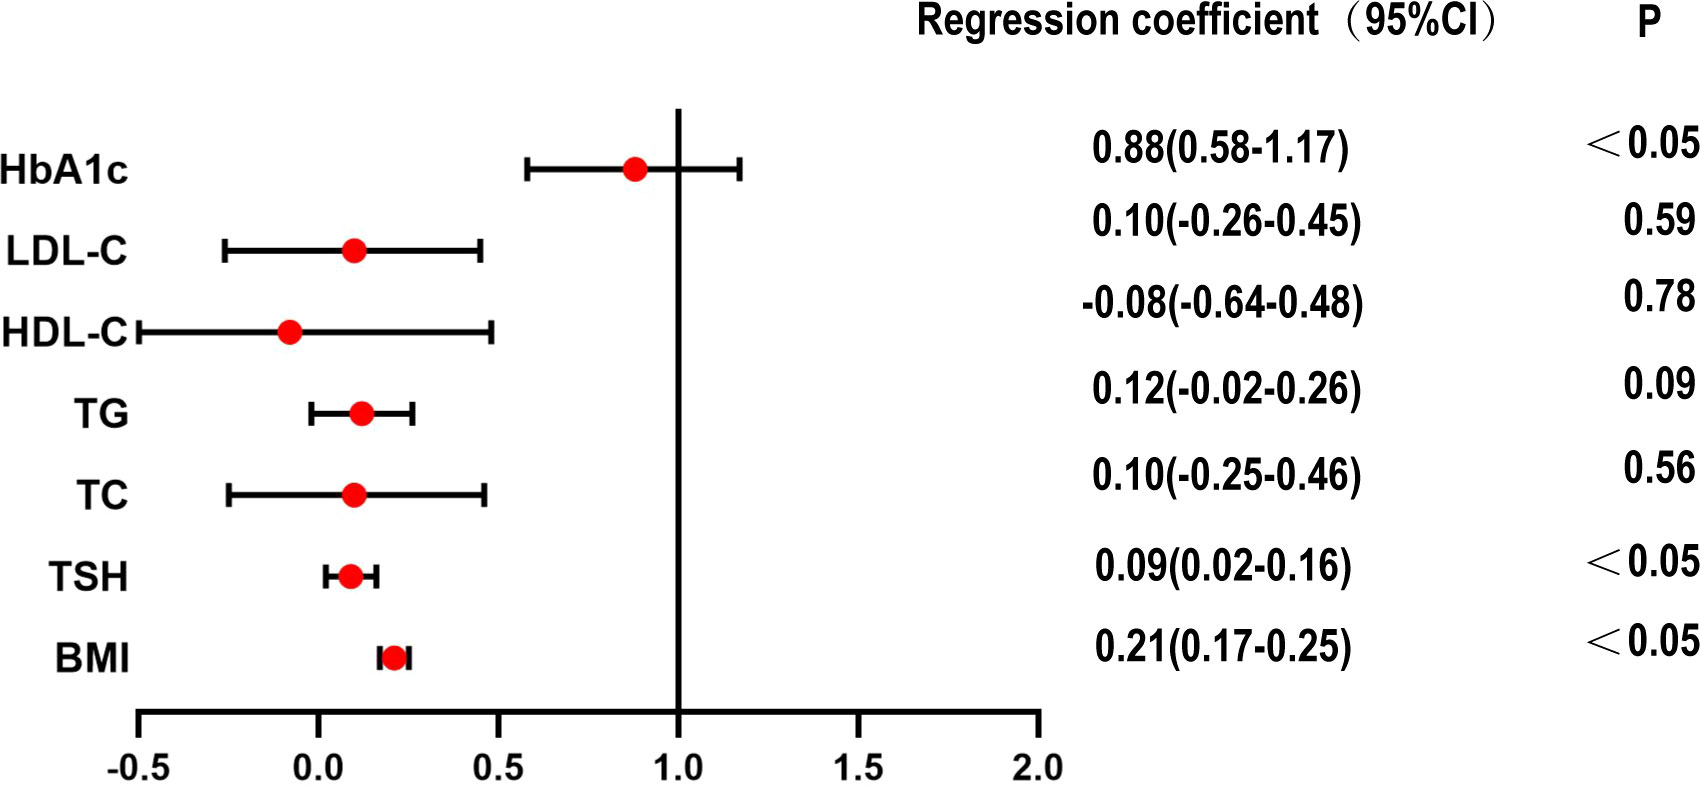
Figure 2 Multiple regression analysis of HOMA-IR in euthyroid and SCH group within normoglycemic subjects.
Correlation analysis of the euthyroid subgroup and subclinical hypothyroidism subgroup in the T2DM group showed that there was no obvious correlation between TSH and HOMA-IR.
4 Discussion
This cross-sectional study of a Chinese population with normoglycemia and T2DM found that the prevalence of thyroid dysfunction in the T2DM group was significantly higher than that in the control group, and the prevalence of SCH was the highest among different types of thyroid dysfunction. SCH only increased insulin resistance in the normoglycemic population but did not increase insulin resistance in the population with T2DM. In this population, a decrease in central thyroid sensitivity increases the risk of developing diabetes.
T2DM is a metabolic disorder syndrome characterized by insulin resistance and/or insufficient secretion of islet β cells, and there are many factors involved in its occurrence and development. Studies have found (12, 13) that the occurrence of diabetes is also accompanied by the occurrence of other diseases, such as hypertension, obesity, thyroid disease and sleep apnea syndrome, and diabetes combined with thyroid disease has attracted increasing attention from many scholars in recent years. Numerous studies suggest a significantly increased prevalence of thyroid disease in people with diabetes compared with healthy people (2, 3). The results of this paper suggest that the prevalence of thyroid disease is significantly higher in the population with diabetes than in the population without diabetes (16.39% vs. 11.27%). Among this population, subclinical hypothyroidism was the most common form of thyroid disease, with a prevalence of 14.95%. This finding is consistent with that from previous studies (5, 6, 14). Leptin is an important neuroendocrine regulator of the hypothalamic-pituitary-thyroid (HPT) axis. It not only directly regulates the expression of the paraventricular nucleotropin-releasing hormone (TRH) gene but also indirectly regulates TRH by influencing the arcuate nucleus (ARC) (15–17). Many patients with diabetes have high levels of leptin (18–20), which may stimulate TSH synthesis by influencing the hypothalamic-pituitary-thyroid (HPT) axis through (JAK)-2/signal transduction and transcriptional activation (STAT)3 (15). In addition, hyperinsulinemia is common in people with T2DM, and insulin also affects the release of TRH and TSH (21, 22).
One report suggested that the risk of T2DM is positively associated with TSH levels and negatively associated with T3 and FT4 levels (23). A normal reduction in FT4 levels is associated with hyperglycemia and insulin resistance (24). However, other studies have shown that the FT4 level is positively correlated with the incidence of T2DM (25) and fasting blood glucose levels (26). Laclaustra and colleagues was the first to use the TFQI index to assess diabetes and diabetes-related mortality (7). The findings suggested that TSH or FT4 levels alone cannot explain the association between thyroid dysfunction and abnormal blood glucose. In our study, the central sensitivity index of thyroid hormone was used to evaluate the relationship between blood glucose and thyroid hormone. The results indicated that the decrease in thyroid hormone sensitivity was related to the increase in FPG, OGTT2hPG and HbA1c values and the decrease in HDL-C, FINS, OGTT2hINS and HOMA-β values.
In this study, insulin resistance was higher in the T2DM-SCH+ group than in the T2DM-SCH- group. There was no significant difference between the T2DM group and the T2DM-SCH+ group, in addition the T2DM-SCH+ group was accompanied by hyperinsulinemia. Similar to previous studies, the insulin resistance index was increased in patients with subclinical hypothyroidism compared with those with normal thyroid function (8, 27). Linear analysis of normal thyroid function showed that TSH was positively correlated with insulin resistance (28, 29). Velija-Asimi et al. (30) found that fasting insulin levels were significantly higher in the subclinical hypothyroid group than in the normal thyroid group, suggesting that fasting hyperinsulinemia may be an early manifestation of glucose metabolism disorder. A similar meta-analysis suggested a J-shaped relationship between T2DM and TSH. In the normal population, the risk of T2DM increased by 11% for every 1 mIU/L increase in TSH (3). The relationship between subclinical hypothyroidism and insulin resistance was demonstrated. However, the causal relationship between the two has not been fully proven, and the “common root” may be used as the reason for the explanation. Leptin is an important endogenous fat cell-derived protein that is involved in controlling food intake through its effect on the hypothalamus, leading to appetite suppression. Obesity is characterized by hyperleptinemia due to the development of leptin resistance (20). Obesity and elevated leptin levels are associated with insulin resistance and type 2 diabetes (31). As mentioned earlier, leptin can directly or indirectly regulate TRH, and leptin can also stimulate TSH synthesis. Additionally, TSH can also bind to the TSH receptor of preadipocytes, induce preadipocyte differentiation and adipocyte formation, promote obesity and lead to insulin resistance (32). Studies have shown that the level of hypersensitive C-reactive protein in subclinical hypothyroidism was significantly higher than that in the normal thyroid function group (33, 34), and hypersensitive C-reactive protein was significantly decreased after treatment with L-thyroxine (30). Subclinical hypothyroidism may lead to an increase in inflammatory cytokine release. This mediates the occurrence of inflammatory reactions, thus causing hyperinsulinemia and insulin resistance. The results of this study indicated that the BMI, waist circumference, waist-to-hip ratio and insulin resistance of the T2DM-SCH+ group were the same as those of the T2DM group, suggesting that elevation of TSH has a similar effect on insulin resistance in the presence or absence of T2DM. The increase in TSH levels may be caused by the adipocyte, leptin, inflammatory response and other pathways (15, 32, 33). In addition, in the T2DM-SCH+ group, due to the existence of insulin resistance, insulin compensatory functions increase, and failure to compensate will lead to an increased risk of diabetes.
In this study, the insulin resistance of the subclinical hypothyroidism group and normal thyroid function group was compared in the T2DM population, and the results indicated that there was no significant difference in insulin resistance between the two groups. Most studies have explored the effect of simple subclinical hypothyroidism on insulin resistance, while there are fewer studies on insulin resistance in patients with T2DM and subclinical hypothyroidism. Kouidhi et al. have shown that TSH is associated with insulin resistance in people with obesity and/or T2DM. In the diabetic nonobese group, there was no correlation between TSH and any other study parameters (35). In this study, the BMI of the T2DM population was dominated by overweight rather than obesity, so comparing insulin resistance in the subclinical hypothyroid group with the normal thyroid function group in the diabetic population did not suggest a clear difference. In another study of patients with type 1 diabetes, whether subclinical hypothyroidism is combined with type 1 diabetes had no significant effect on the difference in HbA1c and total insulin requirement in patients with diabetes (36). T2DM is a multi-factorial metabolic disorder with more grave consequences as compared to subclinical hypothyroidism. Results obtained in the T2DM subjects of the current study were similar to that obtained by Kouidhi et al. in T1DM. Thus, in this study, the insulin resistance of the population with diabetes in the subclinical hypothyroidism group was the same as that in the normal thyroid function group, which may be due to the coexistence of T2DM. Insulin resistance was masked by the metabolic disorder of diabetes, and subclinical hypothyroidism had no effect on insulin resistance. However, the effect of subclinical hypothyroidism on insulin resistance was fully shown in the normal blood glucose population.
5 Conclusion
In summary, our study demonstrates that subclinical hypothyroidism increases insulin resistance in people with normal blood glucose levels and that decreased thyroid hormone sensitivity is associated with the risk of developing diabetes. These results may contribute to further understanding of the interaction between thyroid hormone and glucose metabolism, more helpful understanding of the pathogenesis and treatment of thyroid disease and diabetes.This study also has certain limitations. We did not measure other measures such as leptin, and assessing leptin levels would be more helpful in understanding the relationship between SCH and insulin resistance.
Data availability statement
The original contributions presented in the study are included in the article/supplementary material. Further inquiries can be directed to the corresponding author.
Author contributions
WY performed the experiment and draft the manuscript. CJ, HW, YL and JL participated in the data collection. ZS designed the study in the revised manuscript. All authors contributed to the article and approved the submitted version.
Funding
This study was funded by the Key Laboratory Project of Thyroid Diseases National Health Commission (2019PT330001),National natural science foundation of China (81970682).
Conflict of interest
The authors declare that the research was conducted in the absence of any commercial or financial relationships that could be construed as a potential conflict of interest.
The reviewer XS declared a shared affiliation with the authors to the handling editor at the time of review.
Publisher’s note
All claims expressed in this article are solely those of the authors and do not necessarily represent those of their affiliated organizations, or those of the publisher, the editors and the reviewers. Any product that may be evaluated in this article, or claim that may be made by its manufacturer, is not guaranteed or endorsed by the publisher.
References
1. Li Y, Teng D, Shi X, Qin G, Qin Y, Quan H, et al. Prevalence of diabetes recorded in mainland China using 2018 diagnostic criteria from the American diabetes association: national cross sectional study. BMJ (Clinical Res ed) (2020) 369:m997. doi: 10.1136/bmj.m997
2. Biondi B, Kahaly GJ, Robertson RP. Thyroid dysfunction and diabetes mellitus: two closely associated disorders. Endocrine Rev (2019) 40(3):789–824. doi: 10.1210/er.2018-00163
3. Rong F, Dai H, Wu Y, Li J, Liu G, Chen H, et al. Association between thyroid dysfunction and type 2 diabetes: a meta-analysis of prospective observational studies. BMC Med (2021) 19(1):257. doi: 10.1186/s12916-021-02121-2
4. Khan NZ, Muttalib MA, Sultana GS, Mishu FA, Nesa A. Study of thyroid disorders among type 2 diabetic patients attending a tertiary care hospital. Mymensingh Med J MMJ (2017) 26(4):874–8.
5. Palma CC, Pavesi M, Nogueira VG, Clemente EL, Vasconcellos Mde F, Pereira LCJ, et al. Prevalence of thyroid dysfunction in patients with diabetes mellitus. Diabetol Metab syndrome (2013) 5(1):58. doi: 10.1186/1758-5996-5-58
6. Elgazar EH, Esheba NE, Shalaby SA, Mohamed WF. Thyroid dysfunction prevalence and relation to glycemic control in patients with type 2 diabetes mellitus. Diabetes Metab syndrome (2019) 13(4):2513–7. doi: 10.1016/j.dsx.2019.07.020
7. Laclaustra M, Moreno-Franco B, Lou-Bonafonte JM, Mateo-Gallego R, Casasnovas JA, Guallar-Castillon P, et al. Impaired sensitivity to thyroid hormones is associated with diabetes and metabolic syndrome. Diabetes Care (2019) 42(2):303–10. doi: 10.2337/dc18-1410
8. Maratou E, Hadjidakis DJ, Kollias A, Tsegka K, Peppa M, Alevizaki M, et al. Studies of insulin resistance in patients with clinical and subclinical hypothyroidism. Eur J Endocrinol (2009) 160(5):785–90. doi: 10.1530/EJE-08-0797
9. Ebrahimpour A, Vaghari-Tabari M, Qujeq D, Moein S, Moazezi Z. Direct correlation between serum homocysteine level and insulin resistance index in patients with subclinical hypothyroidism: does subclinical hypothyroidism increase the risk of diabetes and cardio vascular disease together? Diabetes Metab syndrome (2018) 12(6):863–7. doi: 10.1016/j.dsx.2018.05.002
10. Stoica RA, Ancuceanu R, Costache A, Stefan SD, Stoian AP, Guja C, et al. Subclinical hypothyroidism has no association with insulin resistance indices in adult females: a case-control study. Exp Ther Med (2021) 22(3):1033. doi: 10.3892/etm.2021.10465
11. Fayers PM, Machin D. Sample size: how many patients are necessary? Br J Cancer (1995) 72(1):1–9. doi: 10.1038/bjc.1995.268
12. Ding S, Zhang P, Wang L, Wang D, Sun K, Ma Y, et al. Prevalence of obstructive sleep apnea syndrome in hospitalized patients with type 2 diabetes in Beijing, China. J Diabetes Invest (2022) 13(11):1889–96. doi: 10.1111/jdi.13868
13. Li C, Hsieh MC, Chang SJ. Metabolic syndrome, diabetes, and hyperuricemia. Curr Opin Rheumatol (2013) 25(2):210–6. doi: 10.1097/BOR.0b013e32835d951e
14. Khatiwada S, Kc R, Sah SK, Khan SA, Chaudhari RK, Baral N, et al. Thyroid dysfunction and associated risk factors among Nepalese diabetes mellitus patients. Int J endocrinol (2015) 2015:570198. doi: 10.1155/2015/570198
15. Ortiga-Carvalho TM, Oliveira KJ, Soares BA, Pazos-Moura CC. The role of leptin in the regulation of TSH secretion in the fed state: in vivo and in vitro studies. J endocrinol (2002) 174(1):121–5. doi: 10.1677/joe.0.1740121
16. Duntas LH, Biondi B. The interconnections between obesity, thyroid function, and autoimmunity: the multifold role of leptin. Thyroid (2013) 23(6):646–53. doi: 10.1089/thy.2011.0499
17. Mullur R, Liu YY, Brent GA. Thyroid hormone regulation of metabolism. Physiol Rev (2014) 94(2):355–82. doi: 10.1152/physrev.00030.2013
18. Al-Hamodi Z, Al-Habori M, Al-Meeri A, Saif-Ali R. Association of adipokines, leptin/adiponectin ratio and c-reactive protein with obesity and type 2 diabetes mellitus. Diabetol Metab syndrome (2014) 6(1):99. doi: 10.1186/1758-5996-6-99
19. Liao PJ, Ting MK, Wu IW, Chen SW, Yang NI, Hsu KH. Higher leptin-to-Adiponectin ratio strengthens the association between body measurements and occurrence of type 2 diabetes mellitus. Front Public Health (2021) 9:678681. doi: 10.3389/fpubh.2021.678681
20. Katsiki N, Mikhailidis DP, Banach M. Leptin, cardiovascular diseases and type 2 diabetes mellitus. Acta pharmacologica Sinica (2018) 39(7):1176–88. doi: 10.1038/aps.2018.40
21. Malaguarnera R, Vella V, Nicolosi ML, Belfiore A. Insulin resistance: any role in the changing epidemiology of thyroid cancer? Front Endocrinol (Lausanne) (2017) 8:314. doi: 10.3389/fendo.2017.00314
22. Teixeira P, Dos Santos PB, Pazos-Moura CC. The role of thyroid hormone in metabolism and metabolic syndrome. Ther Adv Endocrinol Metab (2020) 11:2042018820917869. doi: 10.1177/2042018820917869
23. Jun JE, Jee JH, Bae JC, Jin SM, Hur KY, Lee MK, et al. Association between changes in thyroid hormones and incident type 2 diabetes: a seven-year longitudinal study. Thyroid (2017) 27(1):29–38. doi: 10.1089/thy.2016.0171
24. Gu L, Yang J, Gong Y, Ma Y, Yan S, Huang Y, et al. Lower free thyroid hormone levels are associated with high blood glucose and insulin resistance; these normalize with metabolic improvement of type 2 diabetes. J diabetes (2021) 13(4):318–29. doi: 10.1111/1753-0407.13118
25. Ittermann T, Schipf S, Dörr M, Thuesen BH, Jørgensen T, Völzke H, et al. Hyperthyroxinemia is positively associated with prevalent and incident type 2 diabetes mellitus in two population-based samples from northeast Germany and Denmark. Nutrition metabolism Cardiovasc Dis NMCD (2018) 28(2):173–9. doi: 10.1016/j.numecd.2017.10.016
26. Lertrit A, Chailurkit LO, Ongphiphadhanakul B, Aekplakorn W, Sriphrapradang C. Thyroid function is associated with body mass index and fasting plasma glucose in Thai euthyroid population. Diabetes Metab syndrome (2019) 13(1):468–73. doi: 10.1016/j.dsx.2018.11.004
27. Khan SH, Fazal N, Ijaz A, Manzoor SM, Asif N, Rafi T, et al. Insulin resistance and glucose levels in subjects with subclinical hypothyroidism. J Coll Physicians Surgeons–Pakistan JCPSP (2017) 27(6):329–33.
28. Kocatürk E, Kar E, Küskü Kiraz Z, Alataş Ö. Insulin resistance and pancreatic β cell dysfunction are associated with thyroid hormone functions: a cross-sectional hospital-based study in Turkey. Diabetes Metab syndrome (2020) 14(6):2147–51. doi: 10.1016/j.dsx.2020.11.008
29. Le TN, Celi FS, Wickham EP 3rd. Thyrotropin levels are associated with cardiometabolic risk factors in euthyroid adolescents. Thyroid (2016) 26(10):1441–9. doi: 10.1089/thy.2016.0055
30. Velija-Asimi Z, Karamehic J. The effects of treatment of subclinical hypothyroidism on metabolic control and hyperinsulinemia. Medicinski arhiv (2007) 61(1):20–1.
31. Rehman K, Akash MSH, Alina Z. Leptin: a new therapeutic target for treatment of diabetes mellitus. J Cell Biochem (2018) 119(7):5016–27. doi: 10.1002/jcb.26580
32. Walczak K, Sieminska L. Obesity and thyroid axis. Int J Environ Res Public Health (2021) 18(18):9434. doi: 10.3390/ijerph18189434
33. Yu YT, Ho CT, Hsu HS, Li CI, Davidson LE, Liu CS, et al. Subclinical hypothyroidism is associated with elevated high-sensitive c-reactive protein among adult Taiwanese. Endocrine (2013) 44(3):716–22. doi: 10.1007/s12020-013-9915-0
34. Zhang Y, Lin F, Tu W, Zhang J, Choudhry AA, Ahmed O, et al. Thyroid dysfunction may be associated with poor outcomes in patients with COVID-19. Mol Cell endocrinol (2021) 521:111097. doi: 10.1016/j.mce.2020.111097
35. Kouidhi S, Berhouma R, Ammar M, Rouissi K, Jarboui S, Clerget-Froidevaux MS, et al. Relationship of thyroid function with obesity and type 2 diabetes in euthyroid Tunisian subjects. Endocrine Res (2013) 38(1):15–23. doi: 10.3109/07435800.2012.699987
Keywords: thyroid stimulating hormone, subclinical hypothyroidism, thyroid hormone sensitivity, diabetes, insulin resistance
Citation: Yang W, Jin C, Wang H, Lai Y, Li J and Shan Z (2023) Subclinical hypothyroidism increases insulin resistance in normoglycemic people. Front. Endocrinol. 14:1106968. doi: 10.3389/fendo.2023.1106968
Received: 24 November 2022; Accepted: 22 June 2023;
Published: 06 July 2023.
Edited by:
Jose De Jesus Garduno Garcia, Universidad Autónoma del Estado de México, MexicoReviewed by:
Xiaoguang Shi, China Medical University, ChinaCristian Serafinceanu, National Institute for Diabetes, Nutrition and Metabolic Diseases, Romania
Mostafa Vaghari-Tabari, Tabriz University of Medical Sciences, Iran
Anupama Hegde, Kasturba Medical College, Mangalore, India
Copyright © 2023 Yang, Jin, Wang, Lai, Li and Shan. This is an open-access article distributed under the terms of the Creative Commons Attribution License (CC BY). The use, distribution or reproduction in other forums is permitted, provided the original author(s) and the copyright owner(s) are credited and that the original publication in this journal is cited, in accordance with accepted academic practice. No use, distribution or reproduction is permitted which does not comply with these terms.
*Correspondence: Zhongyan Shan, c2hhbnpob25neWFuQG1lZG1haWwuY29tLmNu