 Ling Fang1
 Qi Zhang
94% of researchers rate our articles as excellent or good
Learn more about the work of our research integrity team to safeguard the quality of each article we publish.
Find out more
ORIGINAL RESEARCH article
Front. Endocrinol., 07 March 2023
Sec. Obesity
Volume 14 - 2023 | https://doi.org/10.3389/fendo.2023.1088882
This article is part of the Research TopicRising Stars: Obesity 2021View all 5 articles
Objective: To determine differences in DM in the U.S. population according to demographic characteristics, physical indicators and living habits.
Methods: 23 546 participants in the 2009 to 2018 National Health and Nutrition Examination Survey (NHANES) who were 20 year of age or older and not pregnant. All analyses used weighted samples and considered the stratification and clustering of the design. Specific indicators include length of leg (cm), BMI (kg/cm2), TCHOL (mg/dL), fasting plasma glucose (mg/dL) and comparison of means and the proportion of participants with DM.
Results: The prevalence of DM in the USA has been rising modestly in the past decade, and were consistent and robust for the observed differences in age, sex, and ethnicity. Compared with white participants, black participants and Mexican-American were both more likely (P<0.001) to have diabetes: 14.6% (CI, 13.6% to 15.6%) among black participants, 10.6% (CI, 9.9% to 11.3%) among white participants, and 13.5% (CI, 11.9% to 15.2%) among Mexican-American participants. The prevalence of diabetes is increasing with age, males peaked around the 60s, and women around the 70s. The overall mean leg length and TCHOL was lower in diabetics than in non-diabetics (1.07 cm, 18.67 mg/dL, respectively), while mean BMI were higher in diabetics than in non-diabetics (4.27 kg/cm2). DM had the greatest effect on decline of TCHOL in white participants (23.6 mg/dL), less of an effect in black participants (9.67 mg/dL), and the least effect in Mexican-American participants (8.25 mg/dL). Notably, smoking had great effect on percent increment of DM in whites (0.2%), and have little effect on black and Mexican-Americans.
Conclusions: DM is more common in the general population than might be clinically recognized, and the prevalence of DM was associated to varying degrees with many indicators of demographic characteristics, physical indicators, and living habits. These indicators should be linked with medical resource allocation and scientific treatment methods to comprehensively implement the treatment of DM.
Diabetes mellitus (DM) is a chronic metabolic disease with a series of metabolic disorders (glucose, protein, fat, water, electrolyte, etc.) and chronic deficiency, or dysfunction of blood glucose level or dysfunction caused by a variety of pathogenic factors, which has been an important public health problem in the whole world (1). In the past 4 decades, doctors have mainly observed the changes of blood glucose through fasting plasma glucose (FPG), glycated hemoglobin (HbA1c), 2h postprandial blood glucose (2hPG), to provide a basis for the diagnosis of diabetes (2, 3). Diabetes symptoms can be observed in individuals of different gender, race and age. South Asia ethnicity with diabetes have higher mortality compared with white Europeans, South Asian women were in particular affected (4, 5).
Obesity poses a huge risk on diabetes independently in the United States (6). Previous studies were mainly limited to differences in the type of diabetes by ethnic groups, and comparative analysis in aspects of fatality. The more representative judgment indicators of diabetes include leg length, BMI (Body Mass Index), and total cholesterol (total cholesterol) (7). Studies on the differences of these indicators under different races, age, gender and other factors are still lacking and not systematic enough (6, 8). Studies have shown that leg length has been associated with diabetes prevalence (7), which urgently needs to be tested by quantitative analysis of large samples. We are unaware of a systematic analysis regarding the population-based prevalence of DM.
The National Diabetes Data Group (NDDG) established a classification based mainly on diabetes treatment requirements, which was widely recognized and still used today. This classification included insulin dependent diabetes mellitus (IDDM), non-insulin dependent diabetes mellitus (NIDDM), gestational diabetes and diabetes secondary to other diseases like pancreatic cancer and other endocrine diseases (9). In our study, diabetes in pregnant women was excluded from the study to ensure general applicability (7). We used data from the 2009 to 2018 National Health and Nutritional Examination Survey (NHANES) to describe the prevalence of DM in the USA from the perspective of demographic characteristics, physical indicators and living habits, including age-, sex-, ethnicity-, smoking-, alcohol drinking-related differences in leg length, BMI and TCHOL in the United States, and focusing on the fasting plasma glucose (FPG) in black persons.
Details of NHANES have been described elsewhere (10). In short, NHANES uses a complex, multistage, probabilistic sampling method to collect nationally representative health related data on the U.S. population, regular before 1999 and continued thereafter. Data were obtained through face-to-face interview, mobile physical examination and laboratory test. Since 2007, some changes have been made to the over-sampled domain. The main change was an oversampling of the entire Hispanic population, not just Mexican Americans (MA). Similar to those aged 60 and over in the previous cycle, blacks and low-income people were over-sampled to ensure accurate estimates for these groups (11). Of the 49 693 persons 1 year of age or older who were asked to come to the mobile examination centers, 16 676 did not participate in body measures and TCHOL tests or had missing data. 8848 persons were excluded because our study focused on people over 20 years old and no pregnant women, and 623 were excluded for DM data missing. Finally, 23 546 participants were included with complete data for quantitative study (Figure 1).
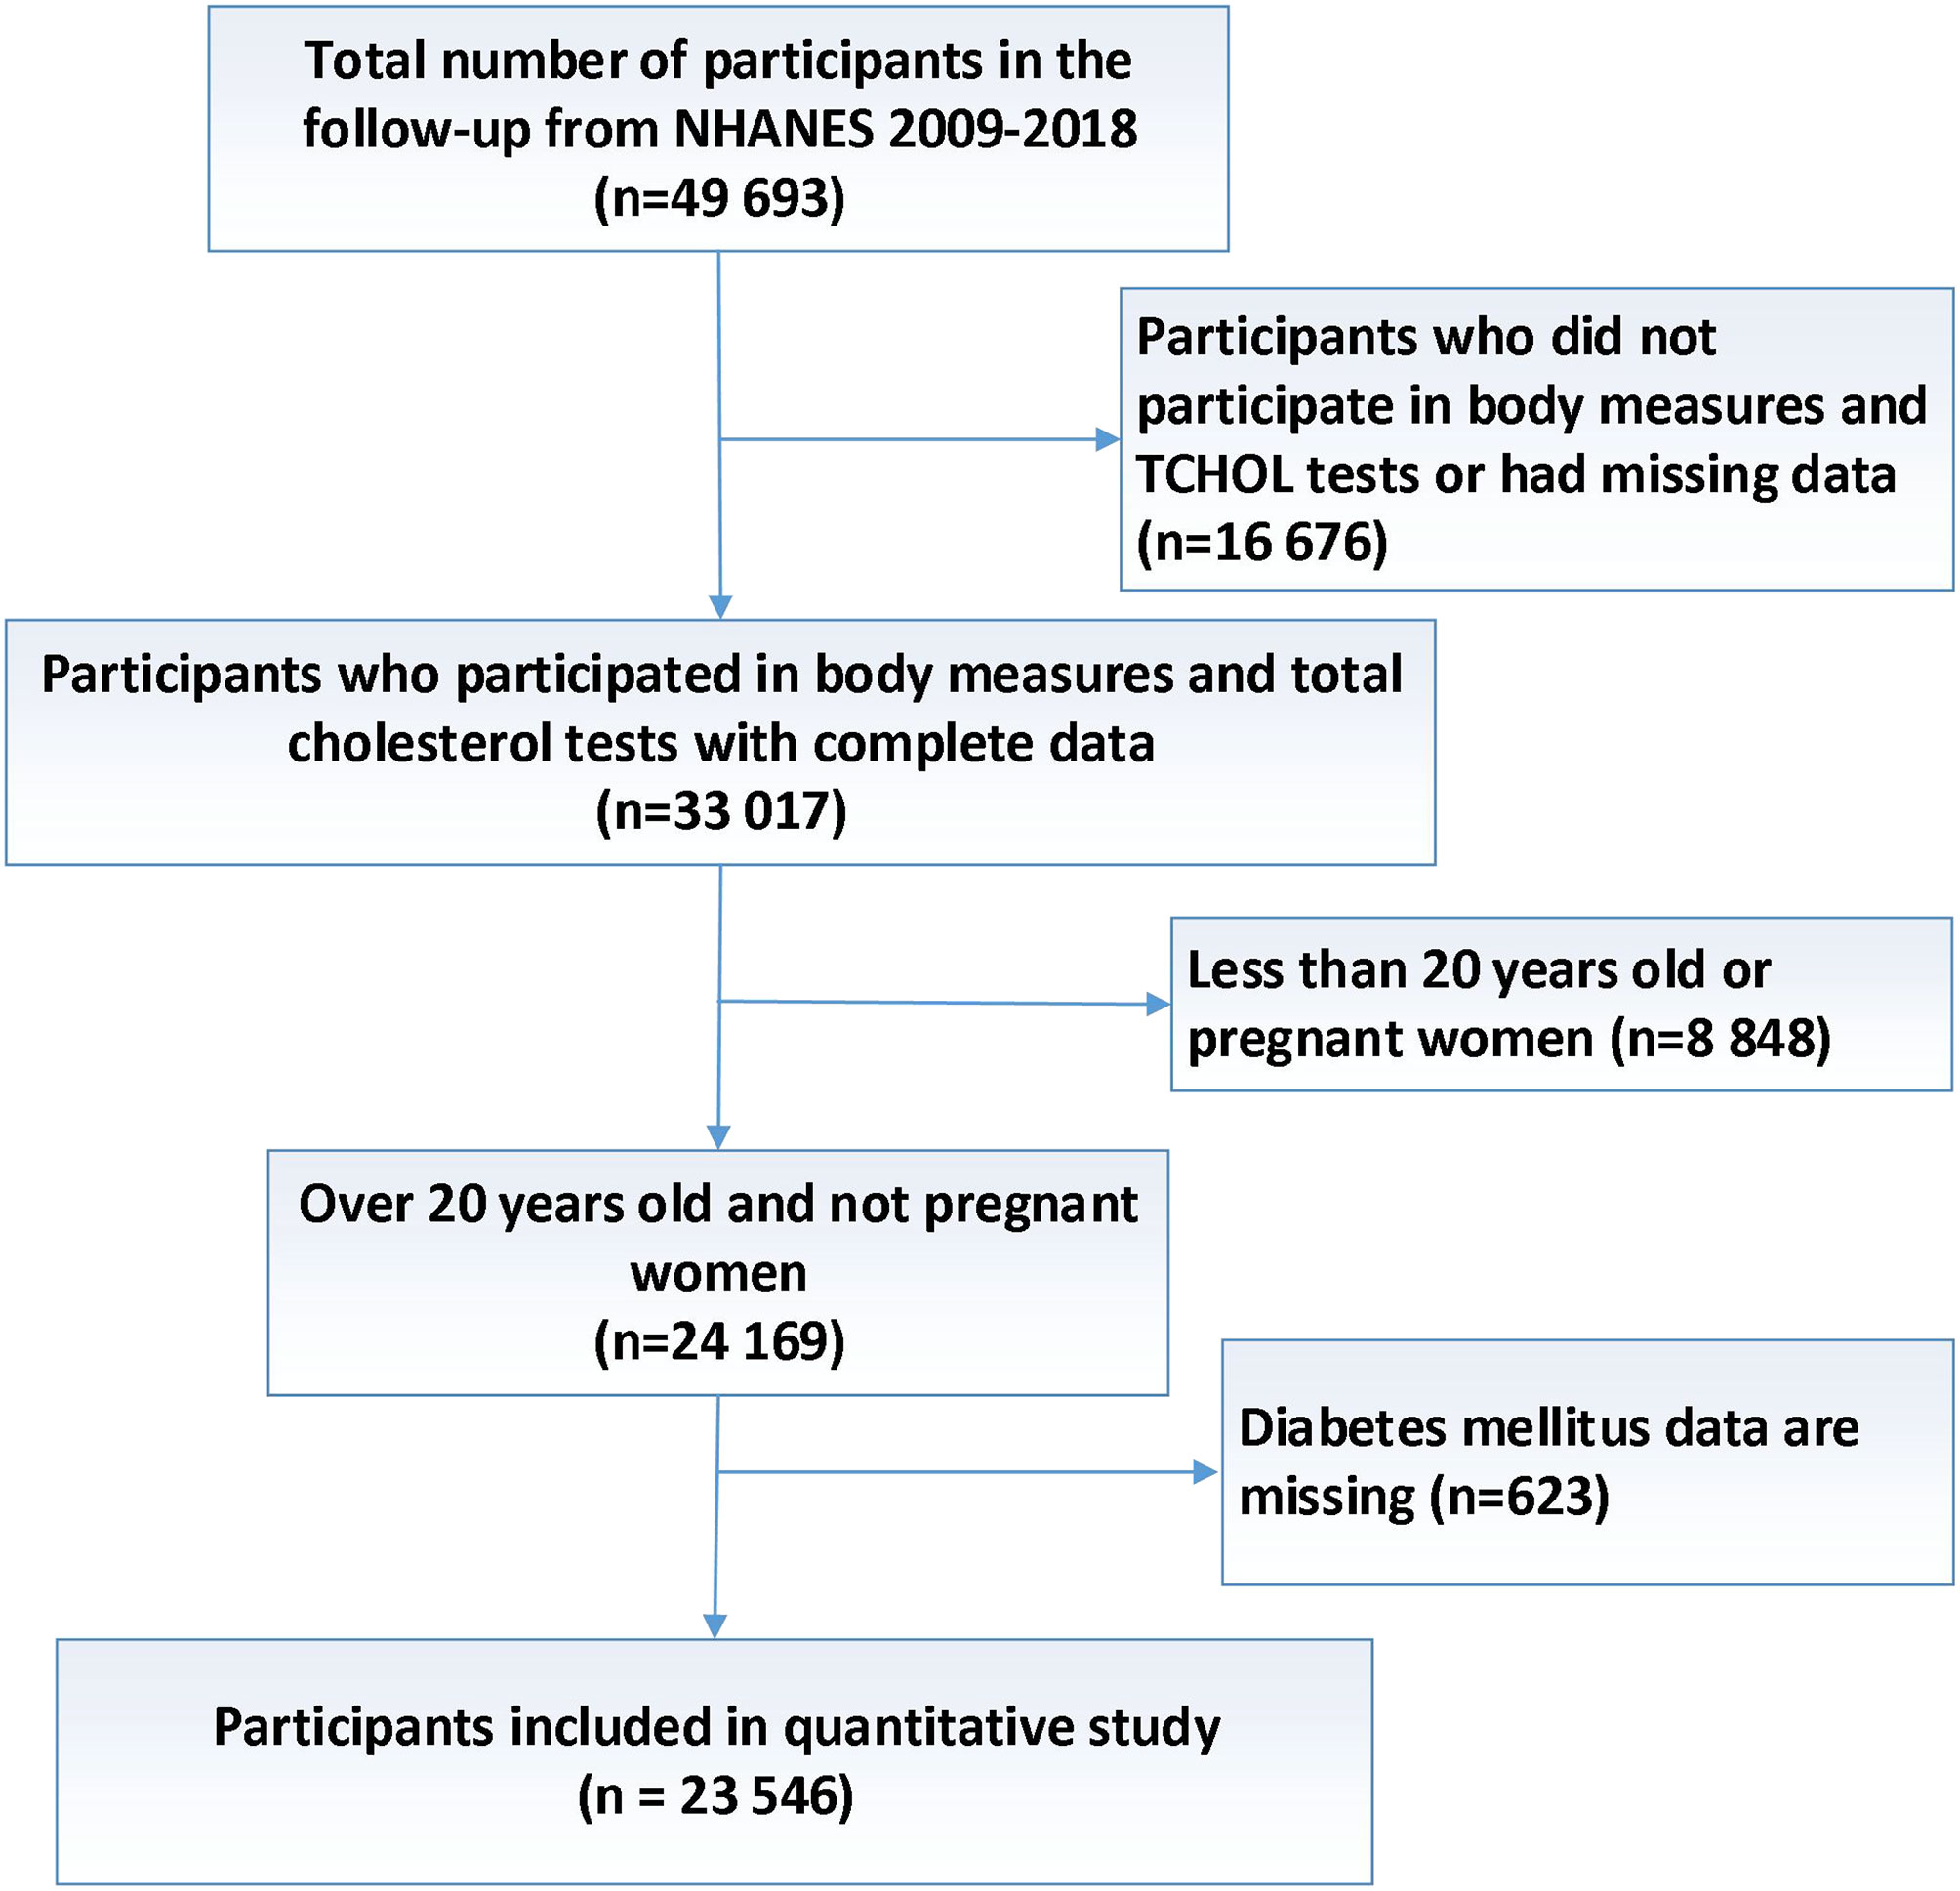
Figure 1 Flow diagram of participants inclusion for study.
For the data sources and the selection criteria, three aspects should be explained. Firstly, leg length and BMI data from body measures of NHANES were collected in the Mobile Examination Center (MEC), by trained health technicians, in order to examine the associations between body weight and the health and nutritional status of the U.S. population (12). The laboratory method used to measure the value of TCHOL is an enzymatic assay, in which esterified cholesterol is converted to cholesterol by cholesterol esterase (13). Secondly, diabetes as diagnosed according to the standards of the American Diabetes Association (14) and participants’ self-reported questionnaires. Each of the following conditions was diagnosed as diabetes: fasting plasma glucose>=7 mmol/L (equal to 125 mg/dL), self-reported physician diagnosis of diabetes, or current use of diabetes medication to lower blood glucose level. Thirdly, current smokers were defined as participants who were age 20 years or older and reported smoking occasionally or daily during the past 7 days, or over 100 cigarettes (15). For alcohol drinking group, current heavy alcohol use (≥3 drinks per day for females, ≥4 drinks per day for males, or binge drinking [≥4 drinks on same occasion for females, ≥5 drinks on same occasion for males] on 5 or more days per month); current moderate alcohol use (≥2 drinks per day for females, ≥3 drinks per day for males, or binge drinking ≥2 days per month); all other cases are mild (16).
All analyses used weighted samples and considered the stratification and clustering of the design to derive estimates that were applicable to the U.S. population (12, 13). To provide estimates for the entire 10 years, a 10-year, weight-variable sample was created by taking one fifth for the 2-year weight for each person who was sampled in 2009 to 2018. All analyses were conducted in RStudio, version 2022.07.0 for Windows (RStudio, PBC) and R, version 4.2.1 (The R Foundation for Statistical Computing). Non-adjusted frequency distribution of body measures and TCHOL and non-adjusted prevalence of diabetes regarding age groups, sex, and ethnicity were obtained. These age groups were commonly used in highly stratified NHANES analyses (12, 13). We obtained means and comparisons of age-adjusted and sex-adjusted body measures by using linear regression, in which age is modeled as a continuous variable. Adjusted means in leg length and BMI in smokers and nonsmokers were compared. Logistic regression adjusting for age group and sex was then used to generate predictive marginals for having diabetes. More complex models, which involved interaction between ethnicity and sex as well as between ethnicity and age (as a continuous variable), were also tested and different categorizations of age were considered. These models did not substantially add to the explanatory power of the model.
The 23 546 NHANES participants with valid body measures and TCHOL value represented 308 million non-institutionalized residents of the United States. Among 26 147 participants with missing data, 30% were white, 24% were black, and 20% were Mexican American. Over the past decade, the prevalence of diabetes has been steadily rising, as is the trend in different races, gender, and age groups (Figure 2).
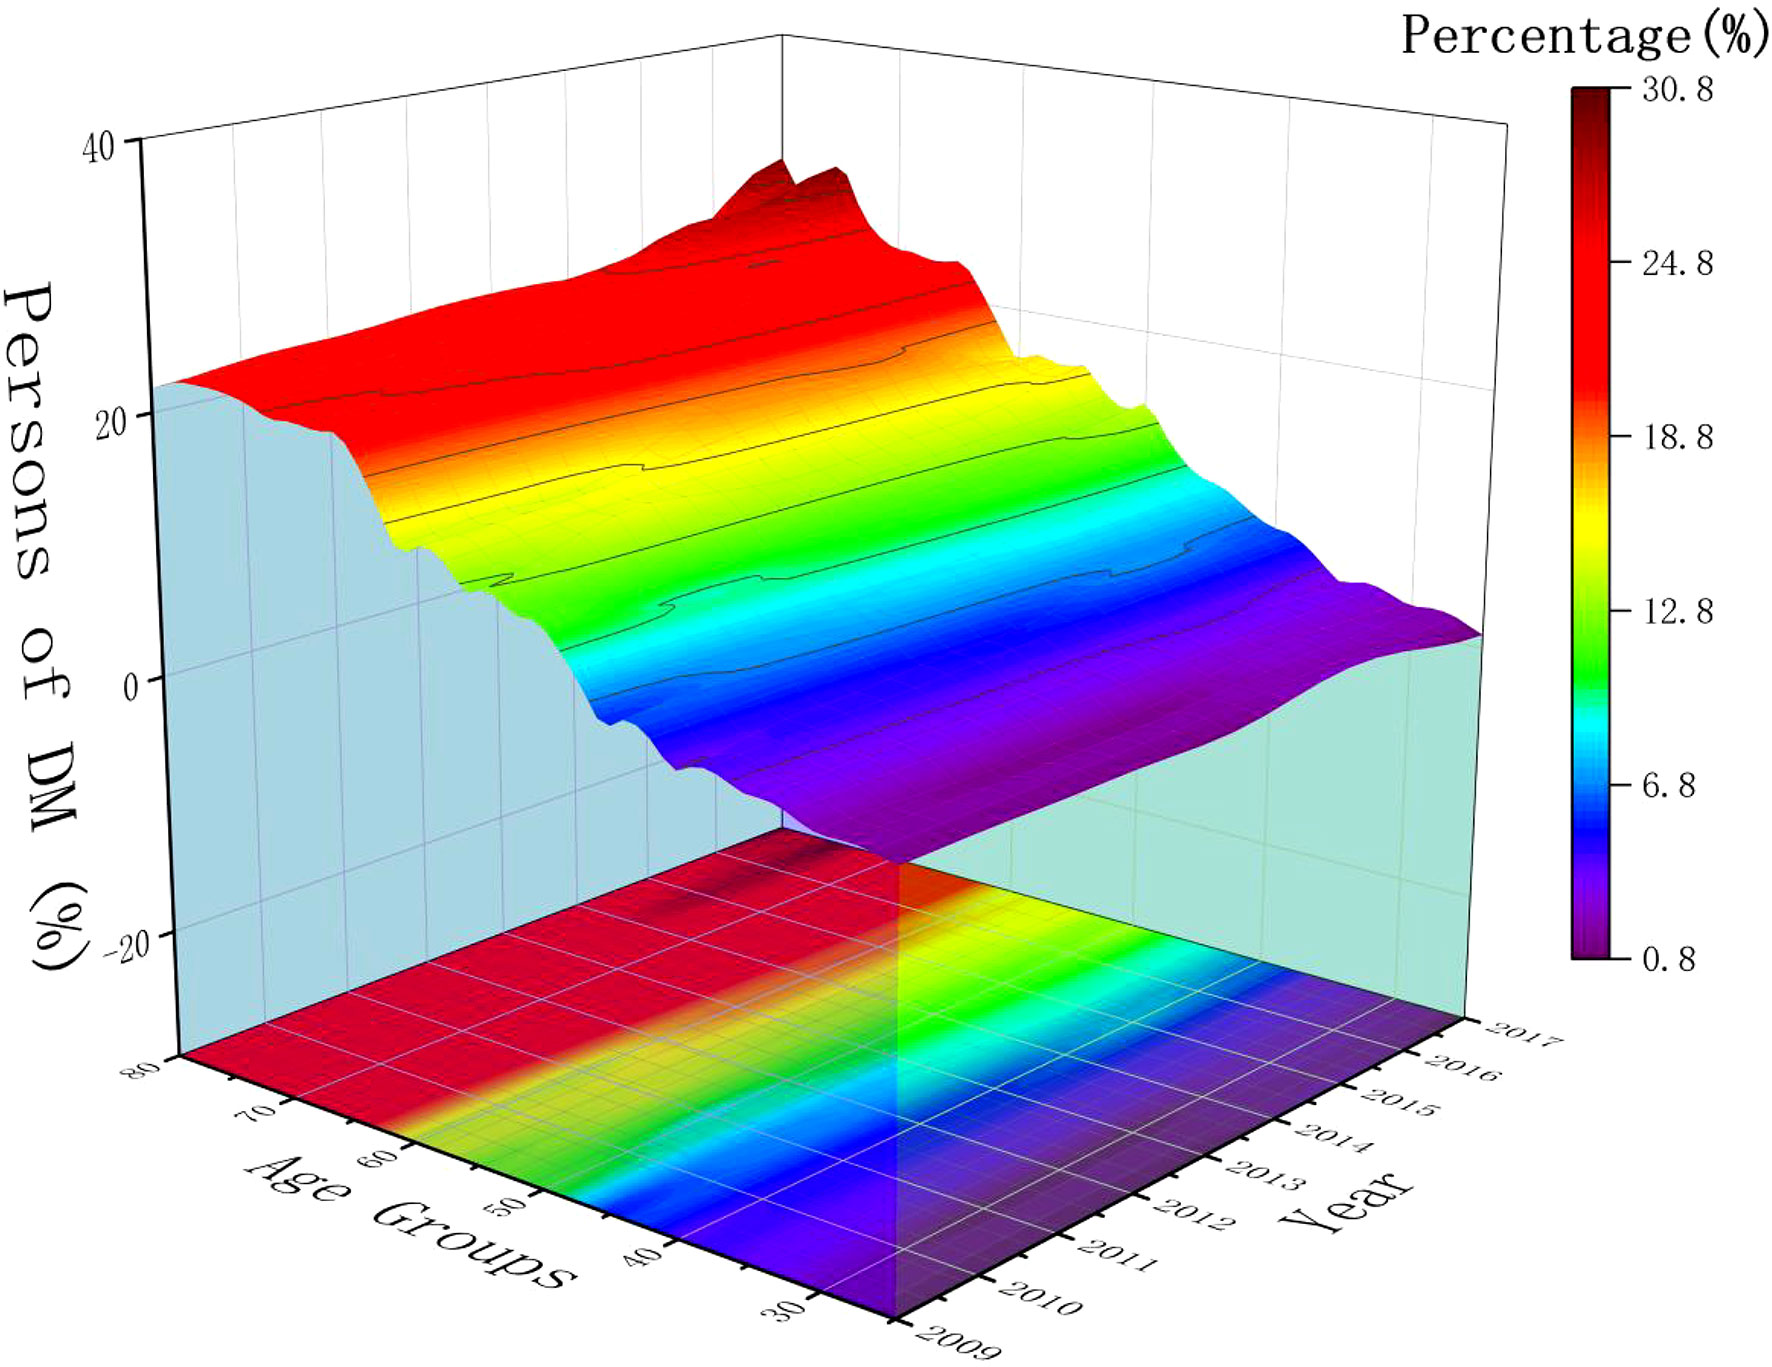
Figure 2 The trend of diabetes incidence from 2009 to 2018 by age groups and year.
Firstly, the prevalence of diabetes differed by age, sex, and ethnicity (Figure 3; Appendix Table 1). A total of 3 621 participants had diabetes. The weighted prevalence was 11.6% (95% CI, 11.0% to 12.1%), which represented an estimated 23.1 million persons in the United States. Diabetes was present in 14.6% (CI, 13.6% to 15.6%) of black participants, 10.6% (CI, 9.9% to 11.3%) of white participants, and 13.5% (CI, 11.9% to 15.2%) of Mexican-American participants. Across ethnic groups, white and Mexican-American males were more likely to have diabetes: 12.2% for white males versus 9.1% for white females and 13.7% for Mexican-American males versus 13.4% for Mexican-American females; black men had roughly the same odds of developing diabetes as black women, with only slight differences: 14.5% for black males versus 14.7% for black females. The prevalence of diabetes is increasing with age, males peaked around the 60s, compared to women around the 70s. For every age and sex category, black participants were more likely than white participants to have diabetes; in most age and sex categories, diabetes was more common among Mexican-American participants than among white participants.
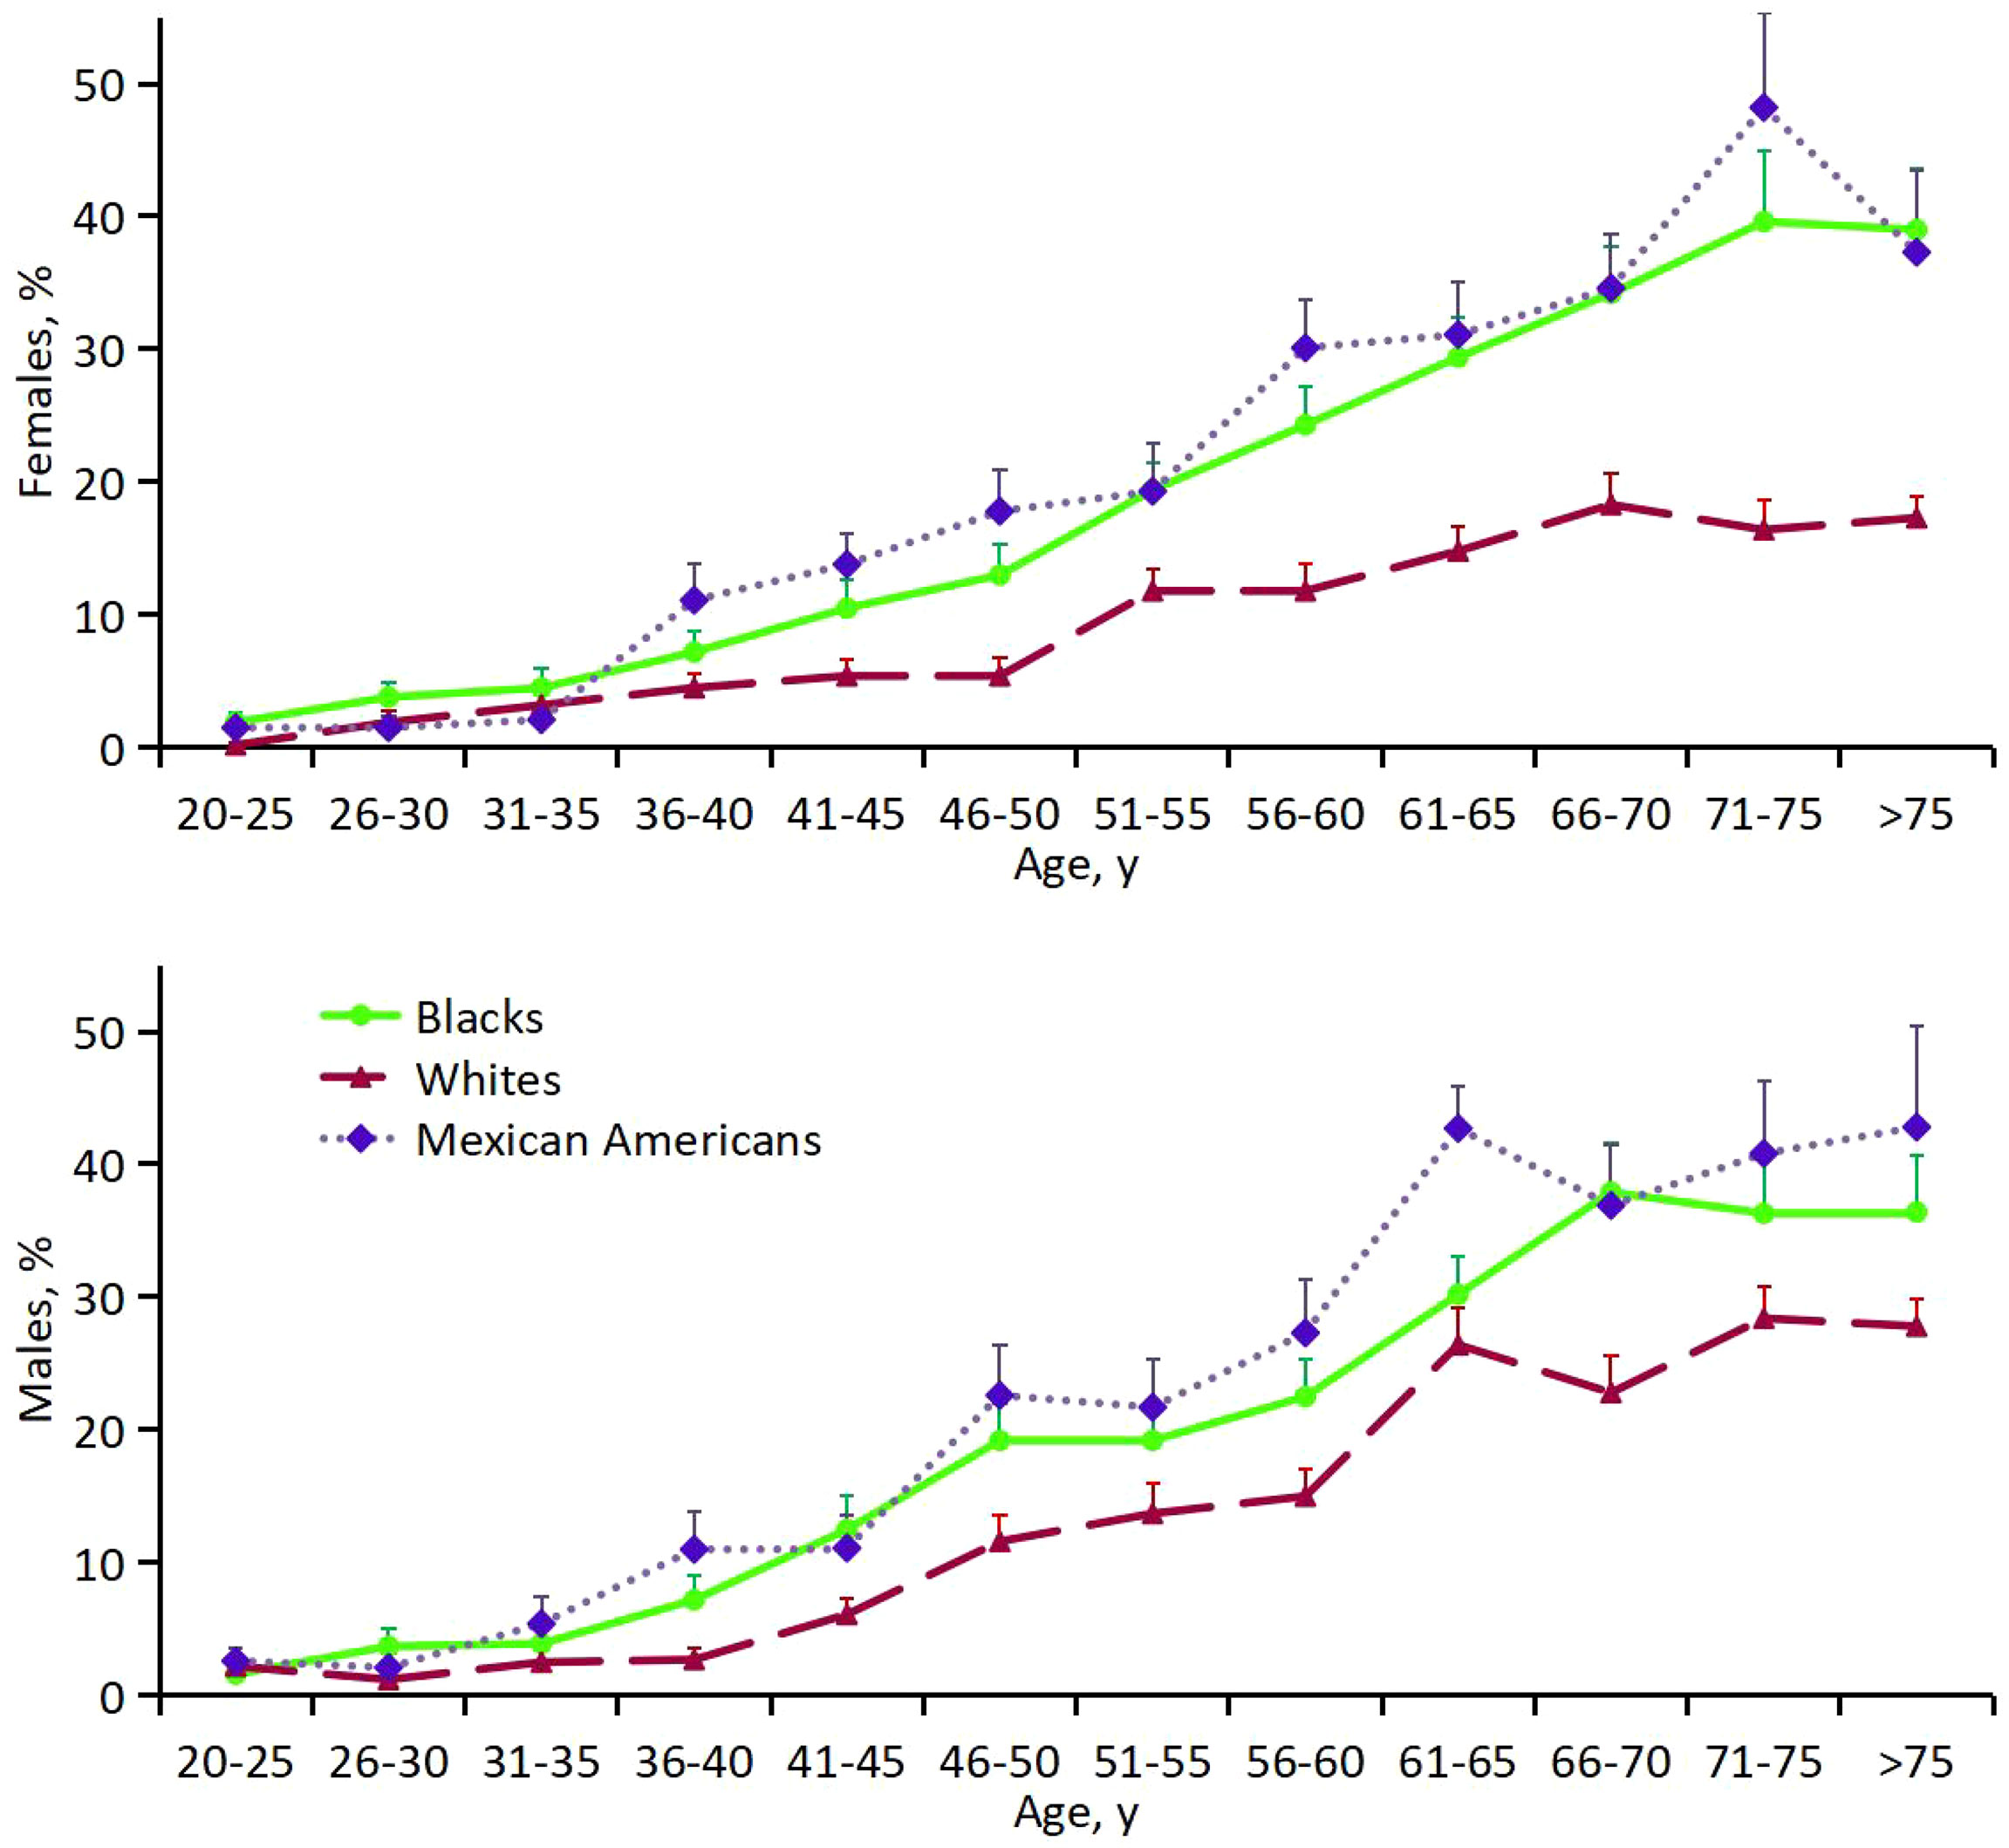
Figure 3 Percentage of females (top) and males (bottom) with DM.
Secondly, multivariate logistic regression analysis was done to estimate the prevalence of diabetes adjusted for age, sex, and ethnicity (Appendix Table 2). Compared with white participants, black participants and Mexican-American were both more likely (P<0.001) to have diabetes: 14.6% among black participants, 10.6% among white participants, and 13.5% among Mexican-American participants. The prevalence of diabetes was lower in adolescence and was less than 8% from age 20 to 45 years onward. Males were also more likely than females to have diabetes (P<0.001). There was significant interaction between ethnicity and sex (P<0.001) and between ethnicity and age as a continuous variable (P=0.00129).
Thirdly, the prevalence of diabetes with 3 categories fasting plasma glucose (FPG) values was also seen across most age ranges in black participants (Appendix Table 3). Most participants with diabetes had fasting plasma glucose (FPG) of more than 125 mg/dL. 67% of black participants, 80% of white participants, and 78% of Mexican-American participants.
Firstly, mean age-adjusted and sex-adjusted leg length, BMI and TCHOL were compared for diabetics and non-diabetics (Table 1, Figure 4). The respective numbers of participants who had DM and those who did not have DM were 870 and 3 960 for black, 1 213 and 8 226 for white, and 656 and 2 863 for Mexican-American participants. The overall mean leg length and TCHOL was lower in diabetics than in non-diabetics (1.07 cm, 18.67 mg/dL, respectively), while mean BMI were higher in diabetics than in non-diabetics (4.27 kg/cm2). DM had the greatest effect on decline of TCHOL in white participants (23.6 mg/dL), less of an effect in black participants (9.67 mg/dL), and the least effect in Mexican-American participants (8.25 mg/dL).
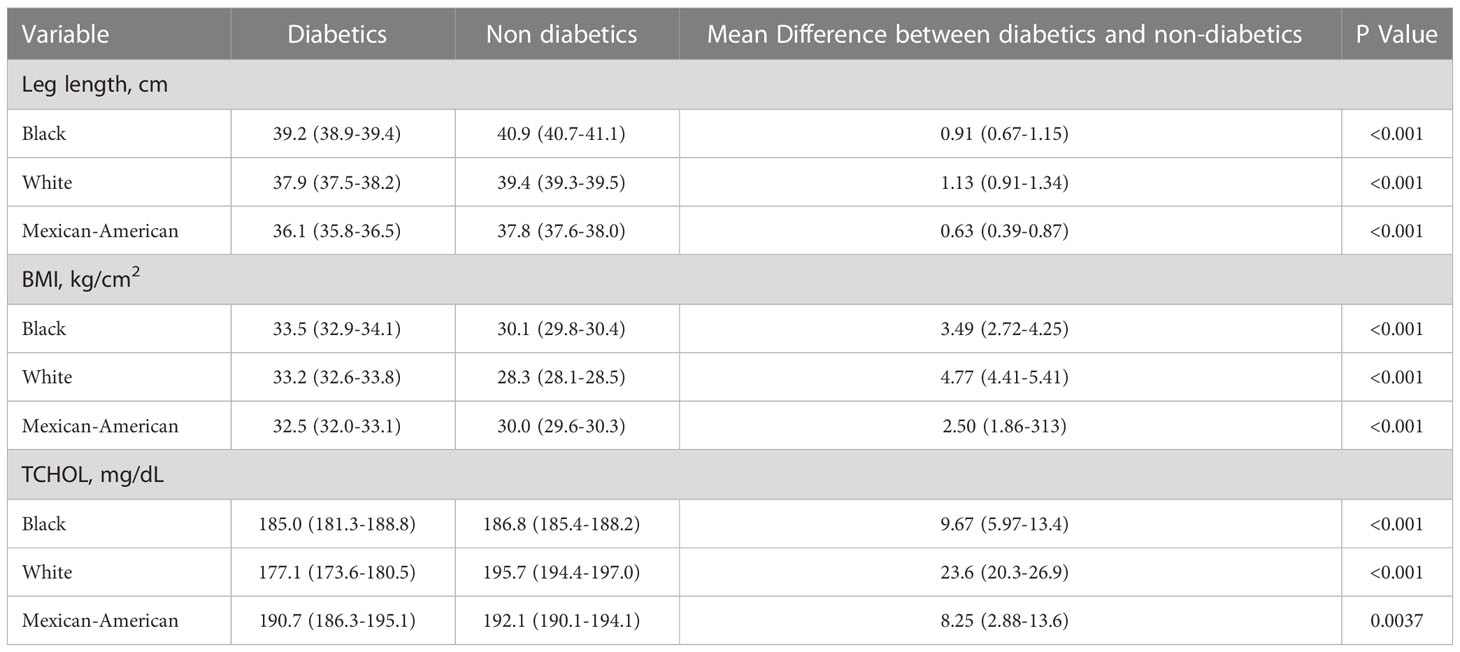
Table 1 Comparative mean leg length, BMI and TCHOL in diabetics and non-diabetics.
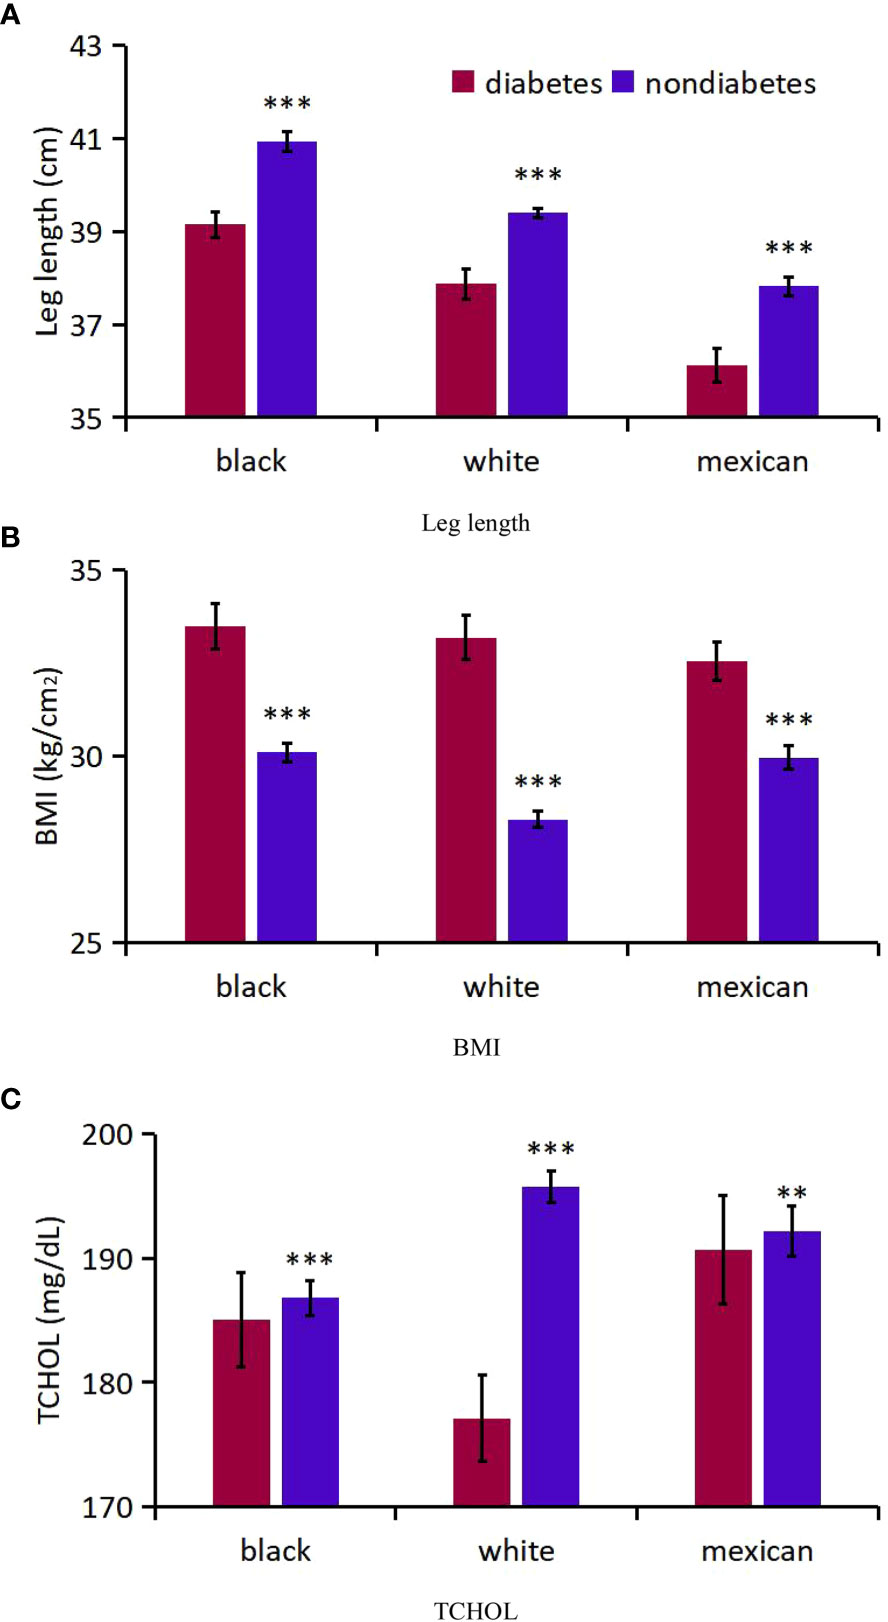
Figure 4 Analysis on the differences of three indicators between diabetic patients and non-diabetic patients of different races. (A) Leg length; (B) BMI; (C) TCHOL. *** P<0.001 vs diabetes; ** P<0.01.
Secondly, for participants with DM, we compared age-adjusted and sex-adjusted mean leg length, BMI and TCHOL across the major ethnic groups by using linear regression. The numbers of males younger than age 50 years were 1 150, 2 220, and 954among black, white, and Mexican-American participants, respectively, and the numbers of males age 50 years or older were 1 238, 2 490, and 764, respectively. The numbers of females younger than age 50 years were 1 275, 2 248, and 1 0351among black, white, and Mexican-American participants, and the numbers of females age 50 years or older were 1 167, 2 481, and 766, respectively. Relative to white participants, black participants had higher mean leg length (1.28 cm; P<0.001) and higher mean TCHOL (7.96 mg/dL; P=0.0025). Mexican-American participants had lower mean leg length (1.74 cm; P<0.001), lower mean BMI (0.64 kg/m2; P=0.11) and apparently higher mean TCHOL (13.61 mg/dL; P<0.001). In addition, mean leg length and TCHOL were higher, and BMI were lower in males than in females (p<0.001) (Appendix Table 4). Appendix Table 5 summarize these 3 variables in the 3 major ethnic groups for sex and for the 12 age groups.
Thirdly, for participants with DM, the distribution of leg length, BMI and TCHOL suggested that, black participants have an advantage in leg length, followed by white participants and Mexican-American participants and there was a downward shift for leg length and a obviously upward shift for BMI among Mexican-American participants, but little difference for TCHOL (Appendix Table 6; Figure 5).
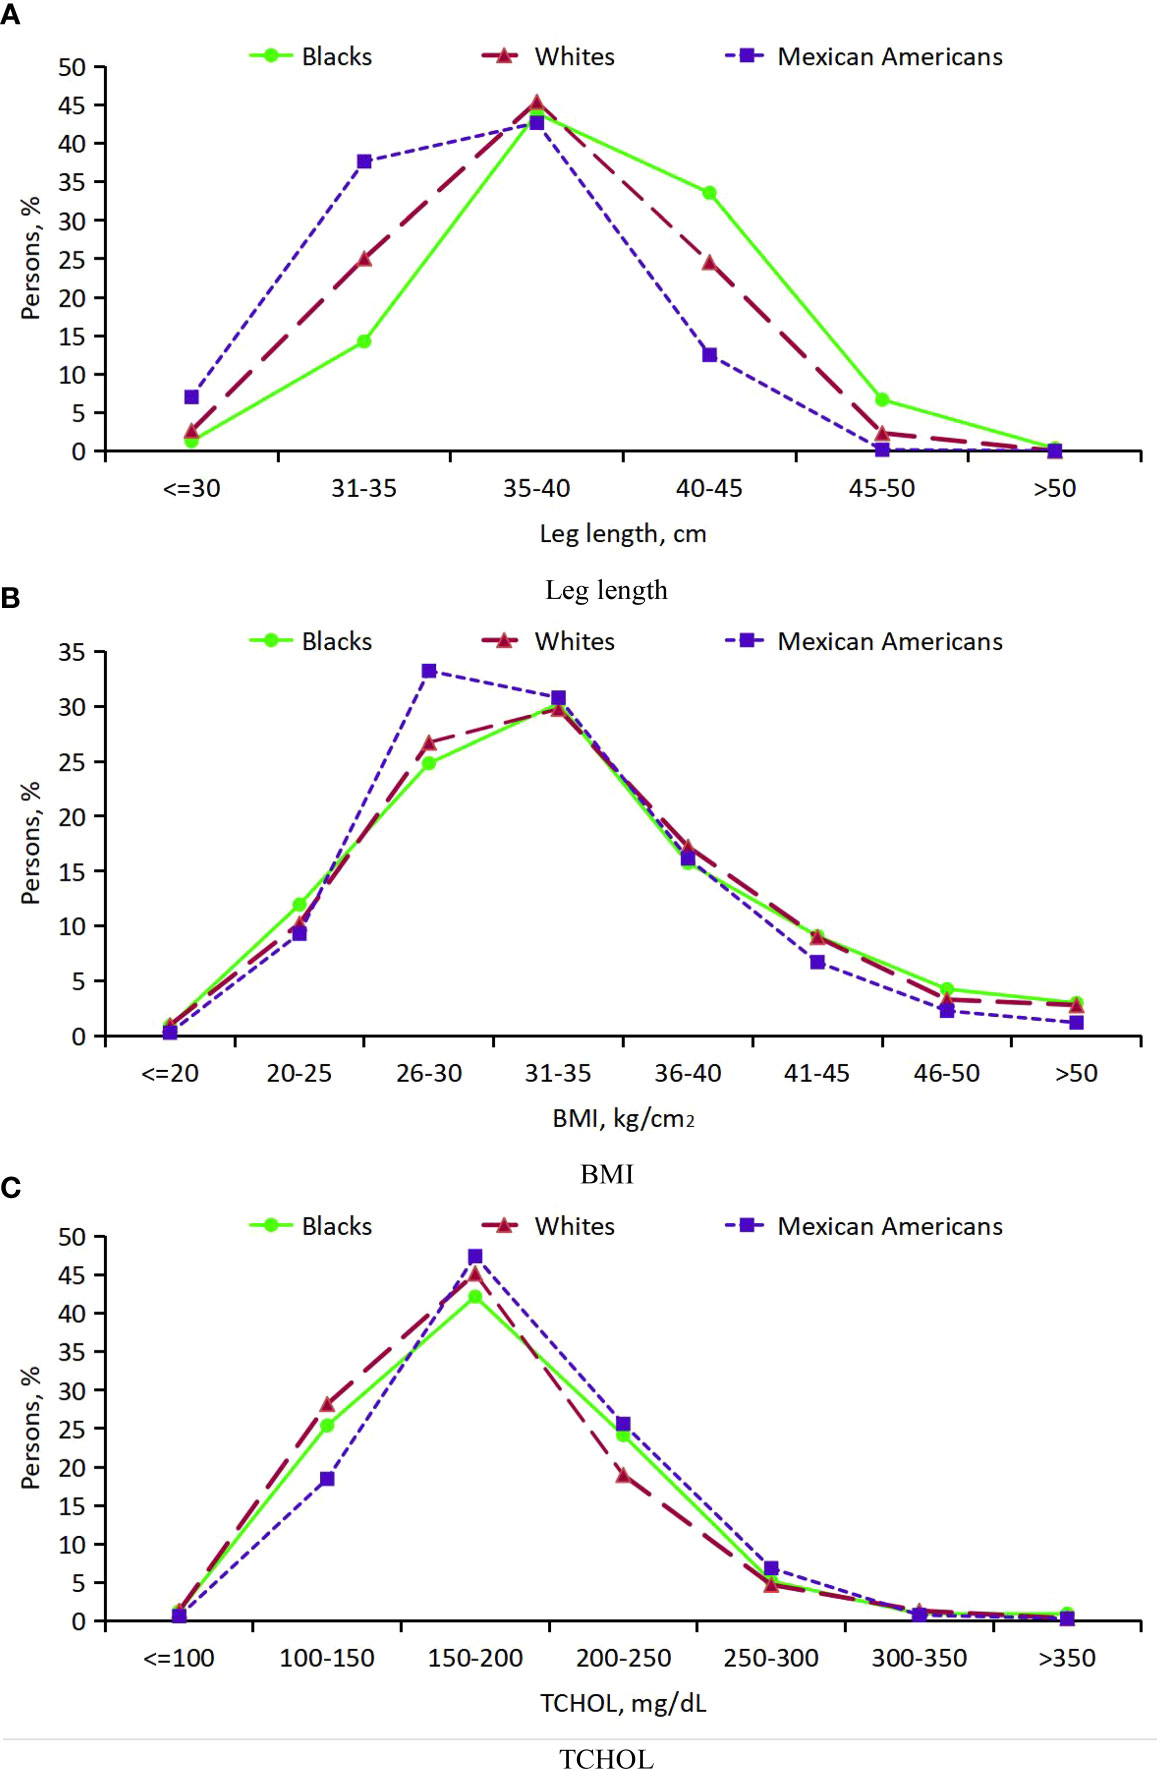
Figure 5 Distribution of leg length, BMI and TCHOL in persons with DM age 20 years or older from 3 ethic groups. (A) Leg length; (B) BMI; (C) TCHOL.
Firstly, mean age-adjusted and sex-adjusted percentage of DM were compared for smokers and nonsmokers (Appendix Table 7, Figure 6). The respective numbers of participants who had smoked and those who did not smoke were 2 084 and 2 746 for black, 4 880 and 4 559 for white, and 1 272 and 2247 for Mexican-American participants. There was no significant difference in the overall mean percentage of DM between smokers and non-smokers (P=0.13). Meanwhile, smoking had great effect on percent increment of DM in white participants (0.2%), and have little effect on black and Mexican-American participants. In a separate logistic regression analysis that was adjusted for age group, sex, and ethnicity, smokers had a statistically significant lower percentage of DM (CI, 0.07 to 0.28; P=0.002) relative to nonsmokers.
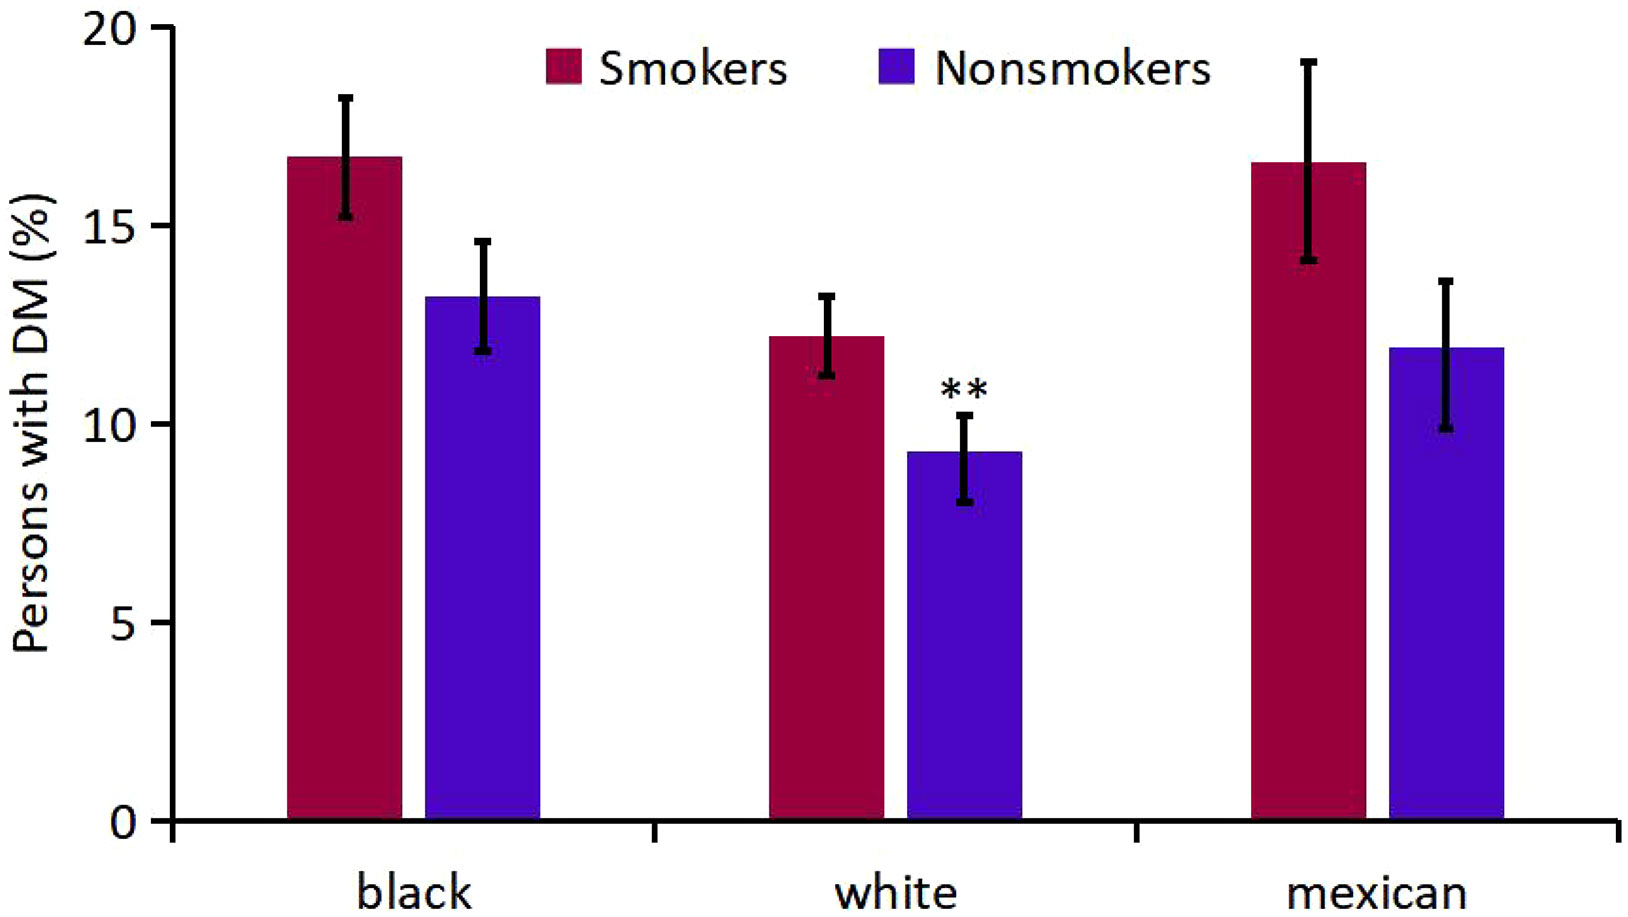
Figure 6 Analysis on the Mean percentage of participants with DM in smokers and nonsmokers of different races. ** P<0.01 vs Smokers
Secondly, mean age-adjusted and sex-adjusted percentage of DM were compared for alcohol-drinking groups (Appendix Table 8, Figure 7). The respective numbers of participants who were heavy, moderate, mild alcohol-drinkers were 8 51, 9 88 and 2 991 for black, 1 709, 2 044 and 5 686 for white, and 709, 880 and 1 930 for Mexican-American participants. Interestingly, heavy and moderate alcohol-drinkers had lower mean prevalence of DM than mild alcohol-drinkers. The association of moderate drinking with diabetes was significantly different from mild drinking (P=0.004), otherwise, the differences among the alcohol-drinking groups were not obvious.
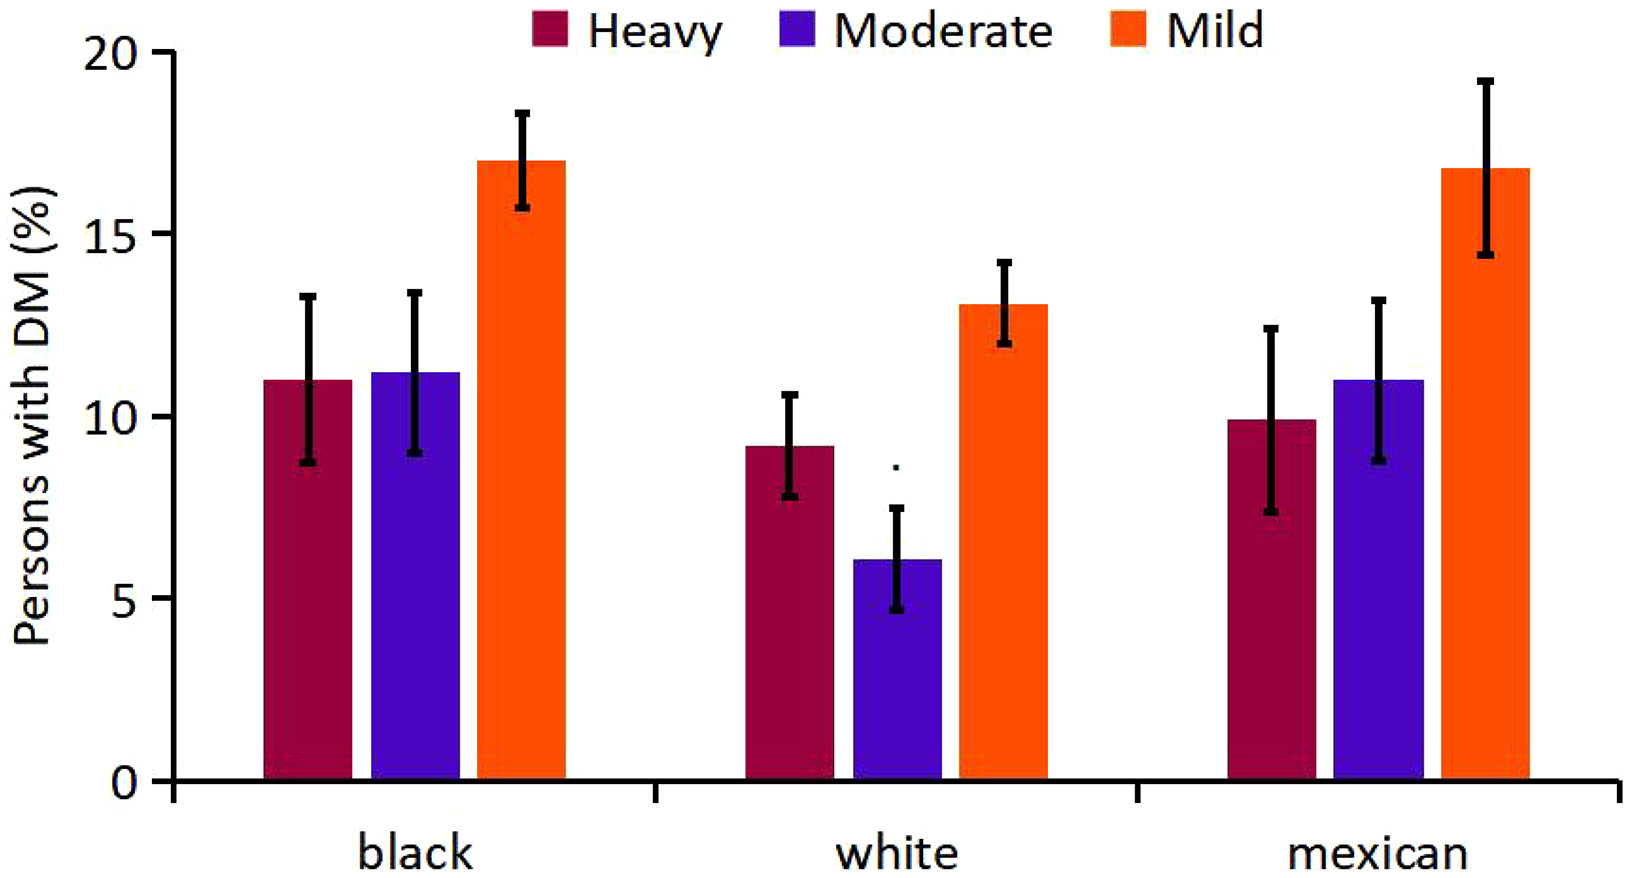
Figure 7 Analysis on the Mean percentage of participants with DM in alcohol-drinking groups of different races.
For demographic characteristics, reports have confirmed that the biological factors affecting the pathophysiology of diabetes differ from race or nationality, and may be influenced by social factors, such as different cultural backgrounds (17–24). Data from the Centers for Disease Control and Prevention shows that the probability of some racial and ethnic groups being diagnosed with diabetes in the USA is much higher than that of whites, which was reviewed in Lancet (25). At the moment of the COVID-19 pandemic, the risk of diabetes among the black population has further increased, and is inextricably linked with income, education, occupation, housing, food security, social support and other factors (25). Our analysis overcame the problem of insufficient data in the past to extend population-based observations that the prevalence of diabetes differ by sex and age. Males are slightly more likely to have diabetes than female counterparts, which was also confirmed by a recent study on the mechanism of gender difference inducing diabetes (26). In addition, prevalence of diabetes were lower in younger persons. These sex- and age-related differences in percentage of participants with diabetes were consistently seen in all 3 major ethnic groups. Among the basic 3 factors, ethnicity is more closely related with diabetes and is one of the factors that increase its incidence. The current analysis shows that DM is most common among male black elderly, and certain reports have described similar findings (26, 27). This population-based report suggests broad genetic influences. The findings in the current analysis were consistent and robust for the observed differences in age, sex, and ethnicity (24, 28–31).
In addition, most participants with DM had fasting plasma glucose (FPG) of more than 125 mg/dL. Due to the different criteria for diabetes (7, 14, 32–35), the standard we adopted (14) is consistent with AACE/ACE standard (32), which is widely recognized. Although it is tempting to suggest that the NHANES database should collect data on diabetes with reference to a given standard, such a recommendation may be premature. The detailed clinical data of NHANES have its own considerations, with considerable independence and objectivity, therefore, the research reference criteria of different researchers may vary, and a reasonable and valid judgment criterion needs to be further confirmed.
For physical indicators, our study shows that people with diabetes have shorter legs than those without diabetes, which confirms the findings from a cross-sectional analysis of data about simple-measured leg muscle strength and the prevalence of diabetes among Japanese males (36). Some studies have shown that stretching the leg can reduce the incidence of diabetes (37–39). BMI is a comprehensive embodiment of weight and height, which has certain reference value for studying the influence of obesity and overweight on diabetes. Our finding of a higher BMI being associated with diabetes prevalence is consistent with the known effectiveness of weight control in treating diabetes (30, 31). Interestingly, in the study TCHOL tends to be lower in diabetic patients, and little research on this area (40). In addition, for participants with DM, the distribution of leg length, BMI and TCHOL varies among ethnic groups, which also illustrates the association of race with diabetes.
With regard to living habits, smoking had a modest association with diabetes prevalence. This finding was also seen in a prospective study published (41). Smoking may increase the risk of diabetes through a variety of mechanisms, with tobacco-induced insulin resistance (IR) and hyperinsulinism (HIS) as the main mechanisms. Currently the mechanism of smoking causing and aggravating IR is not completely concluded. It is quite consistent that chronic smoking may lead to lipid metabolism disorders, increased abdominal obesity and vascular endothelial dysfunction (41–46). Smoking statistically had a large effect on the increased percentage of DM among white participants and had minimal effect on black and Mexican-American participants. To our knowledge, this may be the first report of such an observation, and its significance is unknown.
As for alcohol, interestingly, heavy and moderate drinkers had lower mean prevalence of DM than mild drinkers and the association of moderate drinking with DM was significantly different from mild drinking. A large meta-analysis illustrated a similar effect that reductions in risk of DM among moderate alcohol drinkers may be confined to women and non-Asian populations (47).
There are some limitations in our study. Firstly, the study focuses mainly on the prevalence of diabetes and did not explore associated complications. Secondly, the data on fasting plasma glucose is relatively limited, resulting in a large reduction in the sample size in the classification of statistics. Thus, the results of the analysis based on these data may be exaggerated. However, the prevalence of diabetes among ethnic groups is probably not affected, because participants with missing data were evenly distributed among all 3 groups. Third, the observed relationships were limited to adults of 3 races in the US and not include other races, particularly Asian-Americans, which may have limited the extrapolation of the results. Given these limitations, a well-designed prospective cohort trial is needed to validate our results.
It can be concluded that DM is more common in the general population than might be clinically recognized, and the prevalence of DM was associated to varying degrees with many indicators of demographic characteristics (race, gender, age), physical indicators (leg length, BMI, TCHOL), and living habits (smoking, alcohol-drinking). When deciding whether a thorough diagnostic assessment of diabetes is needed, not only the clinical symptoms should be considered, but also these indicators. They should be linked with medical resource allocation and scientific treatment methods to comprehensively implement the treatment of DM.
Publicly available datasets were analyzed in this study. This data can be found here: https://www.cdc.gov/nchs/nhanes/index.htm.
LF was involved in all parts of the study, design, acquisition of data, analysis, interpretation, drafting of paper, and final approval. HS and YT participated in data analysis and helped to revise the manuscript. QZ coordinated and supervised data collection, and critically reviewed the manuscript for important intellectual content. All authors approved the final version as submitted, and agree to be accountable for all aspects of the work.
This research was supported by National Natural Science Foundation of China (Grant Nos. 81470543, 81774295, and 81873296), and partly by Natural Science Basic Research Plan in Shaanxi Province of China (Grant No. 2016JM8049).
The authors declare that the research was conducted in the absence of any commercial or financial relationships that could be construed as a potential conflict of interest.
All claims expressed in this article are solely those of the authors and do not necessarily represent those of their affiliated organizations, or those of the publisher, the editors and the reviewers. Any product that may be evaluated in this article, or claim that may be made by its manufacturer, is not guaranteed or endorsed by the publisher.
The Supplementary Material for this article can be found online at: https://www.frontiersin.org/articles/10.3389/fendo.2023.1088882/full#supplementary-material
1. Lu X, Zhao C. Exercise and type 1 diabetes. Adv Exp Med Biol (2020) 1228:107–21. doi: 10.1007/978-981-15-1792-1_7
2. Fang L, Zhang Q. Research progress in improving insulin resistance of type 2 diabetes mellitus with traditional Chinese medicine. Lishizhen Med Materia Med Res Q24 (2017) 28(12):2974–6. doi: 10.3969/j.issn.1008-0805.2017.12.056
3. Brown DM, Tuomi L, Shapiro H. Anatomical measures as predictors of visual outcomes in ranibizumab-treated eyes with neovascular age-related macular degeneration. Retina (2013) 33:23–34. doi: 10.1097/IAE.0b013e318263cedf
4. Bavuma C, Sahabandu D, Musafiri S, Danquah I, McQuillan R, Wild S, et al. Atypical forms of diabetes mellitus in africans and other non-European ethnic populations in low- and middle-income countries: a systematic literature review. Edinburgh Univ Global Health Soc (2019) 9(2). doi: 10.7189/jogh.09.020401
5. Sarvar KN, Cliff P, Saravanan P, Khunti K, Nirantharakumar K, Narendran P, et al. Comorbidities, complications and mortality in people of south Asian ethnicity with type 1 diabetes compared with other ethnic groups: a systematic review. BMJ (2017) 7:e015005. doi: 10.1136/bmjopen-2016-015005
6. Cameron NA, Petito LC, McCabe M, Allen NB, OBrien MJ, Carnethon MR, et al. Quantifying the sex-Race/Ethnicity-Specific burden of obesity on incident diabetes mellitus in the united states, 2001 to 2016: MESA and NHANES. J Am Heart Assoc (2021) (0216) 10(4):e018799. doi: 10.1161/JAHA.120.018799
7. Semerdjian J, Frank S. An ensemble classifier for predicting the onset of type II diabetes. (2017). doi: 10.48550/arXiv.1708.07480
8. Ali A, Dorota J, Van JCHM, Martin CG. Body mass index and incident type 1 and type 2 diabetes in children and young adults: A retrospective cohort study. J Endocrine Soc (2017) 1(5):524–37. doi: 10.1210/js.2017-00044
9. National Diabetes Data Group. Classification and diagnosis of diabetes mellitus and other categories of glucose intolerance. Diabetes (1979) 28:1039–57. doi: 10.2337/diab.28.12.1039
10. Centers for Disease Control and Prevention (CDC). About the national health and nutrition examination survey (2017). Available at: https://www.cdc.gov/nchs/nhanes/about_nhanes.htm.
11. National Center for Health Statistics. NHANES 2009-2010 overview . Available at: https://wwwn.cdc.gov/nchs/nhanes/continuousnhanes/overview.aspx?BeginYear=2009.
12. National Center for Health Statistics. 2017-2018 data documentation, codebook, and frequencies body measures (BMX_J) . Available at: https://wwwn.cdc.gov/Nchs/Nhanes/2017-2018/BMX_J.htm.
13. National Center for Health Statistics. 2017-2018 data documentation, codebook, and frequencies cholesterol - total (TCHOL_J) . Available at: https://wwwn.cdc.gov/Nchs/Nhanes/2017-2018/TCHOL_J.htm.
14. American Diabetes Association. Standards of medical care in diabetes–2010. Diabetes Care (2010) 33(Suppl 1):S11–61. doi: 10.2337/dc10-S011
15. Hsieh MM, Everhart JE, Byrd-Holt DD, Tisdale JF, Rodgers GP. Prevalence of neutropenia in the U.S. population: age, sex, smoking status, and ethnic differences. Ann Intern Med (2007) 146(7):486–92. doi: 10.7326/0003-4819-146-7-200704030-00004
16. Rattan P, Penrice DD, Ahn JC, Ferrer A, Patnaik M, Shah VH, et al. Inverse association of telomere length with liver disease and mortality in the US population. Hepatol Commun (2022) 6(2):399–410. doi: 10.1002/hep4.1803
17. Bonham GS, Brock DB, et al. The relationship of diabetes with race, sex, and obesity. Am J Clin Nutr (1985) 41(4):776–83. doi: 10.1093/ajcn/41.4.776
18. American Diabetes Association. Introduction: Standards of medical care in diabetes-2020. Diabetes Care (2020) 43(Suppl 1):S1–2. doi: 10.2337/dc20-Sint
19. American Diabetes Association. Diabetes care in the hospital: Standards of medical care in diabetes–2020. Diabetes Care (2020) 43(Supplement_1):S193–202. doi: 10.2337/dc20-S015
20. Services H. Is self-efficacy associated with diabetes self-management across race/ ethnicity and health literacy. Diabetes Care (2006) 29(4):823–9. doi: 10.2337/diacare.29.04.06.dc05-1615
21. Tuchman AM. Diabetes and RACE: A historical perspective. Am J Public Health (2011) 101(1):24–33. doi: 10.2105/AJPH.2010.202564
22. Centers for Disease Control and Prevention. National diabetes statistics report, 2017 . Available at: https://www.cdc.gov/diabetes/pdfs/data/statistics/national-diabetes-statistics-report.pdf. (Accessed September 16).
23. Mechanick JI, Davidson JA, Fergus IV, Galindo RJ, McKinney KH, Petak SM, et al. Transcultural diabetes care in the united states – a position statement by the American association of clinical endocrinologists. Endocrine Pract (2019) 25(7):729–65. doi: 10.4158/PS-2019-0080
24. Antonio-Villa NE, Fernandez-Chirino L, Vargas-Vazquez A, Fermin-Martinez CA, Aguilar-Salinas CA, Bello-Chavolla OY, et al. Prevalence trends of diabetes subgroups in the united state: A data-driven analysis spanning three decades from NHANES (1998-2018). JCE&M (2022) 107:735–42. doi: 10.1210/clinem/dgab762
25. Endocrinology T. A widening racial and social gap in diabetes. Lancet Diabetes Endocrinol (2021) 9(8):471. doi: 10.1016/S2213-8587(21)00183-2
26. Delaney KZ, Santosa S. Sex differences in regional adipose tissue depots pose different threats for the development of type 2 diabetes in males and females. Obes Rev (2022) 03:23(3). doi: 10.1111/obr.13393
27. Ezzatvar Y, Ramírez-Vélez R, Izquierdo M, et al. Racial differences in all-cause mortality and future complications among people with diabetes: a systematic review and meta-analysis of data from more than 2.4 million individuals. Diabetologia (2021) 11:64(11). doi: 10.1007/s00125-021-05554-9
28. Cheng YJ. Prevalence of diabetes by race and ethnicity in the united states, 2011-2016. J Am Med Assoc (2019) 322(24):2389–98. doi: 10.1001/jama.2019.19365
29. Sheng ZY, Wang ZX, Shao AH. The sex difference on genetics of type 2 diabetes. Shanghai J Prev Med (2000) 01):40+42. doi: 10.19428/j.cnki.sjpm.2000.01.026
30. Aggarwal R, Binbbins-Domingo K, Yeh RW, Song Y, Chiu N, Wadhera RK, et al. Diabetes screening by race and ethnicity in the united states: Equivalent BMI and age thresholds. Ann Internal Med (2022) 175:765–73. doi: 10.7326/M20-8079
31. Menke A, Rust KF, Fradkin J, Cheng YJ, Cowie CC. Associations between trends in Race/Ethnicity, aging, and body mass index with diabetes prevalence in the united states: A series of cross-sectional studies. Ann Internal Med (2014) 161:328–35. doi: 10.7326/M14-0286
32. Hsia J, Guthrie NL, Lupinacci P, Gubbi A, Denham D, Berman MA, et al. Randomized, controlled trial of a digital behavioral therapeutic application to improve glycemic control in adults with type 2 diabetes. Diabetes Care (2022) 45(12):2976–81. doi: 10.2337/dc22-1099
33. Boulton A, Armstrong DG, Albert SF, Frykberg RG, Hellman R, Kirkman MS, et al. Comprehensive fool examination and risk assessment: A report of the task force of the foot care interest group of the American diabetes association, with endorsement by the American association of clinical endocrinologists. Endocrine Pract Off J Am Coll Endocrinol Am Assoc Clin Endocrinologists (2015) 14(5):576. doi: 10.4158/EP.14.5.576
34. Handelsman FY, Jeffrey I, Mechanick MD, Grunberger G, Bloomgarden ZT, Bray GA, et al. American Association of clinical endocrinologists medical guidelines for clinical practice for developing a diabetes mellitus comprehensive care plan: Executive summary - ScienceDirect. Endocrine Pract (2011) 17(2):287–302. doi: 10.4158/EP.17.2.287
35. Handelsman Y, Bloomgarden ZT, , Grunberger G, Umpierrez G, Zimmerman RS, Bailey TS, et al. American Association of clinical endocrinologists and American college of endocrinology - clinical practice guidelines for developing a diabetes mellitus comprehensive care plan - 2015. Endocrine Pract Off J Am Coll Endocrinol Am Assoc Clin Endocrinologists (2015) 21:11–87. doi: 10.4158/EP15672.GL
36. NHLBI Obesity Education Initiative Expert Panel on the Identification, Evaluation, and Treatment of Obesity in Adults (US). Clinical guidelines on the identification, evaluation, and treatment of overweight and obesity in adults: The evidence report. In: Overweight and obesity: Background. Bethesda (MD: National Heart, Lung, and Blood Institute (1998). Available at: https://www.ncbi.nlm.nih.gov/books/NBK1995/.
37. Miyamoto R, Savada SS, Gando Y, Matsushita M, Kawakami R, Muranaga S, et al. Simple-measured leg muscle strength and the prevalence of diabetes among Japanese males: a cross-sectional analysis of data from the kameda health study. J Phys Ther Sci (2020) 32(1):1–6. doi: 10.1589/jpts.32.1
38. Sakamoto A, Ikeda M. Clinical characteristics of lower-limb ischemia in Japanese patients with type 2 diabetes and usefulness of the great toe blood flow as a predictive indicator of leg arterial obstruction. Healthcare (Basel) (2022) 10(9):1753. doi: 10.3390/healthcare10091753
39. Bisconti AV, Cè E, Longo S, Venturelli M, Coratella G, Limonta E, et al. Evidence for improved systemic and local vascular function after long-term passive static stretching training of the musculoskeletal system. J Physiol (2020) 598(17):3645–66. doi: 10.1113/JP279866
40. Diane M, Désirée MEN, Pierre N, Serge AOD, Servais EB, Dieudonne A, et al. Evaluation of C-peptide in Type 2 Diabetic Patient in Douala Cameroon: C-peptide Correlation with BMI and Duration of Diabetes, vol. 5. Science Publishing Group (2021) 9(5):236–8. doi: 10.11648/J.AJBLS.20210905.12
41. Liu C, Foti K, Grams ME, Shin J, Selvin E. Trends in self-reported prediabetes and metformin use in the USA: NHANES 2005-2014. J Gen Intern Med (2020) 35:95–101. doi: 10.1007/S11606-019-05398-5
42. Kumarasena AK. To find the actual risk factors for coronary artery disease in non-insulin dependent diabetes mellitus, influence of the LADA patients should be removed[J]. BMJ (2021) 316(7134):823–8. doi: 10.1136/bmj.316.7134.823
43. Cai X, Chen Y, Yang W, Gao X, Han X, Ji L, et al. The association of smoking and risk of diabetic retinopathy in patients with type 1 and type 2 diabetes: a meta-analysis. J neurosurgical Sci (2018) 62:299–306. doi: 10.1007/s12020-018-1697-y
44. Rodrigues Cimini CC, Maia JX, Pires MC, Ribeiro LB, Pinto VS, Batchelor J, et al. Pandemic-related impairment in the monitoring of patients with hypertension and diabetes and the development of a digital solution for the community health worker: quasi-experimental and implementation study. (2022) 10(3):e35216. doi: 10.2196/35216
45. Zhu P, Pan XF, Sheng L, Chen H, Pan A. Cigarette smoking, diabetes, and diabetes complications: Call for urgent action. Curr Diabetes Rep (2017) 17:78. doi: 10.1007/s11892-017-0903-2
46. Zhu B, Zheng Q, Sun G. The association between passive smoking and type 2 diabetes: A meta-analysis. Asia Pac J Public Health (2014) 26:226–37. doi: 10.1177/1010539514531041
Keywords: NHANES, diabetes, leg length, BMI, total cholesterol, living habits
Citation: Fang L, Sheng H, Tan Y and Zhang Q (2023) Prevalence of diabetes in the USA from the perspective of demographic characteristics, physical indicators and living habits based on NHANES 2009-2018. Front. Endocrinol. 14:1088882. doi: 10.3389/fendo.2023.1088882
Received: 03 November 2022; Accepted: 21 February 2023;
Published: 07 March 2023.
Edited by:
Monique Francois, University of Wollongong, AustraliaReviewed by:
George Arthur Werther, Royal Children’s Hospital, AustraliaCopyright © 2023 Fang, Sheng, Tan and Zhang. This is an open-access article distributed under the terms of the Creative Commons Attribution License (CC BY). The use, distribution or reproduction in other forums is permitted, provided the original author(s) and the copyright owner(s) are credited and that the original publication in this journal is cited, in accordance with accepted academic practice. No use, distribution or reproduction is permitted which does not comply with these terms.
*Correspondence: Qi Zhang, NTUwOTk2MTg5QHFxLmNvbQ==
Disclaimer: All claims expressed in this article are solely those of the authors and do not necessarily represent those of their affiliated organizations, or those of the publisher, the editors and the reviewers. Any product that may be evaluated in this article or claim that may be made by its manufacturer is not guaranteed or endorsed by the publisher.
Research integrity at Frontiers
Learn more about the work of our research integrity team to safeguard the quality of each article we publish.