 Hongye Peng1*†
 Liang Pan2†
 Simiao Ran3†
 Miyuan Wang4Shuxia Huang1Mo Zhao1
 Zhengmin Cao1
 Ziang Yao1Lei Xu1Qing Yang5
 Wenliang Lv1*
- 1Department of Infection, Guang’anmen Hospital, China Academy of Chinese Medical Sciences, Beijing, China
- 2Phase 1 Clinical Trial Center, Deyang People’s Hospital, Sichuan, China
- 3Department of Gastroenterology, HuangGang Hospital of Traditional Chinese Medicine (TCM) Affiliated to Hubei University of Chinese Medicine, Huanggang, Hubei, China
- 4School of Public Health, Tongji Medical College, Huazhong University of Science and Technology, Wuhan, Hubei, China
- 5School of Foreign Languages and Culture, Nanchang University, Nanchang, Jiangxi, China
Introduction: Metabolic dysfunction-associated fatty liver disease (MAFLD), formerly known as non-alcoholic fatty liver disease (NAFLD), has become the most common chronic liver disease worldwide. We aimed to explore the gender-related association between nine indexes (BMI/WC/VAI/LAP/WHtR/TyG/TyG-BMI/TyG-WC/TyG-WHtR) and MAFLD/NAFLD and examine their diagnostic utility for these conditions.
Methods: Eligible participants were screened from the 2017-2018 cycle data of National Health and Nutrition Examination Survey (NHANES). Logistic regression and receiver operating characteristic (ROC) curve were used to assess the predictive performance of 9 indexes for MAFLD/NAFLD.
Results: Among the 809 eligible individuals, 478 had MAFLD and 499 had NAFLD. After adjusting for gender, age, ethnicity, FIPR and education level, positive associations with the risk of MAFLD/NAFLD were found for all the nine indexes. For female, TyG-WHtR presented the best performance in identifying MAFLD/NAFLD, with AUC of 0.845 (95% CI = 0.806-0.879) and 0.831 (95% CI = 0.791-0.867) respectively. For male, TyG-WC presented the best performance in identifying MAFLD/NAFLD, with AUC of 0.900 (95% CI = 0.867-0.927) and 0.855 (95% CI = 0.817-0.888) respectively.
Conclusion: BMI/WC/VAI/LAP/WHtR/TyG/TyG-BMI/TyG-WC/TyG-WHtR are important indexes to identify the risk of MAFLD and NAFLD.
1. Introduction
Non-alcoholic fatty liver disease (NAFLD) is a syndrome including non-alcoholic fatty liver, non-alcoholic steatohepatitis, associated cirrhosis, liver cancer, and other diseases. It is defined by excessive fat accumulation in hepatocytes that is not caused by alcohol or other clear liver injury. NAFLD is the most common chronic liver disease in the world today, affecting the health of 25.24% adults (1). Previous studies have confirmed that NAFLD is closely associated with several metabolic diseases, such as hyperlipidemia, diabetes (2), and hypertension (3).NAFLD has been commonly linked to the metabolic syndrome (MetS). The 2020 International Expert Consensus recommended renaming NAFLD as metabolic dysfunction-associated fatty liver disease (MAFLD) to better meet clinical and research needs due to the rising prevalence of NAFLD, the improved understanding of its pathogenesis, and the drawbacks and shortcomings of previous exclusionary diagnoses (4). Although some existing studies suggest that MAFLD may be more advantageous in identifying advanced fibrosis and metabolic abnormalities, there still is limited evidence and not much research on MAFLD (5).
Patients with fatty livers have the risk of not only developing in cirrhosis and liver cancer, but also developing diabetes, cardiovascular disease, and kidney disease (6), which seriously affect their life quality and health. According to Younossi et al., NAFLD is anticipated to affect over 64 million people in the United States, with direct medical costs of about $103 billion annually ($1,613 for each patient) (7). Additionally, the prevalence of adult obesity, diabetes, and aging will all contribute to an increase in NAFLD-related liver disease and mortality. More than 800,000 liver deaths are projected between 2015 and 2030 (8). Therefore, early diagnosis and identification of fatty liver disease is critical in safeguarding the health of the population and reducing the financial burden of national health. Pathological biopsy, a gold standard for diagnosing fatty liver disease, is expensive, invasive, and accompanied by postoperative complications (9). Exploring easy-to-use, practical, and reliable predictors of fatty liver disease is clinically significant and valuable.
Obesity is one of the common causes of hepatic steatosis and is closely linked to insulin resistance (IR). However, increasing studies suggest that adipose tissue has a variety of functions and some adipose tissue is harmless to the body, such as brown fat (10). In addition, the distribution site of adipose tissue is also closely related to health status (11). We cannot simply assume that high body weight and excessive fat accumulation indicate poor health status since there are phenotypes of metabolically healthy obese (MHO) and metabolically unhealthy non-obese (MUNO) (12, 13). Visceral adiposity and lipid accumulation may, to some extent, assess more accurately the role of adipose tissue in the physiopathological processes as well as its value in predicting disease risk. Visceral adiposity index (VAI), proposed by Amato et al. (14), is a novel body fat index integrating waist circumference, body mass index (BMI), triglycerides (TG), and high-density lipoprotein cholesterol (HDL-C) and is considered a reliable predictor of visceral adiposity. The relationship between VAI and metabolism-associated diseases is also widely investigated recently. A 4-year prospective cohort study suggested that VAI level was an independent risk factor for NAFLD, and there was a dose-response relationship between them (15). Lipid accumulation product (LAP), an easily accessible index consisting of waist circumference and triglycerides, may better reflect the extent of lipid accumulation compared to central obesity alone (16). Dai et al. confirmed that LAP was highly linked to the incidence and severity of NAFLD and a reliable predictor of NAFLD risk in Chinese adults (17). Triglyceride-glucose (TyG) index, a reliable surrogate for IR assessment, is closely associated with cardiovascular disease (18), diabetes mellitus (19), diabetic nephropathy (20) and various diseases. TyGis found to be important in identifying individuals at risk for NAFLD and assessing the progression of liver fibrosis (21, 22). More studies suggest that TyG-BMI, TyG-WC and TyG-WHtR are reliable indicators for NAFLD (23–25). BMI is widely used for obesity measurement, while waist circumference (WC) and waist-to-height ratio (WHtR) are important indicators for central obesity assessment. However, there is little research on the differences among BMI, WC, VAI, LAP, WHtR, TyG, TyG-BMI, TyG-WC and TyG-WHtR in predicting the risk of MAFLD/NAFLD.
This study intends to explore the differences among those indexes in predicting the risk of MAFLD/NAFLD based on the data of US adults in the 2017-2018 cycle from National Health and Nutrition Examination Survey (NHANES), aiming to provide a reliable reference for early detecting and identifying indicators of MAFLD/NAFLD.
2. Materials and methods
2.1. Study design and participants
All individuals aged ≥ 20 years from the cycle 2017 to 2018 of the NHANES in the United States were screened in this study. Profiles of the NHANES were described in previous study (26). The NHANES gathered a representative sample from the non-institutionalized U.S. population using a complicated, multi-stage, and probability sampling strategy. All data were collected with household interviews, mobile physical examinations, and laboratory tests. The participant screening flow chart was displayed in Figure 1. From all 9,254 individuals, we excluded participants aged< 20 years (n =3,685), drinking heavily (n=1,589), positive serology for hepatitis B, C and D (n=738), missing data of liver ultrasound transient elastography (FibroScan®) (n= 691), taking lipid-lowering drugs (n=650), and missing important data to calculate 9 indicators (n = 1,092). Finally, 809 participants were included for analysis. The Research Ethics Review Board of the National Center for Health Statistics examined and approved the NHANES protocol. Each participant completed a written statement of informed consent.
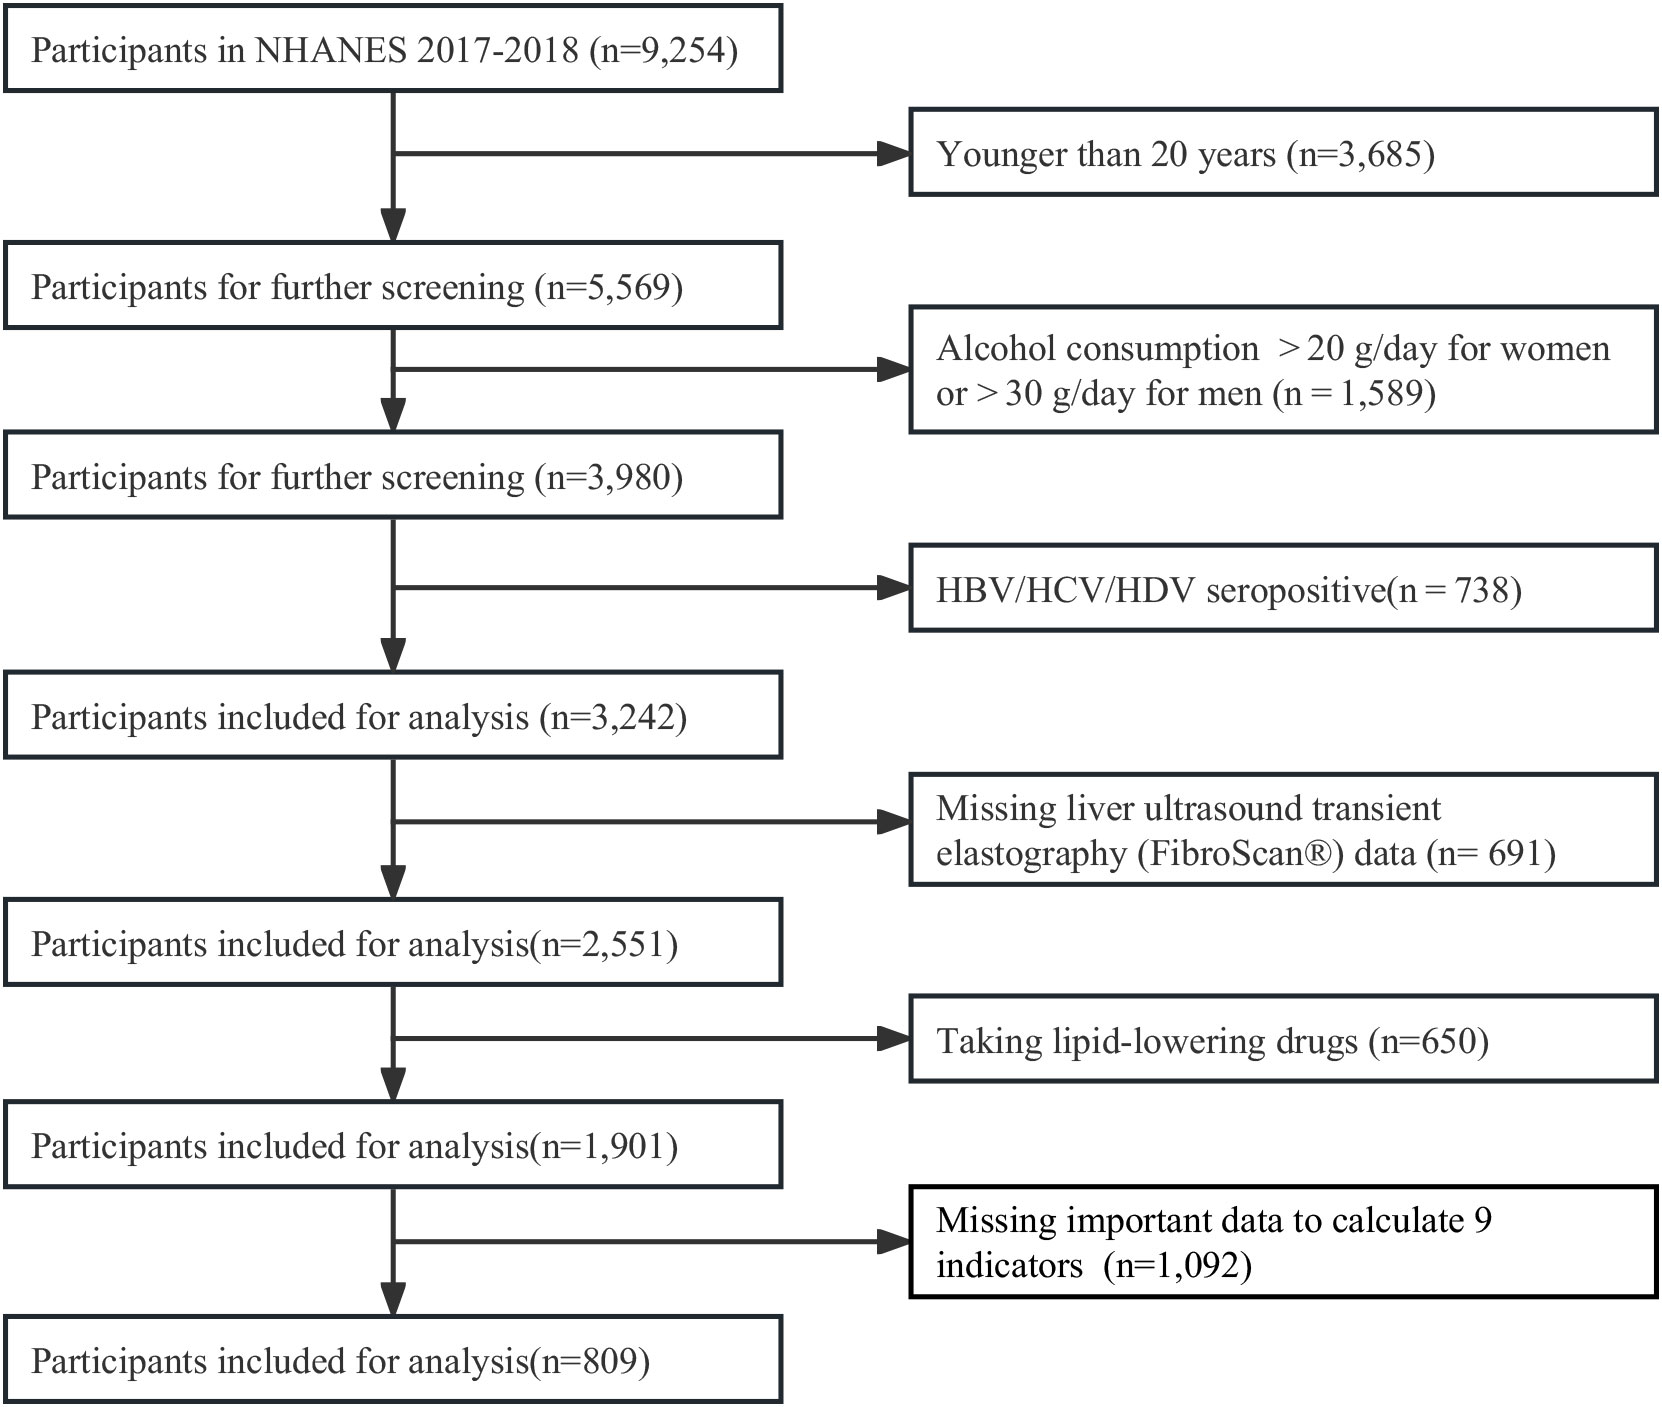
Figure 1 Flow chart for the selection of participants in the cross-sectional study.
2.2. Definition of MAFLD and NAFLD
MAFLD was defined by presence of hepatic steatosis (HS) on ultrasound and meeting at least one of three conditions: overweight/obesity, presence of T2DM, or presence of metabolic disorder (27). Lean/normal-weight individuals with HS but no T2DM were considered to have a metabolic disorder if two or more of the following metabolic risk abnormalities were present: 1) WC ≥102cm in males or 88 cm in females, 2) blood pressure ≥130/85mmHg or specific medications, 3) serum TG ≥1.70mmol/L or specific medications, 4) HDL-C< 1.0mmol/L for males and < 1.3mmol/L for females, 5) prediabetes (a fasting glucose level between 5.6 and 6.9mmol/L, or a 2-hour post-load glucose level between 7.8 and 11.0mmol/L or an hemoglobin A1c (HbA1c) level between 5.7% and 6.4%), 6) a HOMA-IR score ≥ 2.5 and 7) a plasma C-reactive protein level > 2mg/L.
NAFLD was defined by presence of HS on ultrasound, excluding heavy drinking individuals (those consuming alcohol > 20 g/day for females or > 30 g/day for males) and other competing etiology for HS (those with hepatitis B/C/D positive serology). Considering that transient elastography (FibroScan®, TE) with controlled attenuation parameters (CAP) presented good accuracy in determining the level of hepatic steatosis (28), HS was diagnosed by FibroScan with CAP values ≥238 dB/m (29).
2.3. Nine indirect indexes and laboratory measurement
All participants were interviewed at home and physically examined at a mobile examination center (MEC). They were also required to fast at least nine hours before blood sampling. Height and weight were measured at the MEC following protocol and then used to calculate BMI, rounding to one decimal place. At the end of a normal exhale and while standing naturally with the legs spread out approximately 25-30 cm apart, WC was measured using an inelastic ruler with a minimum scale of one millimeter. The ruler was placed at the midpoint of the connecting line between the upper edge of the top of the iliac crest and the lower edge of the 12th rib (the narrowest part of the waist) and circled horizontally the abdomen, and readings were rounded to 0.1cm (30). After resting for at least 5 minutes, participants were measured with blood pressure using a standardized mercury sphygmomanometer in a sitting position.
Laboratory methods for measuring lipid profile, HbA1c, glucose, insulin, and plasma C-reactive protein level were described by CDC (31).
Alcohol consumption was calculated with self-reported information on drinking status within the last year. The consumed alcohol was reported in standard drinks and converted to grams using a multiplication factor of 14.
Indexes for assessment were calculated by using the following formulas (14, 16, 32):
BMI=weight (kg)/height2 (m);
VAI=WC (cm)/(39.68 + 1.88 x BMI (kg/m2)) x TG (mmol/L)/1.03 x 1.31/HDL-C (mmol/L) for males
VAI=WC (cm)/(36.58 + 1.89 x BMI (kg/m2)) x TG (mmol/L)/0.81 x 1.52/HDL-C (mmol/L) for females
LAP= [WC (cm)-65] x TG (mmol/L) for males
LAP= [WC (cm)-58]x TG (mmol/L) for females
WHtR = WC (cm)/height (cm)
TyG = Ln [TG (mg/dL) x FPG (mg/dL)/2]
TyG-BMI= TyG x BMI
TyG-WC = TyG x WC (cm)
TyG-WHtR = TyG x WHtR
2.4. Covariates
Age, gender, ethnicity (Mexican American, non-Hispanic white, non-Hispanic black and others), family income-poverty ratio (FIPR) level, education level (less than high school, high school or equivalent, and college or above) and other demographic and lifestyle characteristics extracted from household questionnaires and used as covariates. Histories of hypertension, high cholesterol and diabetes referred to self-reported diagnosis of a particular disease. More details of the aforementioned characteristics are publicly available on the NHANES website.
2.5. Statistical analysis
The statistical analysis was performed in accordance with the CDC guidelines (https://www.cdc.gov/nchs/nhanes/tutorials/default.aspx), using R software (http://www.R-project.org, The R Foundation R.3.4.3). And MedCalc version 13.0 for Windows (MedCalc Software, Mariakerke, Belgium) was used for significance tests in AUC comparison.
Normally distributed data were expressed as mean ± standard deviation (SD), while abnormally distributed data were expressed as the median of the interquartile range (IQR) (25%, 75%). Characteristics were analyzed between the MAFLD group and the non-MAFLD group using Student’s t-test, chi-square test or Mann-Whitney U test, as well as between the NAFLD group and the non-NAFLD group. Three logistic models were employed to estimate the odds ratio (OR) with a 95% confidence interval (CI) for MAFLD/NAFLD using nine indirect indexes (BMI, WC, VAI, LAP, WHtR, TyG, TyG-BMI, TyG-WC and TyG-WHtR) and MAFLD/NAFLD as continuous variables (per inter-quartile range (IQR) increment). Model 1 contained only independent variables. Model 2 was adjusted for gender, age, ethnicity, FIPR and education level. Model 3 was further adjusted for hypertension, high cholesterol and diabetes history. Results were presented with odds ratios (ORs) and confidence intervals (95% CIs). The receiver operating characteristic (ROC) curve and the area under curve (AUC) were used to assess the predictive performance of the nine indexes for MAFLD/NAFLD. DeLong et al’s non-parametric method was used to compare the AUC between TyG-WC and other indexes. The best cutoff values of the nine indexes for predicting MAFLD/NAFLD were determined based on the maximum value of the sum of sensitivity and specificity. Statistical significance was set to P<0.05.
3. Results
3.1. Characteristics of the participants
Of all 5,569 individuals aged ≥20 years in cycle 2017-2018 of NHANES, we excluded those missing important data (Figure 1). At last, we included 809 participants with complete ultrasound and required data for the evaluation of MAFLD/NAFLD.
The demographic and clinical characteristics of participants, grouped as non-MAFLD, MAFLD, non-NAFLD and NAFLD were shown in Table 1. Among all the 809 participants, there were 478 participants with MAFLD and 499 participants with NAFLD, respectively. The proportion of male and female was 50.43% and 49.57%, respectively. The mean age was 46.0 (33.0, 60.0) years. Participants with and without MAFLD/NAFLD had statistically different baseline characteristics, except for FIPR and education level. However, there was no statistical difference in gender between the two groups with and without MAFLD. Participants with MAFLD/NAFLD were more likely to be older and have hypertension/high cholesterol/diabetes. More importantly, participants with MAFLD/NAFLD had higher BMI/WC/VAI/LAP/WHtR/TyG/TyG-BMI/TyG-WC/TyG-WHtR levels.
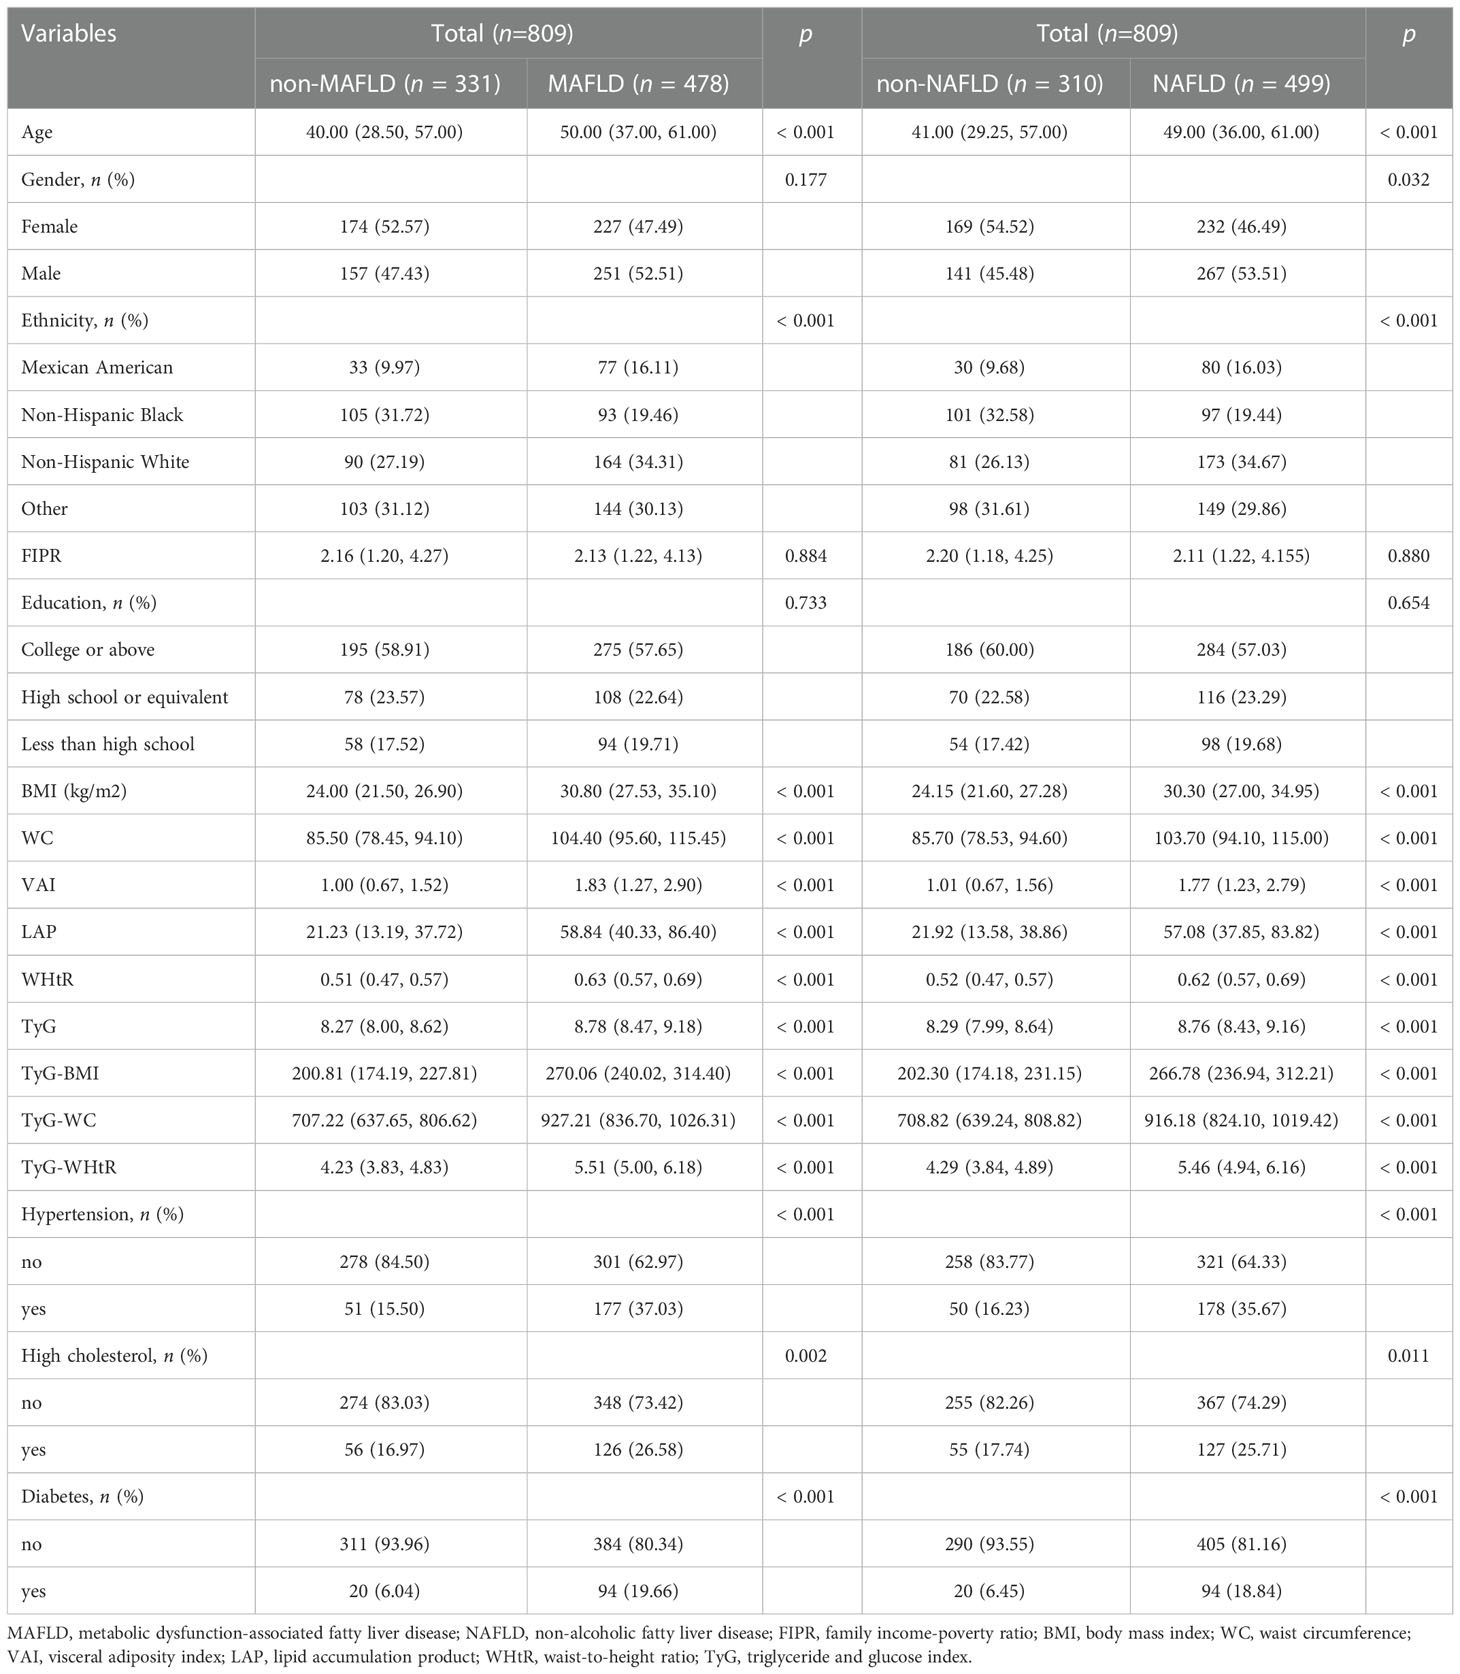
Table 1 Basic characteristics of participants by MAFLD and NAFLD in NHANES 2017-2018.
3.2. Associations between nine indirect indexes and NAFLD/MAFLD
Table 2 showed the multi-variate adjusted ORs and 95% CIs of MAFLD/NAFLD risks in relation to the quartile increment of nine indexes levels. After adjusting for gender, age, ethnicity, FIPR and education level, all those nine indexes were positive correlated with the risks of MAFLD/NAFLD. For MAFLD, TyG-WC presented the highest OR (OR = 28.435, 95% CI = 12.121 to 66.705), followed by TyG-WHtR (OR = 26.863, 95% CI = 12.417 to 58.115), TyG-BMI (OR = 17.196, 95% CI = 7.193 to 41.110), LAP (OR = 16.609, 95% CI = 7.927 to 34.797), WC (OR = 15.449, 95% CI = 7.440 to 32.077), WHtR (OR = 15.005, 95% CI = 8.052 to 27.964), BMI (OR = 10.986, 95% CI = 5.317 to 22.698), TyG (OR = 5.901, 95% CI = 3.825 to 9.102), and VAI (OR = 4.651, 95% CI = 2.966 to 7.295). Similar results were found after adjusting for all the covariates.
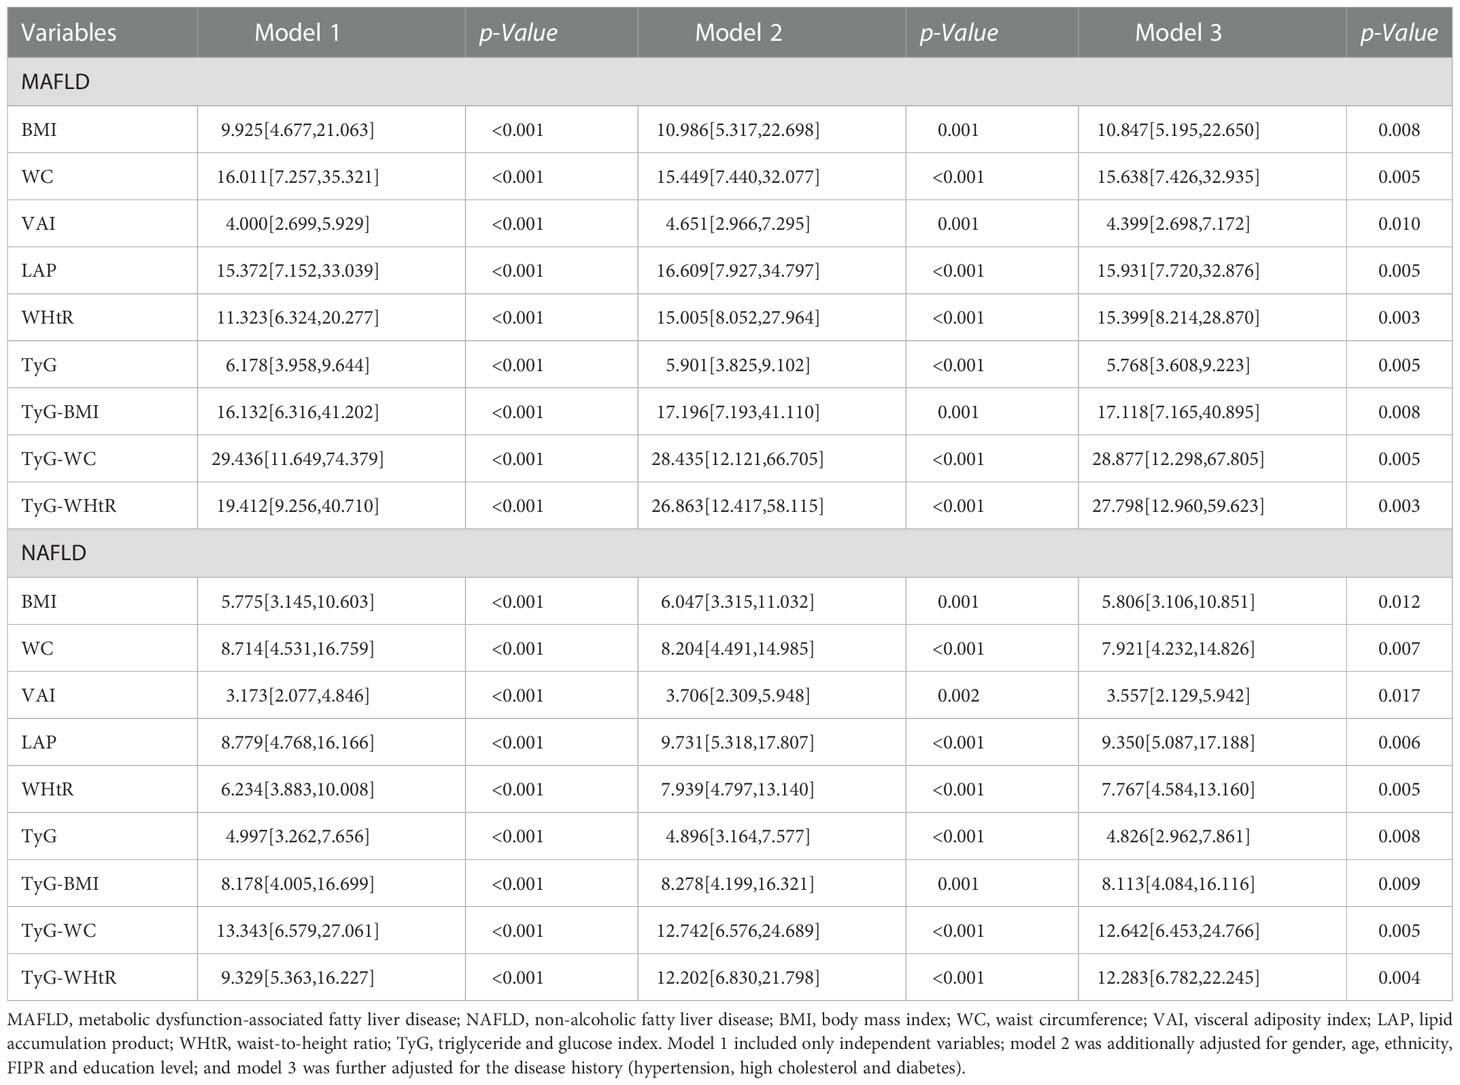
Table 2 Multi-variate adjusted ORs (95% CIs) of NAFLD and MAFLD in relation to quartile increment of nine predictive indexes among participants in NHANES 2017-2018.
For NAFLD, TyG-WC presented the highest OR (OR = 12.742, 95% CI = 6.576 to 24.689), followed by TyG-WHtR (OR = 12.202, 95% CI = 6.830 to 21.798), LAP (OR = 9.731, 95% CI = 5.318 to 17.807), TyG-BMI (OR = 8.278, 95% CI = 4.199 to 16.321), WC (OR = 8.204, 95% CI = 4.491 to 14.985), WHtR (OR = 7.939, 95% CI = 4.797 to 13.140), BMI (OR = 6.047, 95% CI = 3.315 to11.032), TyG (OR = 4.896, 95% CI = 3.164 to 7.577), VAI (OR = 3.706, 95% CI = 2.309 to 5.948).
3.3. Nine indirect indexes for predicting MAFLD/NAFLD
Table 3 and Figure 2 showed the AUC values (95% CI) of the 9 indexes for screening American adults with MAFLD/NAFLD. For MAFLD, TyG-WC presented the highest AUC for male (0.900, 95% CI: 0.867-0.927) and overall (0.869, 95% CI: 0.843-0.891). The optimum cutoff value of TyG-WC was 789.868 (specificity 92.43%, sensitivity 72.61%) for male. However, TyG-WHtR presented the highest AUC for female (0.845, 95% CI: 0.806-0.879), with an optimum cutoff value of 4.821 (specificity: 86.78%, sensitivity: 69.54%). Table 3 also showed negative predictive value (NPV) and positive predictive value (PPV) of the nine indexes.
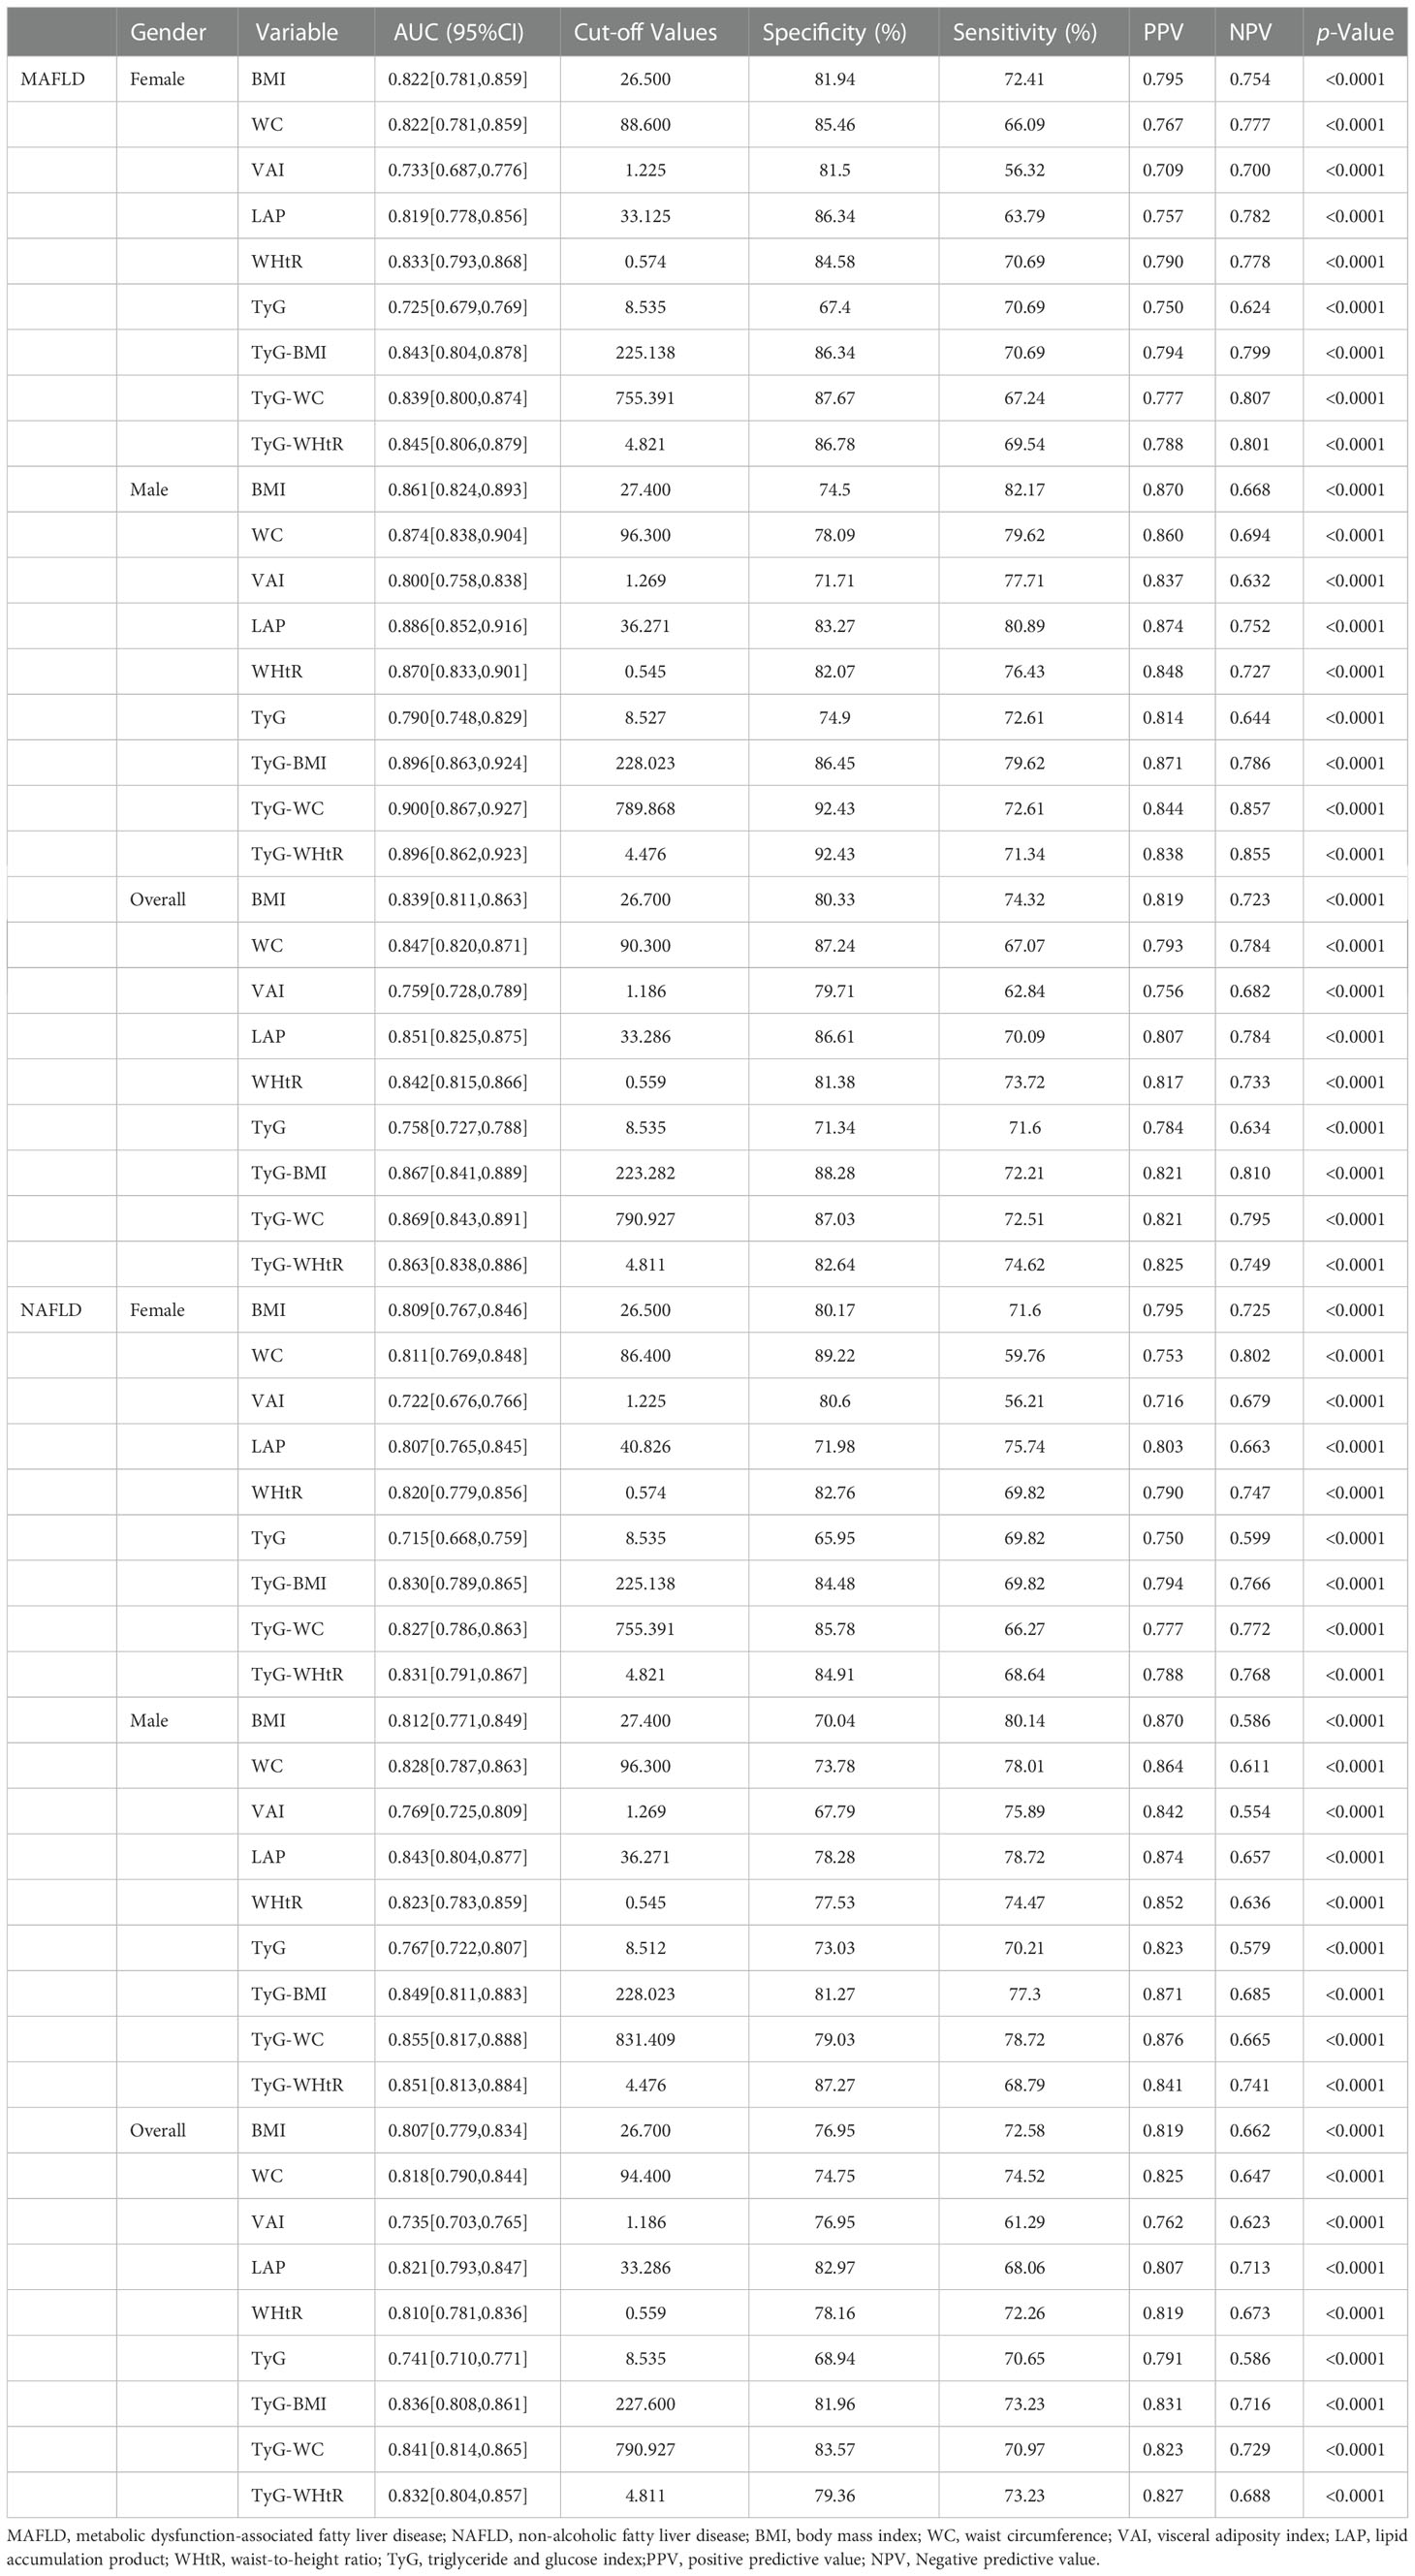
Table 3 Selected parameters for predicting MAFLD/NAFLD and the corresponding AUC, optimal cut-off values, their sensitivity and specificity, PPV and NPV.
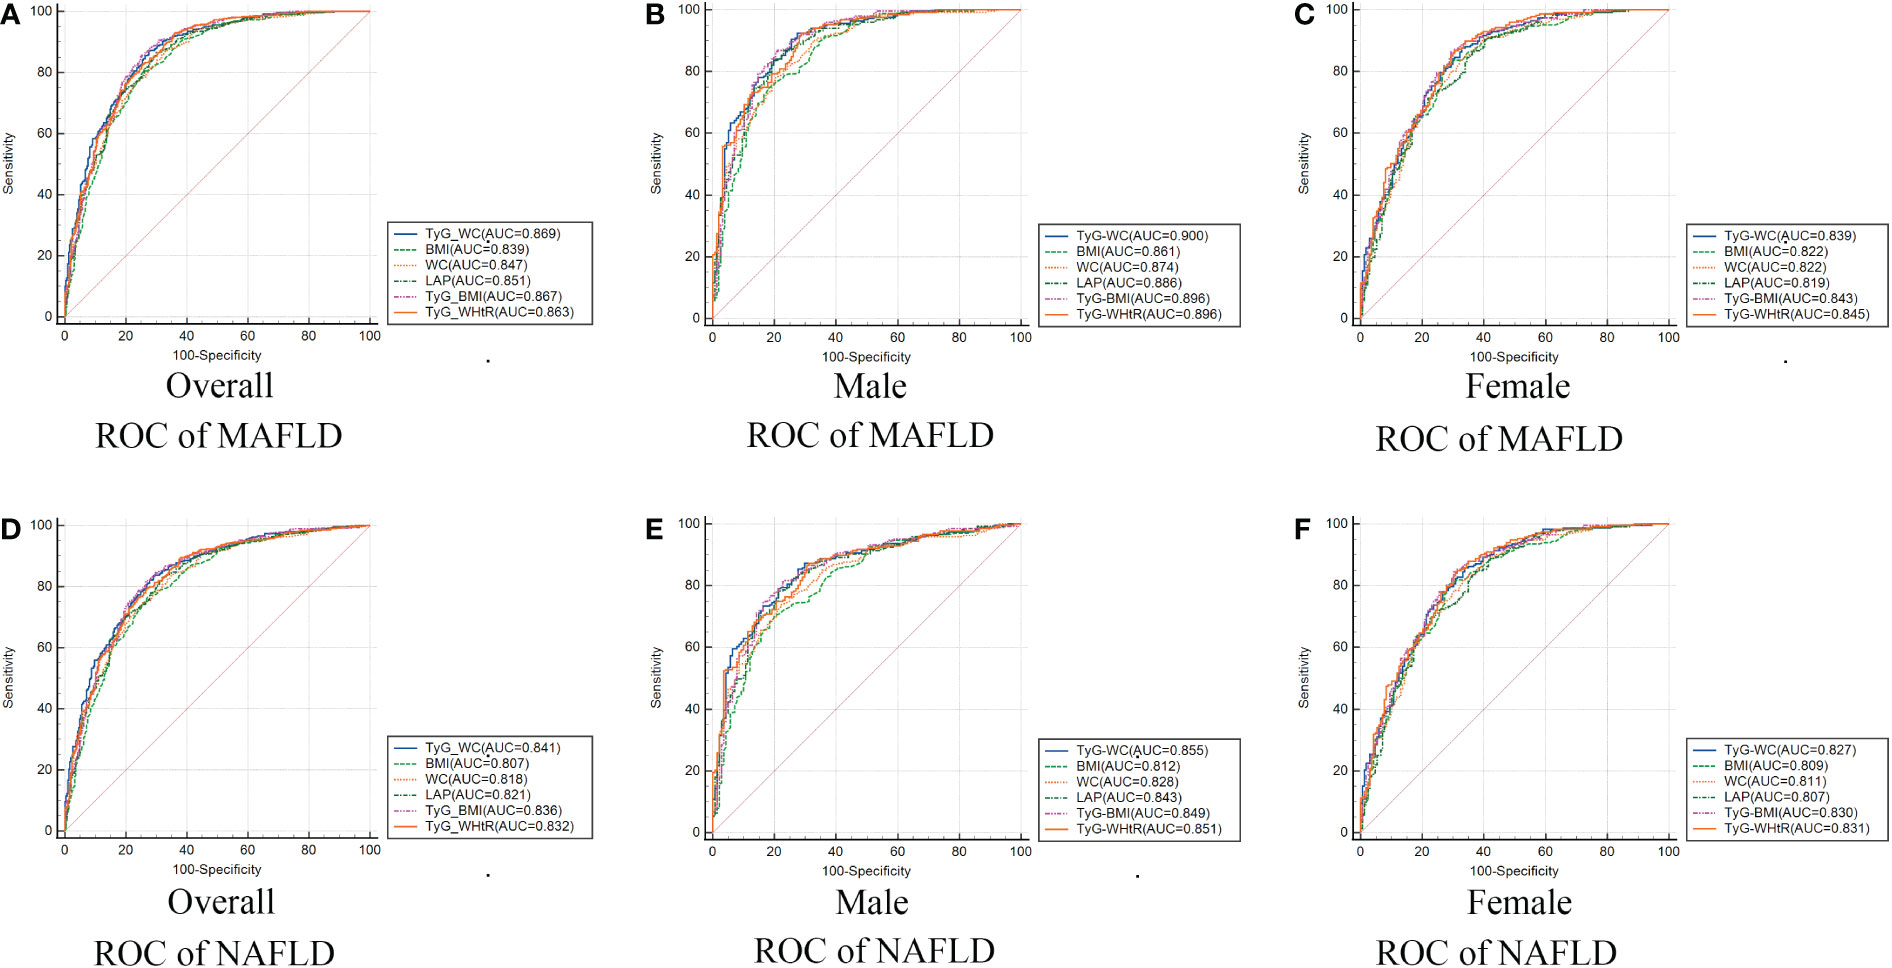
Figure 2 Receiver operating characteristic curves of TyG-WC and other indexes in overall (A/D), male (B/E), female (C/F) for identifying MAFLD/NAFLD. MAFLD, metabolic dysfunction-associated fatty liver disease; NAFLD, non-alcoholic fatty liver disease; TyG, triglyceride and glucose index; WC, waist circumference; BMI, body mass index; LAP, lipid accumulation product; WHtR, waist-to-height ratio.
Similar results were found for NAFLD. TyG-WHtR presented best predictive performance for female, while TyG-WC presented best predictive performance for male (Table 3).
3.4. Gender difference in AUC values between TyG-WC and other indexes
TyG-WC presented the largest AUC in overall population both with NAFLD and MAFLD. We compared the AUC values between TyG-WC and other eight indexes to explore possible gender differences. Table 4 showed the gender differences in AUC values between TyG-WC and other indexes for MAFLD/NAFLD. Similar results were found for both MAFLD and NAFLD. For female, the AUC value of TyG-WC was statistically different from that of WC (P<0.05), but not statistically different from that of BMI, LAP, TyG-BMI and TyG-WHtR. For male, the AUC value of TyG-WC was statistically different from that of BMI and WC (P<0.05), but not statistically different from that of LAP, TyG-BMI and TyG-WHtR. Therefore, TyG-WC, TyG-BMI and TyG-WHtR might have better predictive performance in identifying MAFLD and NAFLD compared to BMI, WC and LAP.
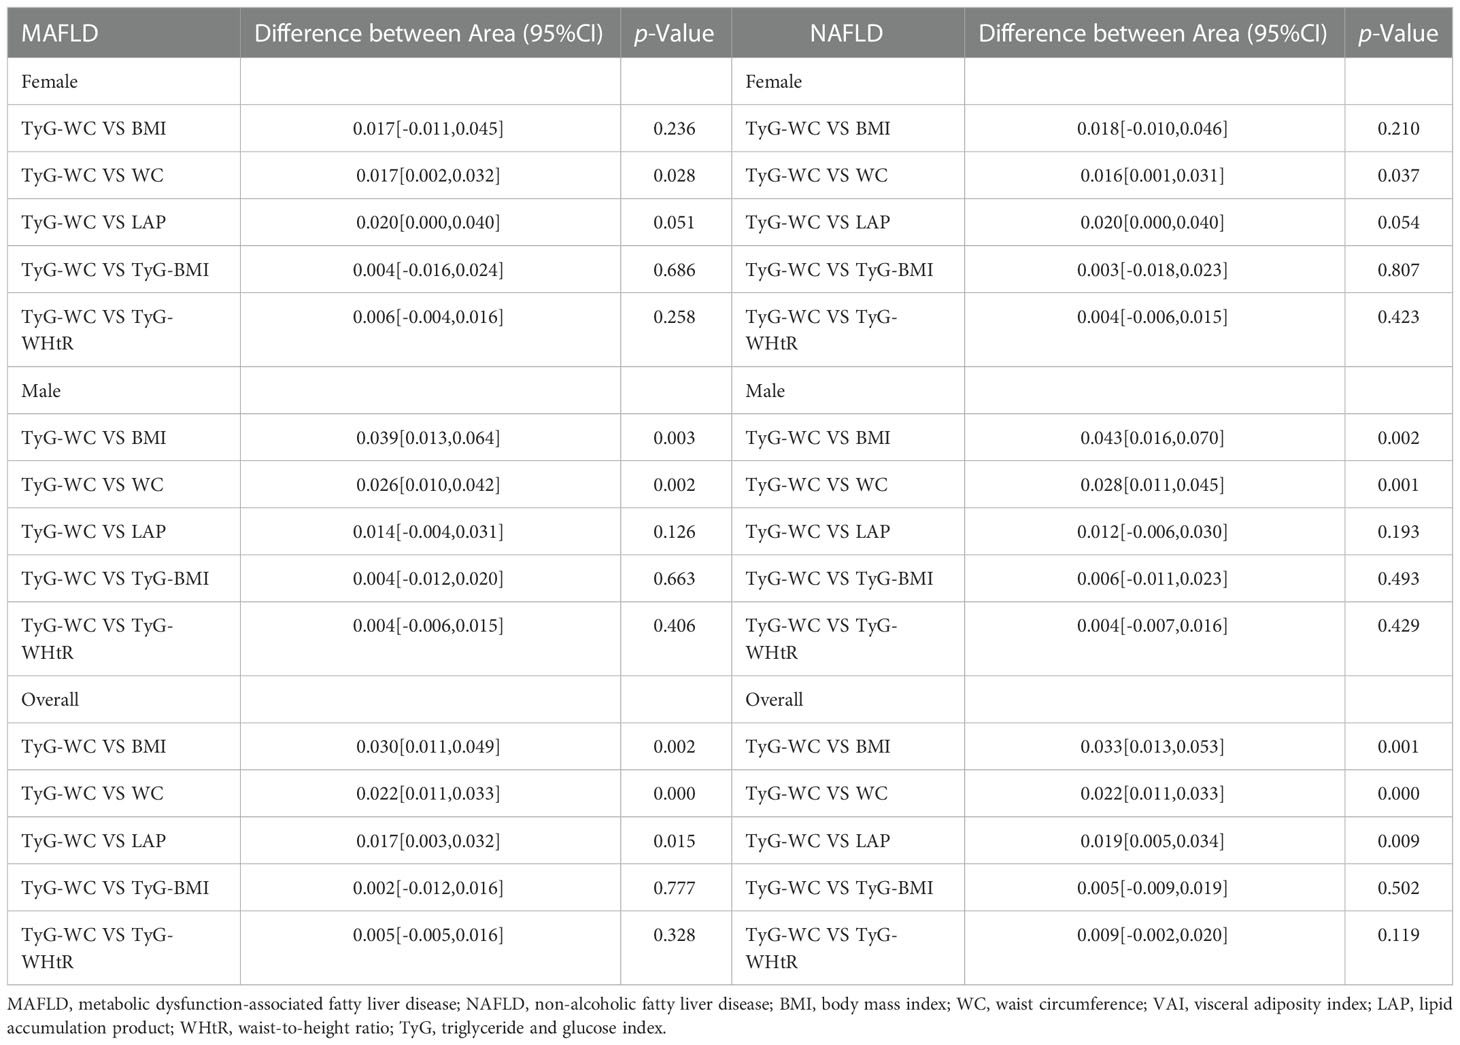
Table 4 Gender differences in AUC values between TyG-WC and other indexes.
4. Discussion
As the most common chronic liver disease, MAFLD/NAFLD has affected the life of about 1/4 adults worldwide. Increasing studies are exploring easy-to-use, practical, and reliable predictors of MAFLD/NAFLD, which is also one of the urgent needs in clinical practice. Obesity is an independent risk factor of NAFLD. A Meta-analysis showed that the risk of NAFLD in obese individuals was 3.5 times higher than those with normal BMI, and the severity of NAFLD tended to increase in individuals with higher BMI (33). Previous studies suggested that inflammatory mediators such as lipocalin, leptin, and tumor necrosis factor-α secreted by adipocytes (34), especially lipocalin and leptin, could influence the development of NAFLD by regulating hepatic fat accumulation, IR, and fibrosis (35). Obesity-associated IR is considered to be one of the important pathogenic mechanisms of NAFLD (36).BMI, WC, VAI, LAP and WHtR are obesity-associated indexes, TyG is a reliable IR index, and TyG-BMI, TyG-WC and TyG-WHtR are composite indicators combining TyG and anthropometric parameters. Which of the nine indexes will be most closely linked to NAFLD/MAFLD remains to be determined.
We screened nine associated indexes and compared their performance in predicting MAFLD/NAFLD in adults based on previous studies. To the best of our knowledge, this was the first study to investigate the association between indirect indexes (BMI/WC/VAI/LAP/WHtR/TyG/TyG-WC/TyG-BMI/TyG-WHtR) and MAFLD/NAFLD in the U.S. population by different gender groups. Further assessment has been completed to assess the diagnostic utility of nine indexes for MAFLD/NAFLD. We found that all nine indexes were significantly associated with risks of MAFLD/NAFLD. ROC analysis showed that TyG-WC was the best predictor, followed by TyG-WHtR and TyG-BMI, for MAFLD/NAFLD in male participants. TyG-WHtR was the best predictor for MAFLD/NAFLD in female participants. It is notable that these findings highlight the potential impact of gender on the reliability of assessed indexes.
4.1. Relationship between BMI/WC/WHtR and MAFLD/NAFLD
BMI is the most commonly used clinical indicator of whole-body adiposity, while WC is more suitable for assessing central obesity. Our findings showed that, in both male and female participants, WC presented significantly better predictive performance for MAFLD/NAFLD than BMI, which suggested that abdominal obesity might be a more accurate and important index of steatosis than overweight measured by BMI. Our findings also showed that it was clinically valuable to include people with normal BMI but abnormal metabolism in the diagnosis of MAFLD.
Previous studies have found that WC may better reflect the risk of obesity-associated diseases compared to BMI (37). Li et al. found that WC was more effective than BMI in predicting metabolic syndrome in patients with T2DM (38). A prospective cohort study of 11,714 participants suggested that increased WC might result in blood pressure elevation even without increase in BMI (39). In addition, Hou et al. found a stronger correlation between WC and diabetes compared to BMI (40). For a specific BMI, a large WC meant two-to three-fold of the risk of developing diabetes and cardiovascular disease (CVD) in the future (41).
Some studies have explored the relationship between WC and MAFLD/NAFLD. Similar to our findings, Motamed et al. (42) found that WC presented excellent performance in the diagnosis of NAFLD(AUC: 0.8533, 95%CI: 0.8419-0.8646)and almost the same predictive power as fatty liver index (FLI), a widely used index for the diagnosis and evaluation of fatty liver development in a number of studies (43, 44).
We found that WC had higher predictive power than BMI, which may be related to the following factors. First, not all patients with NAFLD have an excessive BMI. In all, about 40% people NAFLD worldwide are classified as non-obese and nearly a fifth are lean (45). Second, the distribution of abdominal fat can be used as a marker of ectopic fat in various sites. According to previous study, those with a predominance of abdominal fat and a large WC have more visceral/intra-abdominal fat, expanded (hypertrophic) subcutaneous adipose cells, as well as dysfunctional and inflammatory adipose tissue (45), and thus are more likely to develop metabolic disorders. Third, it is known that unhealthy dietary patterns have a significant role in the development of MAFLD/NAFLD. Interestingly, Ghaemi et al. found that the indirect effect of diet through abdominal circumference was 28 times more than the direct effect on NAFLD and that WC is a powerful mediator in the association between dietary patterns and NAFLD (46), indicating that WC was of great importance in the development of NAFLD.
Notably, WHtR presented the best predictive performance for MAFLD/NAFLD in female participants. A possible explanation is that WHtR is an adjusted indicator with WC and height, so it can better indicate abdominal obesity than WC.
As easy-to-use and cheap indexes, WC and WHtR are important indicators for assessing central obesity and reliable indexes for efficient screening of individuals at high risk of MAFLD/NAFLD.
4.2. The relationship between VAI/LAP and MAFLD/NAFLD
As important indexes of visceral adiposity, VAI and LAP had good performance in diagnosing MAFLD/MAFLD in this study, with AUCs of about 0.7 and 0.8, respectively. And elevated VAI and LAP levels were associated with higher risks of MAFLD and NAFLD after adjusting for all covariates, which was consistent with previous findings by Vural and Zhang et al. (47, 48).
Numerous studies have shown the close link between VAI/LAP and metabolic disorders. According to Dong et al. (49), VAI performed better than traditional adiposity index in predicting an unhealthy metabolic phenotype in Chinese children and adolescents (BMI, WC, and WHtR). However, there is a strong correlation between VAI and abnormalities in lipid and glucose levels in obese individuals (50). A 10-year prospective cohort study has shown a link between LAP and incident cardiovascular disease.
Unexpectedly, we found that MAFLD was also strongly correlated with VAI and LAP. Possible explanations could be: First, people with more visceral adipose tissue (VAT) had higher levels of inflammatory cytokines, including C-reactive protein, tumor necrosis factor-α, and interleukin-6, which may cause IR and metabolic problems (51). Second, the enhanced lipolysis in VAT causes an excess of free fatty acids (FFAs) to be released into the portal vein. FFAs with high concentrations can cause IR and intracellular inflammation (52). Third, the elevated FFAs load in NAFLD may impede a β-oxidation, which takes place in the liver mitochondria, leading to the production of reactive oxygen species (53). Oxidative stress as a result causes the initiation and development of fibrosis, inflammation, and liver damage.
It is notable that LAP seems to have a better predictive performance than VAI according to our findings. LAP can be more easily calculated with WC and TG, so it can be widely used in clinical practice.
4.3. Relationship between TyG/TyG-BMI/TyG-WC/TyG-WHtR and MAFLD/NAFLD
TyG index has been widely explored in cardiovascular diseases recently. It is considered as a reliable index to predict adverse cardiovascular events and progression of coronary artery calcification in patients with acute coronary syndrome and diabetes (19, 54). Our findings suggested that TyG was strongly linked to NAFLD, with a 4~6-fold increase in MAFLD/NAFLD risk as each quartile increment in TyG. According to ROC analysis, the optimal cut-off point of TyG for MAFLD was 8.535 and the AUC was 0.758 (95% CI 0.727-0.788), which were generally consistent with the previous findings by Zhang et al. (21). Moreover, we further explored the relationship between TyG and MAFLD/NAFLD in different gender subgroups.
We also found that TyG presented lower performance in predicting MAFLD/NAFLD compared to the other eight indexes. TyG is considered as a novel indicator of IR, but previous study found that a significant number patients with fatty liver remained insulin sensitive and 37% of these patients presented no metabolic syndrome, prediabetes or diabetes (55). We therefore speculate that this may be a reason why the TyG has lower predictive performance than other indexes.
Interestingly, we found that TyG-BMI, TyG-WC and TyG-WHtR had higher predictive performance for MAFLD/NAFLD in overall population, which was similar to the findings by Sheng et al. (56). A possible explanation could be that TyG-BMI, TyG-WC and TyG-BMI were adjusted indexes with indicators of insulin sensitivity and obesity including glucose, insulin level, BMI, WC and WHtR, which were also suggested with good predictive performance for T2DM in previous study (57). Our findings further confirmed the significant contribution of obesity and IR in the development of MAFLD/NAFLD.
4.4. Strengths and limitations
Strengths: For the first time, we explored the differences in the performance of nine indexes in predicting both MAFLD and NAFLD, providing a reliable reference for efficient and accurate screening in clinical settings. Furthermore, there are few related clinical studies on MAFLD, so our findings contribute some evidence to the scant research. Last, the study findings were based on the high-quality anthropometric and laboratory data from the NHANES database, which was comprehensive and representative of the population on a national level.
Limitations: First, rather than using the gold standard in histology, the diagnosis of hepatic steatosis was based on imaging (FibroScan). Second, despite the fact that we adjusted multiple covariates in the study, there may still be other potential confounders, such as physical activity and food intakes. Third, in this cross-sectional study, we were unable to confirm a cause-effect relationship between the risk of MAFLD/NAFLD and the 9 indexes (BMI, WC, VAI, LAP, WHtR, TyG, TyG-WC, TyG-BMI and TyG-WHtR). More large-scale and prospective cohort studies should be encouraged in the future.
5. Conclusion
Our study suggests that BMI/WC/VAI/LAP/WHtR/TyG/TyG-WC/TyG-BMI/TyG-WHtR are important reference indexes for identifying the risks of MAFLD/NAFLD. TyG-WC presents the best predictive performance in male, while TyG-WHtR presents the best predictive performance in female. Further prospective studies are needed before definite conclusions about the best predictor of MAFLD/NAFLD can be made.
Data availability statement
Publicly available datasets were analyzed in this study. This data can be found here: Centers for disease control and prevention. 2017: National Health and Nutrition Examination Survey (NHANES). U.S. Department of health and human services. Available from https://wwwn.cdc.gov/nchs/data/nhanes/2017-2018/manuals/2017_MEC_Laboratory_Procedures_Manual.pdf accessed 31 March 2020.
Ethics statement
The studies involving human participants were reviewed and approved by The Research Ethics Review Board of the National Center for Health Statistics examined and approved the NHANES protocol. Before taking part, each participant completed a written statement of informed consent. The patients/participants provided their written informed consent to participate in this study.
Author contributions
Conceptualization, HP and WL. Methodology, HP, LP and SR. Formal analysis, MW, SH and MZ. Data curation, ZC, ZY, LX and QY. Writing—original draft preparation, HP, LP and SR. Writing—review and editing, WL. Visualization, MW, SH and MZ. All authors contributed to the article and approved the submitted version.
Funding
This work was funded by the Scientific and Technological Innovation Project of China, Academy of Chinese Medical Sciences (CI2021A00801 and CI2021A00802), and Beijing Municipal Natural Science Foundation (7222295).
Acknowledgments
The authors thank the participants, the investigators and the staff of the National Health and Nutrition Examination Survey for their valuable contribution.
Conflict of interest
The authors declare that the research was conducted in the absence of any commercial or financial relationships that could be construed as a potential conflict of interest.
Publisher’s note
All claims expressed in this article are solely those of the authors and do not necessarily represent those of their affiliated organizations, or those of the publisher, the editors and the reviewers. Any product that may be evaluated in this article, or claim that may be made by its manufacturer, is not guaranteed or endorsed by the publisher.
References
1. Younossi ZM, Koenig AB, Abdelatif D, Fazel Y, Henry L, Wymer M. Global epidemiology of nonalcoholic fatty liver disease-Meta-Analytic assessment of prevalence, incidence, and outcomes. Hepatol (Baltimore Md) (2016) 64(1):73–84. doi: 10.1002/hep.28431
2. Targher G, Corey KE, Byrne CD, Roden M. The complex link between nafld and type 2 diabetes mellitus - mechanisms and treatments. Nat Rev Gastroenterol Hepatol (2021) 18(9):599–612. doi: 10.1038/s41575-021-00448-y
3. Zhao YC, Zhao GJ, Chen Z, She ZG, Cai J, Li H. Nonalcoholic fatty liver disease: An emerging driver of hypertension. Hypertension (Dallas Tex: 1979) (2020) 75(2):275–84. doi: 10.1161/hypertensionaha.119.13419
4. Eslam M, Sanyal AJ, George J. Mafld: A consensus-driven proposed nomenclature for metabolic associated fatty liver disease. Gastroenterology (2020) 158(7):1999–2014.e1. doi: 10.1053/j.gastro.2019.11.312
5. Lin S, Huang J, Wang M, Kumar R, Liu Y, Liu S, et al. Comparison of mafld and nafld diagnostic criteria in real world. Liver Int (2020) 40(9):2082–9. doi: 10.1111/liv.14548
6. Targher G, Tilg H, Byrne CD. Non-alcoholic fatty liver disease: A multisystem disease requiring a multidisciplinary and holistic approach. Lancet Gastroenterol Hepatol (2021) 6(7):578–88. doi: 10.1016/s2468-1253(21)00020-0
7. Younossi ZM, Blissett D, Blissett R, Henry L, Stepanova M, Younossi Y, et al. The economic and clinical burden of nonalcoholic fatty liver disease in the united states and Europe. Hepatol (Baltimore Md) (2016) 64(5):1577–86. doi: 10.1002/hep.28785
8. Estes C, Razavi H, Loomba R, Younossi Z, Sanyal AJ. Modeling the epidemic of nonalcoholic fatty liver disease demonstrates an exponential increase in burden of disease. Hepatol (Baltimore Md) (2018) 67(1):123–33. doi: 10.1002/hep.29466
9. Castera L, Friedrich-Rust M, Loomba R. Noninvasive assessment of liver disease in patients with nonalcoholic fatty liver disease. Gastroenterology (2019) 156(5):1264–81.e4. doi: 10.1053/j.gastro.2018.12.036
10. Yu Q, Huang S, Xu TT, Wang YC, Ju S. Measuring brown fat using mri and implications in the metabolic syndrome. J Magnetic Resonance Imaging (2021) 54(5):1377–92. doi: 10.1002/jmri.27340
11. Staiano AE, Gupta AK, Katzmarzyk PT. Cardiometabolic risk factors and fat distribution in children and adolescents. J Pediatr (2014) 164(3):560–5. doi: 10.1016/j.jpeds.2013.10.064
12. Rotar O, Boyarinova M, Orlov A, Solntsev V, Zhernakova Y, Shalnova S, et al. Metabolically healthy obese and metabolically unhealthy non-obese phenotypes in a Russian population. Eur J Epidemiol (2017) 32(3):251–4. doi: 10.1007/s10654-016-0221-z
13. Blüher M. Metabolically healthy obesity. Endocrine Rev (2020) 41(3):bnaa004. doi: 10.1210/endrev/bnaa004
14. Amato MC, Giordano C, Galia M, Criscimanna A, Vitabile S, Midiri M, et al. Visceral adiposity index: A reliable indicator of visceral fat function associated with cardiometabolic risk. Diabetes Care (2010) 33(4):920–2. doi: 10.2337/dc09-1825
15. Xu C, Ma Z, Wang Y, Liu X, Tao L, Zheng D, et al. Visceral adiposity index as a predictor of nafld: A prospective study with 4-year follow-up. Liver International: Off J Int Assoc Study Liver (2018) 38(12):2294–300. doi: 10.1111/liv.13941
16. Kahn HS. The “Lipid accumulation product” performs better than the body mass index for recognizing cardiovascular risk: A population-based comparison. BMC Cardiovasc Disord (2005) 5:26. doi: 10.1186/1471-2261-5-26
17. Dai H, Wang W, Chen R, Chen Z, Lu Y, Yuan H. Lipid accumulation product is a powerful tool to predict non-alcoholic fatty liver disease in Chinese adults. Nutr Metab (2017) 14:49. doi: 10.1186/s12986-017-0206-2
18. Alizargar J, Bai CH, Hsieh NC, Wu SV. Use of the triglyceride-glucose index (Tyg) in cardiovascular disease patients. Cardiovasc Diabetol (2020) 19(1):8. doi: 10.1186/s12933-019-0982-2
19. Wang L, Cong HL, Zhang JX, Hu YC, Wei A, Zhang YY, et al. Triglyceride-glucose index predicts adverse cardiovascular events in patients with diabetes and acute coronary syndrome. Cardiovasc Diabetol (2020) 19(1):80. doi: 10.1186/s12933-020-01054-z
20. Lv L, Zhou Y, Chen X, Gong L, Wu J, Luo W, et al. Relationship between the tyg index and diabetic kidney disease in patients with type-2 diabetes mellitus. Diabetes Metab Syndrome Obes (2021) 14:3299–306. doi: 10.2147/dmso.S318255
21. Zhang S, Du T, Zhang J, Lu H, Lin X, Xie J, et al. The triglyceride and glucose index (Tyg) is an effective biomarker to identify nonalcoholic fatty liver disease. Lipids Health Dis (2017) 16(1):15. doi: 10.1186/s12944-017-0409-6
22. Tutunchi H, Naeini F, Mobasseri M, Ostadrahimi A. Triglyceride glucose (Tyg) index and the progression of liver fibrosis: A cross-sectional study. Clin Nutr ESPEN (2021) 44:483–7. doi: 10.1016/j.clnesp.2021.04.025
23. Song S, Son DH, Baik SJ, Cho WJ, Lee YJ. Triglyceride glucose-waist circumference (Tyg-wc) is a reliable marker to predict non-alcoholic fatty liver disease. Biomedicines (2022) 10(9):2251. doi: 10.3390/biomedicines10092251
24. Hu H, Han Y, Cao C, He Y. The triglyceride glucose-body mass index: A non-invasive index that identifies non-alcoholic fatty liver disease in the general Japanese population. J Trans Med (2022) 20(1):398. doi: 10.1186/s12967-022-03611-4
25. Malek M, Khamseh ME, Chehrehgosha H, Nobarani S, Alaei-Shahmiri F. Triglyceride glucose-waist to height ratio: A novel and effective marker for identifying hepatic steatosis in individuals with type 2 diabetes mellitus. Endocrine (2021) 74(3):538–45. doi: 10.1007/s12020-021-02815-w
26. Wolffenbuttel BHR, Heiner-Fokkema MR, Green R, Gans ROB. Relationship between serum B12 concentrations and mortality: Experience in nhanes. BMC Med (2020) 18(1):307. doi: 10.1186/s12916-020-01771-y
27. Eslam M, Newsome PN, Sarin SK, Anstee QM, Targher G, Romero-Gomez M, et al. A new definition for metabolic dysfunction-associated fatty liver disease: An international expert consensus statement. J Hepatol (2020) 73(1):202–9. doi: 10.1016/j.jhep.2020.03.039
28. Mikolasevic I, Orlic L, Franjic N, Hauser G, Stimac D, Milic S. Transient elastography (Fibroscan(®)) with controlled attenuation parameter in the assessment of liver steatosis and fibrosis in patients with nonalcoholic fatty liver disease - where do we stand? World J Gastroenterol (2016) 22(32):7236–51. doi: 10.3748/wjg.v22.i32.7236
29. Liao Y, Wu N, Wang K, Wang M, Wang Y, Gao J, et al. Otub1 promotes progression and proliferation of prostate cancer Via deubiquitinating and stabling cyclin E1. Front Cell Dev Biol (2020) 8:617758. doi: 10.3389/fcell.2020.617758
30. Bawadi H, Abouwatfa M, Alsaeed S, Kerkadi A, Shi Z. Body shape index is a stronger predictor of diabetes. Nutrients (2019) 11(5):1018. doi: 10.3390/nu11051018
31. Kuznik A, Mardekian J. Trends in utilization of lipid- and blood pressure-lowering agents and goal attainment among the U.S. diabetic population, 1999-2008. Cardiovascular diabetology (2011) 10:31. doi: 10.1186/1475-2840-10-31
32. Simental-Mendía LE, Rodríguez-Morán M, Guerrero-Romero F. The product of fasting glucose and triglycerides as surrogate for identifying insulin resistance in apparently healthy subjects. Metab Syndrome Related Disord (2008) 6(4):299–304. doi: 10.1089/met.2008.0034
33. Li L, Liu DW, Yan HY, Wang ZY, Zhao SH, Wang B. Obesity is an independent risk factor for non-alcoholic fatty liver disease: Evidence from a meta-analysis of 21 cohort studies. Obes Rev (2016) 17(6):510–9. doi: 10.1111/obr.12407
34. Henao-Mejia J, Elinav E, Jin C, Hao L, Mehal WZ, Strowig T, et al. Inflammasome-mediated dysbiosis regulates progression of nafld and obesity. Nature (2012) 482(7384):179–85. doi: 10.1038/nature10809
35. Boutari C, Mantzoros CS. Adiponectin and leptin in the diagnosis and therapy of nafld. Metabolism (2020) 103:154028. doi: 10.1016/j.metabol.2019.154028
36. Watt MJ, Miotto PM, De Nardo W, Montgomery MK. The liver as an endocrine organ-linking nafld and insulin resistance. Endocrine Rev (2019) 40(5):1367–93. doi: 10.1210/er.2019-00034
37. Müller MJ, Lagerpusch M, Enderle J, Schautz B, Heller M, Bosy-Westphal A. Beyond the body mass index: Tracking body composition in the pathogenesis of obesity and the metabolic syndrome. Obes Rev (2012) 13 Suppl 2:6–13. doi: 10.1111/j.1467-789X.2012.01033.x
38. Li H, Wang Q, Ke J, Lin W, Luo Y, Yao J, et al. Optimal obesity- and lipid-related indices for predicting metabolic syndrome in chronic kidney disease patients with and without type 2 diabetes mellitus in China. Nutrients (2022) 14(7):1334. doi: 10.3390/nu14071334
39. Wang Y, Howard AG, Adair LS, Wang H, Avery CL, Gordon-Larsen P. Waist circumference change is associated with blood pressure change independent of bmi change. Obes (Silver Spring Md) (2020) 28(1):146–53. doi: 10.1002/oby.22638
40. Hou X, Chen S, Hu G, Chen P, Wu J, Ma X, et al. Stronger associations of waist circumference and waist-to-Height ratio with diabetes than bmi in Chinese adults. Diabetes Res Clin Pract (2019) 147:9–18. doi: 10.1016/j.diabres.2018.07.029
41. Després JP, Lemieux I. Abdominal obesity and metabolic syndrome. Nature (2006) 444(7121):881–7. doi: 10.1038/nature05488
42. Motamed N, Sohrabi M, Ajdarkosh H, Hemmasi G, Maadi M, Sayeedian FS, et al. Fatty liver index vs waist circumference for predicting non-alcoholic fatty liver disease. World J Gastroenterol (2016) 22(10):3023–30. doi: 10.3748/wjg.v22.i10.3023
43. Li L, Huang Q, Yang L, Zhang R, Gao L, Han X, et al. The association between non-alcoholic fatty liver disease (Nafld) and advanced fibrosis with serological vitamin B12 markers: Results from the nhanes 1999-2004. Nutrients (2022) 14(6):1224. doi: 10.3390/nu14061224
44. Tan SY, Georgousopoulou EN, Cardoso BR, Daly RM, George ES. Associations between nut intake, cognitive function and non-alcoholic fatty liver disease (Nafld) in older adults in the united states: Nhanes 2011-14. BMC Geriatrics (2021) 21(1):313. doi: 10.1186/s12877-021-02239-1
45. Ye Q, Zou B, Yeo YH, Li J, Huang DQ, Wu Y, et al. Global prevalence, incidence, and outcomes of non-obese or lean non-alcoholic fatty liver disease: A systematic review and meta-analysis. Lancet Gastroenterol Hepatol (2020) 5(8):739–52. doi: 10.1016/s2468-1253(20)30077-7
46. Ghaemi A, Hosseini N, Osati S, Naghizadeh MM, Dehghan A, Ehrampoush E, et al. Waist circumference is a mediator of dietary pattern in non-alcoholic fatty liver disease. Sci Rep (2018) 8(1):4788. doi: 10.1038/s41598-018-23192-x
47. Vural Keskinler M, Mutlu HH, Sirin A, Erkalma Senates B, Colak Y, Tuncer I, et al. Visceral adiposity index as a practical tool in patients with biopsy-proven nonalcoholic fatty liver Disease/Nonalcoholic steatohepatitis. Metab Syndrome Related Disord (2021) 19(1):26–31. doi: 10.1089/met.2020.0054
48. Zhang Y, Li B, Liu N, Wang P, He J. Evaluation of different anthropometric indicators for screening for nonalcoholic fatty liver disease in elderly individuals. Int J Endocrinol (2021) 2021:6678755. doi: 10.1155/2021/6678755
49. Dong Y, Bai L, Cai R, Zhou J, Ding W. Visceral adiposity index performed better than traditional adiposity indicators in predicting unhealthy metabolic phenotype among Chinese children and adolescents. Sci Rep (2021) 11(1):23850. doi: 10.1038/s41598-021-03311-x
50. Jabłonowska-Lietz B, Wrzosek M, Włodarczyk M, Nowicka G. New indexes of body fat distribution, visceral adiposity index, body adiposity index, waist-to-Height ratio, and metabolic disturbances in the obese. Kardiol Polska (2017) 75(11):1185–91. doi: 10.5603/KP.a2017.0149
51. Fontana L, Eagon JC, Trujillo ME, Scherer PE, Klein S. Visceral fat adipokine secretion is associated with systemic inflammation in obese humans. Diabetes (2007) 56(4):1010–3. doi: 10.2337/db06-1656
52. Stefan N, Kantartzis K, Häring HU. Causes and metabolic consequences of fatty liver. Endocrine Rev (2008) 29(7):939–60. doi: 10.1210/er.2008-0009
53. Boden G, She P, Mozzoli M, Cheung P, Gumireddy K, Reddy P, et al. Free fatty acids produce insulin resistance and activate the proinflammatory nuclear factor-kappab pathway in rat liver. Diabetes (2005) 54(12):3458–65. doi: 10.2337/diabetes.54.12.3458
54. Park K, Ahn CW, Lee SB, Kang S, Nam JS, Lee BK, et al. Elevated tyg index predicts progression of coronary artery calcification. Diabetes Care (2019) 42(8):1569–73. doi: 10.2337/dc18-1920
55. Stefan N, Häring HU. The metabolically benign and malignant fatty liver. Diabetes (2011) 60(8):2011–7. doi: 10.2337/db11-0231
56. Sheng G, Lu S, Xie Q, Peng N, Kuang M, Zou Y. The usefulness of obesity and lipid-related indices to predict the presence of non-alcoholic fatty liver disease. Lipids Health Dis (2021) 20(1):134. doi: 10.1186/s12944-021-01561-2
Keywords: metabolic dysfunction-associated fatty liver disease, waist circumference, lipid accumulation product, triglycerideglucose index, BMI, TyG-WC, WHtR, TyG-WHtR
Citation: Peng H, Pan L, Ran S, Wang M, Huang S, Zhao M, Cao Z, Yao Z, Xu L, Yang Q and Lv W (2023) Prediction of MAFLD and NAFLD using different screening indexes: A cross-sectional study in U.S. adults. Front. Endocrinol. 14:1083032. doi: 10.3389/fendo.2023.1083032
Received: 28 October 2022; Accepted: 03 January 2023;
Published: 19 January 2023.
Edited by:
Takefumi Kimura, Shinshu University, JapanReviewed by:
Xintian Cai, People’s Hospital of Xinjiang Uygur Autonomous Region, ChinaQin Wan, The Affiliated Hospital of Southwest Medical University, China
Wencai Liu, The First Affiliated Hospital of Nanchang University, China
Copyright © 2023 Peng, Pan, Ran, Wang, Huang, Zhao, Cao, Yao, Xu, Yang and Lv. This is an open-access article distributed under the terms of the Creative Commons Attribution License (CC BY). The use, distribution or reproduction in other forums is permitted, provided the original author(s) and the copyright owner(s) are credited and that the original publication in this journal is cited, in accordance with accepted academic practice. No use, distribution or reproduction is permitted which does not comply with these terms.
*Correspondence: Wenliang Lv, bHZ3ZW5saWFuZ0Bzb2h1LmNvbQ==; Hongye Peng, MjAxOTA5MzE3MzJAYnVjbS5lZHUuY24=
†These authors have contributed equally to this work and share first authorship