
95% of researchers rate our articles as excellent or good
Learn more about the work of our research integrity team to safeguard the quality of each article we publish.
Find out more
ORIGINAL RESEARCH article
Front. Endocrinol. , 09 June 2023
Sec. Cancer Endocrinology
Volume 14 - 2023 | https://doi.org/10.3389/fendo.2023.1081831
This article is part of the Research Topic Insights in Cancer Endocrinology: 2022 View all 6 articles
 Stefania Stella1,2*†
 Michele Massimino1,2†
 Livia Manzella1,2†
 Nunziatina Laura Parrinello3
 Silvia Rita Vitale1,2
 Federica Martorana1,2
 Paolo Vigneri1,2,4
Introduction: Breast cancer is the most common malignancy in women, and it is linked to several risk factors including genetic alterations, obesity, estrogen signaling, insulin levels, and glucose metabolism deregulation. Insulin and Insulin-like growth factor signaling exert a mitogenic and pro-survival effect. Indeed, epidemiological and pre-clinical studies have shown its involvement in the development, progression, and therapy resistance of several cancer types including breast cancer. Insulin/Insulin-like growth factor signaling is triggered by two insulin receptor isoforms identified as IRA and IRB and by Insulin-like growth factor receptor I. Both classes of receptors show high homology and can initiate the intracellular signaling cascade alone or by hybrids formation. While the role of Insulin-like growth factor receptor I in breast cancer progression and therapy resistance is well established, the effects of insulin receptors in this context are complex and not completely elucidated.
Methods: We used estrogen-dependent insulin-like growth factor receptor I deleted gene (MCF7IGFIRKO) breast cancer cell models, lentivirally transduced to over-express empty-vector (MCF7IGFIRKO/EV), IRA (MCF7IGFIRKO/IRA) or IRB (MCF7IGFIRKO/IRB), to investigate the role of insulin receptors on the antiproliferative activity of tamoxifen in presence of low and high glucose concentrations. The tamoxifen-dependent cytotoxic effects on cell proliferation were determined by MTT assay and clonogenic potential measurement. Cell cycle and apoptosis were assessed by FACS, while immunoblot was used for protein analysis. Gene expression profiling was investigated by a PCR array concerning genes involved in apoptotic process by RT-qPCR.
Results: We found that glucose levels played a crucial role in tamoxifen response mediated by IRA and IRB. High glucose increased the IC50 value of tamoxifen for both insulin receptors and IRA-promoted cell cycle progression more than IRB, independently of glucose levels and insulin stimulation. IRB, in turn, showed anti-apoptotic properties, preserving cells’ survival after prolonged tamoxifen exposure, and negatively modulated pro-apoptotic genes when compared to IRA.
Discussion: Our findings suggest that glucose levels modify insulin receptors signaling and that this event can interfere with the tamoxifen therapeutic activity. The investigation of glucose metabolism and insulin receptor expression could have clinical implications in Estrogen Receptor positive breast cancer patients receiving endocrine treatments.
Breast cancer (BC) is the tumor with the highest incidence in women worldwide. According to molecular profiling, BC is a heterogenous disease including different subtypes (1, 2). Among them, Luminal A and B BC, which differ for Ki67 levels and express estrogen and/or progesterone receptor (ER+/PgR+), are the most common, and hormone receptors represent a prognostic and predictive factor (3). Several risk factors associated with BC development have been described comprising molecular alterations (4, 5), obesity (6), glucose metabolism (7), and others (8) involvement, also, the Insulin (Ins)/Insulin-like growth factor (IGF) system (9, 10).
Ins and IGF system comprises a complex intracellular network intricates in cell metabolism, differentiation, and survival and displays a crucial role in several tumors, including BC (11). This system comprises two highly homology types of receptors, insulin-like growth factor receptors (IGFRs) and insulin receptors (IRs). IGFRs are classified into two classes of receptors, insulin-like growth factor receptors I (IGFIR) and II (IGFIIR). IGFIR is catalytically active as tyrosine kinase receptors, while IGFIIR lacks this property (12). IR is a mediator of metabolic and mitogenic effects strongly influencing healthy and cancer cells, especially when overexpressed or in the presence of deregulated glucose metabolism. Two IR isoforms have been described and classified as IRA and IRB according to the absence of exon 11 in isoform A compared to B. IRs and IGFRs can work in concert generating hybrid complex and compensatory intracellular signals (13).
The role of IRs in cancer, including BC, has been reported and related to IRs’ ability to improve tumor progression and chemoresistance, and to modulate the cancer stemness (14–17). In the context of the insulin/IGF system, hyperglycemia and glucose metabolism deregulation have been reported to promote cell proliferation, invasion, migration, and chemotherapy resistance in breast cancer (18, 19).
About 70% of all BC express high levels of ER based on its expression by immunohistochemistry approach. ER-mediated signaling is a carcinogenic driver in ER+ BC patients and its inhibition by endocrine therapies, including tamoxifen (TAM) treatment, improved patients’ survival (20). Published studies also revealed a crosstalk between ER and IR signaling, playing a role in BC progression (21–23).
Using an IGFIR-KO ER+ BC model, selectively expressing IRA or IRB we investigated the role of glucose levels on ER and IRs interplay on drug response using the selective estrogen receptor modulator (SERM) TAM (24, 25).
MCF7 Clustered Regularly Interspaced Short Palindromic Repeats (CRISPR)-Cas9, knock-out (KO)-IGF1R (MCF7KOIGF1R) were purchased from Applied Biological Materials (Richmond, BC, Canada) and the selective expression of IRA (MCF7KOIGF1R-IRA) were previously generated (14). According to the same procedure previously reported (13), to obtain a cell line selectively expressing IRB isoform (MCF7KOIGF1R-IRB), RG215691-hIR-B plasmid (Origene) was used as a template to generate IRB-FLAG by PCR and cloned in pLEXG418, while pLEXG418EV was used to obtain MCF7KOIGF1R-EV.
MCF7KOIGF1REV, MCF7KOIGF1R-IRA and MCF7KOIGF1R-IRB cell lines were cultured in DMEM (Sigma) supplemented with 10% fetal bovine serum (FBS) (Euroclone), 2mM glutamine, 50µg/ml streptomycin and 100µg/ml penicillin (all from Sigma).
For all experiments, 30.000/cm2 cells for each MCF7 clone were implanted and grown in FBS-free DMEM Low Glucose (LG, 1000mg/L) or DMEM High Glucose (HG, 4500mg/L) containing 0.1% of bovine serum albumin (BSA) (all from Sigma). Then each cell line was grown in DMEM in the presence of LG or HG supplemented with 2,5% of charcoal-stripped FBS, 2mM glutamine, 50µg/ml streptomycin, 100µg/ml penicillin and 1nM of Estradiol (E2) (all from Sigma). Insulin receptor activation was performed using 10nM of Ins (26) while the TAM (Sigma) was used at logarithmic concentration or 10µM as indicated for each experiment for 48 hrs.
MTT was used for IC50 calculation and cell proliferation assay. For both experiments cells were exposed to logarithmic concentrations of TAM. MTT assay and IC50 calculation were performed as previously reported (27). IC50 values were calculated setting at 100% the percentage of proliferation after 48 hrs of culture, and logistic non-linear regression was used by Prism Software v8.0. For proliferation assay the percentage of viable cells was obtained, for each condition, setting at 100% the absorbance at 550 nm before TAM exposure.
Apoptosis assay and cell cycle evaluation were performed as previously described (28, 29). Briefly, after 48 h of TAM exposure, cells were collected and washed in phosphate buffered saline (PBS); for apoptosis assay cells were stained using Annexin FITC/7AAD kit according to the manufacturer’s protocol (Beckman Coulter), while for cell cycle analysis cells were fixed in 70% ethanol solution and incubated with ribonuclease A and propidium iodide (both from Sigma). The obtained data were analyzed employing FCS express software v 6.0.
TAM-treated MCF7KOIGF1R-EV, MCF7KOIGF1R-IRA and MCF7KOIGF1R-IRB were detached by trypsin and diluted in identical volumes of medium. An equal volume for each condition was implanted and the cells re-exposed to 10µM TAM. Fresh medium supplemented with insulin was replaced every day for 15-20 days. At this time the cells were stained by crystal violet solution and the colonies were counted employing Image J software.
Cell pellets were collected, and protein lysate was prepared. Western blot and densitometric analysis were performed as previously reported (30, 31). The primary antibodies used were polyclonal anti-p21CIP1/waf1 (Santa Cruz), polyclonal anti-Insulin Receptor (Santa Cruz), polyclonal anti-ERK1/2, anti-pERK1/2Y204, anti-pIRY1136/1136 (all from Cell Signaling), monoclonal anti-FLAG and anti-Actin (both from Sigma). Appropriate horseradish peroxidase-conjugated secondary antibodies (Amersham Biosciences) were added and protein expression was then detected using the WesternSure Premium Chemiluminescent Substrate. Immunoblot images were acquired by C-Digit (both from Licor).
Cells were collected and used to isolate total RNA employing the RNeasy Plus Mini kit (Qiagen). Extracted total RNA was converted into cDNA using the RT2 First Strand kit (Qiagen) and used to perform RT-qPCR according to the manufactures’ protocol for RT2 Profiler PCR Array Human Apoptosis (Qiagen). DEGs were calculated using a website data analysis software (Qiagen) assigning a threshold ≤2 for genes down-regulated and ≥2 for those up-regulated. Tile plots were generated using Prism Software v 8.0.
Anova and t-test were employed to calculate the p-value by Prism Software v. 8.0 assigning *p<0.05, **p<0.01, and ***p<0.001.
Lentivirally transduced cells have been subjected to molecular validation for assessment of the IR isoforms expression and quantification (Supplementary Figure 1). To this end, RNA has been isolated from each cell line and reverse transcribed in cDNA which was then used for PCR and RT-qPCR. PCR analysis revealed that MCF7KOIGF1R-EV express predominantly IRB isoform while MCF7KOIGF1R-IRA and MCF7KOIGF1R-IRB over-express preferentially IRA and IRB respectively (Supplementary Figure 1A). For IR quantification by RT-qPCR we used the endogenous IR expression of MCF7KOIGF1R-EV as control and 2-ΔΔCt calculation documented that MCF7KOIGF1R-IRA express 7.3 and MCF7KOIGF1R-IRB 6.83 fold higher of IRA or IRB levels respectively, when compared to endogenous IR MCF7KOIGF1R-EV (Supplementary Figure 1B).
We wanted to establish the impact of glucose levels on the ability of IRA and IRB to modulate the anti-proliferative activity of TAM. We exposed MCF7KOIGF1R-EV, MCF7KOIGF1R-IRA and MCF7KOIGF1R-IRB cells to logarithmic concentrations of TAM, in the presence and absence of insulin, for 48 hrs in a medium containing HG or LG concentration (Figure 1). First, we measured the IC50 value of TAM (IC50TAM) observing that using LG, both IRA and IRB comparably reduced the IC50TAM when compared with EV expressing cells, an effect that was prominent in presence of insulin stimulation (Figure 1A). Interestingly, repeating the same experiment cultivating the cells with HG, we observed that IC50TAM values were higher when compared with EV and LG for either IR isoforms and this effect was independent on insulin exposure (Figure 1B). Finally, no differences have been observed between the IC50TAM in EV expressing cells in both LG and HG conditions (Figures 1A, B). Next, applying the same experimental conditions reported above, we measured the cell proliferation after TAM exposure setting at 100% of the proliferation rate observed at the start of the experiment before exposing the cells to TAM alone or combined with insulin. Regardless of insulin stimulation and glucose levels, IRA induced cell growth more consistently than EV and IRB (Figures 1C–F, left columns). Moreover, although IRA showed this same effect after treatment, it increased the sensitivity to TAM exposure in all experimental conditions. In fact, IRA displayed a statistically significant proliferation reduction following the augmentation of TAM concentration, an event that was not overserved for EV and IRB, which displayed cytostatic effect (Figures 1C–F, middle columns). Using higher concentrations of TAM, we found that the critical dose was 10µM, which generated different results according to both the glucose levels and insulin stimulation. Using LG, insulin increased the cytotoxicity of 10µM TAM (Figures 1C, D, right columns), which, in turn, was less effective when the cells were cultured in the presence of HG (Figures 1E, F, right columns). No different effect was detected using TAM 100µM and 1000µM. Furthermore, to investigate if 10µM TAM did not exert ER independent activity (32), we performed IC50TAM calculation on MDA-MB-468 triple-negative breast cancer cells, finding a higher IC50TAM value when compared to EV, IRA, and IRB expressing cells (Supplementary Figure 2).
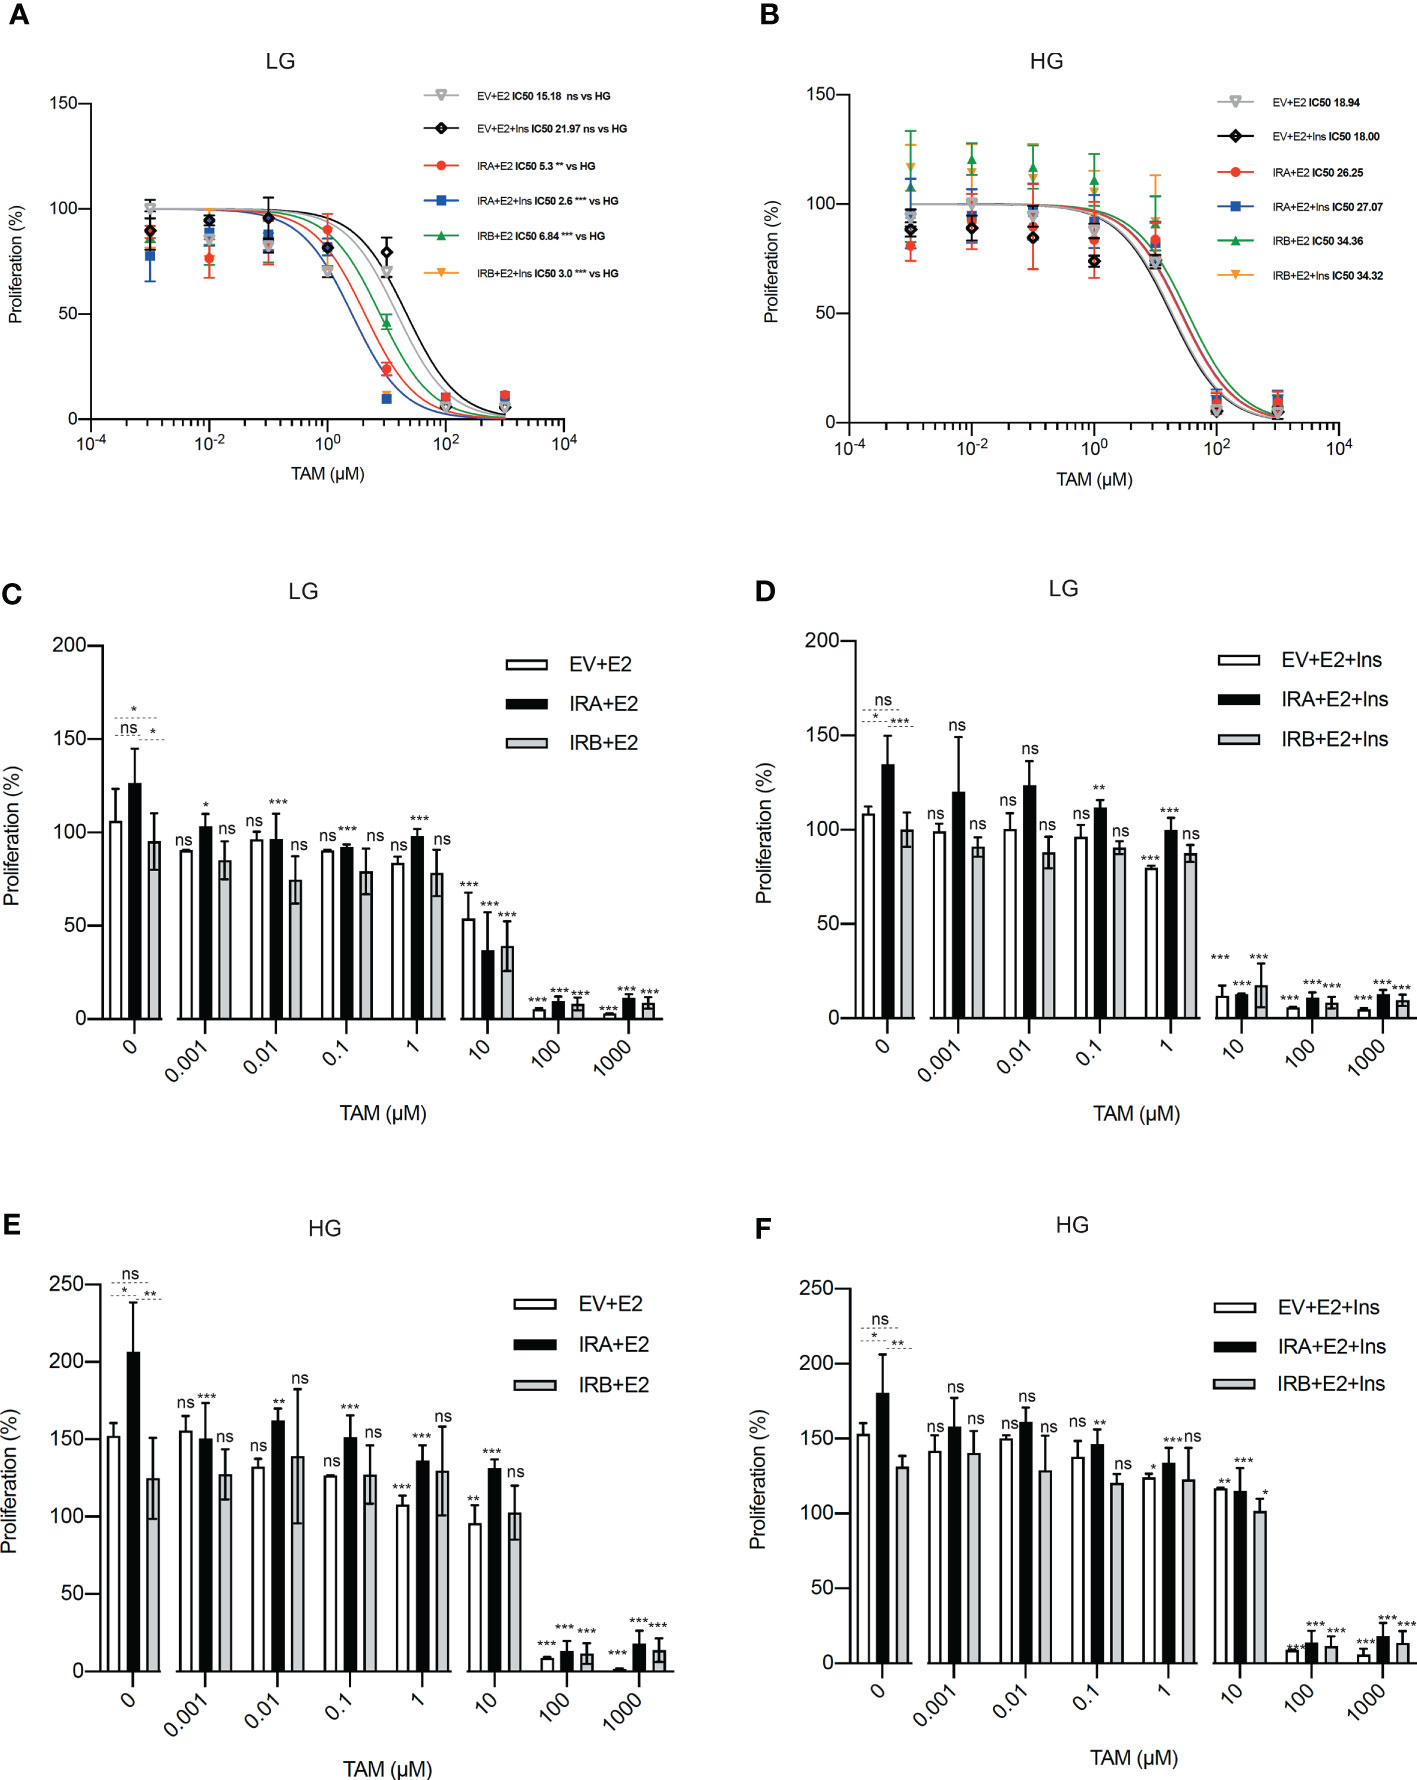
Figure 1 IRA and IRB reduce the TAM activity in the presence of HG. Each cell line was exposed to logarithmic concentrations of TAM and cultured using the indicated conditions of glucose levels, E2 and Ins. (A, B) Curves represent the growth rate used to calculate the IC50TAM value by logistic non-linear regression employing Prism Software v8.0. (C–F) Histograms showing the percentage of proliferation setting at 100% of the growth rate at the start of the experiment, before to insulin stimulation and TAM exposure, for each condition. For all experiments, the bars indicate the standard deviation derived from two independent experiments performed in duplicate using MTT. Statistical analysis was performed using a t-test to compare the untreated conditions and Anova followed by multiple Tukey comparison tests for the TAM-exposed cells (ns, no significant, *p<0.05, **p<0.01, ***p<0.001).
Overall, these data support the role of both IRA and IRB on the modulation of TAM cytotoxicity, critically regulated by glucose levels and insulin stimulation.
Next, we wanted to determine if the observed effects of IRA and IRB on cell proliferation after TAM exposure were dependent on apoptosis and/or cell cycle regulation (Figures 2, 3). We exposed MCF7KOIGFIR-EV, MCF7KOIGFIR-IRA and MCF7KOIGFIR-IRB cell clones to TAM 10µM for 48 hrs in the presence or absence of insulin. Using LG levels, both EV- and IRA-expressing cells were susceptible to the TAM cytotoxicity, the effect that was independent of insulin stimulation (Figures 2A, B), while IRB expression arrested the TAM-induced apoptosis, but only in the absence of insulin. However, we observed an increased necrosis rate in IRB-expressing cells, that was statistically significant after insulin stimulation (Figure 2C). In the presence of HG and regardless of insulin stimulation, EV and IRA failed again to protect the cells from TAM cytotoxicity, while IRB promoted anti-apoptotic activity in all experimental conditions (Figures 2D–F).
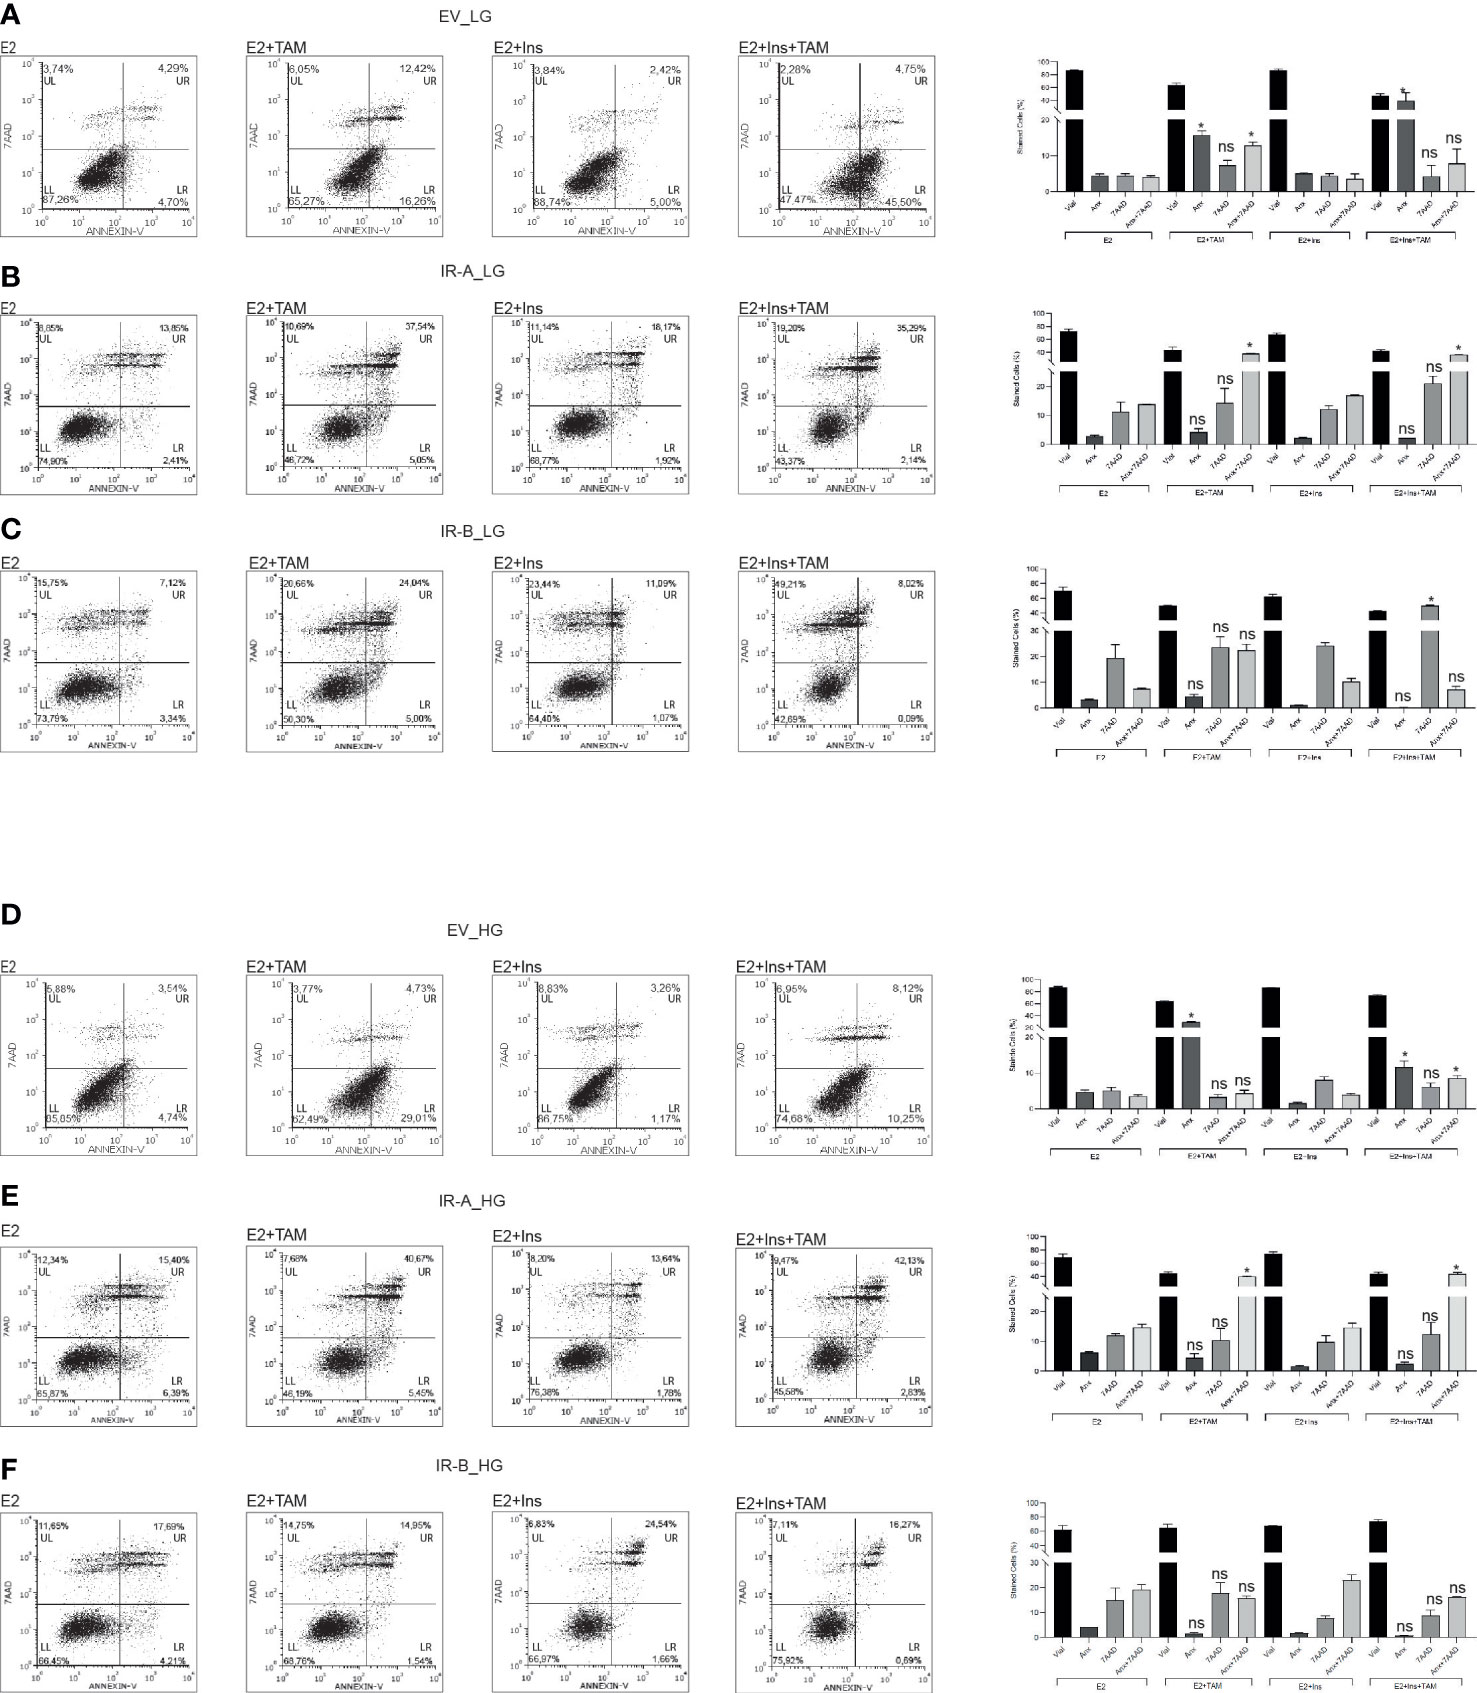
Figure 2 HG promotes the anti-apoptotic activity of IRB after TAM treatment. MCF7KOIGFIR-EV, MCF7KOIGFIR-IRA and MCF7KOIGFIR-IRB cell lines were exposed or not to 10µM TAM and cultured as indicated. Then, cells were collected and stained by Annexin-V (Anx) and 7AAD to evaluate the apoptosis rate in LG (A–C) or HG (D–F) levels. Histograms report the percentage of vital (LL quadrant), Anx (LR quadrant), 7AAD (UL quadrant), or Anx+7AAD (UR quadrant) stained cells, and bars indicate the standard deviation obtained from two independent experiments performed. Anova followed by multiple Tukey comparison tests was performed on a percentage of cells stimulated with insulins compared to the same experimental condition without insulin (ns, no significant, *p<0.05) (LL: lower left, LR: lower right, UL: upper left, UR: upper right).
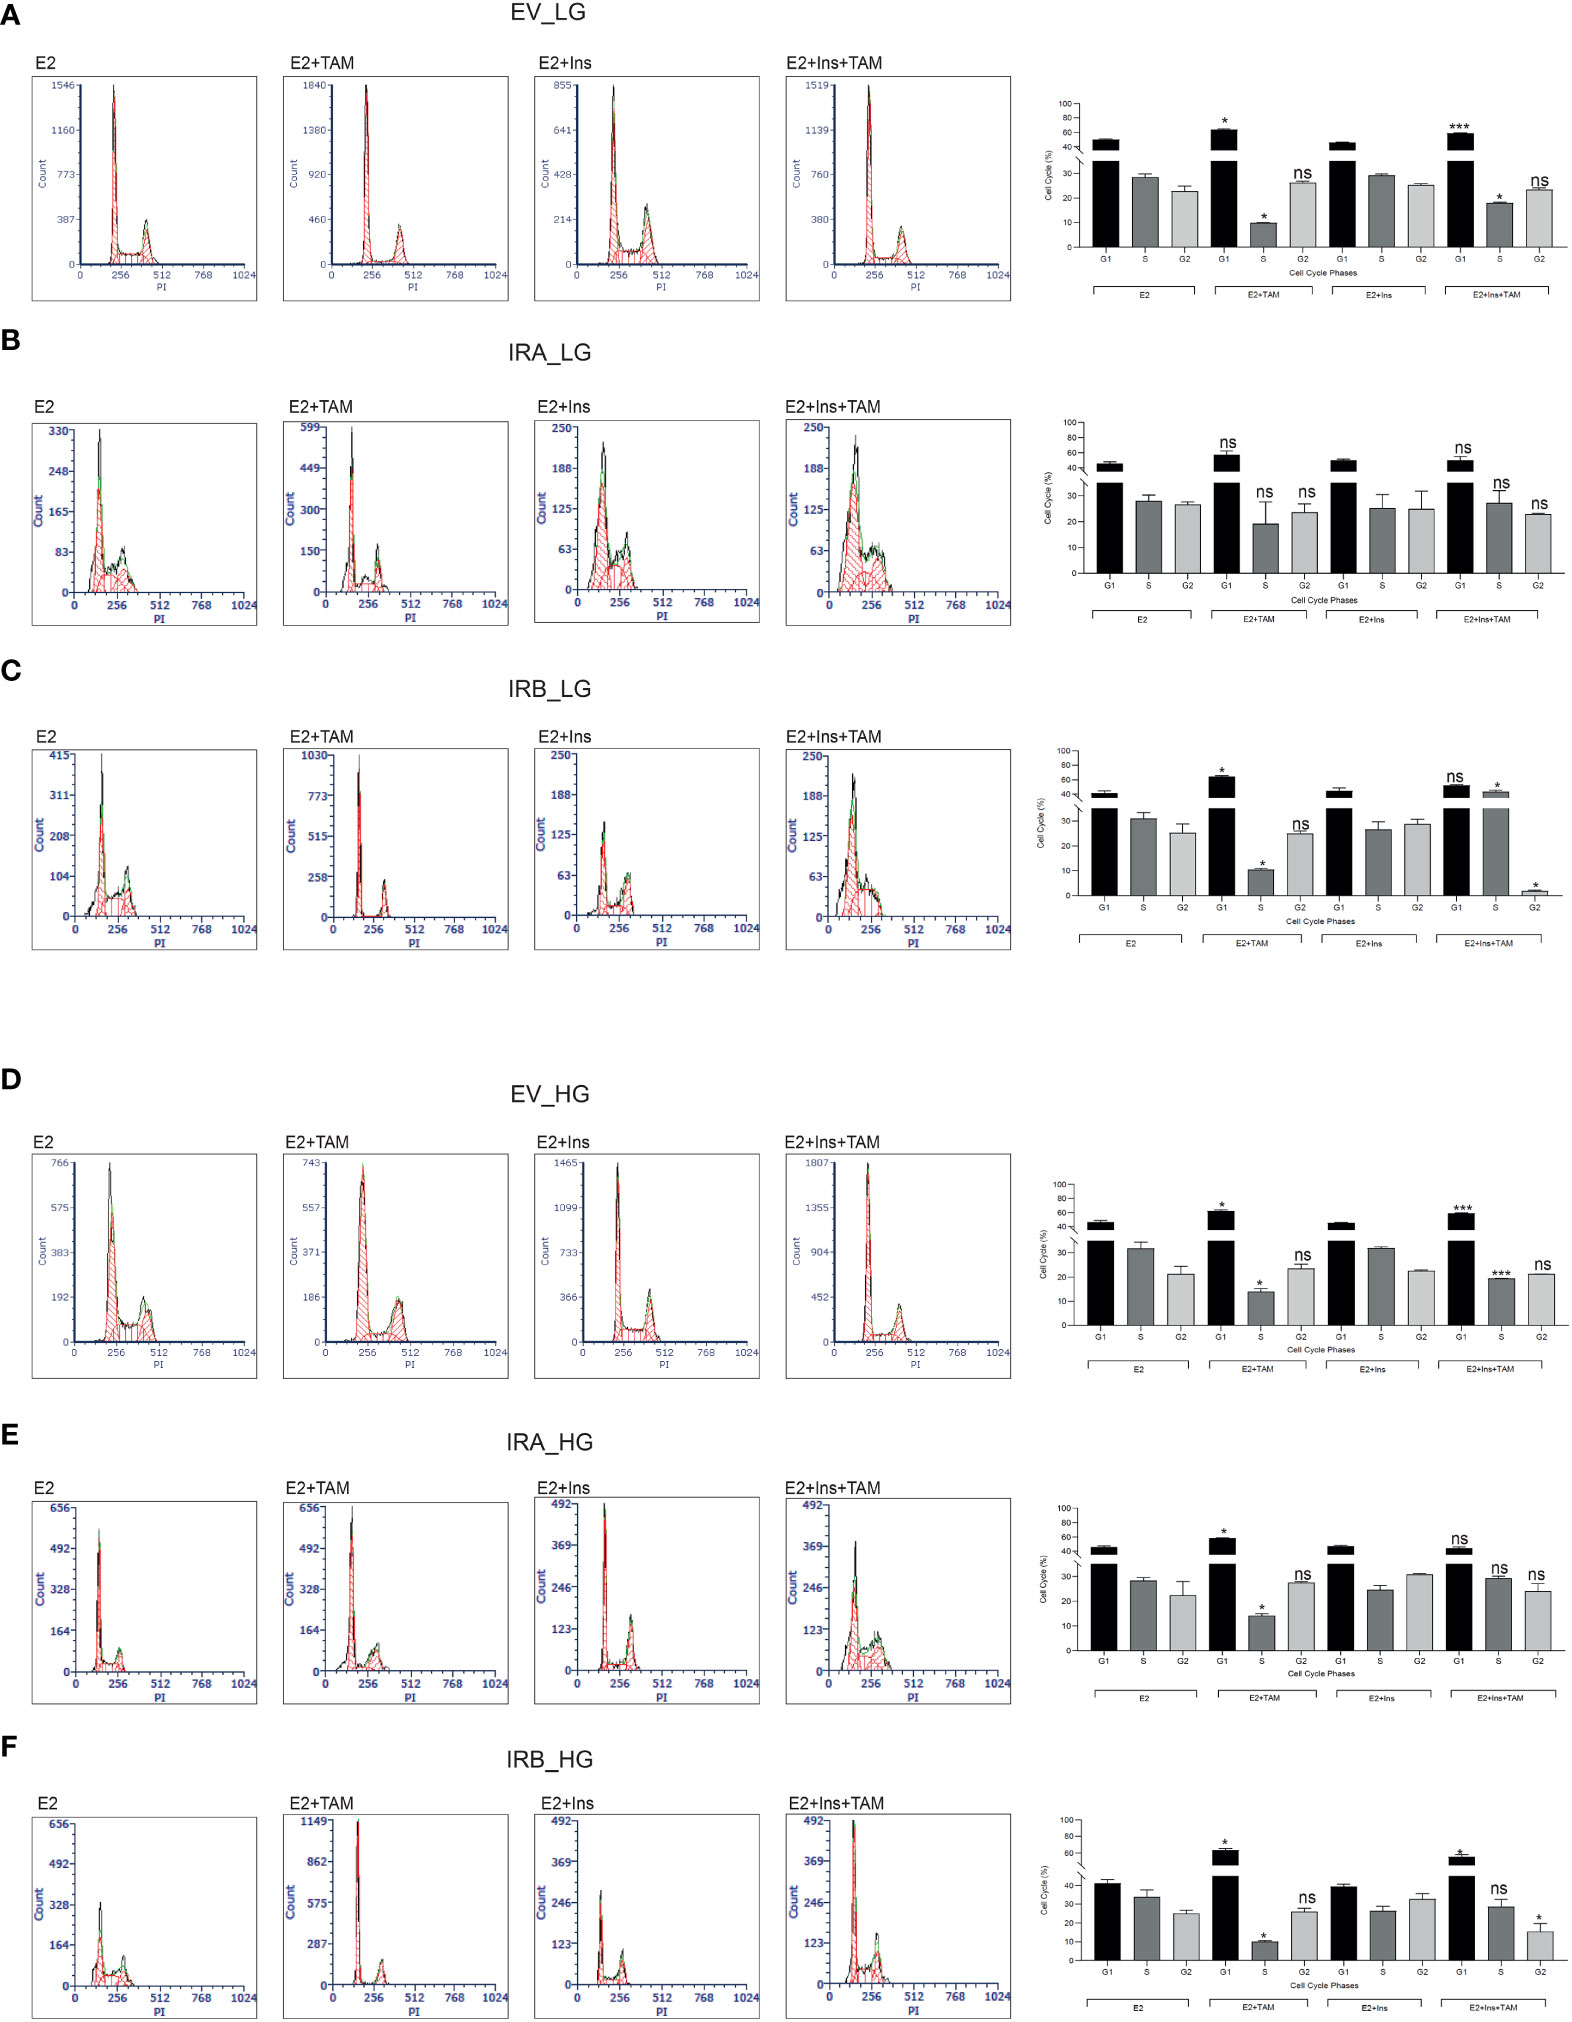
Figure 3 IRB promotes cell cycle arrest after TAM exposure independent of glucose levels. The indicated untreated and 10µM TAM-treated BC cells were collected and stained using propidium iodide. Cells were cultured as reported in the presence of LG (A–C) or HG (C–E). Histograms indicate the percentage of cell cycle distribution for each indicated experimental condition. Bars indicate the standard deviation obtained from two independent. Anova followed by multiple Tukey comparison tests was performed on a percentage of cells stimulated with insulins compared to the same experimental condition without insulin (ns, no significant, *p<0.05, ***p<0.001).
These results suggest that IRA was less effective than IRB to reduce TAM toxicity and that these effects were not dependent on glucose levels or insulin stimulation. On the contrary, IRB activity was dependent on both insulin and glucose concentration.
We then investigated cell cycle progression for each cell line after 10µM TAM exposure for 48 hrs. We found that TAM cytotoxicity was strongly influenced by glucose levels and insulin exposure (Figure 3). By culturing the cells with LG we detected a significant reduction of the S phase in EV-expressing cells after TAM exposure both in the absence and presence of insulin stimulation, an effect that was documented by increasing of G1 phase (Figure 3A). We did not observe a statistically significant modification in cell cycle distribution for IRA expressing cells in all experimental conditions (Figure 3B), suggesting that IRA promoted cell cycle progression even in presence of TAM. Interestingly, IRB showed a dual block mode of cell cycle arrest dependent on its activation by insulin. Without insulin, IRB increased the G1 phase followed by S phase reduction, an effect that was reverted by insulin producing a strong increase of the S phase, and both effects were statistically significant (Figure 3C). Compared to LG, HG levels did not modify the cell cycle modulation of EV, while it altered that mediated by IRA and IRB. In the absence of insulin both IRA and IRB, induced a statistically significant cell cycle block increasing G1 and reducing S phases, an event that was reverted by insulin for IRA but not for IRB. In fact, IRB preserved this effect after insulin stimulation but only for the G1 phase. Both effects were statistically significant when compared with the condition in the absence of insulin exposure (Figures 3C–E).
Interestingly, these results implicate a crucial role of association between glucose levels and insulin stimulation for both insulin receptors that differently regulated apoptosis and cell cycle distribution.
We next wanted to evaluate the ability of IRA and IRB to preserve the surviving cells after the first TAM exposure, comparing them with EV condition. We performed a long-term culture by CFU assay for all MCF7 clones measuring their clonogenicity properties by exposing each cell line to 10µM TAM for 48 hrs and when implanted at the start of the long-term culture (Figure 4). We found that, in LG untreated condition supplement or not by insulin, IRA was more clonogenic than EV and IRB while after TAM exposure the effect was dependent on insulin stimulation. Indeed, IRA and EV expressing cells stimulated or not by insulin were less efficacy, than IRB, to preserve the vital cells that survived at the first TAM exposure, while IRB, showed a statistically significant ability to save the BC cells fraction able to colonies generation, especially in absence of insulin (Figure 4A). Different results were observed when we repeated the same experiment using HG levels. In the absence of insulin, IRA produced a higher number of colonies than IRB, an effect that was restored by insulin stimulation, where the number of colonies generated by two receptors was comparable and not statistically significant. Finally, IRB preserved the clonogenicity of MCF7KOIGFIR-IRB only when we exposed it to 10µM TAM in the absence of insulin. EV-expressing cells showed reduced clonogenicity than IRA and IRB in all experimental conditions independent of insulin stimulation and TAM exposure (Figure 4B).
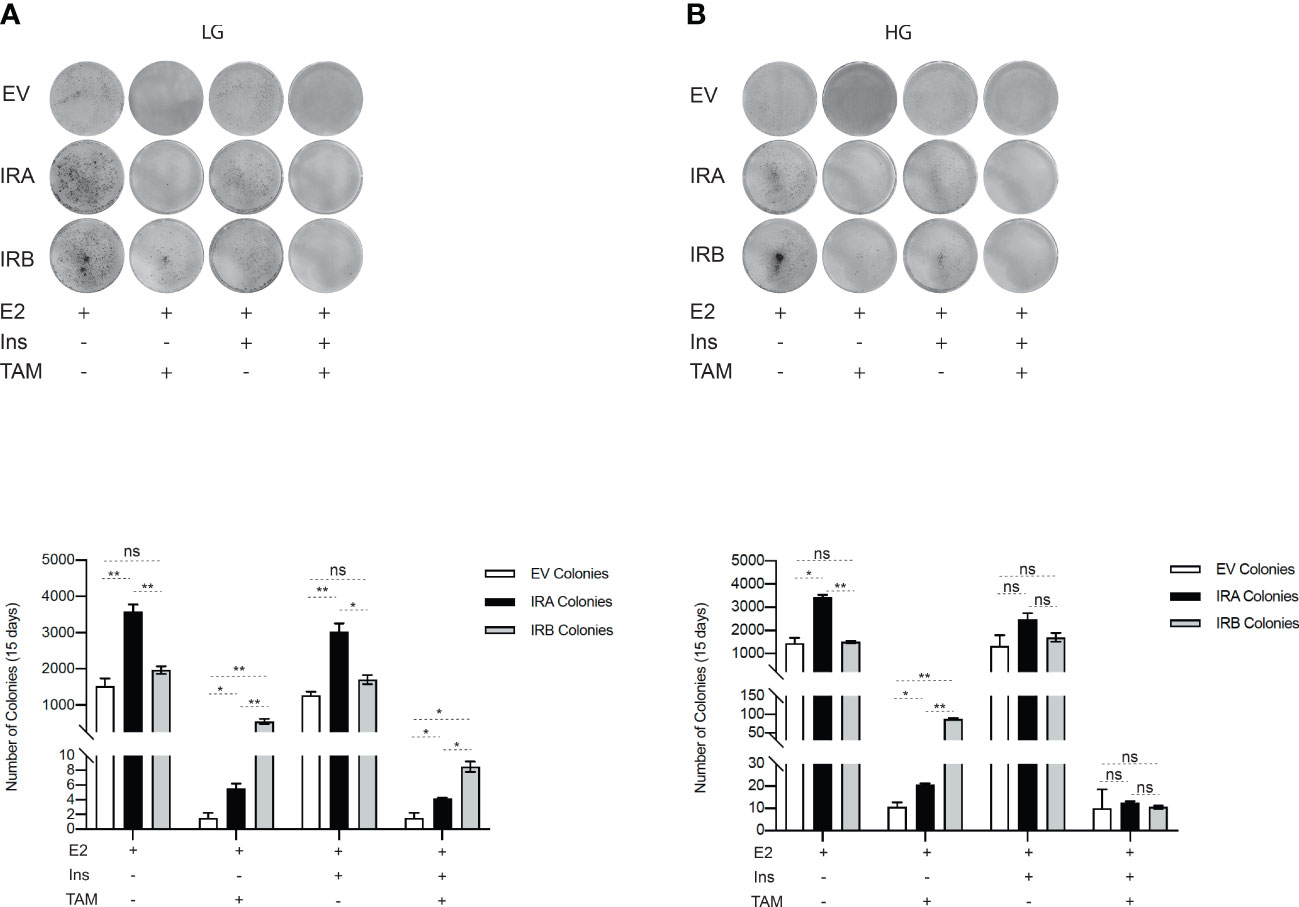
Figure 4 IRB, differently, preserves the clonogenicity of TAM-survived cells according to LG or HG. MCF7KOIGFIR-EV, MCF7KOIGFIR-IRA and MCF7KOIGFIR-IRB untreated and survived to 10µM TAM were exposed again to 10µM TAM and implanted on 6-well to perform long-term culture by clonogenic assay. Cells were maintained in LG (A) or HG (B). The image reports the colonies stained by cristal violet after 15-20 days of culture. Histograms report the number of colonies obtained using Image J software. Bars indicate the standard deviation obtained from two independent experiments. t-test comparison was used to compare a number of different colonies obtained from IRA and IRB for each indicated experimental condition (ns, no significant, *p<0.05, **p<0.01).
Altogether our results support that IRB promotes longer cell survival in response to TAM according to glucose levels and its occupied/unoccupied state.
Given previous findings, we wanted to establish whether a relationship exists between IRs-mediated proliferation, cell cycle, and apoptosis modulation and p21CIP1/WAF1 or ERK1/2 proteins, two well-established mediators of these intracellular events (33, 34). We exposed each breast cancer cell to 10µM TAM in both LG and HG growth medium supplemented or not by insulin for 48 hrs. Then, an immunoblot was performed to analyze the ERK1/2 phosphorylation levels and p21CIP1/WAF1 expression. Moreover, as it was demonstrated that IRs activity is regulated by its ligand-occupied and unoccupied state (26), we also evaluated the phosphorylation levels of both insulin receptors (Figure 5).
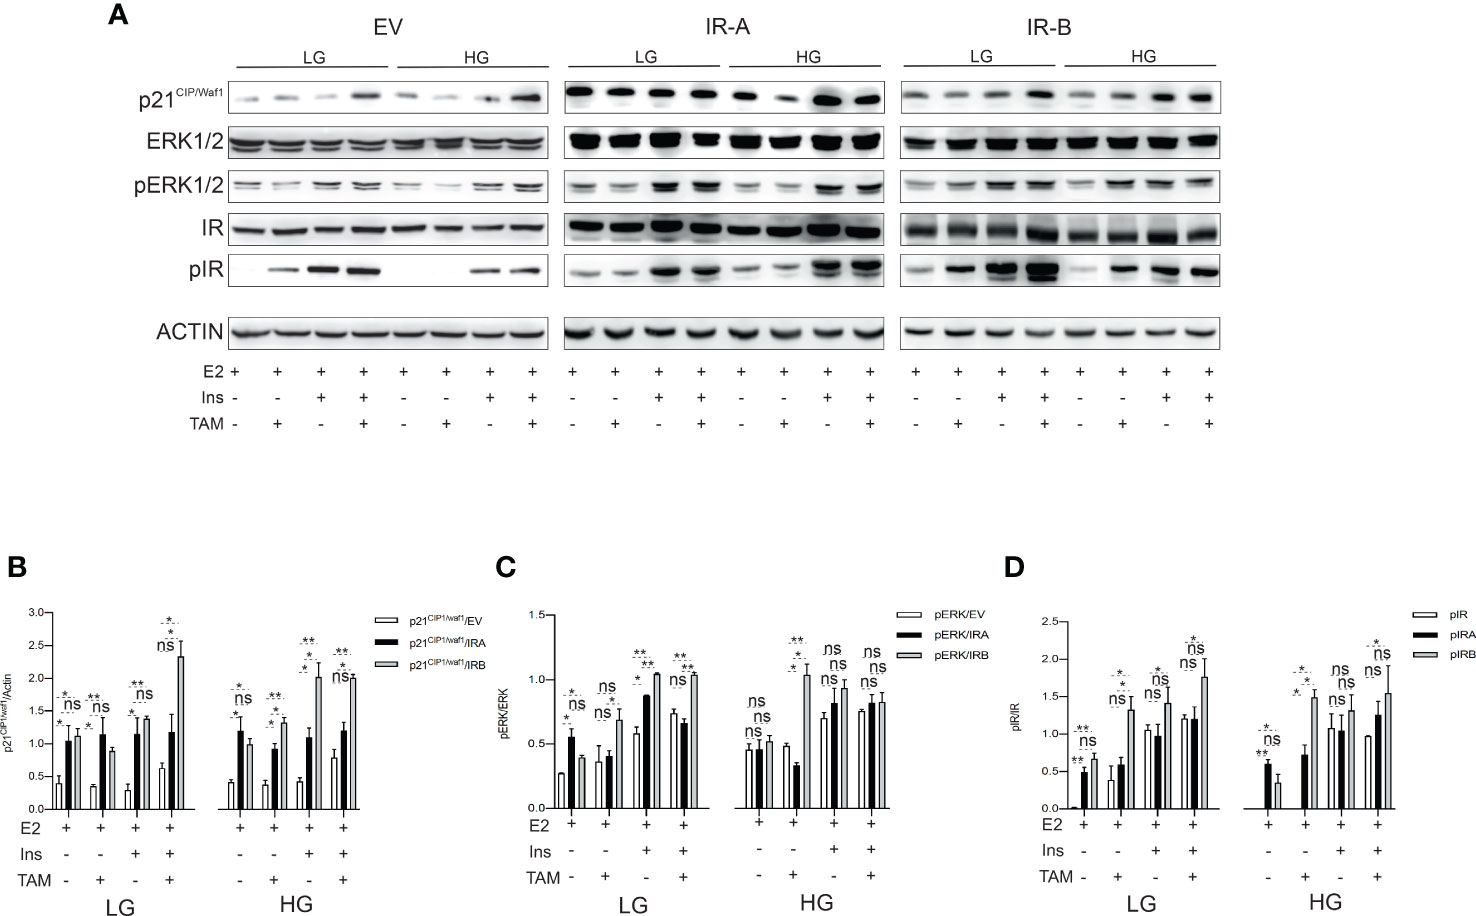
Figure 5 IRB induces p21CIP1/waf1 and ERK1/2 phosphorylation according to glucose levels and insulin stimulation after TAM exposure. MCF7KOIGFIR-IRA, MCF7KOIGFIR-IRA and MCF7KOIGFIR-IRB were cultured as indicated. Untreated or exposed to 10μM TAM were collected after 48 hrs and protein lysates have been prepared. SDS-page was used for protein separation and the nitrocellulose membrane was stained using the primary antibodies directed against the indicated proteins (A). Immunoblot image was used to measure the different protein expressions by densitometric analysis employing Image J software, for p21CIP1/waf1 (B), pERK1/2 (C), and pIR (D). The densitometric unit value was obtained by normalizing the phospho- and total- protein by actin, then the ratio phospho-/total- protein was used for histogram generation. For endogenous IR expression (EV) measuring an anti-insulin receptor antibody was used, while anti-FLAG antibody was employed to detect the expression levels of recombinant IR (IRA, IRB). Bars indicate the standard deviation obtained from two independent experiments. t-test comparison was used to compare different densitometric levels for each indicated experimental condition (ns, no significant, *p<0.05, **p<0.01).
Densitometric analysis (Figure 5A), revealed that the p21CIP1/waf1expression and ERK1/2 phosphorylation have been differently modulated by TAM exposure in EV, IRA and IRB-expressing cells.
In the presence of LG, IRA and IRB increased the basal expression p21CIP1/waf1 when compared to EV. However, IRB, strongly, induced p21CIP1/waf1 once the cells have been exposed to TAM and insulin combination more than IRA. Interestingly, this phenomenon was preserved in the presence of HG, which also, promoted this effect after TAM exposure in both the presence and absence of insulin stimulation, while no difference in p21CIP1/waf1 expression has been observed between the two receptor isoforms in untreated conditions. Finally, EV showed a weak induction of p21CIP1/waf1 and only in the presence of TAM (Figure 5B).
When we analyzed the ERK1/2 phosphorylation levels we found that the glucose levels played a crucial role to determine the IRA- and IRB-mediated effects. When the glucose levels were low, IRB was able to promote the ERK1/2 phosphorylation more prominently than IRA, both in the presence of insulin alone and combined with TAM. Surprisingly, in the absence of insulin and after TAM treatment, IRB determined the same effect especially when the cells were cultured in HG conditions. Finally, the ERK1/2 phosphorylation levels were comparable between two insulin receptors after insulin exposure alone or combined with TAM in the HG medium. No difference in ERK1/2 phosphorylated state was observed in both LG and HG untreated conditions between the two receptor isoforms. In EV-expressing cells, ERK1/2 phosphorylation levels were induced only in the presence of insulin and have been less prominent than IRA and IRB (Figure 5C).
As IR-mediated intracellular signal is dependent on the occupied and unoccupied state of IRs (35, 36), we evaluated their phosphorylation levels following or not insulin exposure. Unexpectedly, we found that in the absence of insulin and after TAM exposure, IRB was activated. This event was independent of glucose levels and statistically significant when compared to IRA. The phosphorylation levels of both IRA and IRB were induced by insulin stimulation in both LG and HG conditions regardless of TAM exposure, and although IRB showed higher phosphorylation levels than IRA, these were not statistically significant. In untreated conditions, no difference between the two insulin receptors has been observed. In the EV condition, which represents the endogenous state of the insulin receptor, the insulin-mediated IR activation was less prominent than IRB but comparable with IRA, while weak or no phosphorylation was observed in the absence of insulin (Figure 5D).
Overall, these findings support a different association of p21CIP1/waf1 and ERK1/2 involvement with occupied and unoccupied states of both IRA and IRB under TAM exposure.
To analyze the HG and LG effects on GEP following insulin stimulation we exposed or not MCF7KOIGF1R-EV, MCF7KOIGF1R-IRA and MCF7KOIGF1R-IRB cells to 10µM TAM for 48 hrs. Then, total RNA was isolated, and RT-qPCR was performed to evaluate the expression of a subset of anti-apoptotic and apoptotic genes (Supplementary Table 1) in TAM-treated cells using the untreated condition as the control for each cell line. Fold change of ≥2 or ≤2 was used as a cutoff to classify the up- and down- regulated genes (Figure 6).
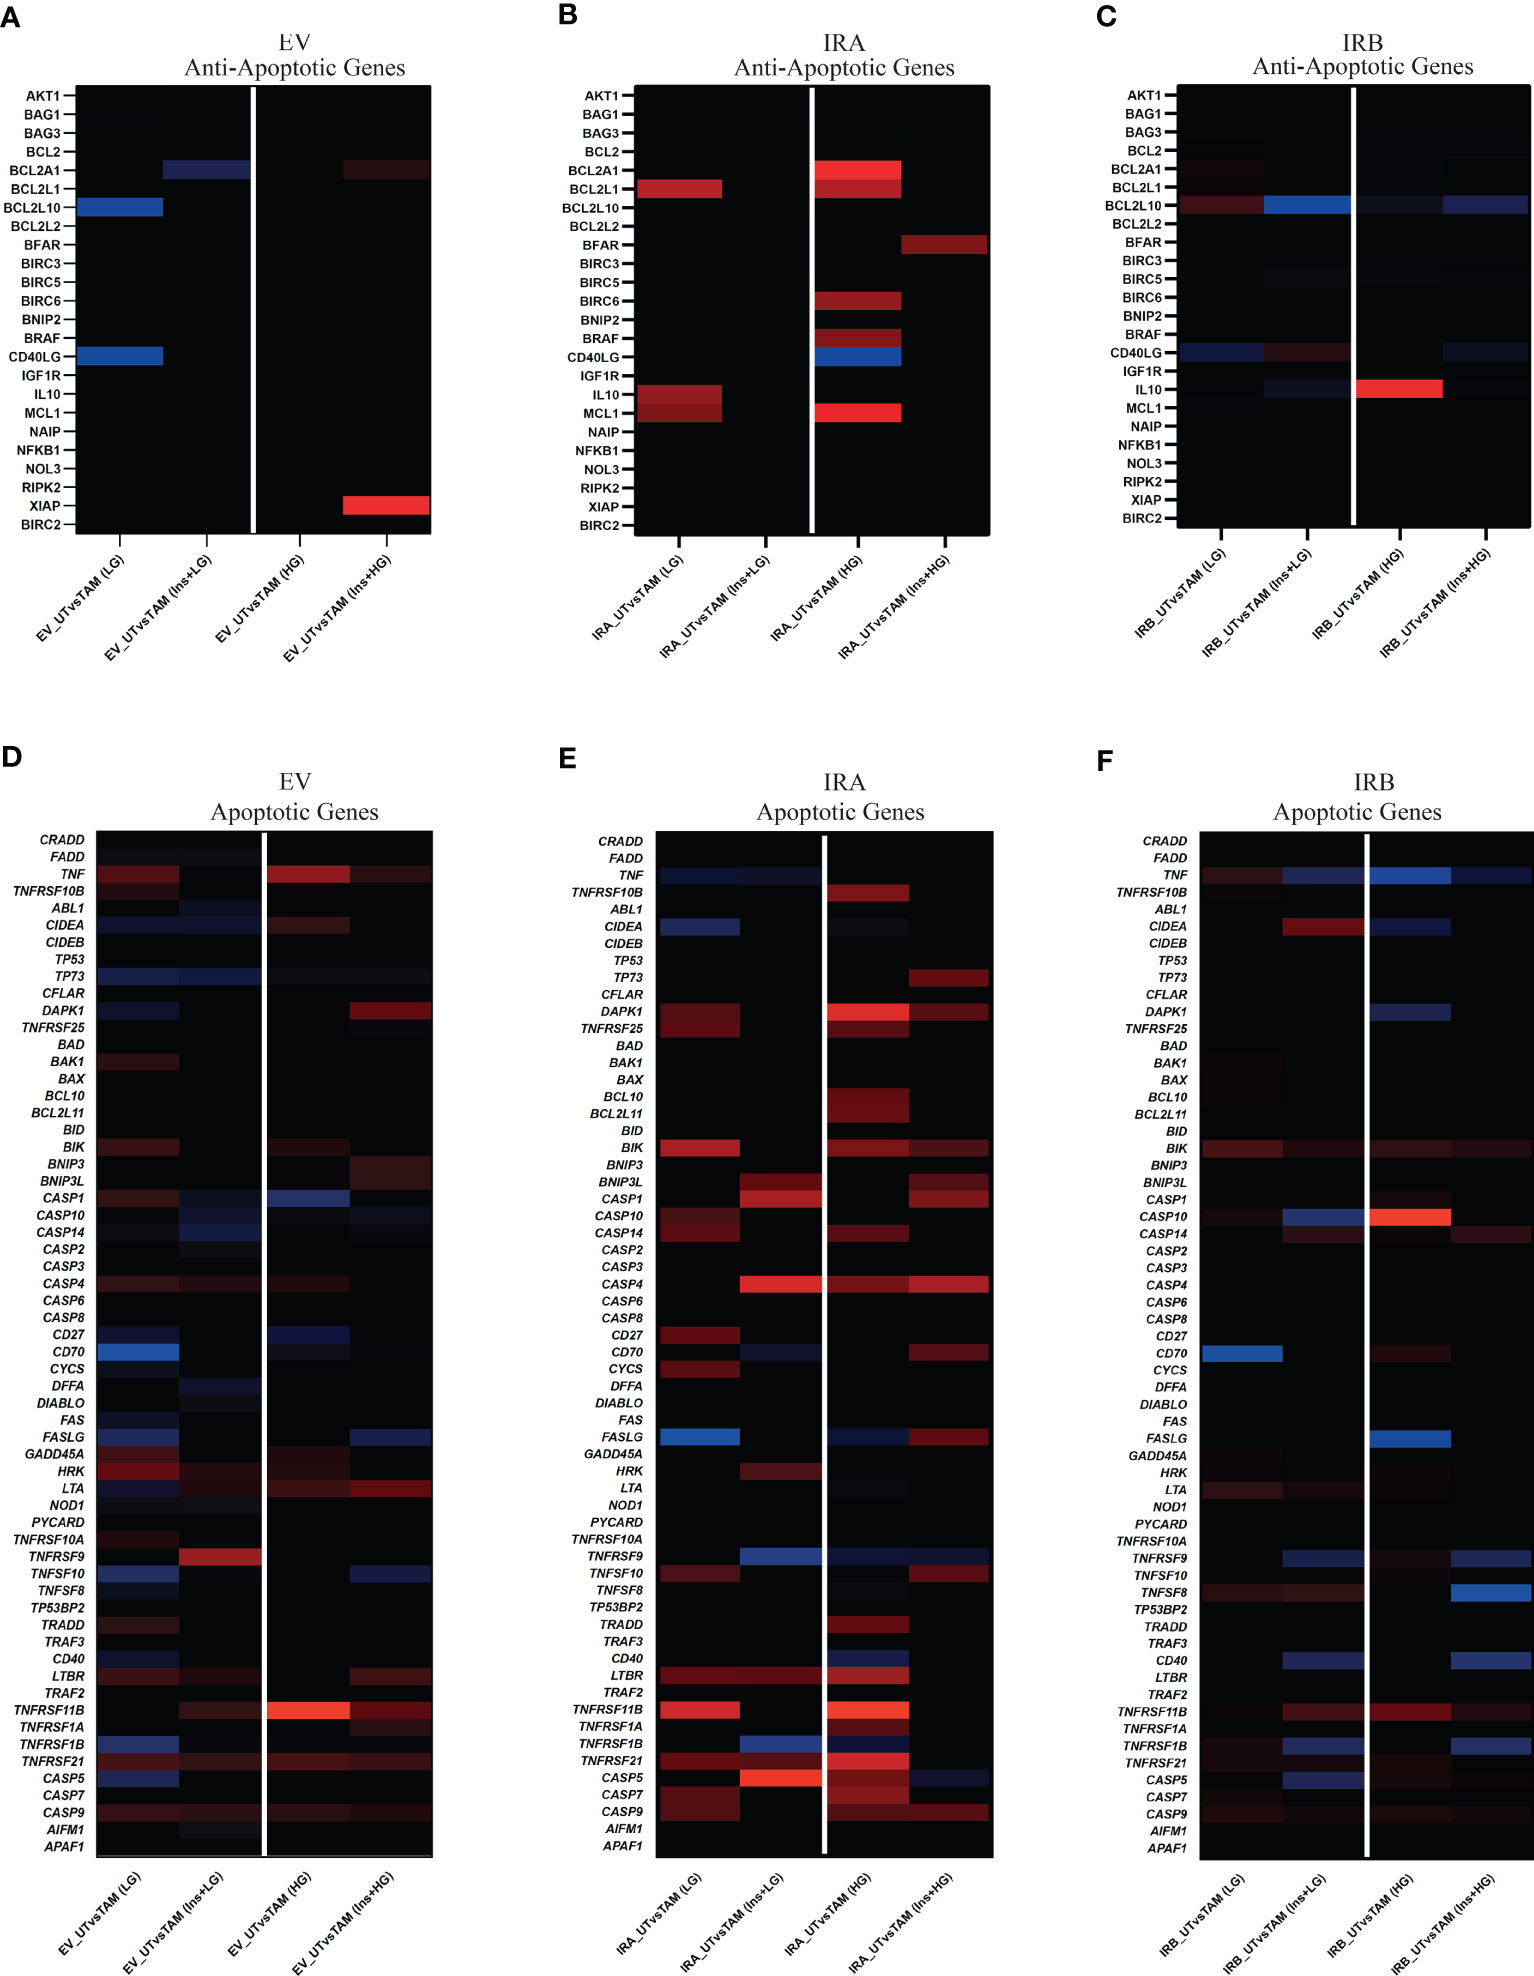
Figure 6 IRA and IRB insulin stimulation induce a GEP profiling revealing a direct involvement of TNF, BCL2, and CASP gene family. MCF7KOIGF1R-EV, MCF7KOIGF1R-IRA and MCF7KOIGF1R-IRB were cultured in LG or HG glucose in the presence of E2 and exposed or not with TAM and/or Ins as indicated. Total RNA was isolated and used for cDNA generation. RT-qPCR was used to quantify the anti- (A–C) and pro-apoptotic (D–F) genes using untreated conditions as control for each cell line. Tile plots show the lower expressed (threshold ≤2, blue) and over-expressed (threshold ≥2, red) of DEG for each subset of analyzed genes.
Independent of glucose concentrations we observed that TAM exposure followed or not by insulin stimulation showed a weak effect on the modulation of anti-apoptotic genes subset in both EV and IRB-expressing cells. Otherwise, insulin exposure reverted the TAM-mediated effect on anti-apoptotic genes in cells over-expressing IRA isoform (Figures 6A–C). When we analyzed the modulation of apoptotic genes in all cell lines, the effects have been dependent on glucose levels and insulin stimulation. In MCF7KOIGFIR-EV cells, we observed a weak over-expression of apoptotic genes in all experimental conditions that were predominant when we cultivated the cells in HG (Figure 6D). Interestingly, the over-expression of IRA or IRB generated a strong modulation of apoptotic genes. In MCF7KOIGFIR-IRA cells, the over-expression of IRA increased apoptotic genes expression levels, an effect that was weakly reduced once the cells have been exposed to insulin stimulation in both LG and HG growth conditions (Figure 6E). Otherwise, the over-expression of IRB induced a very weak expression of apoptotic genes, an effect that was reverted after insulin stimulation where a strong down-regulation of these genes have been observed (Figure 6F; Supplementary Figure 3).
Overall, these findings suggest that the signal transduction pathways following IRA and IRB activation is critically dependent on glucose levels, thus mediating a different biological response to TAM exposure with a predominant apoptotic effect by IRA and anti-apoptotic activity by IRB.
Extensive pre-clinical and clinical results support the crucial role of the insulin/IGF system on breast cancer development, chemoresistance, and progression (9). However, IGFIR inhibition did not prove effective in the treatment of breast cancer so far. This lack of activity potentially relies on the crosstalk between IGFIR, and IR reported in several tumor types, including BC (15, 37, 38). Indeed, BC cells can overcome the IGFIR block, processing the intracellular signaling as a result of a compensatory mechanism (15). In addition, IR signaling is strongly associated with glucose levels (39) and estrogen receptor-mediated pathways in BC (23). Furthermore, previously published data reported the effect of hyperglycemia on chemoresistance (39) and TAM exposure (40) but none of them reported the role of IR isoforms in this field.
In this study, we investigated the role of glucose levels on IRA and IRB activity on ER+ BC cells exposed to TAM. To avoid the compensatory mechanisms mediated by the IGFIR-IRs system, we used an IGFIR-KO BC model preferentially expressing IRA or IRB that we identified as MCF7KOIGF1R-IRA and MCF7KOIGF1R-IRB BC cells comparing the observed effects with cells expressing endogenous levels of IR named MCF7KOIGF1R-EV.
We observed that HG concentrations increased the IC50TAM and reduced the TAM-dependent proliferation arrest. Although IRA was more mitogenic than IRB (26, 41), it unexpectedly showed reduced resistance to TAM cytotoxicity when compared to IRB, which was able to promote a cytostatic effect. However, using a high dose of TAM both receptors showed comparable results which were dependent on glucose levels and insulin stimulation. Surprisingly, we detected that insulin promoted TAM activity in LG conditions while HG levels predominantly induced resistance to TAM especially in IRB-expressing cells.
Previously published data reported that the modulation of apoptosis by insulin receptors is associated with their ligand-occupied or unoccupied state (26, 42). When we analyzed the apoptotic response to TAM, we observed that it was deeply modified by glucose concentrations regardless of the occupied or unoccupied state of both insulin receptors. Both in the presence of LG and HG, IRA was less protective than IRB. In turn, IRB completely blocked the cytotoxic effect of TAM, independent of its insulin stimulation especially when the glucose levels were high. Although these data seem in contrast with what was previously reported (26, 42), they show that glucose levels may modify insulin receptors activity, playing a critical role in TAM response in BC.
Subsequently, by cell cycle analysis we observed that, unlike IRA, IRB induced cell cycle block strongly suggesting that the observed anti-apoptotic activity was dependent on its ability to save the cells inducing their proliferation arrest. These observations are supported by data obtained with IRA, which promoting cell cycle progression was not able to preserve the cell survival from TAM cytotoxicity. Indeed, according to pre-existing evidence, cell cycle block is a survival mechanism used by tumor cells to escape from apoptosis induced by different therapeutic agents (43, 44).
The clonogenic assay is an in-vitro method used to evaluate the long-term culture cell survival based on the ability of a single cell to generate a colony (45). We used this method to measure the ability of IRA and IRB to preserve the BC cell fraction, survived the first TAM exposure, to retain the clonality expansion properties when exposed again to TAM. Regardless of its activation by insulin treatment, IRA was more clonogenic than IRB but less effective to preserve the surviving cells after the first TAM exposure. These findings are consistent with those obtained by cell cycle experiments, suggesting that by inducing cell cycle arrest, IRB promoted the long-term survival of BC cells. These findings are supported by IRB-mediated p21CIP1/waf1 induction, as previously reported (46). Moreover, ER inhibition by TAM promotes CDK4/6 block, which can be overcome by p21CIP1/waf1 resulting in cell survival (47, 48).
ERK1/2 activation is generally associated with both cell survival and apoptosis. This event is based on published observations reporting that the balance between the intensity and duration of both apoptotic and survival signals involving ERK1/2 determines the cell fate (49). We found that both insulin receptors induced ERK1/2 activation. However, only in IRA-expressing cells did the proliferative effect occurr, suggesting that in IRB-expressing cells, the p21CIP1/waf1 induction was the predominant intracellular signal that caused cell cycle arrest (50). As expected, IR phosphorylation levels were induced by insulin (42). However, IRB showed activation even if in the absence of insulin but after TAM exposure. Phosphorylated IRB induced ERK1/2 activation but not p21CIP1/waf1 induction, suggesting an IRB kinase-independent mechanism.
Extensive published data report that the decision of cell fate is strongly dependent on the balance between pro- and anti-apoptotic stimuli (51–53). GEP analysis revealed that anti-apoptotic genes have not been significantly modified for except IRA expressing cells where they have been over-expressed by TAM alone, while after insulin stimulation this effect was lost. Different effects have been observed for apoptotic genes, especially for IRA- and IRB-expressing cells. Indeed, while IRA showed a strong increase in these genes, IRB induced a down-regulation which was prominent after insulin stimulation. Our results suggest that in the presence of IRB, the apoptotic signal was down-regulated while it was up-regulated by IRA (Figure 7). Interestingly, both events were strongly influenced by glucose levels and insulin stimulation, suggesting a critical role of glucose metabolism in both tumor cells (54).
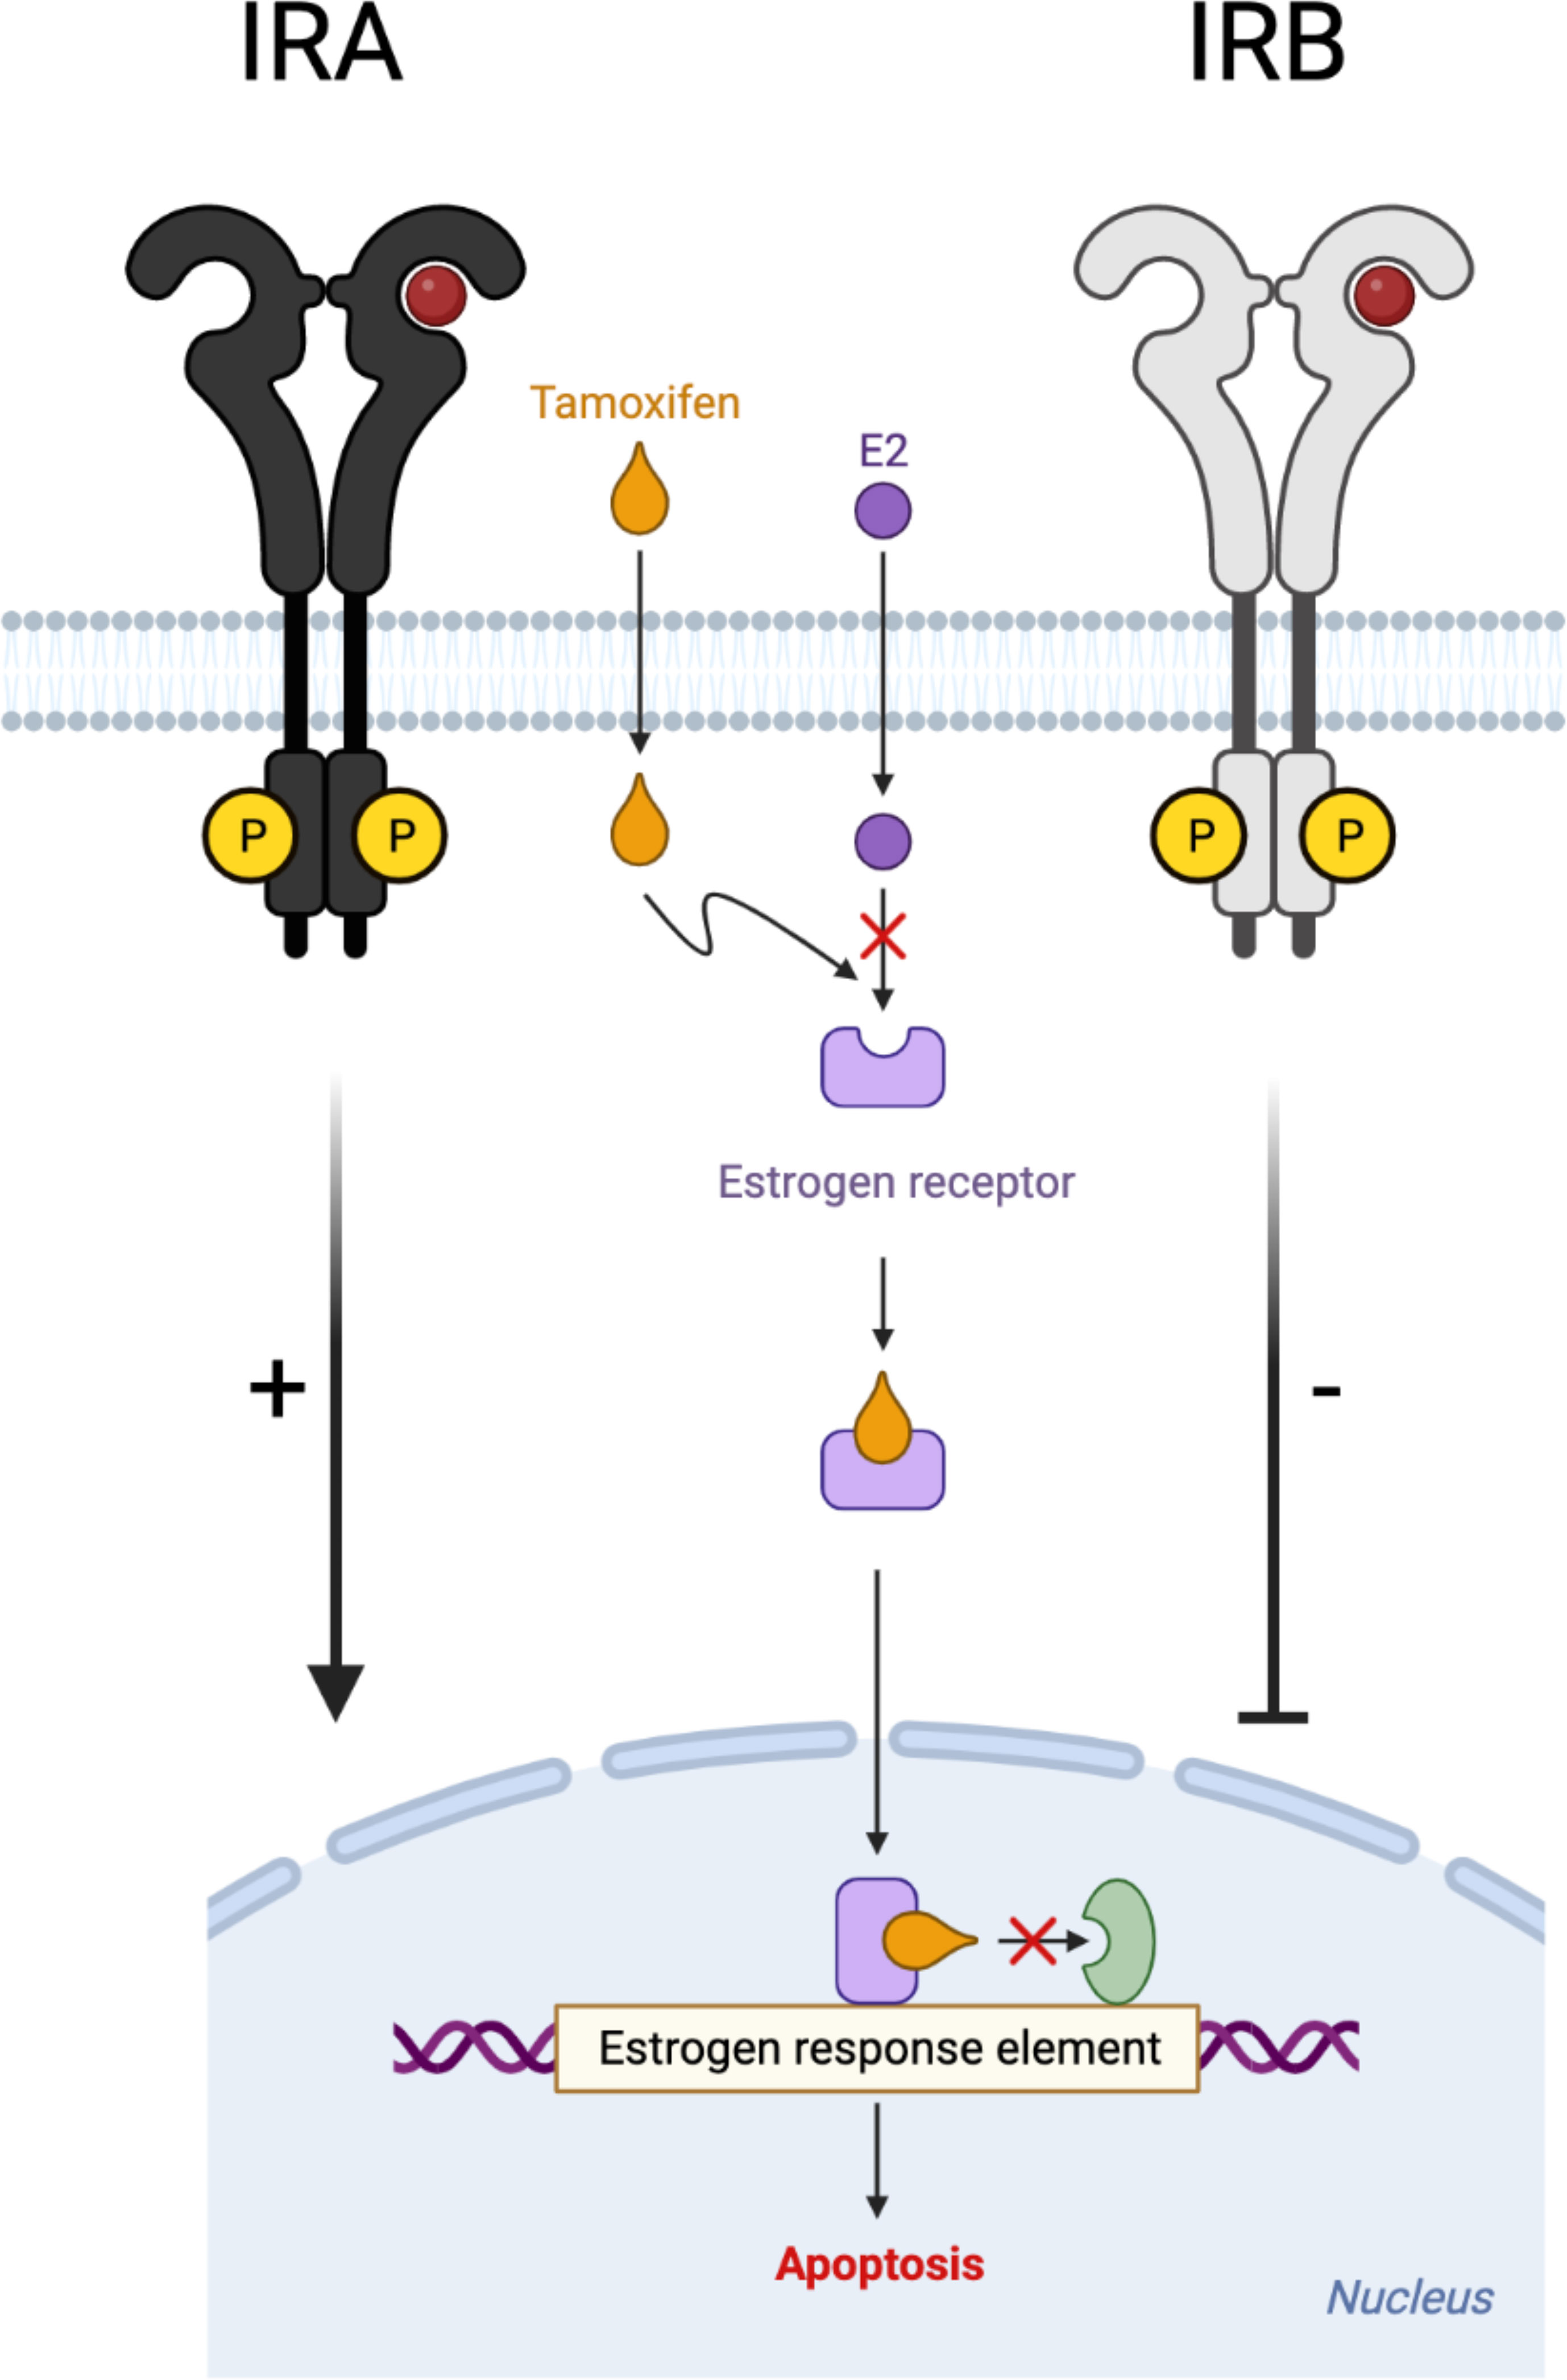
Figure 7 Schematic representation of IRA and IRB role on TAM-induced cytotoxic effect. Different modulation of insulin receptor isoforms (A, B) on TAM-induced cytotoxicity in estrogen-dependent breast cancer cells.
In conclusion, we demonstrate the crucial role of the occupied and unoccupied state of both insulin receptors isoforms in response to TAM in the ER+ BC cell model. Based on these cell culture results, we suggest that the deregulation of glucose metabolism associated with IRA and IRB activation could be investigated as a possible predictive biomarker for treatment with TAM in ER+ BC patients.
The original contributions presented in the study are included in the article/Supplementary Material. Further inquiries can be directed to the corresponding author.
Conceptualization: MM and SS; Formal Analysis: MM, SS and NLP; Investigation: SS, MM, LM, FM, and SV; Data Curation: SS, MM and LM; Writing - Original Draft Preparation: MM and SS; Writing - Review and Editing: SS, MM, LM, SV, FM, NLP and PV; Supervision: PV. All authors contributed to the article and approved the submitted version.
BioRender figure with the credit “Adapted from “Tamoxifen signaling in breast cancer”, by BioRender.com (2022)”.
The authors declare that the research was conducted in the absence of any commercial or financial relationships that could be construed as a potential conflict of interest.
All claims expressed in this article are solely those of the authors and do not necessarily represent those of their affiliated organizations, or those of the publisher, the editors and the reviewers. Any product that may be evaluated in this article, or claim that may be made by its manufacturer, is not guaranteed or endorsed by the publisher.
The Supplementary Material for this article can be found online at: https://www.frontiersin.org/articles/10.3389/fendo.2023.1081831/full#supplementary-material
1. Eliyatkin N, Yalcin E, Zengel B, Aktas S, Vardar E. Molecular classification of breast carcinoma: from traditional, old-fashioned way to a new age, and a new way. J Breast Health (2015) 11(2):59–66. doi: 10.5152/tjbh.2015.1669
2. Stella S, Vitale SR, Massimino M, Motta G, Longhitano C, Lanzafame K, et al. Molecular analysis of luminal androgen receptor reveals activated pathways and potential therapeutic targets in breast cancer. Cancer Genomics Proteomics. (2022) 19(4):464–76. doi: 10.21873/cgp.20333
3. Harbeck N, Penault-Llorca F, Cortes J, Gnant M, Houssami N, Poortmans P, et al. Breast cancer. Nat Rev Dis Primers. (2019) 5(1):66. doi: 10.1038/s41572-019-0111-2
4. Stella S, Vitale SR, Martorana F, Massimino M, Pavone G, Lanzafame K, et al. Mutational analysis of BRCA1 and BRCA2 genes in breast cancer patients from Eastern Sicily. Cancer Manag Res (2022) 14:1341–52. doi: 10.2147/CMAR.S348529
5. Narod SA, Tung N, Lubinski J, Huzarski T, Robson M, Lynch HT, et al. A prior diagnosis of breast cancer is a risk factor for breast cancer in BRCA1 and BRCA2 carriers. Curr Oncol (2014) 21(2):64–8. doi: 10.3747/co.21.1656
6. Engin A. Obesity-associated breast cancer: analysis of risk factors. Adv Exp Med Biol (2017) 960:571–606. doi: 10.1007/978-3-319-48382-5_25
7. Shin E, Koo JS. Glucose metabolism and glucose transporters in breast cancer. Front Cell Dev Biol (2021) 9:728759. doi: 10.3389/fcell.2021.728759
8. Lukasiewicz S, Czeczelewski M, Forma A, Baj J, Sitarz R, Stanislawek A. Breast cancer-epidemiology, risk factors, classification, prognostic markers, and current treatment strategies-an updated review. Cancers (Basel). (2021) 13(17):4287. doi: 10.3390/cancers13174287
9. Biello F, Platini F, D’Avanzo F, Cattrini C, Mennitto A, Genestroni S, et al. Insulin/IGF axis in breast cancer: clinical evidence and translational insights. Biomolecules (2021) 11(1):125. doi: 10.3390/biom11010125
10. Lero MW, Shaw LM. Diversity of insulin and IGF signaling in breast cancer: implications for therapy. Mol Cell Endocrinol (2021) 527:111213. doi: 10.1016/j.mce.2021.111213
11. Bowers Laura W, Rossi Emily L, O'Flanagan Ciara H, deGraffenried Linda A, Hursting Stephen D. The role of the insulin/igf system in cancer: lessons learned from clinical trials and the energy balance-cancer link. Front Endo (2015) 6:77. doi: 10.3389/fendo.2015.00077
12. Simpson A, Petnga W, Macaulay VM, Weyer-Czernilofsky U, Bogenrieder T. Insulin-like growth factor (IGF) pathway targeting in cancer: role of the IGF axis and opportunities for future combination studies. Target Oncol (2017) 12(5):571–97. doi: 10.1007/s11523-017-0514-5
13. Belfiore A, Malaguarnera R. Insulin receptor and cancer. Endocr Relat Cancer. (2011) 18(4):R125–47. doi: 10.1530/ERC-11-0074
14. Vella V, Nicolosi ML, Giuliano M, Morrione A, Malaguarnera R, Belfiore A. Insulin receptor isoform a modulates metabolic reprogramming of breast cancer cells in response to IGF2 and insulin stimulation. Cells (2019) 8(9):1017. doi: 10.3390/cells8091017
15. Rostoker R, Abelson S, Bitton-Worms K, Genkin I, Ben-Shmuel S, Dakwar M, et al. Highly specific role of the insulin receptor in breast cancer progression. Endocr Relat Cancer. (2015) 22(2):145–57. doi: 10.1530/ERC-14-0490
16. Chan JY, Hackel BJ, Yee D. Targeting insulin receptor in breast cancer using small engineered protein scaffolds. Mol Cancer Ther (2017) 16(7):1324–34. doi: 10.1158/1535-7163.MCT-16-0685
17. Vella V, Milluzzo A, Scalisi NM, Vigneri P, Sciacca L. Insulin receptor isoforms in cancer. Int J Mol Sci (2018) 19(11):3615. doi: 10.3390/ijms19113615
18. Samuel SM, Varghese E, Varghese S, Busselberg D. Challenges and perspectives in the treatment of diabetes associated breast cancer. Cancer Treat Rev (2018) 70:98–111. doi: 10.1016/j.ctrv.2018.08.004
19. Yang L, He Z, Yao J, Tan R, Zhu Y, Li Z, et al. Regulation of AMPK-related glycolipid metabolism imbalances redox homeostasis and inhibits anchorage independent growth in human breast cancer cells. Redox Biol (2018) 17:180–91. doi: 10.1016/j.redox.2018.04.016
20. Scabia V, Ayyanan A, De Martino F, Agnoletto A, Battista L, Laszlo C, et al. Estrogen receptor positive breast cancers have patient specific hormone sensitivities and rely on progesterone receptor. Nat Commun (2022) 13(1):3127. doi: 10.1038/s41467-022-30898-0
21. Casa AJ, Potter AS, Malik S, Lazard Z, Kuiatse I, Kim HT, et al. Estrogen and insulin-like growth factor-I (IGF-I) independently down-regulate critical repressors of breast cancer growth. Breast Cancer Res Treat (2012) 132(1):61–73. doi: 10.1007/s10549-011-1540-0
22. De Marco P, Cirillo F, Vivacqua A, Malaguarnera R, Belfiore A, Maggiolini M. Novel aspects concerning the functional cross-talk between the Insulin/IGF-I system and estrogen signaling in cancer cells. Front Endocrinol (Lausanne). (2015) 6:30. doi: 10.3389/fendo.2015.00030
23. Lanzino M, Morelli C, Garofalo C, Panno ML, Mauro L, Ando S, et al. Interaction between estrogen receptor alpha and insulin/IGF signaling in breast cancer. Curr Cancer Drug Targets. (2008) 8(7):597–610. doi: 10.2174/156800908786241104
24. Cuzick J, Sestak I, Cawthorn S, Hamed H, Holli K, Howell A, et al. Tamoxifen for prevention of breast cancer: extended long-term follow-up of the IBIS-I breast cancer prevention trial. Lancet Oncol (2015) 16(1):67–75. doi: 10.1016/S1470-2045(14)71171-4
25. Yao J, Deng K, Huang J, Zeng R, Zuo J. Progress in the understanding of the mechanism of tamoxifen resistance in breast cancer. Front Pharmacol (2020) 11:592912. doi: 10.3389/fphar.2020.592912
26. Massimino M, Sciacca L, Parrinello NL, Scalisi NM, Belfiore A, Vigneri R, et al. Insulin receptor isoforms differently regulate cell proliferation and apoptosis in the ligand-occupied and unoccupied state. Int J Mol Sci (2021) 22(16):8729. doi: 10.3390/ijms22168729
27. Massimino M, Tirro E, Stella S, Manzella L, Pennisi MS, Romano C, et al. Impact of the breakpoint region on the leukemogenic potential and the TKI responsiveness of atypical BCR-ABL1 transcripts. Front Pharmacol (2021) 12:669469. doi: 10.3389/fphar.2021.669469
28. Massimino M, Vigneri P, Stella S, Tirro E, Pennisi MS, Parrinello LN, et al. Combined inhibition of Bcl2 and bcr-Abl1 exercises anti-leukemia activity but does not eradicate the primitive leukemic cells. J Clin Med (2021) 10(23):5606. doi: 10.3390/jcm10235606
29. Tirro E, Massimino M, Romano C, Pennisi MS, Stella S, Vitale SR, et al. Chk1 inhibition restores inotuzumab ozogamicin citotoxicity in CD22-positive cells expressing mutant p53. Front Oncol (2019) 9:57. doi: 10.3389/fonc.2019.00057
30. Buffa P, Romano C, Pandini A, Massimino M, Tirro E, Di Raimondo F, et al. BCR-ABL residues interacting with ponatinib are critical to preserve the tumorigenic potential of the oncoprotein. FASEB J (2014) 28(3):1221–36. doi: 10.1096/fj.13-236992
31. Massimino M, Consoli ML, Mesuraca M, Stagno F, Tirro E, Stella S, et al. IRF5 is a target of BCR-ABL kinase activity and reduces CML cell proliferation. Carcinogenesis (2014) 35(5):1132–43. doi: 10.1093/carcin/bgu013
32. Liu CY, Hung MH, Wang DS, Chu PY, Su JC, Teng TH, et al. Tamoxifen induces apoptosis through cancerous inhibitor of protein phosphatase 2A-dependent phospho-akt inactivation in estrogen receptor-negative human breast cancer cells. Breast Cancer Res (2014) 16(5):431. doi: 10.1186/s13058-014-0431-9
33. Karimian A, Ahmadi Y, Yousefi B. Multiple functions of p21 in cell cycle, apoptosis and transcriptional regulation after DNA damage. DNA Repair (Amst). (2016) 42:63–71. doi: 10.1016/j.dnarep.2016.04.008
34. Chambard JC, Lefloch R, Pouyssegur J, Lenormand P. ERK implication in cell cycle regulation. Biochim Biophys Acta (2007) 1773(8):1299–310. doi: 10.1016/j.bbamcr.2006.11.010
35. De Meyts P. The insulin receptor and its signal transduction network. South Dartmouth (MA): MDText.com, Endotext (2016).
36. Malaguarnera R, Belfiore A. The insulin receptor: a new target for cancer therapy. Front Endocrinol (Lausanne). (2011) 2:93. doi: 10.3389/fendo.2011.00093
37. Mutgan AC, Besikcioglu HE, Wang S, Friess H, Ceyhan GO, Demir IE. Insulin/IGF-driven cancer cell-stroma crosstalk as a novel therapeutic target in pancreatic cancer. Mol Cancer. (2018) 17(1):66. doi: 10.1186/s12943-018-0806-0
38. Bowers LW, Rossi EL, O’Flanagan CH, deGraffenried LA, Hursting SD. The role of the Insulin/IGF system in cancer: lessons learned from clinical trials and the energy balance-cancer link. Front Endocrinol (Lausanne). (2015) 6:77. doi: 10.3389/fendo.2015.00077
39. Qiu J, Zheng Q, Meng X. Hyperglycemia and chemoresistance in breast cancer: from cellular mechanisms to treatment response. Front Oncol (2021) 11:628359. doi: 10.3389/fonc.2021.628359
40. Ambrosio MR, D’Esposito V, Costa V, Liguoro D, Collina F, Cantile M, et al. Glucose impairs tamoxifen responsiveness modulating connective tissue growth factor in breast cancer cells. Oncotarget (2017) 8(65):109000–17. doi: 10.18632/oncotarget.22552
41. Vella V, Giuliano M, La Ferlita A, Pellegrino M, Gaudenzi G, Alaimo S, et al. Novel mechanisms of tumor promotion by the insulin receptor isoform a in triple-negative breast cancer cells. Cells (2021) 10(11):3145. doi: 10.3390/cells10113145
42. Boucher J, Macotela Y, Bezy O, Mori MA, Kriauciunas K. A kinase-independent role for unoccupied insulin and IGF-1 receptors in the control of apoptosis. Sci Signal (2010) 3(151):ra87. doi: 10.1126/scisignal.2001173
43. Dokumcu K, Farahani RM. Evolution of resistance in cancer: a cell cycle perspective. Front Oncol (2019) 9:376. doi: 10.3389/fonc.2019.00376
44. Schwartz GK, Shah MA. Targeting the cell cycle: a new approach to cancer therapy. J Clin Oncol (2005) 23(36):9408–21. doi: 10.1200/JCO.2005.01.5594
45. Franken NA, Rodermond HM, Stap J, Haveman J, van Bree C. Clonogenic assay of cells in vitro. Nat Protoc (2006) 1(5):2315–9. doi: 10.1038/nprot.2006.339
46. Kreis NN, Louwen F, Yuan J. The multifaceted p21 (Cip1/Waf1/CDKN1A) in cell differentiation, migration and cancer therapy. Cancers (Basel). (2019) 11(9):1220. doi: 10.3390/cancers11091220
47. Sobhani N, D’Angelo A, Pittacolo M, Roviello G, Miccoli A, Corona SP, et al. Updates on the CDK4/6 inhibitory strategy and combinations in breast cancer. Cells (2019) 8(4):321. doi: 10.3390/cells8040321
48. Kartika ID, Kotani H, Iida Y, Koyanagi A, Tanino R, Harada M. Protective role of cytoplasmic p21Cip1/Waf1 in apoptosis of CDK4/6 inhibitor-induced senescence in breast cancer cells. Cancer Med (2021) 10(24):8988–99. doi: 10.1002/cam4.4410
49. Mebratu Y, Tesfaigzi Y. How ERK1/2 activation controls cell proliferation and cell death: is subcellular localization the answer? Cell Cycle (2009) 8(8):1168–75. doi: 10.4161/cc.8.8.8147
50. Harada K, Ogden GR. An overview of the cell cycle arrest protein, p21(WAF1). Oral Oncol (2000) 36(1):3–7. doi: 10.1016/S1368-8375(99)00049-4
51. Hague A, Paraskeva C. Apoptosis and disease: a matter of cell fate. Cell Death Differ (2004) 11(12):1366–72. doi: 10.1038/sj.cdd.4401497
52. Childs BG, Baker DJ, Kirkland JL, Campisi J, van Deursen JM. Senescence and apoptosis: dueling or complementary cell fates? EMBO Rep (2014) 15(11):1139–53. doi: 10.15252/embr.201439245
53. O’Brien MA, Kirby R. Apoptosis: a review of pro-apoptotic and anti-apoptotic pathways and dysregulation in disease. J Veterinary Emergency Crit Care (2008) 18(6):572–85. doi: 10.1111/j.1476-4431.2008.00363.x
Keywords: breast cancer, tamoxifen resistance, insulin receptors, glucose level, gene expression regulation
Citation: Stella S, Massimino M, Manzella L, Parrinello NL, Vitale SR, Martorana F and Vigneri P (2023) Glucose-dependent effect of insulin receptor isoforms on tamoxifen antitumor activity in estrogen receptor-positive breast cancer cells. Front. Endocrinol. 14:1081831. doi: 10.3389/fendo.2023.1081831
Received: 27 October 2022; Accepted: 23 May 2023;
Published: 09 June 2023.
Edited by:
Claire Perks, University of Bristol, United KingdomReviewed by:
Norbert Nass, Brandenburg Medical School Theodor Fontane, GermanyCopyright © 2023 Stella, Massimino, Manzella, Parrinello, Vitale, Martorana and Vigneri. This is an open-access article distributed under the terms of the Creative Commons Attribution License (CC BY). The use, distribution or reproduction in other forums is permitted, provided the original author(s) and the copyright owner(s) are credited and that the original publication in this journal is cited, in accordance with accepted academic practice. No use, distribution or reproduction is permitted which does not comply with these terms.
*Correspondence: Stefania Stella, c3RlZmFuaWEuc3RlbEBnbWFpbC5jb20=; c3RlZmFuaWEuc3RlbGxhQHVuaWN0Lml0
†These authors have contributed equally to this work
Disclaimer: All claims expressed in this article are solely those of the authors and do not necessarily represent those of their affiliated organizations, or those of the publisher, the editors and the reviewers. Any product that may be evaluated in this article or claim that may be made by its manufacturer is not guaranteed or endorsed by the publisher.
Research integrity at Frontiers
Learn more about the work of our research integrity team to safeguard the quality of each article we publish.