 Olivia Pizetta Zordão1
 Clara Machado Campolim1
 Victor Yuji Yariwake2Gisele Castro1
 Clílton Kraüss de Oliveira Ferreira3Andrey Santos1Sónia Norberto1
 Mariana Matera Veras2Mario Jose Abdalla Saad1
 Paulo Hilário Nascimento Saldiva2
 Young-Bum Kim4
 Patricia Oliveira Prada1,3*
- 1Department of Internal Medicine, School of Medical Science, State University of Campinas (UNICAMP), Campinas, SP, Brazil
- 2Laboratory of Environmental and Experimental Pathology, Department of Pathology, University of Sao Paulo School of Medicine, Sao Paulo, SP, Brazil
- 3School of Applied Sciences, State University of Campinas (UNICAMP), Limeira, SP, Brazil
- 4Division of Endocrinology, Diabetes and Metabolism, Department of Medicine, Beth Israel Deaconess Medical Center and Harvard Medical School, Boston, MA, United States
Introduction: The timing of maternal exposure to air pollution is crucial to define metabolic changes in the offspring. Here we aimed to determine the most critical period of maternal exposure to particulate matter (PM2.5) that impairs offspring's energy metabolism and gut microbiota composition.
Methods: Unexposed female and male C57BL/6J mice were mated. PM2.5 or filtered air (FA) exposure occurred only in gestation (PM2.5/FA) or lactation (FA/PM2.5). We studied the offspring of both genders.
Results: PM2.5 exposure during gestation increased body weight (BW) at birth and from weaning to young in male adulthood. Leptin levels, food intake, Agrp, and Npy levels in the hypothalamus were also increased in young male offspring. Ikbke, Tnf increased in male PM2.5/FA. Males from FA/PM2.5 group were protected from these phenotypes showing higher O2 consumption and Ucp1 in the brown adipose tissue. In female offspring, we did not see changes in BW at weaning. However, adult females from PM2.5/FA displayed higher BW and leptin levels, despite increased energy expenditure and thermogenesis. This group showed a slight increase in food intake. In female offspring from FA/PM2.5, BW, and leptin levels were elevated. This group displayed higher energy expenditure and a mild increase in food intake. To determine if maternal exposure to PM2.5 could affect the offspring’s gut microbiota, we analyzed alpha diversity by Shannon and Simpson indexes and beta diversity by the Linear Discriminant Analysis (LDA) in offspring at 30 weeks. Unlike males, exposure during gestation led to higher adiposity and leptin maintenance in female offspring at this age. Gestation exposure was associated with decreased alpha diversity in the gut microbiota in both genders.
Discussion: Our data support that exposure to air pollution during gestation is more harmful to metabolism than exposure during lactation. Male offspring had an unfavorable metabolic phenotype at a young age. However, at an older age, only females kept more adiposity. Ultimately, our data highlight the importance of controlling air pollution, especially during gestation.
1 Introduction
Obesity has become a global health challenge reaching alarming prevalence and being a cause of chronic metabolic diseases, including type 2 diabetes (T2DM) (1–3). The etiology of obesity implicates multiple factors involving environmental, genetic, and epigenetic modification (4–7). Clinical, epidemiological, and experimental studies consistently demonstrate that abnormal maternal caloric intake or environment disturbance during the perinatal period favors the development of cardiometabolic diseases in the offspring (6, 8).
The mechanism by which an altered environment during the perinatal period induces obesity remains unknown (8). The hypothalamus is the most studied organ that integrates peripheral signals with neural circuits and nutritional signals, keeping food intake and energy expenditure (EE) in balance (9–11). The arcuate nucleus of the hypothalamus (ARC) has a diversity of neuron populations that control metabolism. Proopiomelanocortin (Pomc) and Agouti-related peptide (Agrp) co-located with neuropeptide Y (Npy) are the most studied that control energy balance. Fasting activates the orexigenic Agrp/Npy neurons inducing food intake (9–14).
In contrast, feeding activates Pomc neurons, suppressing feeding while increasing energy expenditure (15). Failure to develop Pomc and Agrp neurocircuits increases the predisposition to obesity and its comorbidities (8, 16–18). Changes in the maternal diet composition containing a significant amount of saturated fat cause obesity and glucose intolerance (19) and elicit a preference for sucrose (15). Factors other than excess nutrients consumed by the mother can alter the metabolic phenotype of her offspring. Maternal smoking, even at a low-intensity frequency during gestation, is associated with reduced fetal growth and an increased risk of preterm birth (20).
Air pollution exposure containing particulate matter with a small diameter (≤ of 2.5 μm: PM2.5) increases the risk of obesity and T2DM (21–23). The ability of PM2.5 to induce metabolic diseases is based mainly on inflammatory responses induced by its chemical composition, which can also include lipopolysaccharides (LPS) (24–28). LPS is a potent agonist of Toll-Like Receptor 4 (TLR4), considered a part of the etiopathology of obesity and T2DM (25, 29). TLR4 utilizes a canonical signaling cascade activating the upstream nuclear factor of kappa light polypeptide gene enhancer in B-cells inhibitor, alpha (IκB), mainly by inhibitor-IκB kinase (IKK)s, which phosphorylate the IκB, inducing its degradation and releasing the Nuclear Factor Kappa B (NFκB), a transcription factor, to migrate to the cellular nucleus. NFκB in the nucleus increases the transcription of proinflammatory genes such as Tumor Necrosis Factor-alpha (Tnf alfa) (30, 31) and the expression of IKKϵ (IKK epsilon) and TANK-binding kinase 1(TBK1) (32), perpetuating the inflammatory signal. In parallel to inflammation, IKKβ (IKK beta) and IKKϵ are kinases involved in developing insulin resistance and T2DM (33–35). Therefore, the activation of TLR4/NFκB and the IKKϵ pathways are key for inflammatory responses and metabolic dysregulation in numerous tissues.
Recently we showed that short-term exposure (five days) to PM2.5 was sufficient to increase the expression of inflammatory markers such as Tlr4, Ikbke, and Tnf alpha in the hypothalamus causing leptin resistance and obesity at long-term of PM2.5-exposure (36). Other groups have shown that PM exposure activates the NFκB pathway in vivo (mice) and culture cells from different tissues (37, 38).
Due to its lower diameter, PM2.5 can spread into tissues through the lungs and olfactory epithelium (27). A portion of PM2.5 can also be transported to the oropharynx and ingested, reaching the gastrointestinal tract and altering gut permeability and local microbiota (31, 32). Changes in the gut morphophysiology and microbiota facilitate inflammatory responses and might be related to causing metabolic diseases such as obesity and T2DM (39–41).
Evidence suggests that perinatal exposure to PM2.5 might alter the energy metabolism of the offspring (42–50). However, the results are divergent. It is challenging to compare these studies due to the different approaches and protocols for PM2.5 exposures. For instance, some studies employed intratracheal instillation of liquid diesel exhaust PM2.5 (48, 51). In contrast, other studies used natural PM2.5 or filtered air (FA) captured by ambient chambers (49, 50, 52). Besides, the timing points elected to maternal exposures are considerably distinctive among studies, including preconception or offspring exposures in some of them (48–50), which leads to maternal inflammatory responses before conception and direct contact of animals with the particles.
Considering that the time point of maternal PM2.5 exposure is crucial to determine the impact on the metabolic outcomes, specifically on the regulation of feeding and energy expenditure, and to tease apart the effect of preconception maternal exposure to PM2.5, in the present study, we exposed mothers to PM2.5 only during gestation or lactation. We had a control group that received FA simultaneously, and we kept the mothers and offspring on a chow diet. Using this paradigm, we investigated whether exposure to PM2.5 during gestation or lactation alters the metabolic phenotype throughout the offspring’s life. More specifically, we investigated possible changes in 1) body weight, fat mass and lean mass, leptin, food intake, and energy expenditure; 2) hypothalamic neuropeptides and pro-inflammatory markers; 3) the gut microbiota diversity and composition.
2 Materials and methods
2.1 Ethical committee approval
All experiments, animal handling, and breeding were performed following the National Institute of Health guidelines for experimental animals’ use and the approval of the Care of Animals and Ethical Committee for Animal Research of the State University of Campinas (CEUA Protocol 4627-1).
2.2 Animals and diet
The multidisciplinary center for biological research from the State University of Campinas (Sao Paulo, Brazil) provided eight-week-old male and female C57BL/6J mice (CEUA Protocol 4627-1). The animal facility displayed the following features: constant light/dark cycle (12 h/12 h), room temperature (22°C), humidity, and a high-efficiency particulate air filter (HEPA) receiving a standard rodent chow (3.39 kcal/g; Nuvilab CR-1, Nuvital Quimtia, Brazil) and water ad libitum.
After one week of acclimation, we set up breeding cages with two females and one male. Usually, three days were sufficient to initiate the gestation of at least one female. We randomly divided the females into three experimental groups on the first day of gestation:
1. Mothers exposed to PM2.5 during gestation and FA during lactation: PM2.5/FA (n=8)
2. Mothers exposed to FA during gestation and PM2.5 during lactation: FA/PM2.5 (n=8)
3. Mothers exposed to FA during gestation and lactation: FA/FA (n=8)
We recorded the birth weight of each puppy, and the number of puppies per mother was normalized (n=6-8). At weaning (21 days of age), female and male offspring were separated in plastic cages, receiving only a standard diet and water ad libitum. Food intake and body weight were measured weekly. The offspring received only FA from birth to euthanasia. We described all mice ages in the Results and Legends.
2.3 Exposure to PM2.5 or filtered air
The exposures were performed using the ambient particle concentrator (Harvard Ambient Particle Concentrator, HAPC) at the University of São Paulo (USP) in São Paulo, Brazil. We followed the same protocol from previous studies (39, 53–55). Briefly, the HAPC concentrates the ambient particles in the environment, separating fine particles via filters according to aerodynamic sizes, concentrating them from ambient air. The HAPC has two chambers, one filled with concentrated particulate matter (PM2.5) and another with additional filters releasing filtered air (FA). Female (mothers) mice were placed into the chambers according to the groups. Animals were exposed to 600 μg/m3 of PM2.5. The exposure concentration dose was defined based on the cumulative daily dose of exposure (24 hs) of a resident from the city of São Paulo. In São Paulo city, the current annual mean level of PM2.5 is around 25 μg/m³ in 24 hours (the concentration established by World Health Organization). We characterized the PM2.5 composition along the course of the experiments consisting of black carbons, polycyclic aromatic hydrocarbon, and metal trace elements such as Na, Al, Si, P, S, K, Ca, Ti, V, Fe, Ni, Cu, Zn, Pb (53–56). The exposure lasted about one hour and a half, and the mothers returned immediately to their home cages after each exposure.
2.4 Schematic framework
<inline-graphic mimetype="image" mime-subtype="tiff" xlink:href="fmars-09-1005534-g001.tif"/>
2.4.1 Food intake determination
Mice at 13 weeks adapted for 24 h in individual metabolic cages. We recorded food intake for five consecutive days. We calculated the average daily food intake by subtracting the remaining food at the metabolic cage from the delivered food for each mouse.
2.4.2 Energy expenditure
After 24 h of acclimation, we placed random fed male or female offspring in the Oxymax Deluxe System (CLAMS) (Columbus Instruments, Columbus, OH, USA) to measure oxygen (O2) consumption, carbon dioxide (CO2), and respiratory exchange ratio (RER). CLAMS was done in mice at 18-19 weeks.
2.4.3 Hormones measurements
We collected serum from mice at 8-12 weeks old and 30 weeks old. For the young mice, blood was collected from the tail in overnight fasted mice. Blood was collected after euthanization (EU) by decapitation for the older mice. Decapitation was done in overnight fasted mice who received an overdose of a mixture of ketamine hydrochloride (300 mg/kg) and xylazine hydrochloride (30 mg/kg) via intraperitoneal (IP) injection and after the animal lost the reflexes. After blood collection, the serum was obtained via centrifugation and was stored at -80°C until hormone analysis. We determined serum leptin (#EZML-82K, Millipore; Billerica, MA, USA) levels with a commercial ELISA kit (36, 57–62).
2.5 Tissue collection for mRNA and gene expression by qPCR analysis
Mice (18-20 weeks) were euthanized by decapitation after an overdose of ketamine hydrochloride (300 mg/kg) and xylazine hydrochloride (30 mg/kg) via IP injection. BAT and the hypothalamus were dissected, frozen in N2, and stored at -80°C until RNA analysis. As previously described (58, 60), RNeasy Mini Kit from Qiagen (cat#74106; Qiagen Inc, CA, USA), Nanodrop 2000, High-Capacity cDNA Reverse Transcription Kit (cat#4368814, Applied Biosystems, CA, USA), TaqMan and QuantStudio 6 Flex Real-Time PCR System (#4485694) and Data Assist™ software Applied Biosystems, CA, USA) were used to get the relative expression levels of the genes. Used primers were: Npy, Mm003048253_m1; Agrp, Mm00475829_g1; Pomc, Mm00435874_m1; Ikbke, Mm00444862_m1; Ucp1, Mm01244861_m1; Tnf alpha, Mm00443258_m1; Tlr4, Mm00445273_m1; Hprt, Mm01545399_m1.
2.6 Microbiota analysis
Mice (30 weeks) were euthanized by decapitation after an overdose of ketamine hydrochloride (300 mg/kg) and xylazine hydrochloride (30 mg/kg) via IP injection. We collected fecal samples (liquid nitrogen) from mice and stored them at –80°C until we used them. We collected genomic DNA from samples using a QIAamp DNA Stool Mini kit (Qiagen, Hilden, Germany). We amplified the V3–V4 hyper-variable region of the bacterial 16S rRNA gene.
Next, we use the Illumina 16S Metagenomic Sequencing Library Preparation guide (Illumina Technical Note 15044223, no date). We obtained the taxonomic composition of the bacterial communities by analyzing the V3 E V4 region of the 16S rRNA gene using the Illumina® MiSeq platform.
The constructions of the DNA sequencing libraries were performed according to the manufacturer’s instructions (Illumina, San Diego, CA, USA) and followed the same flow described by Caporaso et al. (2012) and Yatsunenko et al. (2012) (63, 64). Using 300 bp paired readings, and MiSeq v3 reagents, the ends of each reading are overlaid to generate complete high-quality readings from the V3 and V4 regions. More than 100,000 readings are generated per sample, commonly recognized as sufficient for metagenomic research. The fastq sequences were analyzed using the Illumina 16S Metagenomics software, which performs the taxonomic classification of the v3/v4 region of the 16S rRNA gene using the DADA2 database. All Metagenomics analysis included in the manuscript is available under request.
2.7 Statistical analysis
We described all statistical analyses and the number of variables in Figure Legends. For metabolic studies, we expressed data as mean ± standard error of the mean (SEM). We applied the Unpaired t-test two-tailed to compare distinct variables. One-way analysis of variance (One-way-ANOVA) was used to compare more than two groups of mice. Two-way ANOVA was applied to compare more than two mice groups in conjunction with the time effect. For One-way-ANOVA and Two-way ANOVA, we used the Bonferroni post hoc test. We used the statistical software GraphPad Prism 7.0. Software (San Diego, CA, USA) to analyze all data. P<0.05 were considered significant and described in the Results section and the Figure Legends. We performed data paired abundance analysis for the Gut Microbiota analysis using the IBM SPSS® 20.0 software (Wilcoxon Signed Ranks Test). The alpha and beta diversity statistical analysis was performed using the EZbioCloud software. The graphs were generated by GraphPad Prism 7.0. Software (San Diego, CA, USA). P<0.05 was considered statistically significant.
3 Results
3.1 Maternal exposure to PM2.5 reprograms the energy balance of adult male and female offspring
We recorded the birth weight (g) of males and females together from the offspring. We did not observe statistical differences in the birth weight among the three groups (mean ± SEM: FA/FA: 1.24 g ± 0.03, n=6; PM2.5/FA: 1.40 g ± 0.04, n=17; FA/PM2.5: 1.41 g ± 0.04, n=8. One Way ANOVA: PM2.5/FA vs. FA/FA p=0.08) (Supplemental Figure 6A). We separated males and females upon weaning.
At weaning, we observed an increased body weight in male offspring from mothers exposed to PM2.5 during gestation (PM2.5/FA) (P<0.001) or lactation (FA/PM2.5) (P<0.01) compared to the control group (FA/FA) (Figure 1A). Male offspring from mothers exposed to PM2.5/FA at eight weeks old displayed a significant increase in body weight compared to FA/FA (P<0.01) and FA/PM2.5 (P<0.01) groups (Figure 1B). Unlike males, the females did not display differences in body weight at weaning among the groups (Figure 1C). In contrast, female PM2.5/FA at eight weeks old displayed a significant increase in body weight compared to FA/FA (P<0.001) and FA/PM2.5 (P<0.01) groups (Figure 1D). Leptin levels were also increased in the PM2.5/FA group compared to FA/FA (P<0.01) and FA/PM2.5 (P<0.001) groups in both genders at 8 weeks (Figures 1E, G).
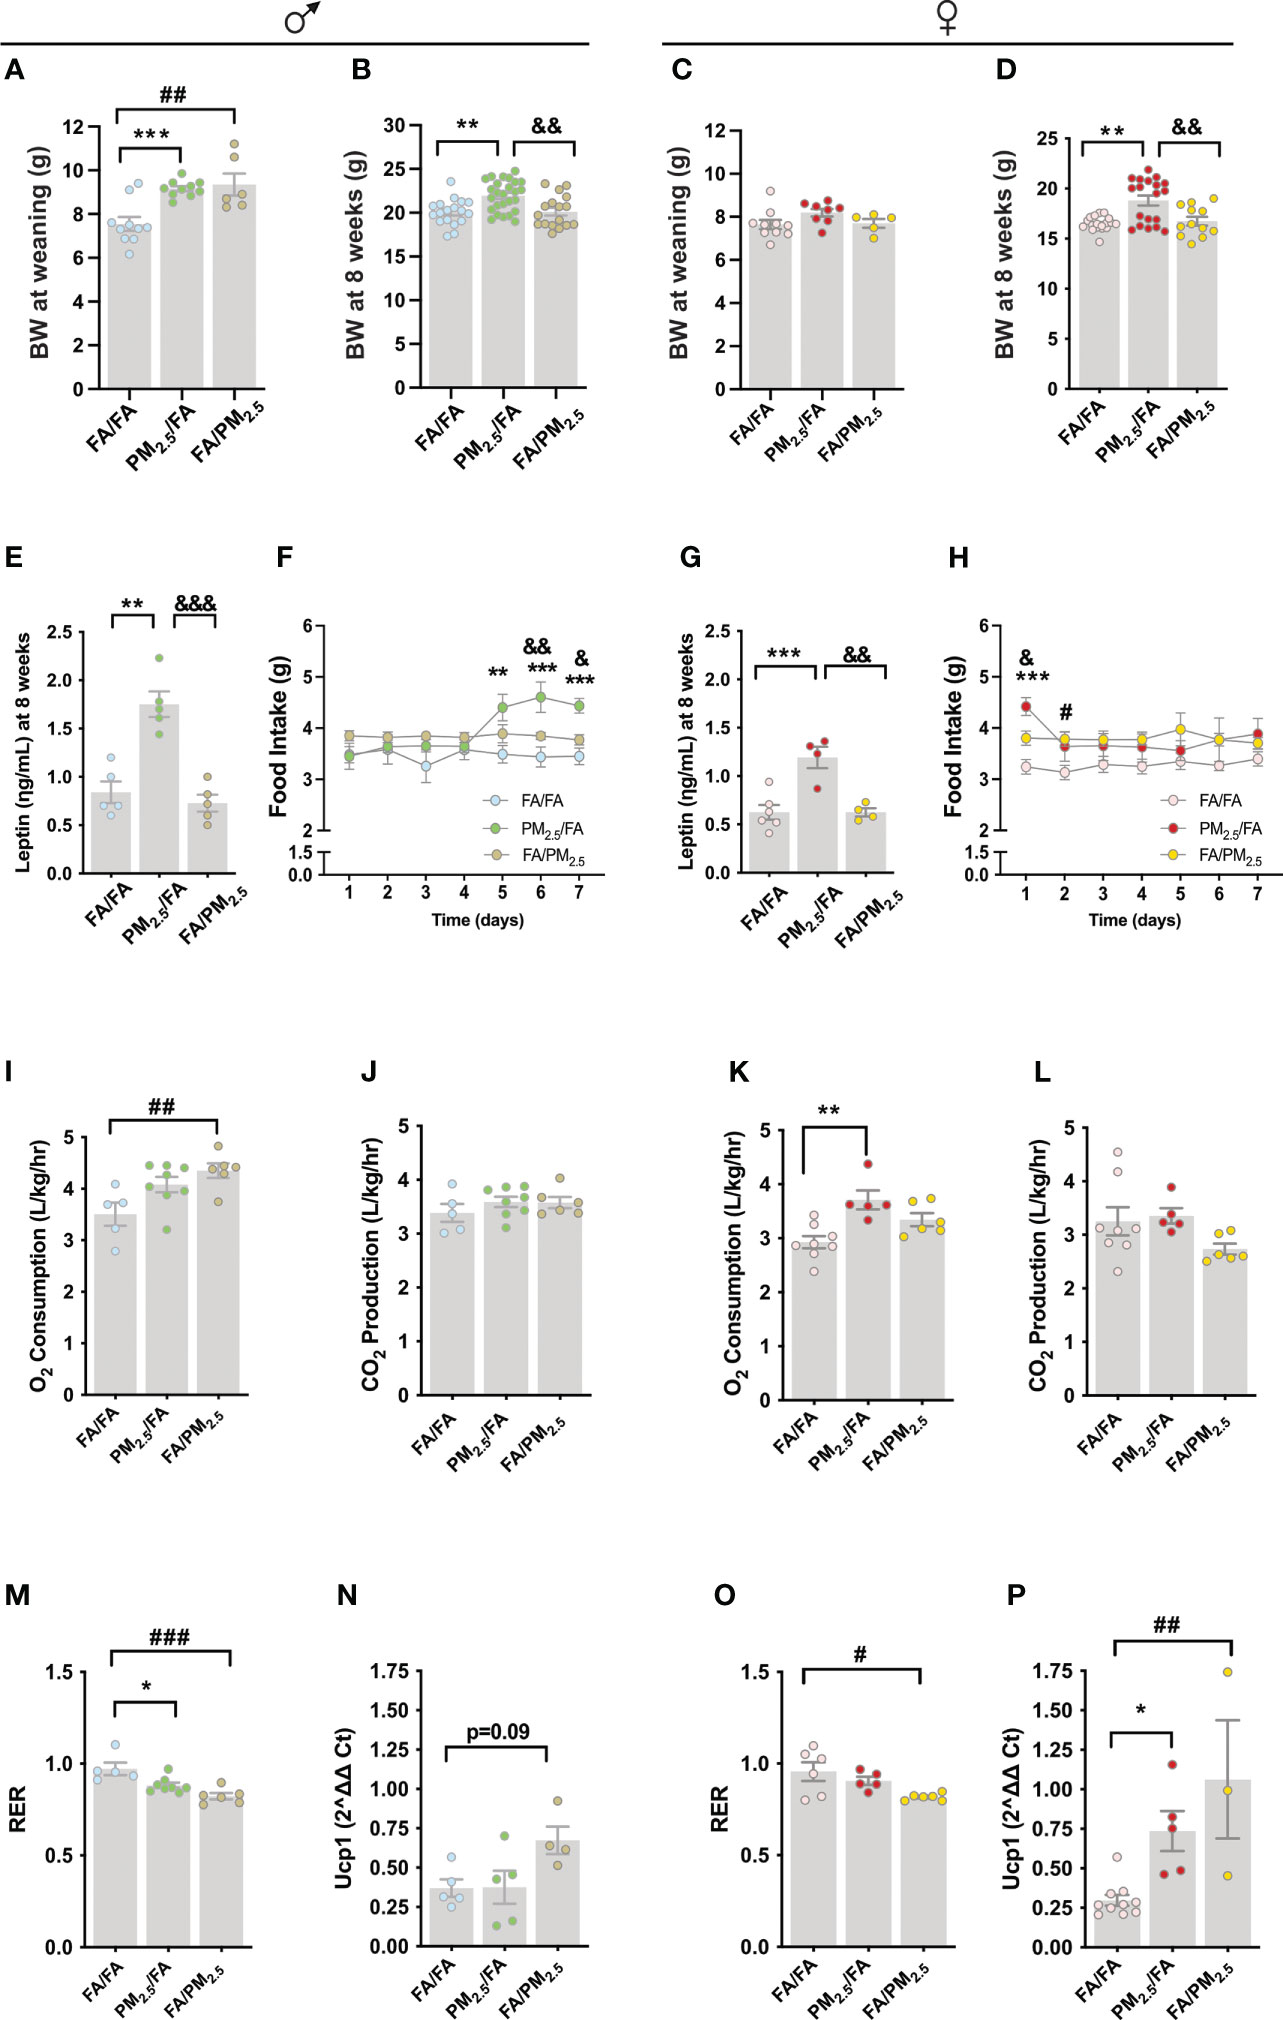
Figure 1 Maternal exposure to PM2.5 alters the energy metabolism of the offspring. (A) Male offspring body weight (g) at weaning, n=6-10. (B) Male offspring body weight (g), n=17-26. (C) Female offspring body weight (g) at weaning, n=5-10. (D) Female offspring body weight (g), n=12-19. (E) Male offspring fasting serum leptin level (ηg/mL), n=5 for each group. (F) Food intake (g), n=5 for each group. (g) Female offspring fasting serum leptin level (ηg/mL), n=3-6 for each group. (H) Female offspring food intake (g), n=5 for each group. (I) Male offspring oxygen (O2) consumption (L/kg/hr), n=5-8. (J) Carbon dioxide (CO2) production (L/kg/hr), n=5-8. (K) Female offspring O2 consumption (L/kg/hr), n=5-8. L. CO2 production (L/kg/hr), n=5-8. M. Male offspring respiratory exchange ratio (RER), n=5-8. N. Uncoupling Protein 1 (Ucp1) gene expression in the brown adipose tissue (BAT), n=8-13. O. Female offspring RER, n=5-8. P. Ucp1 gene expression in the BAT, n=3-10 from female offspring. Offspring mothers were exposed to PM2.5 during pregnancy (PM2.5/FA) or lactation (FA/PM2.5) and filtered air during pregnancy and lactation (FA/FA) as a control group. Panels (B, D, E, G) mice were 8 weeks. Panels (F) and (H), mice were 13-14 weeks. Panels (I-P), mice were 18-19 weeks. Data were expressed as the mean ± SEM. One-way ANOVA was used to analyze Panels (A–E, G) and (I-P). Two-way ANOVA was used for Panels (F) and (H) We used Bonferroni as a post hoc test and a significance of P<0.05. p values: ***P<0.001; **P<0.01; *P<0.05 (PM2.5/FA vs. FA/FA); &&&P<0.001; &&P<0.01; &P<0.05 (PM2.5/FA vs. FA/PM2.5); ###P<0.001; ##P<0.01; #P<0.05 (FA/PM2.5 vs. FA/FA).
To get insight into the mechanism of increased body weight, we measured seven-day food intake in young mice. At this time point, male and female offspring kept similar body weights as we observed at 8 weeks (Supplemental Figures 6D, E). We observed an increased food intake from the fifth through seventh days in the male PM2.5/FA compared to the FA/FA (5th day P<0.01; 6th day P<0.001; 7th day P<0.001) and FA/PM2.5 (6th day P<0.01; 7th day P<0.05) (Figure 1F). In females, food intake was only mildly increased at the beginning of measurement in the PM2.5/FA compared to the FA/FA (P<0.001) and FA/PM2.5 (P<0.05). On the second day of measurement, we observed a significant increase in food intake in the FA/PM2.5 compared to FA/FA group (P<0.05) (Figure 1H).
Curiously, O2 consumption increased only in the male FA/PM2.5 group compared to FA/FA (P<0.01) (Figure 1I). CO2 production was similar among groups (Figure 1J). PM2.5/FA (P<0.05) and FA/PM2.5 (P<0.01) displayed decreased RER compared to the FA/FA group (Figure 1M). Despite increased O2 consumption in the male FA/PM2.5 group, Ucp1 expression in the brown adipose tissue (BAT) was slightly high (P=0.09) in the FA/PM2.5 group than in FA/FA (Figure 1N). In the female offspring, the PM2.5/FA group presented higher (P<0.01) levels of O2 consumption (Figure 1K) consistent with higher (P<0.05) Ucp1 expression (Figure 1P) in the BAT compared to FA/FA. CO2 production was similar among female groups (Figure 1L). FA/PM2.5 displayed decreased RER compared to the FA/FA group (P<0.05) (Figure 1O). We observed higher Ucp1 expression in the BAT of the female FA/PM2.5 (P<0.01) group than in FA/FA (Figure 1P).
3.2 Maternal exposure to PM2.5 alters offspring’s hypothalamic neuropeptides and inflammatory markers
We observed an increase in the Npy gene expression in the hypothalamus of male offspring from the PM2.5/FA group compared to the FA/FA (P<0.05) and FA/PM2.5 (P<0.01) groups. Agrp gene expression was increased in the hypothalamus of male offspring from the PM2.5/FA group compared to the FA/PM2.5 (P<0.01) mice. We did not find differences in the Pomc gene expression in the hypothalamus among the three groups of male offspring (Figure 2A). For the females, we did not observe differences in the Agrp, Npy, and Pomc gene expression in the hypothalamus among the three groups (Figure 2B). Regarding the inflammatory markers, we detected a mild increase (P=0.09) in the Tlr4 gene expression in the hypothalamus of the male PM2.5/FA group compared to FA/FA. PM2.5/FA also displayed higher (P<0.05) levels of Ikkϵ compared to FA/FA and FA/PM2.5 (P=0.06). Tnf alpha gene expression was higher (P<0.01) in the hypothalamus of the PM2.5/FA group than in FA/FA (Figure 2C). Tlr4 gene expression was elevated (P<0.05) in the hypothalamus of the female PM2.5/FA group compared to FA/FA. We did not observe differences in the Ikbke and Tnf alpha gene expression in the hypothalamus among the three groups of females (Figure 2D).
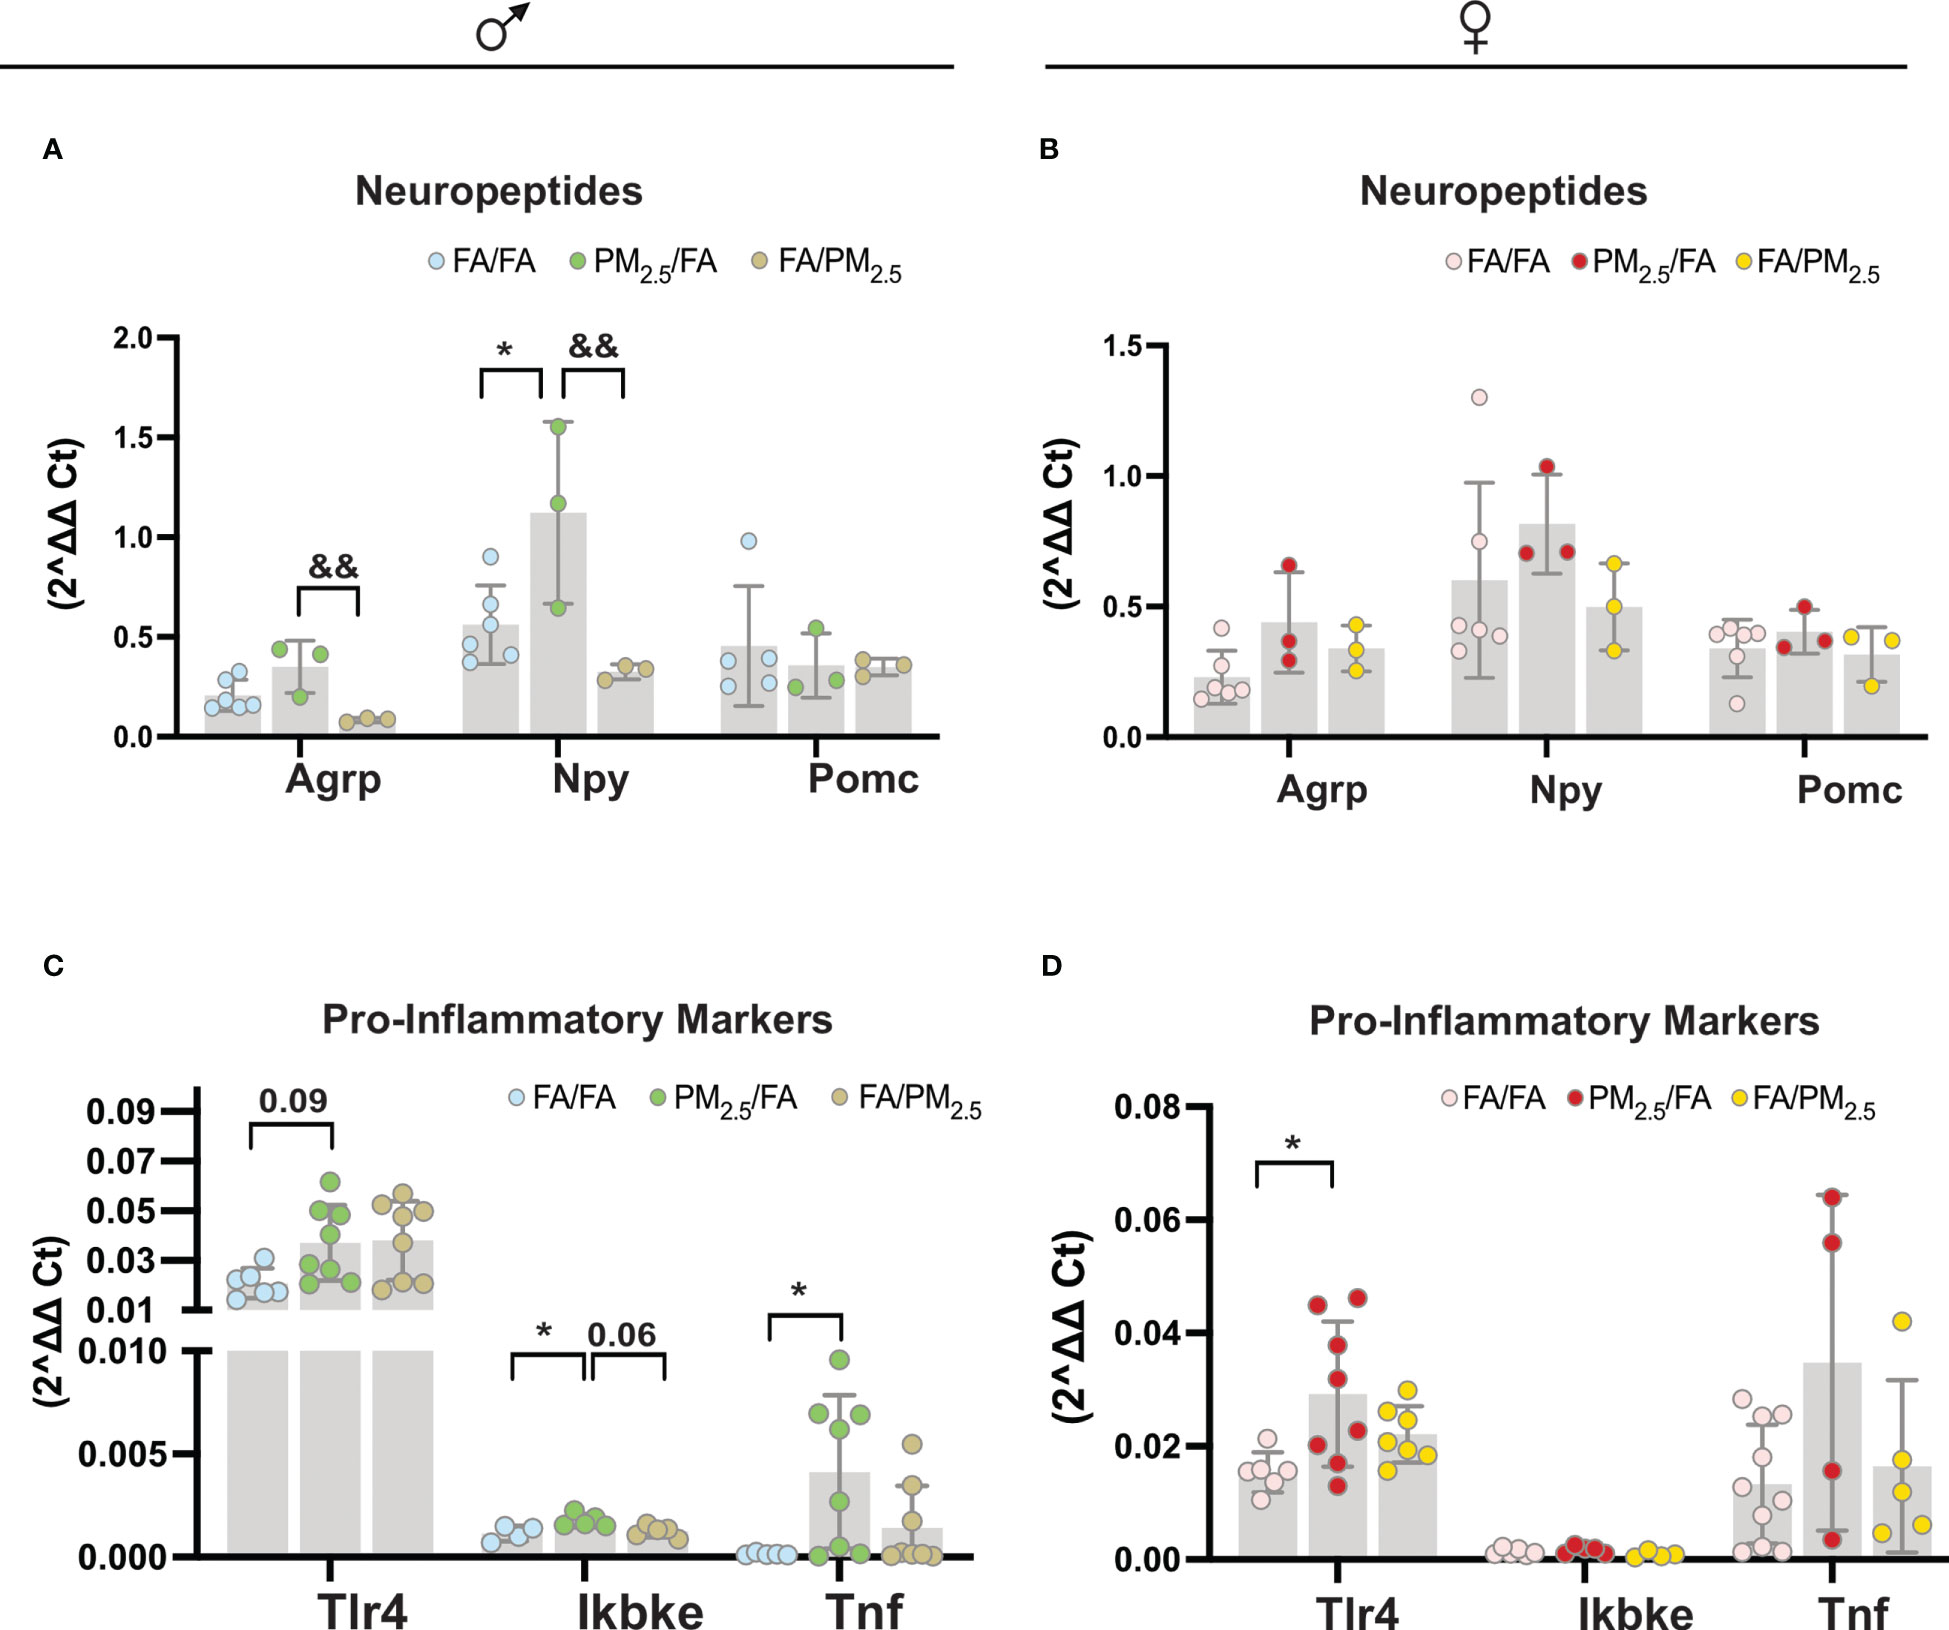
Figure 2 Maternal exposure to PM2.5 alters hypothalamic neuropeptide expression and pro-inflammatory signals significantly in the offspring. (A) (males): Agrp (Agouti-related protein); Npy (neuropeptide Y); and Pomc (Pro-opiomelanocortin) expression in the hypothalamus n=3-6. (B) (females): Agrp (Agouti-related protein); Npy (neuropeptide Y). And Pomc (Pro-opiomelanocortin) expression in the hypothalamus n=3-6. (C) (males): Tlr4 (Toll-like receptor 4); Ikbke and Tnf alpha (Tumor necrosis factor-alpha) expression in the hypothalamus n=4-8. (D) (females): Tlr4 (Toll-like receptor 4); ikke and Tnf alpha (Tumor necrosis factor-alpha) expression in the hypothalamus n=4-11 from offspring whose mothers were exposed to PM2.5 during pregnancy (PM2.5/FA) or lactation (FA/PM2.5) and filtered air during pregnancy and lactation (FA/FA) as a control group. All mice were 20 weeks of age. 2^delta Ct was used to determine each gene expression. Data were expressed as the mean ± SEM. One-way ANOVA was used for the statistical analysis. We used Bonferroni as a post hoc test and a significance of P<0.05. p values: *P<0.05 (PM2.5/FA vs. FA/FA); &&P<0.01 (PM2.5/FA vs. FA/PM2.5).
3.3 Effect of maternal exposure to PM2.5 on gut microbiota
In addition, to evaluate metabolic parameters in young offspring, we re-evaluated body weight, fat mass, leptin levels, and the gut microbiota in mice at 30 weeks. To our surprise, male offspring lost the difference in their body weight (Figure 3A). We found no differences in fat mass among the three groups (FA/FA, PM2.5/FA, and FA/PM2.5) (Figure 3B). These results were accompanied by no differences in serum leptin levels (Figure 3C). For female offspring, we did not observe differences in body weight (Figure 3D). However, fat mass (P<0.01) and leptin levels (P<0.05) were higher in the PM2.5/FA than in FA/FA group (Figures 3E, F).
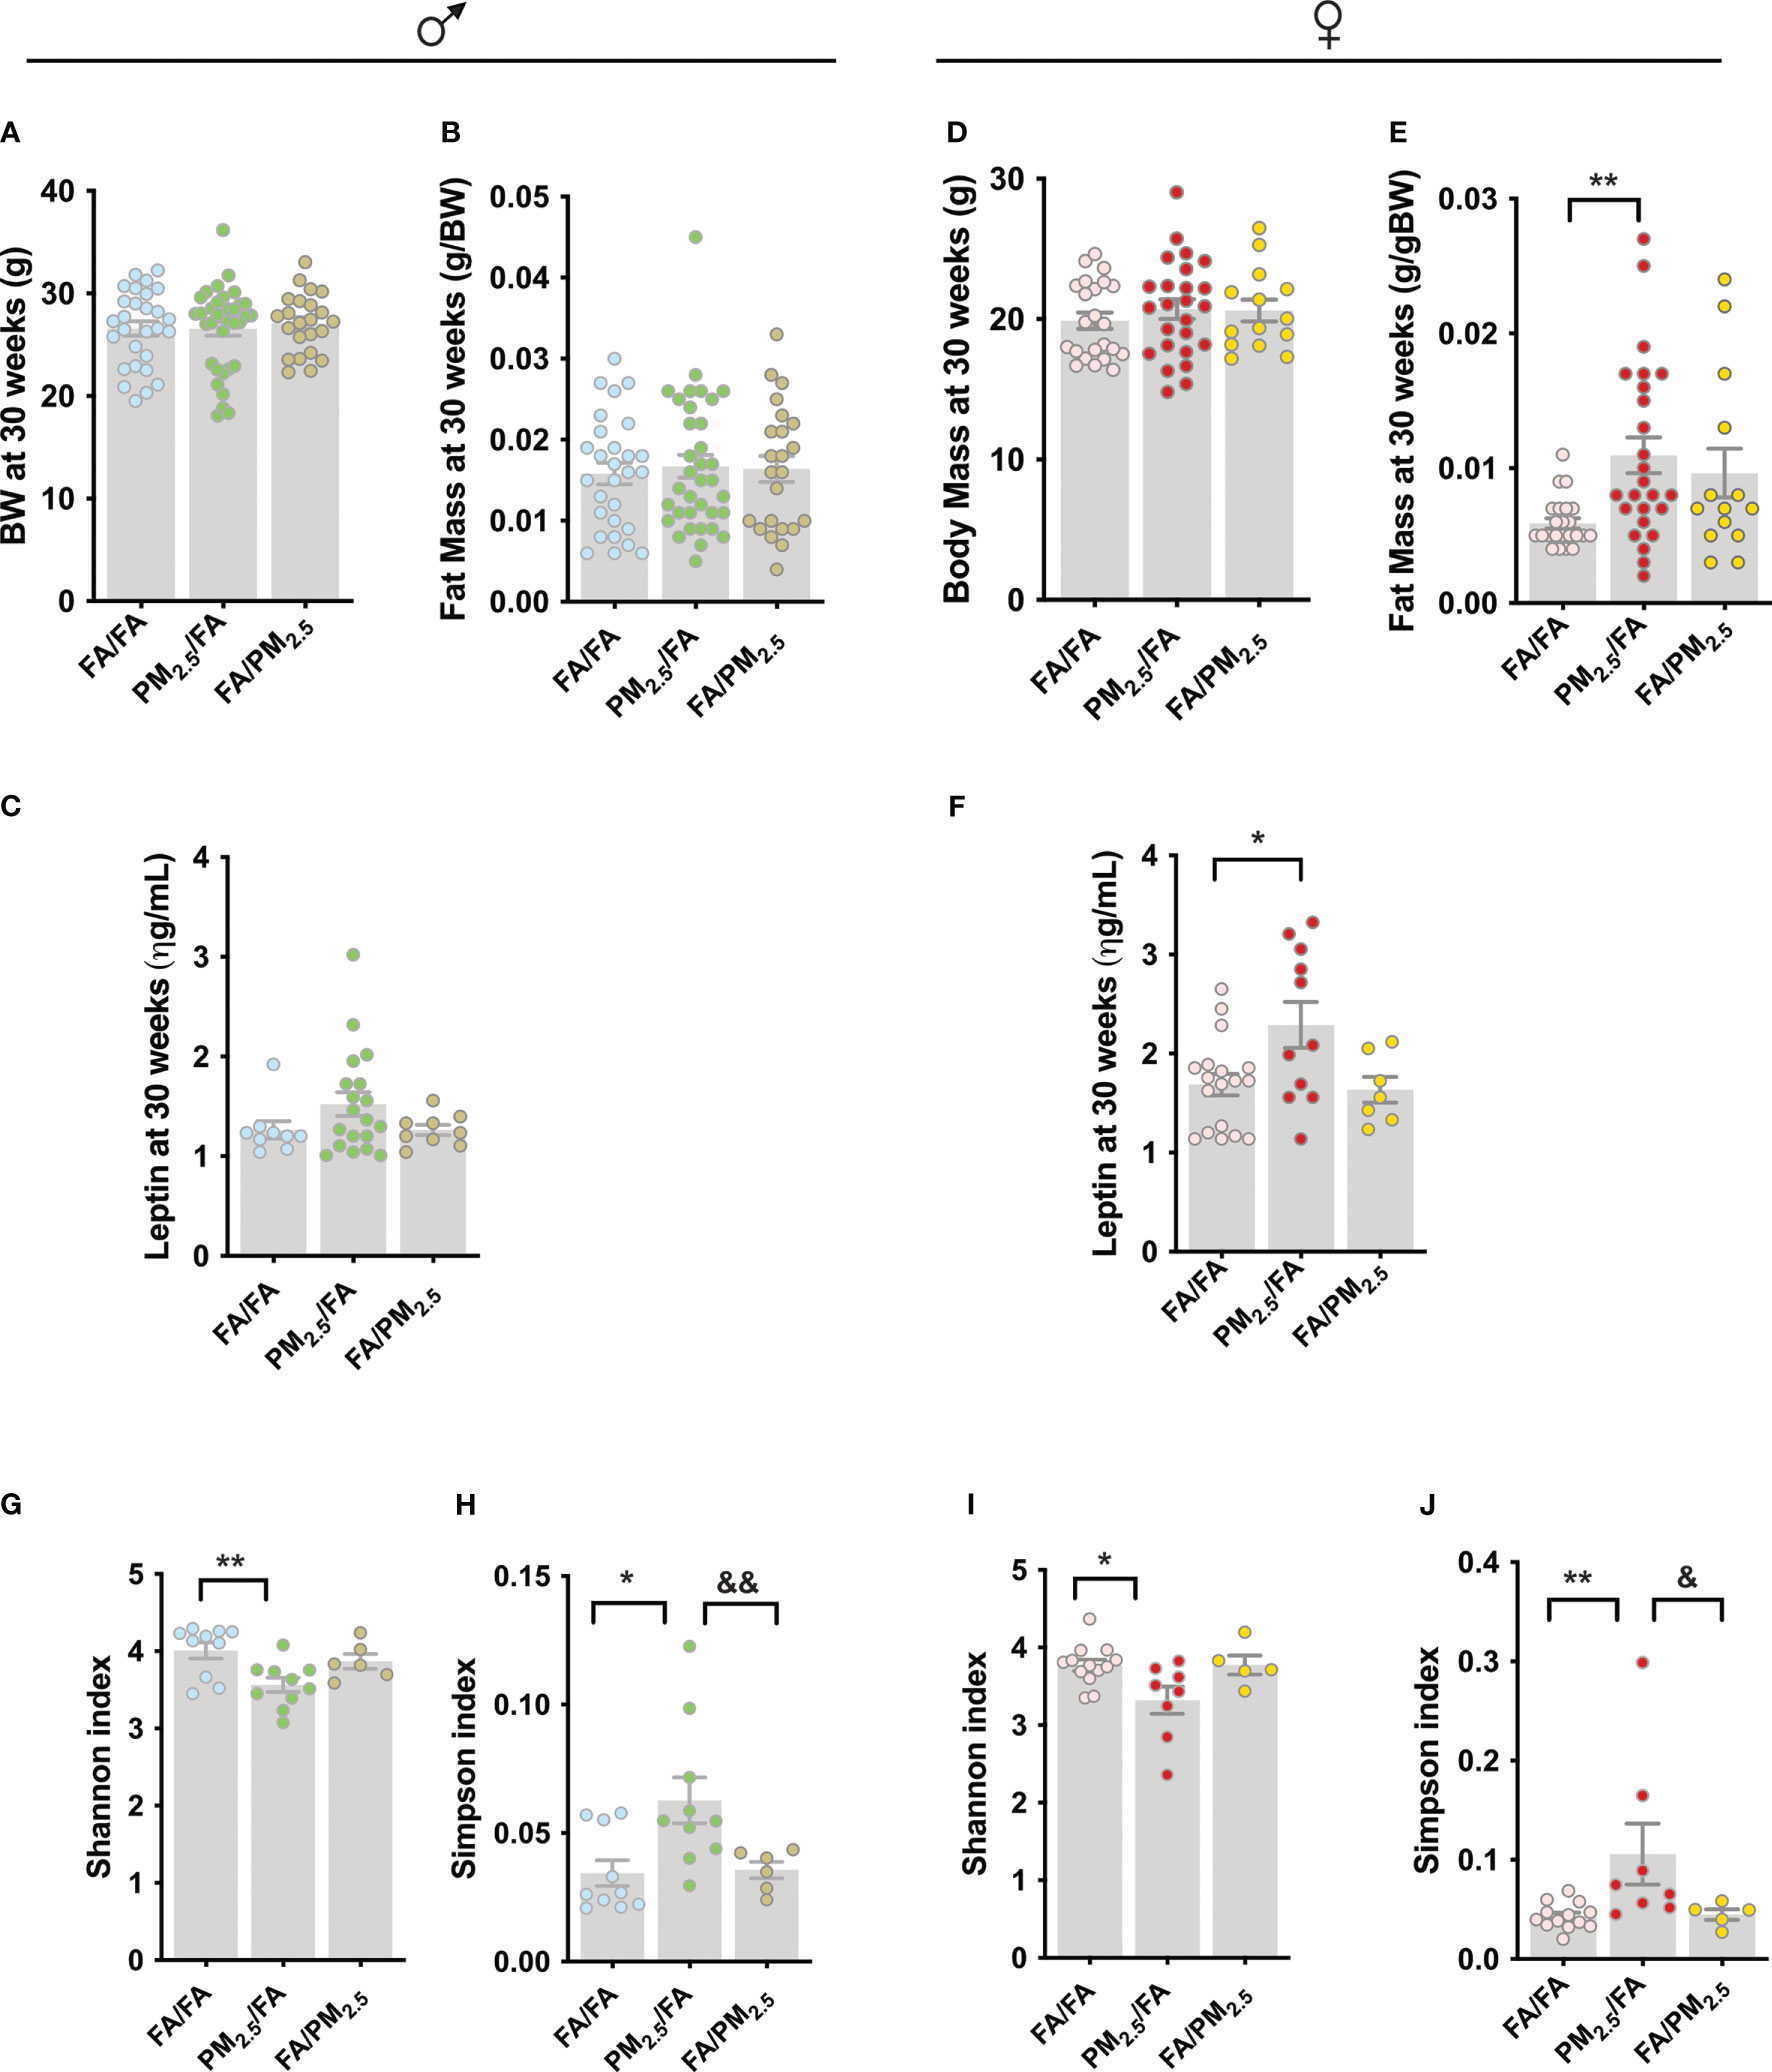
Figure 3 Maternal PM2.5 exposure alters alpha diversity and gut microbiota composition independent of gender. (A) Male body weight (g); (B) Male fat mass (g/gBW), n=23-35 and (C) Male fasting serum leptin level (ηg/mL), n=9-19. (D) Female body weight (g); (E) Female fat mass (g/gBW), n=14-26 and (F) Female fasting serum leptin level (ηg/mL), n=14-25. Alpha diversity was estimated by the (G) (male): Shannon index and (H) (male): Simpson index (n=6-10). Alpha diversity was estimated by the (I) (female): Shannon index and (J) (female): Simpson index i (n=5-13). (A-C) males and (D-F) females from offspring whose mothers were exposed to PM2.5 during pregnancy (PM2.5/FA) or lactation (FA/PM2.5) and filtered air during pregnancy and lactation (FA/FA) as a control group. All mice were 30 weeks of age. Data were expressed as the mean ± SEM. One-way ANOVA was used for the statistical analysis. We used Bonferroni as a post hoc test and a significance of P<0.05. p values: **P<0.01; *P<0.05 (PM2.5/FA vs. FA/FA); &&P<0.01; &P<0.05 (PM2.5/FA vs. FA/PM2.5).
We collected fecal samples from these mice and evaluated the gut microbiota diversity. More specifically, we investigate whether maternal exposure to PM2.5 alters the alpha and beta gut microbiota diversity. The analysis below showed the Shannon index, where a reduction indicates a decrease in alpha diversity, and the Simpsons index, where an increase implies a decrease in alpha diversity. Regarding the gut microbiota, the results demonstrated that male offspring from PM2.5/FA had a lower alpha diversity than FA/FA, indicated by the Shannon index (P<0.01) and by the Simpsons index (P<0.05). However, the lactation group (FA/PM2.5) had protection from this phenotype because the Simpsons index was lower (P<0.01) in this group compared to PM2.5/FA (Figure 3G, H).
Concerning females, the results are identical, with a reduction in alpha diversity in animals from the PM2.5/FA group than FA/FA using the Shannon index (P<0.05) and by Simpsons index (P<0.01). The FA/PM2.5 group had a lower Simpsons index (P<0.05) than PM2.5/FA, suggesting possible lactation protection for the lower alpha diversity induced by maternal pollution exposure (Figures 3I, J).
Regarding beta diversity, in males, significant differences were between FA/FA and PM2.5/FA and PM2.5/FA versus FA/PM2.5, but not between FA/FA and FA/PM2.5 (Figures 4A-C). We observed a different beta diversity for females: control (FA/FA) against each of them and between the mothers exposed during gestation or lactation (Figures 4D-F).
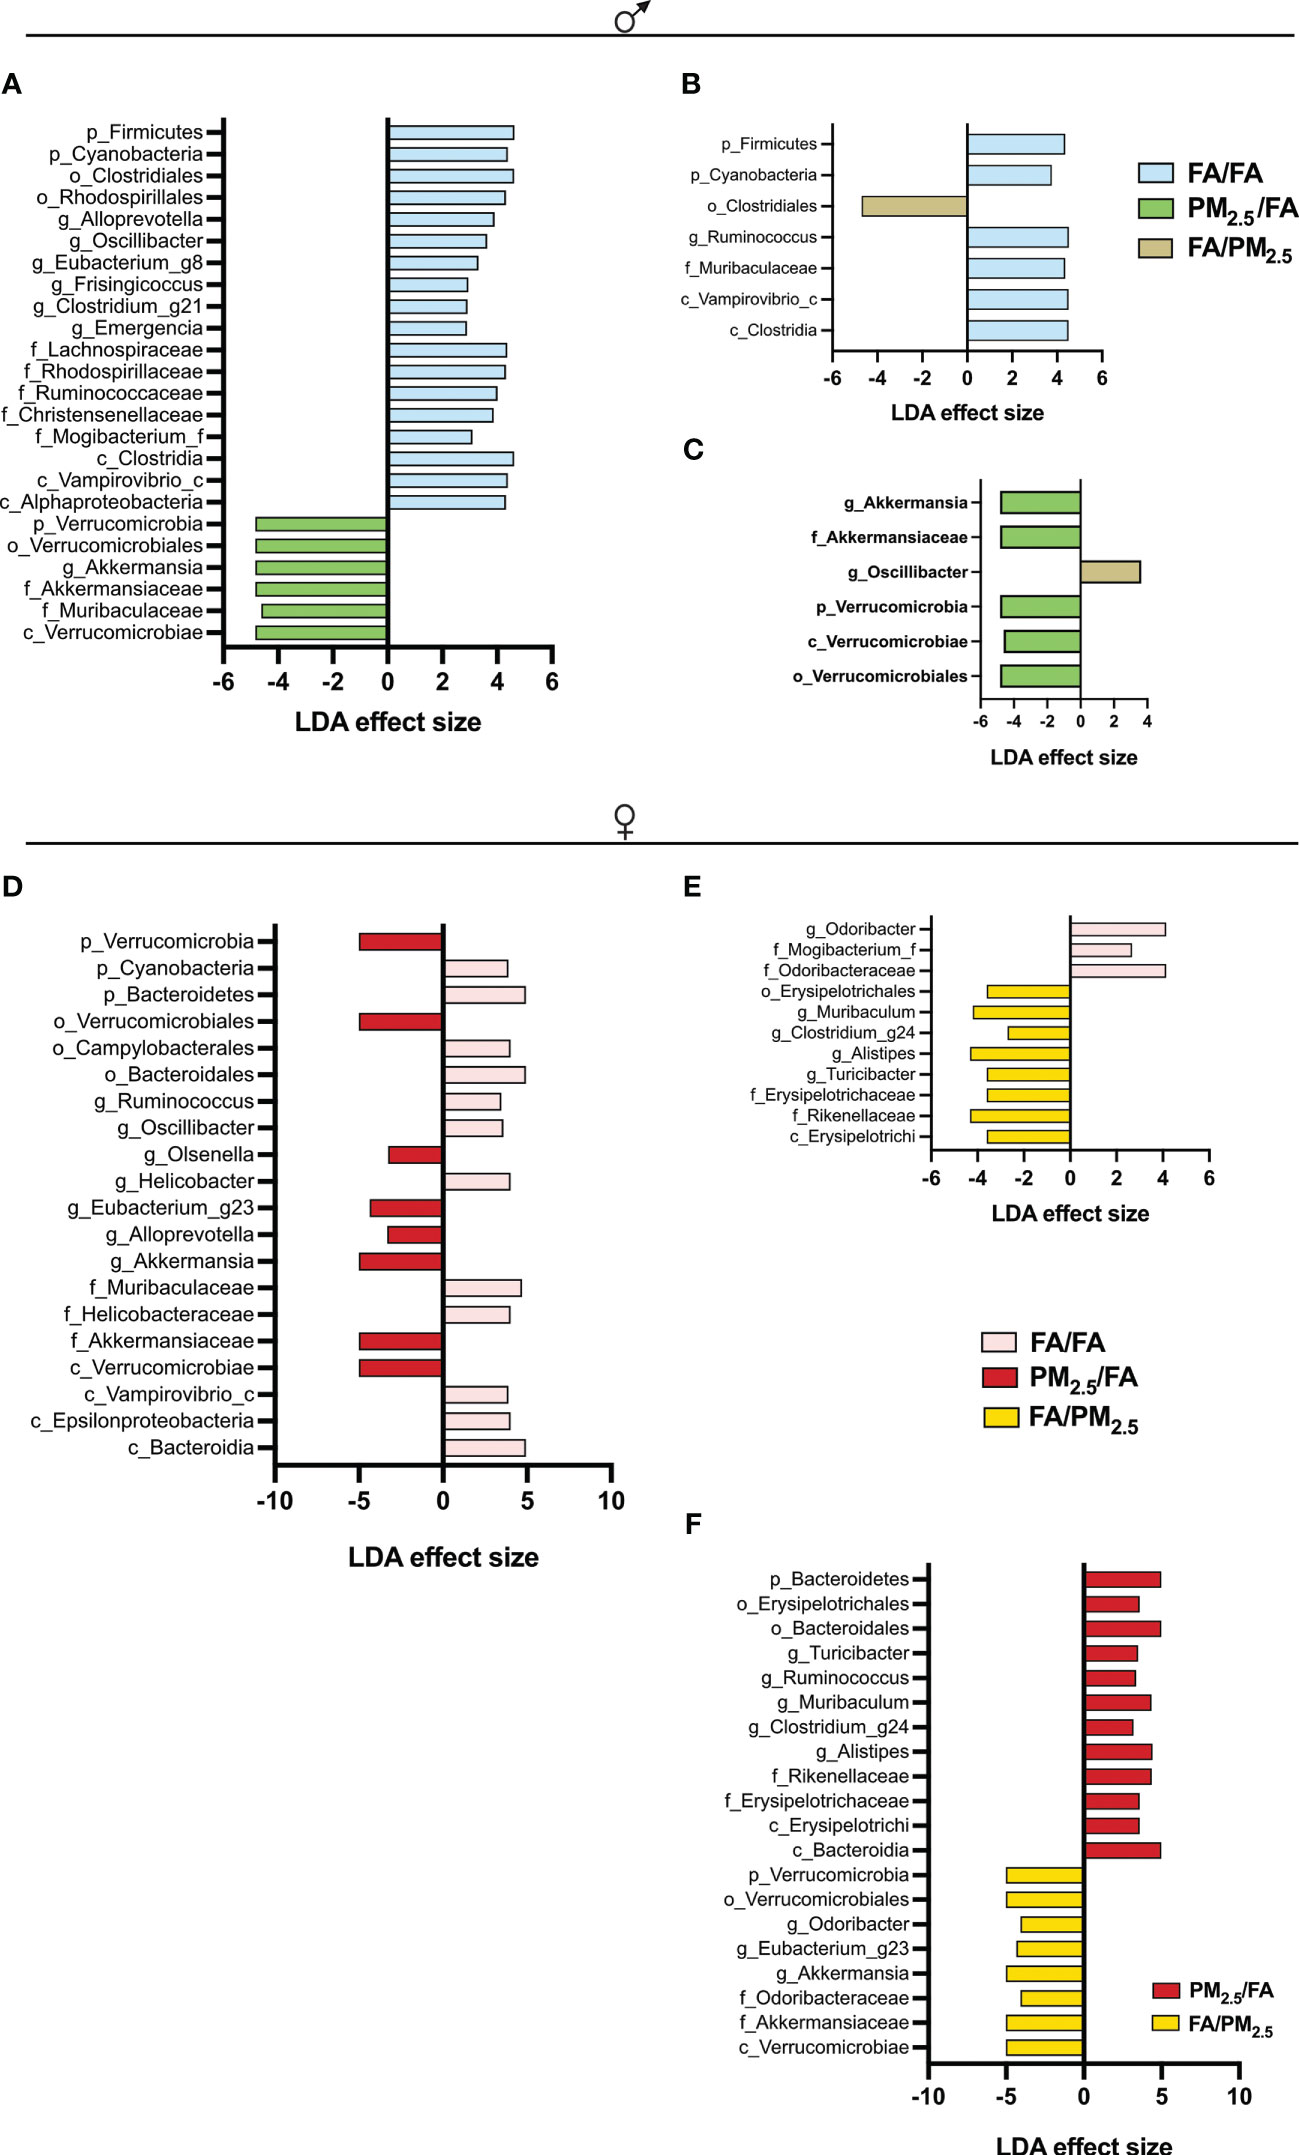
Figure 4 Maternal PM2.5 exposure alters the Linear discriminant analysis (LDA) effect size indicating differences in phyla and genera between (A) FA/FA and PM2.5/FA; (B) FA/FA and FA/PM2.5; (C) PM2.5/FA and FA/PM2.5 groups of males. LDA between (D) FA/FA and PM2.5/FA; (E) FA/FA and FA/PM2.5; (F) PM2.5/FA and FA/PM2.5 groups of females. Offspring mothers were exposed to PM2.5 during pregnancy (PM2.5/FA) or lactation (FA/PM2.5) and filtered air during pregnancy and lactation (FA/FA) as a control group. All mice were 30 weeks of age. The taxa with LDA score > 2 and significance of <0.05 were determined by the Wilcoxon signed-rank test.
The Bray-Curtis dissimilarity was used to compare the bacterial composition of microbiota among groups of male offspring. The FA/FA group displayed a spatial separation from PM2.5/FA but not from FA/PM2.5 (PERMANOVA: p = 0.007 and p = 0.46, respectively) (Figures 5A, B). PM2.5/FA group showed a spatial separation from FA/PM2.5 (PERMANOVA: p = 0.004) (Figure 5C).

Figure 5 Principal coordinate analysis (PCoA) plot with Bray-Curtis dissimilarity. Ordination (PCoA) generated by using the Bray–Curtis dissimilarity metric sampled. Samples are colored according to the group. Male offspring (A, B) Bray-Curtis PCoA ordination. Results revealed that the FA/FA group displayed a spatial separation from PM2.5/FA but not from FA/PM2.5 (PERMANOVA: p = 0.007 and p = 0.46, respectively) (C) PM2.5/FA group showed a spatial separation from FA/PM2.5 (PERMANOVA: p = 0.004). Female offspring (D, E) Bray-Curtis PCoA ordination. Results revealed that the FA/FA group displayed a spatial separation from PM2.5/FA and FA/PM2.5 (PERMANOVA: p = 0.001 and p = 0.030, respectively). (F) PM2.5/FA group showed a spatial separation from FA/PM2.5 (PERMANOVA: p = 0.002).
The Bray-Curtis dissimilarity was used to compare the bacterial composition of microbiota among groups of female offspring. FA/FA group displayed a spatial separation from PM2.5/FA and FA/PM2.5 (PERMANOVA: p = 0.001 and p = 0.030, respectively) (Figures 5D, E). PM2.5/FA group showed a spatial separation from FA/PM2.5 (PERMANOVA: p = 0.002) (Figure 5F).
4 Discussion
We demonstrated that maternal exposure to air pollution affects the offspring’s energy metabolism. To our surprise, these findings were time-dependent throughout the offspring’s life and gender-specific.
Birth weight is a parameter for estimating intrauterine growth (65, 66). Our study found that PM2.5 exposure during gestation was associated with a tendency to increase the offspring’s birth weight independently of the gender, which is compatible with increased fetus growth. Males in the PM2.5/FA group displayed increased body weight from weaning until young adulthood. However, this difference diminished at 30 weeks of age. Nonetheless, the females in the PM2.5/FA group did not display higher body weight at weaning. However, the females were heavy at a young age (8 weeks) and kept higher adiposity until later in life (30 weeks). This finding suggests that the effect of PM2.5 during gestation was long-lasting only in females. Several studies demonstrated that PM2.5 exposure during gestation affects body weight. However, some studies showed the opposite of us, a reduction in birth body weight (49, 50). Even though these mice evolved with increased body weight in adulthood (49, 50), another study showed an unchanged offspring birth weight and a decrease in adulthood (48).
The difference between our results might be due to different time points of maternal exposure to PM2.5. Differently from us, other studies (48–50) exposed the females during gestation and seven weeks before. The three studies mentioned above suggested maternal preconception exposure might be more harmful than during gestation (48–50). Thus, the mild phenotype we observed in our study might be partially due to limited time points of exposure. The inconsistency among studies may also rely on the route of administration of PM2.5 and the source of PM2.5. Some studies employed intratracheal liquid instillation (48). Other studies (49, 50) and ours used concentrated PM2.5 in specialized chambers. The sources of pollutants might also contribute to different results since the composition of PM2.5 depends on the emission sources.
Even though other studies found lower birth weight after maternal PM2.5 exposure, the outcome was increased body weight at a younger age, at least for male offspring. This result agrees with our data that showed higher body weight in male offspring whose mothers were exposed to PM2.5 either during gestation or lactation. Together these data suggest that changes in birth weight, whether low or high, induce weight gain in young male adulthood. In female offspring, body weight at weaning was similar among the three groups. However, they displayed an increase in body weight at a younger age. Adipose tissue delivers leptin balancing with triglyceride stores (67, 68). Thus, circulating leptin is known to define body energy stores (67–69). We found increased leptin levels in the same groups with elevated body weight in younger offspring. Later in life, only females displayed high leptin levels and gonadal fat mass. Concurrently the increased leptin levels suggested increased fat mass.
Our data showed an elevation of food intake followed by increased levels of the orexigenic Agrp and Npy in males from the PM2.5/FA group compared to FA/FA and FA/PM2.5. The elevated Agrp and Npy expression in the hypothalamus might count for the increased food intake we observed in this group. In the arcuate nucleus, the central melanocortin system comprises Pomc, Agrp, and melanocortin receptors (MC4Rs). Human mutations in the MC4R trigger obesity (70), and AgRP neurons are the natural antagonist of these receptors favoring increased food intake (8). Changes in maternal nutrition alter the innervation of Pomc and Agrp in arcuate to PVN. The critical window to compromise these projections is during lactation, not gestation. This occurred since rodent projections are developed three weeks after the offspring is born. In humans, the development of those projections occurs in utero (8, 15–18, 71). Lippert et al. (2020) demonstrated that maternal exposure to HFD during lactation revealed sexually dimorphic expression of dopamine phenotypes, males showing hyperlocomotion, and females displaying a high preference for sucrose (15). Another study exhibited that maternal HFD exposure seven days before and during gestation and lactation predisposes the offspring to develop insulin resistance and obesity by activating white adipose tissue inflammatory pathways (72).
In contrast, maternal undernutrition also increases the risk of the offspring developing metabolic diseases such as obesity (73). In male offspring from the FA/PM2.5 group, despite displaying elevated body weight at weaning, the body weight was similar to the FA/FA group at eight weeks of age. The leptin levels followed decreased body weight, suggesting a decreased fat mass (67, 68) in this group.
Air pollution exposure, as well as changes in nutritional diet, have an impact on energy balance. In our study, female and male offspring from FA/PM2.5 group displayed higher RER. This result indicates changes in substrate utilization, burning more fat than carbohydrates. The level of O2 consumption and Ucp1 expression in BAT was not uniform in our data. Another study that exposed the mothers to PM2.5 observed decreased Ucp1 expression in BAT in the group PM2.5-exposed during lactation (48). This result was accompanied by increased adiposity (48). In males, O2 consumption was higher in offspring from FA/PM2.5 group than FA/FA, but Ucp1 expression showed a tendency to increase but was not significant. Interestingly, this offspring (from the FA/PM2.5 group) displayed lower body weight and leptin levels than PM2.5/FA group, suggesting that higher O2 consumption might contribute to decreasing body mass in this group. Together with a mild increase in food intake looks like maternal exposure only during lactation had a lower effect on the EE of male offspring. Females from the PM2.5/FA group also displayed higher O2 consumption and Ucp1 in the BAT than FA/FA. However, despite higher EE, PM2.5/FA females presented higher body weight and leptin levels. Thus, in this group, the increased food intake and the RER might contribute to keeping the higher body weight than the EE.
We also observed that maternal exposure to PM2.5 during pregnancy reduces the gut microbiota diversity and changes the composition independently of the offspring’s gender. However, to our surprise, the body weight, fat mass, and leptin levels in males lost the difference among the three groups. On the contrary, we observed an increased fat mass and leptin levels without changes in body weight in the female PM2.5/FA group than in FA/FA.
Evidence demonstrated that exposure to air pollution affects gastrointestinal health (74, 75); however, the results are conflicting. Kim et al. (2014) showed that exposure to air pollution reduces gut microbiota biodiversity (74). In contrast, Mutlu et al. (2019) suggested that PM2.5 exposure increases gut microbiota alpha diversity (39, 75). Also, several studies (76–78) highlighted the influence of air pollution on obesity and T2DM through gut microbiota. Our study observed that maternal PM2.5 exposure displayed altered offspring gut microbiota composition, characterized by changes in bacterial diversity and different amounts of some taxon. Similar to other studies (78–80), our results showed that the male and female offspring PM2.5/FA group displayed decreased alpha diversity (Shannon or Simpson index) compared to the FA/FA and the FA/PM2.5 groups.
In contrast, Liu et al. (2020) described an increase in alpha diversity associated with maternal PM2.5 exposure during the gestational period (77). In the same study, despite an increase in alpha diversity, beta diversity analysis revealed an apparent dissociation between the control and PM2.5 exposed group (77). Our study also observed an evident dissociation among the three groups. We observed differences in the abundance of some taxon among the groups. Female PM2.5/FA offspring showed lower proportions of Bacteroidetes phylum and higher proportions of Verrucomicrobia compared to female FA/FA or FA/PM2.5. Like females, male PM2.5/FA offspring showed higher ratios of Verrucomicrobia phylum but lower proportions of Firmicutes phylum compared to male FA/FA or FA/PM2.5. In our study, more significant amounts of Akkermansia (Verrucomicrobia phylum) were observed in the male and female offspring from the PM2.5/FA group compared to FA/FA group. Akkermansia has been associated with improved glucose homeostasis and weight loss (41, 77, 81, 82). It is known that genetic and environmental factors can change microbiota composition, and if the individual is obese, the changes could be more dramatic. It is also essential to mention that the gut microbiota composition can variate within an individual (41, 83).
Serino et al. (2012) described that an increased Allistipes genus could be a protective factor to type 2 diabetes in an HFD scenario (84). A study by our group (83) demonstrated that probiotic administration in DIO animals could increase these genera. Unexpectedly, our study observed increased amounts of Allistipes in females FA/PM2.5 compared to FA/FA and PM2.5/FA compared to FA/PM2.5. This result could also explain the less harmful effect of maternal exposure to PM2.5.
Thingholm et al. (2019) observed a significant association between some individual microbial genera with obesity, pointing to the decrease in Akkermansia, Oscillibacter, and Allistipes (85). There were similarities in our results with this mentioned study. We also observed increased amounts of Oscillibacter in males FA/FA and FA/PM2.5 compared to PM2.5/FA. Still, our data differed slightly from Thingholm et al. (2019) when analyzing Akkermansia and Allistipes, as already discussed above (85).
However, some studies demonstrate that excessive mucin degradation can favor the access of pathogens to the mucosa (86, 87). Polluting particles can affect the protective characteristics of the mucus in the intestinal tract, changing the permeability and composition of the microbiota and impairing health (88). Although the offspring have not been subject to pollution, maternal exposure during gestation can result in placental epigenetic modification and fetus reprogramming (89).
The current study has some limitations regarding data collection time points. We measured food intake at 13-14 weeks and energy expenditure at 18-19 weeks. Nevertheless, the body weight at 13 weeks kept a similar pattern as 8 weeks in both genders, not representing a critical interpretation problem. In the current study, we evaluated gut microbiota composition only from mice at 30 weeks. Surprisingly, male but not female offspring lost the difference in their body weight and serum leptin levels. On the contrary, in another study (48), only male offspring but not female offspring from mothers exposed to CAP displayed increased adiposity in adulthood. However, in this other study, all mothers were exposed during pre-conception (48).
In summary, our data support the hypothesis that exposure to air pollution during gestation is more harmful to energy balance than exposure during lactation, independent of gender. Male offspring had an unfavorable metabolic phenotype at a young age. However, at an older age, only females kept more adiposity. Ultimately, our data highlights the importance of controlling air pollution, especially during gestation.
Data availability statement
The original contributions presented in the study are publicly available. This data can be found here: https://www.ncbi.nlm.nih.gov/bioproject/PRJNA894691. In addition, we included some raw data in the Supplementary Material. Further inquiries can be directed to the corresponding author.
Author contributions
PP, MV, AS conceived the study, designed experiments, and interpreted the results. OZ, CC, VY, AS, GC, CF, SN, and PP performed all experiments. PP wrote the manuscript. OZ, CC, Y-BK, AS, MV, PS, and MS helped with discussions and edited the manuscript. All authors contributed to the article and approved the submitted version.
Funding
This work was supported by FAPESP (Fundação de Amparo à Pesquisa do Estado de São Paulo): 2017/18498-6 (PP), 2017/11518-1 (CC), São Paulo, Brasil. CNPq - INCT (Instituto Nacional de Ciência e Tecnologia de Obesidade e Diabetes) 573856/2008-7 and FAPESP 465693/2014-8 (PP; MS).
Acknowledgments
We thank Heloísa Assalin, Guilherme Zweig, and Raquel Patrícia Ataíde Lima FAPESP (2017/19703-2) for technical assistance and Bruna Oliveira Matos for assisting with blood glucose measurements. We thank Dioze Guadagnini for the hormone measurements.
Conflict of interest
The authors declare that the research was conducted in the absence of any commercial or financial relationships that could be construed as a potential conflict of interest.
Publisher’s note
All claims expressed in this article are solely those of the authors and do not necessarily represent those of their affiliated organizations, or those of the publisher, the editors and the reviewers. Any product that may be evaluated in this article, or claim that may be made by its manufacturer, is not guaranteed or endorsed by the publisher.
Supplementary material
The Supplementary Material for this article can be found online at: https://www.frontiersin.org/articles/10.3389/fendo.2023.1069243/full#supplementary-material
References
1. González-Muniesa P, Mártinez-González MA, Hu FB, Després JP, Matsuzawa Y, Loos RJF, et al. Obesity. Nat Rev Dis Primers (2017) 3(1):17034. doi: 10.1038/nrdp.2017.34
2. Jiwani SS, Carrillo-Larco RM, Hernández-Vásquez A, Barrientos-Gutiérrez T, Basto-Abreu A, Gutierrez L, et al. The shift of obesity burden by socioeconomic status between 1998 and 2017 in Latin America and the Caribbean: A cross-sectional series study. Lancet Glob Health (2019) 7(12):e1644–54. doi: 10.1016/S2214-109X(19)30421-8
3. NCD Risk Factor Collaboration (NCD-RisC)—Americas Working Group. Trends in cardiometabolic risk factors in the americas between 1980 and 2014: A pooled analysis of population-based surveys. Lancet Glob Health (2020) 8(1):e123–33. doi: 10.1016/S2214-109X(19)30484-X. Erratum in: Lancet Glob Health. 2020 8(5):e648. Erratum in: Lancet Glob Health. 2021 9(1):e23.
4. Demmler KM, Klasen S, Nzuma JM, Qaim M. Supermarket purchase contributes to nutrition-related non-communicable diseases in urban Kenya. PloS One (2017) 12(9):e0185148–e0185148. doi: 10.1371/journal.pone.0185148
5. Hales CM, Fryar CD, Carroll MD, Freedman DS, Aoki Y, Ogden CL. Differences in obesity prevalence by demographic characteristics and urbanization level among adults in the united states, 2013-2016. JAMA (2018) 319(23):2419–29. doi: 10.1001/jama.2018.7270
6. Shi X, Zheng Y, Cui H, Zhang Y, Jiang M. Exposure to outdoor and indoor air pollution and risk of overweight and obesity across different life periods: A review. Ecotoxicol Environ Saf (2022) 242:113893. doi: 10.1016/j.ecoenv.2022.113893
7. Guo J, Huang J, Wang Q, Fang L, Zhang S, Li B, et al. Maternal exposure to phenanthrene during gestation disturbs glucose homeostasis in adult mouse offspring. Chemosphere (2021) 270:128635. doi: 10.1016/j.chemosphere.2020.128635
8. Bouret SG. Developmental programming of hypothalamic melanocortin circuits. Exp Mol Med (2022) 54(4):403–13. doi: 10.1038/s12276-021-00625-8
9. Jais A, Brüning JC, Jais A, Brüning JC. Hypothalamic inflammation in obesity and metabolic disease find the latest version: Hypothalamic inflammation in obesity and metabolic disease. J Clin Invest (2017) 127(1):24–32. doi: 10.1172/JCI88878
10. Timper K, Brüning JC. Hypothalamic circuits regulating appetite and energy homeostasis: Pathways to obesity. Dis Model Mech (2017) 10(6):679–89. doi: 10.1242/dmm.026609
11. Könner AC, Brüning JC. Selective insulin and leptin resistance in metabolic disorders. Cell Metab (2012) 16(2):144–52. doi: 10.1016/j.cmet.2012.07.004
12. Jais A, Brüning JC. Arcuate nucleus-dependent regulation of metabolism-pathways to obesity and diabetes mellitus. Endocr Rev (2022) 43(2):314–28. doi: 10.1210/endrev/bnab025
13. Landrigan PJ, Fuller R, Horton R. Environmental pollution, health, and development: A lancet-global alliance on health and pollution-icahn school of medicine at mount Sinai commission. Lancet (2015) 386(10002):1429–31. doi: 10.1016/S0140-6736(15)00426-2
14. Landrigan PJ, Fuller R, Acosta NJR, Adeyi O, Arnold R, Basu NN, et al. The lancet commission on pollution and health. Lancet (2018) 391(10119):462–512. doi: 10.1016/S0140-6736(17)32345-0
15. Lippert RN, Hess S, Klemm P, Burgeno LM, Jahans-Price T, Walton ME, et al. Maternal high-fat diet during lactation reprograms the dopaminergic circuitry in mice. J Clin Invest (2020) 130(7):3761–76. doi: 10.1172/JCI134412
16. Bouret SG, Draper SJ, Simerly RB. Formation of projection pathways from the arcuate nucleus of the hypothalamus to hypothalamic regions implicated in the neural control of feeding behavior in mice. J Neurosci (2004) 24(11):2797–805. doi: 10.1523/JNEUROSCI.5369-03.2004
17. Vogt MC, Brüning JC. CNS insulin signaling in the control of energy homeostasis and glucose metabolism - from embryo to old age. Trends Endocrinol Metab (2013) 24(2):76–84. doi: 10.1016/j.tem.2012.11.004
18. Lippert RN, Brüning JC. Maternal metabolic programming of the developing central nervous system: Unified pathways to metabolic and psychiatric disorders. Biol Psychiatry (2022) 91(10):898–906. doi: 10.1016/j.biopsych.2021.06.002
19. Vogt MC, Paeger L, Hess S, Steculorum SM, Awazawa M, Hampel B, et al. Neonatal insulin action impairs hypothalamic neurocircuit formation in response to maternal high-fat feeding. Cell (2014) 156(3):495–509. doi: 10.1016/j.cell.2014.01.008
20. Peixoto TC, Moura EG, Soares PN, Rodrigues VST, Claudio-Neto S, Oliveira E, et al. Nicotine exposure during lactation causes disruption of hedonic eating behavior and alters dopaminergic system in adult female rats. Appetite (2021) 160:105115. doi: 10.1016/j.appet.2021.105115
21. Liu C, Ying Z, Harkema J, Sun Q, Rajagopalan S. Epidemiological and experimental links between air pollution and type 2 diabetes. Toxicol Pathol (2013) 41(2):361–73. doi: 10.1177/0192623312464531
22. Weinmayr G, Hennig F, Fuks K, Nonnemacher M, Jakobs H, Möhlenkamp S, et al. Long-term exposure to fine particulate matter and incidence of type 2 diabetes mellitus in a cohort study: Effects of total and traffic-specific air pollution. Environ Health (2015) 14:53. doi: 10.1186/s12940-015-0031-x
23. Brook RD, Jerrett M, Brook JR, Bard RL, Finkelstein MM. The relationship between diabetes mellitus and traffic-related air pollution. J Occup Environ Med (2008) 50(1):32–8. doi: 10.1097/JOM.0b013e31815dba70
24. Franklin BA, Brook R, Arden Pope C. Air pollution and cardiovascular disease. Curr Probl Cardiol (2015) 40(5):207–38. doi: 10.1016/j.cpcardiol.2015.01.003
25. Yoda Y, Tamura K, Shima M. Airborne endotoxin concentrations in indoor and outdoor particulate matter and their predictors in an urban city. Indoor Air (2017) 27(5):955–64. doi: 10.1111/ina.12370
26. Rajagopalan S, Brook RD. Air pollution and type 2 diabetes: Mechanistic insights. Diabetes (2012) 61(12):3037–45. doi: 10.2337/db12-0190
27. Block ML, Calderón-Garcidueñas L. Air pollution: mechanisms of neuroinflammation and CNS disease. Trends Neurosci (2009) 32(9):506–16. doi: 10.1016/j.tins.2009.05.009
28. Krewski D, Rainham D. Ambient air pollution and population health: Overview. J Toxicol Environ Health A (2007) 70(3–4):275–83. doi: 10.1080/15287390600884859
29. Conde J, Scotece M, Abella V, López V, Pino J, Gómez-Reino JJ, et al. An update on leptin as immunomodulator. Expert Rev Clin Immunol (2014) 10(9):1165–70. doi: 10.1586/1744666X.2014.942289
30. Mitchell S, Vargas J, Hoffmann A. Signaling via the NFκB system. Wiley Interdiscip Rev Syst Biol Med (2016) 8(3):227–41. doi: 10.1002/wsbm.1331
31. Benomar Y, Taouis M. Molecular mechanisms underlying obesity-induced hypothalamic inflammation and insulin resistance: Pivotal role of resistin/tlr4 pathways. Front Endocrinol (2019) 10. doi: 10.3389/fendo.2019.00140
32. Reilly SM, Chiang SH, Decker SJ, Chang L, Uhm M, Larsen MJ, et al. An inhibitor of the protein kinases TBK1 and IKK-ϵ improves obesity-related metabolic dysfunctions in mice. Nat Med (2013) 19(3):313–21. doi: 10.1038/nm.3082
33. Arkan MC, Hevener AL, Greten FR, Maeda S, Li ZW, Long JM, et al. IKK-β links inflammation to obesity-induced insulin resistance. Nat Med (2005) 11(2):191–8. doi: 10.1038/nm1185
34. Baker RG, Hayden MS, Ghosh S. NF-κB, inflammation, and metabolic disease. Cell Metab (2011) 13(1):11–22. doi: 10.1016/j.cmet.2010.12.008
35. Chiang SH, Bazuine M, Lumeng CN, Geletka LM, Mowers J, White NM, et al. The protein kinase IKKϵ regulates energy balance in obese mice. Cell (2009) 138(5):961–75. doi: 10.1016/j.cell.2009.06.046
36. Campolim CM, Weissmann L, Ferreira CKO, Zordão OP, Dornellas APS, de Castro G, et al. Short-term exposure to air pollution (PM2.5) induces hypothalamic inflammation, and long-term leads to leptin resistance and obesity via Tlr4/Ikbke in mice. Sci Rep (2020) 10(1):10160. doi: 10.1038/s41598-020-67040-3
37. Haghani A, Cacciottolo M, Doty KR, D’agostino C, Thorwald M, Safi N, et al. Mouse brain transcriptome responses to inhaled nanoparticulate matter differed by sex and APOE in Nrf2-nfkb interactions. Elife (2020) 9:1–20. doi: 10.7554/eLife.54822
38. Wu YF, Li ZY, Dong LL, Li WJ, Wu YP, Wang J, et al. Inactivation of MTOR promotes autophagy-mediated epithelial injury in particulate matter-induced airway inflammation. Autophagy (2020) 16(3):435–50. doi: 10.1080/15548627.2019.1628536
39. Mutlu EA, Comba IY, Cho T, Engen PA, Yazıcı C, Soberanes S, et al. Inhalational exposure to particulate matter air pollution alters the composition of the gut microbiome. Environ Pollut (2018) 240:817–30. doi: 10.1016/j.envpol.2018.04.130
40. Patterson E, Ryan PM, Cryan JF, Dinan TG, Ross RP, Fitzgerald GF, et al. Gut microbiota, obesity and diabetes. Postgrad Med J (2016) 92(1087):286–300. doi: 10.1136/postgradmedj-2015-133285
41. Saad MJA, Santos A, Prada PO. Linking gut microbiota and inflammation to obesity and insulin resistance. Physiol (Bethesda) (2016) 31(4):283–93. doi: 10.1152/physiol.00041.2015
42. Lee PC, Talbott EO, Roberts JM, Catov JM, Sharma RK. Ritz B. particulate air pollution exposure and c-reactive protein during early pregnancy. Epidemiology (2011) 22(4):524–31. doi: 10.1097/EDE.0b013e31821c6c58. Erratum in: Epidemiology.2011 22(5):752.
43. Fleisch AF, Rifas-Shiman SL, Koutrakis P, Schwartz JD, Kloog I, Melly S, et al. Prenatal exposure to traffic pollution: Associations with reduced fetal growth and rapid infant weight gain. Epidemiology (2015) 26(1):43–50. doi: 10.1097/EDE.0000000000000203
44. Guxens M, Garcia-Esteban R, Giorgis-Allemand L, Forns J, Badaloni C, Ballester F, et al. Air pollution during pregnancy and childhood cognitive and psychomotor development: Six European birth cohorts. Epidemiology (2014) 25(5):636–47. doi: 10.1097/EDE.0000000000000133
45. Fleisch AF, Kloog I, Luttmann-Gibson H, Gold DR, Oken E, Schwartz JD. Air pollution exposure and gestational diabetes mellitus among pregnant women in Massachusetts: A cohort study. Environ Health (2016) 15:40. doi: 10.1186/s12940-016-0121-4
46. Fleisch AF, Luttmann-Gibson H, Perng W, Rifas-Shiman SL, Coull BA, Kloog I, et al. Prenatal and early life exposure to traffic pollution and cardiometabolic health in childhood. Pediatr Obes (2017) 12(1):48–57. doi: 10.1111/ijpo.12106
47. Lakshmanan A, Chiu YHM, Coull BA, Just AC, Maxwell SL, Schwartz J, et al. Associations between prenatal traffic-related air pollution exposure and birth weight: Modification by sex and maternal pre-pregnancy body mass index. Environ Res (2015) 137:268–77. doi: 10.1016/j.envres.2014.10.035
48. Chen M, Liang S, Zhou H, Xu Y, Qin X, Hu Z, et al. Prenatal and postnatal mothering by diesel exhaust PM2.5-exposed dams differentially program mouse energy metabolism. Part Fibre Toxicol (2017) 14(1):3. doi: 10.1186/s12989-017-0183-7
49. Chen M, Wang X, Hu Z, Zhou H, Xu Y, Qiu L, et al. Programming of mouse obesity by maternal exposure to concentrated ambient fine particles. Part Fibre Toxicol (2017) 14(1):20. doi: 10.1186/s12989-017-0201-9
50. Xu Y, Wang W, Chen M, Zhou J, Huang X, Tao S, et al. Developmental programming of obesity by maternal exposure to concentrated ambient PM2.5 is maternally transmitted into the third generation in a mouse model. Part Fibre Toxicol (2019) 16(1):27. doi: 10.1186/s12989-019-0312-6
51. Liu Y, Wang L, Wang F, Li C. Effect of fine particulate matter (PM2.5) on rat placenta pathology and perinatal outcomes. Med Sci Monit (2016) 22:3274–80. doi: 10.12659/MSM.897808
52. Veras MM, Damaceno-Rodrigues NR, Caldini EG, Maciel Ribeiro AAC, Mayhew TM, Saldiva PHN, et al. Particulate urban air pollution affects the functional morphology of mouse placenta. Biol Reprod (2008) 79(3):578–84. doi: 10.1095/biolreprod.108.069591
53. Andrade MD, de Miranda RM, Fornaro A, Kerr A, Oyama B, de Andre PA, et al. Vehicle emissions and PM(2.5) mass concentrations in six Brazilian cities. Air Qual Atmos Health (2012) 5(1):79–88. doi: 10.1007/s11869-010-0104-5
54. Yoshizaki K, Fuziwara CS, Brito JM, Santos TMN, Kimura ET, Correia AT, et al. The effects of urban particulate matter on the nasal epithelium by gender: An experimental study in mice. Environ pollut (2016) 213:359–69. doi: 10.1016/j.envpol.2016.02.044
55. de Barros Mendes Lopes T, Groth EE, Veras M, Furuya TK, de Souza Xavier Costa N, Ribeiro Júnior G, et al. Pre- and postnatal exposure of mice to concentrated urban PM2.5 decreases the number of alveoli and leads to altered lung function at an early stage of life. Environ pollut (2018) 241:511–20. doi: 10.1016/j.envpol.2018.05.055
56. Mauad T, Rivero DHRF, de Oliveira RC, Lichtenfels AJ de FC, Guimarães ET, de Andre PA, et al. Chronic exposure to ambient levels of urban particles affects mouse lung development. Am J Respir Crit Care Med (2008) 178(7):721–8. doi: 10.1164/rccm.200803-436OC
57. Zanotto TM, Quaresma PGF, Guadagnini D, Weissmann L, Santos AC, Vecina JF, et al. Blocking iNOS and endoplasmic reticulum stress synergistically improves insulin resistance in mice. Mol Metab (2017) 6(2):206–18. doi: 10.1016/j.molmet.2016.12.005
58. Quaresma PG, Reencober N, Zanotto TM, Santos AC, Weissmann L, de Matos AHB, et al. Pioglitazone treatment increases food intake and decreases energy expenditure partially via hypothalamic adiponectin/adipoR1/AMPK pathway. Int J Obes (2016) 40(1):138–46. doi: 10.1038/ijo.2015.134
59. Caricilli AM, Penteado E, de Abreu LL, Quaresma PGF, Santos AC, Guadagnini D, et al. Topiramate treatment improves hypothalamic insulin and leptin signaling and action and reduces obesity in mice. Endocrinology (2012) 153(9):4401–11. doi: 10.1210/en.2012-1272
60. Quaresma PG, Weissmann L, Zanotto TM, Santos AC, de Matos AH, Furigo IC, et al. Cdc2-like kinase 2 in the hypothalamus is necessary to maintain energy homeostasis. Int J Obes (Lond) (2017) 41(2):268–78. doi: 10.1038/ijo.2016.174
61. Weissmann L, Quaresma PG, Santos AC, de Matos AH, Pascoal VD, Zanotto TM, et al. IKKϵ is key to induction of insulin resistance in the hypothalamus, and its inhibition reverses obesity. Diabetes (2014) 63(10):3334–45. doi: 10.2337/db13-1817
62. Prada PO, Zecchin HG, Gasparetti AL, Torsoni MA, Ueno M, Hirata AE, et al. Western Diet modulates insulin signaling, c-jun n-terminal kinase activity, and insulin receptor substrate-1ser307 phosphorylation in a tissue-specific fashion. Endocrinology (2005) 146(3):1576–87. doi: 10.1210/en.2004-0767
63. Yatsunenko T, Rey FE, Manary MJ, Trehan I, Dominguez-Bello MG, Contreras M, et al. Human gut microbiome viewed across age and geography. Nature (2012) 486(7402):222–7. doi: 10.1038/nature11053
64. Caporaso JG, Lauber CL, Walters WA, Berg-Lyons D, Huntley J, Fierer N, et al. Ultra-high-throughput microbial community analysis on the illumina HiSeq and MiSeq platforms. ISME J (2012) 6(8):1621–4. doi: 10.1038/ismej.2012.8
65. Mandy M, Nyirenda M. Developmental origins of health and disease: the relevance to developing nations. Int Health (2018) 10(2):66–70. doi: 10.1093/inthealth/ihy006
66. Barker DJP. The origins of the developmental origins theory. J Intern Med (2007) 261(5):412–7. doi: 10.1111/j.1365-2796.2007.01809.x
67. Frederich RC, Hamann A, Anderson S, Löllmann B, Lowell BB, Flier JS. Leptin levels reflect body lipid content in mice: Evidence for diet-induced resistance to leptin action. Nat Med (1995) 1(12):1311–4. doi: 10.1038/nm1295-1311
68. Pan WW, Myers MG. Leptin and the maintenance of elevated body weight. Nat Rev Neurosci (2018) 19(2):95–105. doi: 10.1038/nrn.2017.168
69. Flak JN, Myers MGJ. Minireview: CNS mechanisms of leptin action. Mol Endocrinol (2016) 30(1):3–12. doi: 10.1210/me.2015-1232
70. Coll AP, Farooqi IS, O’Rahilly S. The hormonal control of food intake. Cell (2007) 129(2):251–62. doi: 10.1016/j.cell.2007.04.001
71. Bouret SG, Gorski JN, Patterson CM, Chen S, Levin BE, Simerly RB. Hypothalamic neural projections are permanently disrupted in diet-induced obese rats. Cell Metab (2008) 7(2):179–85. doi: 10.1016/j.cmet.2007.12.001
72. Wada N, Yamada H, Motoyama S, Saburi M, Sugimoto T, Kubota H, et al. Maternal high-fat diet exaggerates diet-induced insulin resistance in adult offspring by enhancing inflammasome activation through noncanonical pathway of caspase-11. Mol Metab (2020) 37:100988. doi: 10.1016/j.molmet.2020.100988
73. Block T, El-Osta A. Epigenetic programming, early life nutrition and the risk of metabolic disease. Atherosclerosis (2017) 266:31–40. doi: 10.1016/j.atherosclerosis.2017.09.003
74. Kim BJ, Lee SY, Kim HB, Lee E, Hong SJ. Environmental changes, microbiota, and allergic diseases. Allergy Asthma Immunol Res (2014) 6(5):389–400. doi: 10.4168/aair.2014.6.5.389
75. Singh S, Sharma P, Pal N, Kumawat M, Shubham S, Sarma DK, et al. Impact of environmental pollutants on gut microbiome and mental health via the gut-brain axis. Microorganisms (2022) 10:1457. doi: 10.3390/microorganisms10071457
76. Alderete TL, Jones RB, Chen Z, Kim JS, Habre R, Lurmann F, et al. Exposure to traffic-related air pollution and the composition of the gut microbiota in overweight and obese adolescents. Environ Res (2018) 161:472–8. doi: 10.1016/j.envres.2017.11.046
77. Liu W, Zhou Y, Li Y, Qin Y, Yu L, Li R, et al. Effects of PM2.5 exposure during gestation on maternal gut microbiota and pregnancy outcomes. Chemosphere (2020) 247:125879. doi: 10.1016/j.chemosphere.2020.125879
78. Bailey MJ, Naik NN, Wild LE, Patterson WB, Alderete TL. Exposure to air pollutants and the gut microbiota: A potential link between exposure, obesity, and type 2 diabetes. Gut Microbes (2020) 11(5):1188–202. doi: 10.1080/19490976.2020.1749754
79. Wang W, Zhou J, Chen M, Huang X, Xie X, Li W, et al. Exposure to concentrated ambient PM2.5 alters the composition of gut microbiota in a murine model. Part Fibre Toxicol (2018) 15(1):17. doi: 10.1186/s12989-018-0252-6
80. Kish L, Hotte N, Kaplan GG, Vincent R, Tso R, Gänzle M, et al. Environmental particulate matter induces murine intestinal inflammatory responses and alters the gut microbiome. PloS One (2013) 8(4):e62220. doi: 10.1371/journal.pone.0062220
81. Cani PD, de Vos WM. Next-generation beneficial microbes: The case of akkermansia muciniphila. Front Microbiol (2017) 8:1765. doi: 10.3389/fmicb.2017.01765
82. Debédat J, Clément K, Aron-Wisnewsky J. Gut microbiota dysbiosis in human obesity: Impact of bariatric surgery. Curr Obes Rep (2019) 8(3):229–42. doi: 10.1007/s13679-019-00351-3
83. Bagarolli RA, Tobar N, Oliveira AG, Araújo TG, Carvalho BM, Rocha GZ, et al. Probiotics modulate gut microbiota and improve insulin sensitivity in DIO mice. J Nutr Biochem (2017) 50:16–25. doi: 10.1016/j.jnutbio.2017.08.006
84. Serino M, Luche E, Gres S, Baylac A, Bergé M, Cenac C, et al. Metabolic adaptation to a high-fat diet is associated with a change in the gut microbiota. Gut (2012) 61(4):543–53. doi: 10.1136/gutjnl-2011-301012
85. Thingholm LB, Rühlemann MC, Koch M, Fuqua B, Laucke G, Boehm R, et al. Obese individuals with and without type 2 diabetes show different gut microbial functional capacity and composition. Cell Host Microbe (2019) 26(2):252–264.e10. doi: 10.1016/j.chom.2019.07.004
86. Lindén SK, Florin TH, McGuckin MA. Mucin dynamics in intestinal bacterial infection. PloS One (2008) 3(12):e3952. doi: 10.1371/journal.pone.0003952
87. Ganesh BP, Richter JF, Blaut M, Loh G. Enterococcus faecium NCIMB 10415 does not protect interleukin-10 knock-out mice from chronic gut inflammation. Benef Microbes (2012) 3(1):43–50. doi: 10.3920/BM2011.0050
88. Gillois K, Lévêque M, Théodorou V, Robert H, Mercier-Bonin M. Mucus: An underestimated gut target for environmental pollutants and food additives. Microorganisms (2018) 6(2). doi: 10.3390/microorganisms6020053
Keywords: obesity, air pollution, metabolic program, particulate matter, gut microbiota, PM2.5, inflammation, gestation
Citation: Zordão OP, Campolim CM, Yariwake VY, Castro G, Ferreira CKO, Santos A, Norberto S, Veras MM, Saad MJA, Saldiva PHN, Kim Y-B and Prada PO (2023) Maternal exposure to air pollution alters energy balance transiently according to gender and changes gut microbiota. Front. Endocrinol. 14:1069243. doi: 10.3389/fendo.2023.1069243
Received: 13 October 2022; Accepted: 07 March 2023;
Published: 04 April 2023.
Edited by:
Qinghua Sun, Zhejiang Chinese Medical University, ChinaReviewed by:
Mathilde Body-Malapel, Université de Lille, FranceYue Wu, Zhejiang Chinese Medical University, China
Amie Lund, University of North Texas, United States
Zhekang Ying, University of Maryland, United States
Copyright © 2023 Zordão, Campolim, Yariwake, Castro, Ferreira, Santos, Norberto, Veras, Saad, Saldiva, Kim and Prada. This is an open-access article distributed under the terms of the Creative Commons Attribution License (CC BY). The use, distribution or reproduction in other forums is permitted, provided the original author(s) and the copyright owner(s) are credited and that the original publication in this journal is cited, in accordance with accepted academic practice. No use, distribution or reproduction is permitted which does not comply with these terms.
*Correspondence: Patricia Oliveira Prada, cHByYWRhQHVuaWNhbXAuYnI=; cGF0cmljaWEuZGVvLnByYWRhQGdtYWlsLmNvbQ==