 Yanping Yuan
 Xianghai Zhou
 Weiping Jia
 Jian Zhou
 Fan Zhang3
 Linong Ji
- 1Department of Endocrinology, Peking University People’s Hospital, Beijing, China
- 2Department of Endocrinology & Metabolism, Shanghai Jiao Tong University Affiliated Sixth People’s Hospital, Shanghai Diabetes Institute, Shanghai, China
- 3Department of Endocrinology, Peking University Shenzhen Hospital, Shenzhen, Guangdong, China
- 4Department of Endocrinology and Metabolism, The First Affiliated Hospital of Dalian Medical University, Dalian, Liaoning, China
Aims: Fasting capillary blood glucose (FCG) and postprandial capillary blood glucose (PCG) both contribute to HbA1c in diabetes. Due to the collinearity between FCG and PCG, the HbA1c prediction model could not be developed with both FCG and PCG by linear regression. The study aimed to develop an HbA1c prediction model with both FCG and PCG to estimate HbA1c in type 2 diabetes.
Methods: A total of 1,642 patients with type 2 diabetes who had at least three FCG and three PCG measurements in the past 3 months were enrolled in the study. The mean of FCG (MEANFCG) and PCG (MEANPCG) were calculated for each patient. The patients were randomized into exploratory and validation groups. The former was used for developing HbA1c prediction models and the latter for performance evaluation.
Results: The new HbA1c prediction model using ridge regression expressed as HbA1c (%) = 0.320×MEANFCG (mmol/L) + 0.187×MEANPCG (mmol/L) + 2.979, R2 = 0.668. Compared to linear regression models developed with FCG, PCG, fasting plasma glucose (FPG), and 2-hour postprandial plasma glucose (2-h PPG), respectively, the new HbA1c prediction model showed the smallest mean square error, root mean square error, mean absolute error. The concordance correlation coefficient of the new HbA1c prediction model and the linear regression models with MEANFCG, MEANPCG, FPG or 2-h PPG were 0.810,0.773,0.749,0.715,0.672.
Conclusion: We have developed a new HbA1c prediction model with both FCG and PCG, which showed better prediction ability and good agreement.
Introduction
Glycated hemoglobin (HbA1c) is strongly correlated with mean blood glucose levels over 3 months. The American Diabetes Association (ADA) recommends that the goal of HbA1c is <7% in most non-pregnant adults with diabetes, which is directly associated with the reduction of diabetes complications (1). But HbA1c also has limitations in assessing blood glucose control. First, since HbA1c is measured once every 3 months and does not reflect the change in blood glucose promptly, HbA1c was not appropriate for assessing glycemic control in patients with adjusted hypoglycemic agents for less than 3 months. Second, there are marked discrepancies between blood glucose and HbA1c level for patients such as hemoglobin variant, thalassemia, hemolysis, recent blood transfusion and pregnancy (2). For those who are not suitable for HbA1c mentioned above, continuous glucose monitoring (CGM) and self-monitoring of blood glucose (SMBG) provide immediate spot glucose readings in diabetes. CGM is expensive and not available for all type 2 diabetes, while SMBG is undoubtedly a convenient and cost-effective method of blood glucose monitoring that is widely used by patients with diabetes to guide the timely modification of diabetes treatment regimens (3).
Studies on the association between SMBG and HbA1c were limited in patients with type 2 diabetes. The A1c-Derived Average Glucose (ADAG) study provided the correlation between HbA1c and mean blood glucose from CGM and SMBG in patients with type 1 diabetes, type 2 diabetes and nondiabetic, and allowed the calculation of estimated mean blood glucose for a given HbA1c (4). However, the correlation in ADAG was not appropriate for type 2 diabetes with less frequent blood glucose monitoring that was not sufficient to obtain average blood glucose. Compared with premeal glucose or postprandial glucose, the immediate clinical value of mean blood glucose in day-to-day blood glucose monitoring and treatment was limited. Although previous studies have reported the relationship between fasting capillary blood glucose (FCG) or postprandial capillary blood glucose (PCG) with HbA1c (5, 6), there is no doubt that both FCG and PCG contribute to HbA1c levels (5), so the prediction of HbA1c using FCG or PCG alone may be inaccurate. In clinical practice, it can be observed that some patients only reach the FCG target or the PCG target, how to predict the HbA1c levels of these patients individually is unknown for now. Therefore, it is necessary to take both FCG and PCG into account when analyzing the relationship between blood glucose and HbA1c. In the present study, we analyzed the association between FCG, PCG, and HbA1c using data from Chinese patients with type 2 diabetes who had stable diabetes treatment, and thus develop a new HbA1c prediction model based on both FCG and PCG.
Materials and methods
Study population
The multi-center, observational study enrolled patients with type 2 diabetes in endocrinology departments of eight hospitals in China from March 2018 to Jan 2020. The inclusion criteria included the following: 1) Type 2 diabetes aged ≥18 years referred to the endocrinology department; 2) being untreated, or receiving stable antidiabetic treatment including diet, exercise, or hypoglycemic agents for at least 3 months before the study; 3) having at least three FCG and three PCG measurements over a 3-month period before the study. The exclusion criteria included the following: 1) being pregnant or lactated; 2) using drugs that elevate blood glucose such as glucocorticoids, chemotherapy drugs within 3 months; 3) having conditions that may change blood glucose such as infection, myocardial infarction, tumor, inflammation, trauma, hyperthyroidism, hypothyroidism, Cushing’s syndrome or acromegaly within 3 months; 4) having a history of severe liver disease or alanine transaminase/aspartate transaminase ≥3 times the normal upper limit; 5) having a history of serious kidney disease or serum creatinine >133 μmol/L; 6) having known hematological disease or hemoglobin <90 g/L; 7) being hypoproteinemia with serum albumin <35g/L; 8) blood transfusion or blood donation within 3 months. The Ethics Committee of the Peking University People’s Hospital approved the study protocol. All patients signed informed consent before the interview and data collection. In this study, data were collected from 1737 patients with type 2 diabetes. After excluding 24 patients diagnosed with diabetes for less than 3 months, 5 patients who were found to have hemoglobin variants, 11 patients with hemoglobin <90 g/L, 16 patients with serum creatinine >133 umol/L, 22 patients with serum albumin <35 g/L, 9 patients with alanine transaminase/aspartate transaminase ≥3 times the normal upper limit, and 8 patients with glycated albumin (GA) information missing, data from 1642 patients were used for data analysis. The patients were randomized into an exploratory group including 819 patients and a validation group including 823 patients.
Data collection
Demographic characteristics and medical history of the patients were recorded. Patients’ glucose-lowering medications, records of 3 FCGs and 3 to 9 PCGs in SMBG, smoking, and alcohol consumption during the last 3 months before the interview were collected. Body weight and height were measured using a calibrated scale and body mass index (BMI, kg/m2) was calculated. Blood pressure was measured using a mercury sphygmomanometer.
Laboratory assessments
Venous blood samples were drawn in the morning after an overnight fast. Fasting plasma glucose (FPG), HbA1c, hemoglobin, serum creatinine, albumin, alanine transaminase, aspartate transaminase, total cholesterol, and triglycerides were measured in local laboratories. Patients had breakfast and take their daily hypoglycemic agents. The blood sample was collected 2 hours later to measure 2-hour postprandial plasma glucose (2-h PPG). Glycated hemoglobin HbA1c was tested using ion-exchange high-performance liquid chromatography, capillary electrophoresis, immunoassay, enzymatic assay or boronate affinity chromatography in local laboratories. Local laboratories were required to perform 10 samples comparison quarterly with the Department of Laboratory Medicine, Zhongshan Hospital, Fudan University, which is an HbA1c Secondary Referral Laboratory certificated by the National Glycohemoglobin Standardization Program (NGSP) (7). At 1 year, all local laboratories achieved a deviation of ≤6% in at least 38 of 40 HbA1c results. Serum and whole blood specimens were stored at -80°C and transported to the central laboratory at Peking University People’s Hospital for GA and hemoglobin electrophoresis. GA was measured by enzymatic methods (Lucica GA‐L, Japan). Hemoglobin electrophoresis was performed to screen the Hb variant using the method of capillary electrophoresis (Minicap Flex Piercing, Sebia, France).
Definition
FCG referred to the capillary blood glucose before breakfast of a day. PCG referred to the capillary blood glucose 2 hours after breakfast, lunch or dinner. The mean of FCG (MEANFCG) and PCG (MEANPCG) were calculated for each patient. The MEANPCG was the mean PCG of each patient after three meals. The mean PCG of breakfast (MEANPCGB), lunch (MEANPCGL) and dinner (MEANPCGD) were also calculated for each patient.
Criteria for the diagnosis of type 2 diabetes and definition of HbA1c goal achievement of <7% were based on American Diabetes Association ADA (2022) guidelines (1). FCG control target range was 80-130 mg/dL (4.4-7.2 mmol/L) according to ADA guideline and 80-126 mg/dL (4.4-7.0 mmol/L) according to the Chinese Diabetes Society (CDS) (8). The target of PCG control was <180mg/dL (10.0 mmol/L) according to the ADA and CDS guidelines. Medical history of type 2 diabetes was also an auxiliary criterion for the diagnosis of type 2 diabetes. Hypoglycemia was defined as the patient’s SMBG recorded blood glucose or plasma glucose concentration <3.9 mmol/L, as well as self-reported hypoglycemic symptoms.
Statistical analysis
Data analysis was performed using SPSS software (version 23.0; IBM Corp., Armonk, New York, USA). Continuous variables were presented as mean ± standard deviation or median (interquartile range). Categorical variables were expressed as number (percentage).
The patients were randomized into exploratory and validation groups by SPSS software. HbA1c prediction models were developed in the exploratory group and validated in the validation group. The correlation coefficient between MEANFCG and MEANPCG was 0.827 (P <0.001). Correlation coefficient >0.8 was considered collinearity (9). Due to the collinearity between MEANFCG and MEANPCG, the ridge regression model was used to develop a new HbA1c prediction model using both MEANFCG and MEANPCG to predict HbA1c. Ridge parameter k (lambda) was introduced to the regression equation to make the estimated value of the regression coefficient essentially stable. The trend of ridge trace became stable with the optimal ridge parameter k (10). The optimal value of ridge parameter k was selected by the machine learning method with cross-validation using Python 3.8. Simple linear regression models were developed to predict HbA1c with MEANFCG, MEANPCG, FPG, and 2-h PPG, respectively. The difference in performance between the new HbA1c prediction model and simple linear regression models was assessed by mean square error (MSE), root mean square error (RMSE), mean absolute error (MAE), and coefficient of determination (R2) in the validation group. The MSE, RMSE, MAE was calculated by
respectively. Xi represents the predicted HbA1c, Yi represents the actual measured HbA1c, m means the sum of participants. The smaller MSE, RMSE, and MAE demonstrated the better accuracy of the prediction model (11).
Bland–Altman plots and concordance correlation coefficient (CCC) were used to evaluate the agreement between actual HbA1c and predicted HbA1c in the validation group. The CCC >0.80 suggested a strong agreement between actual and predicted values. Receiver operating characteristic (ROC) curves were used to assess the sensitivity and specificity of the new HbA1c prediction model and simple linear regression models to detect patients with HbA1c <7% using MedCalc version 20.0. The areas under the ROC curves (AUC) of HbA1c prediction models were calculated and compared using the DeLong test. All P-values were two-tailed and P-values <0.05 were considered statistically significant.
Results
Patient characteristics
There were 1642 patients with a mean age of 59.3 ± 11.0 years in the study. Males accounted for 61.9%. The median duration of type 2 diabetes was 7.9 years. Patients had an average MEANFCG of 8.29 ± 2.64 mmol/L, average MEANPCG of 11.55 ± 3.73 mmol/L, and mean HbA1c of 7.80 ± 1.86%. The mean number of daily glucose tests was 7.51 ± 2.08. The percentage of patients experiencing hypoglycemia was 11.1% within 3 months. The clinical characteristics of the patients were not statistically different between the exploratory group and the validation group (Table 1). The mean number of daily glucose tests was not significantly different between those on non-insulin-treated and insulin-treated patients in the exploratory group (7.49 ± 2.06 vs 7.45 ± 2.00, P=0.784), but the mean number of daily glucose tests in non-insulin-treated patients was more than those in insulin treatment in the validation group (7.68 ± 2.20 vs 7.28 ± 1.95, P=0.011).
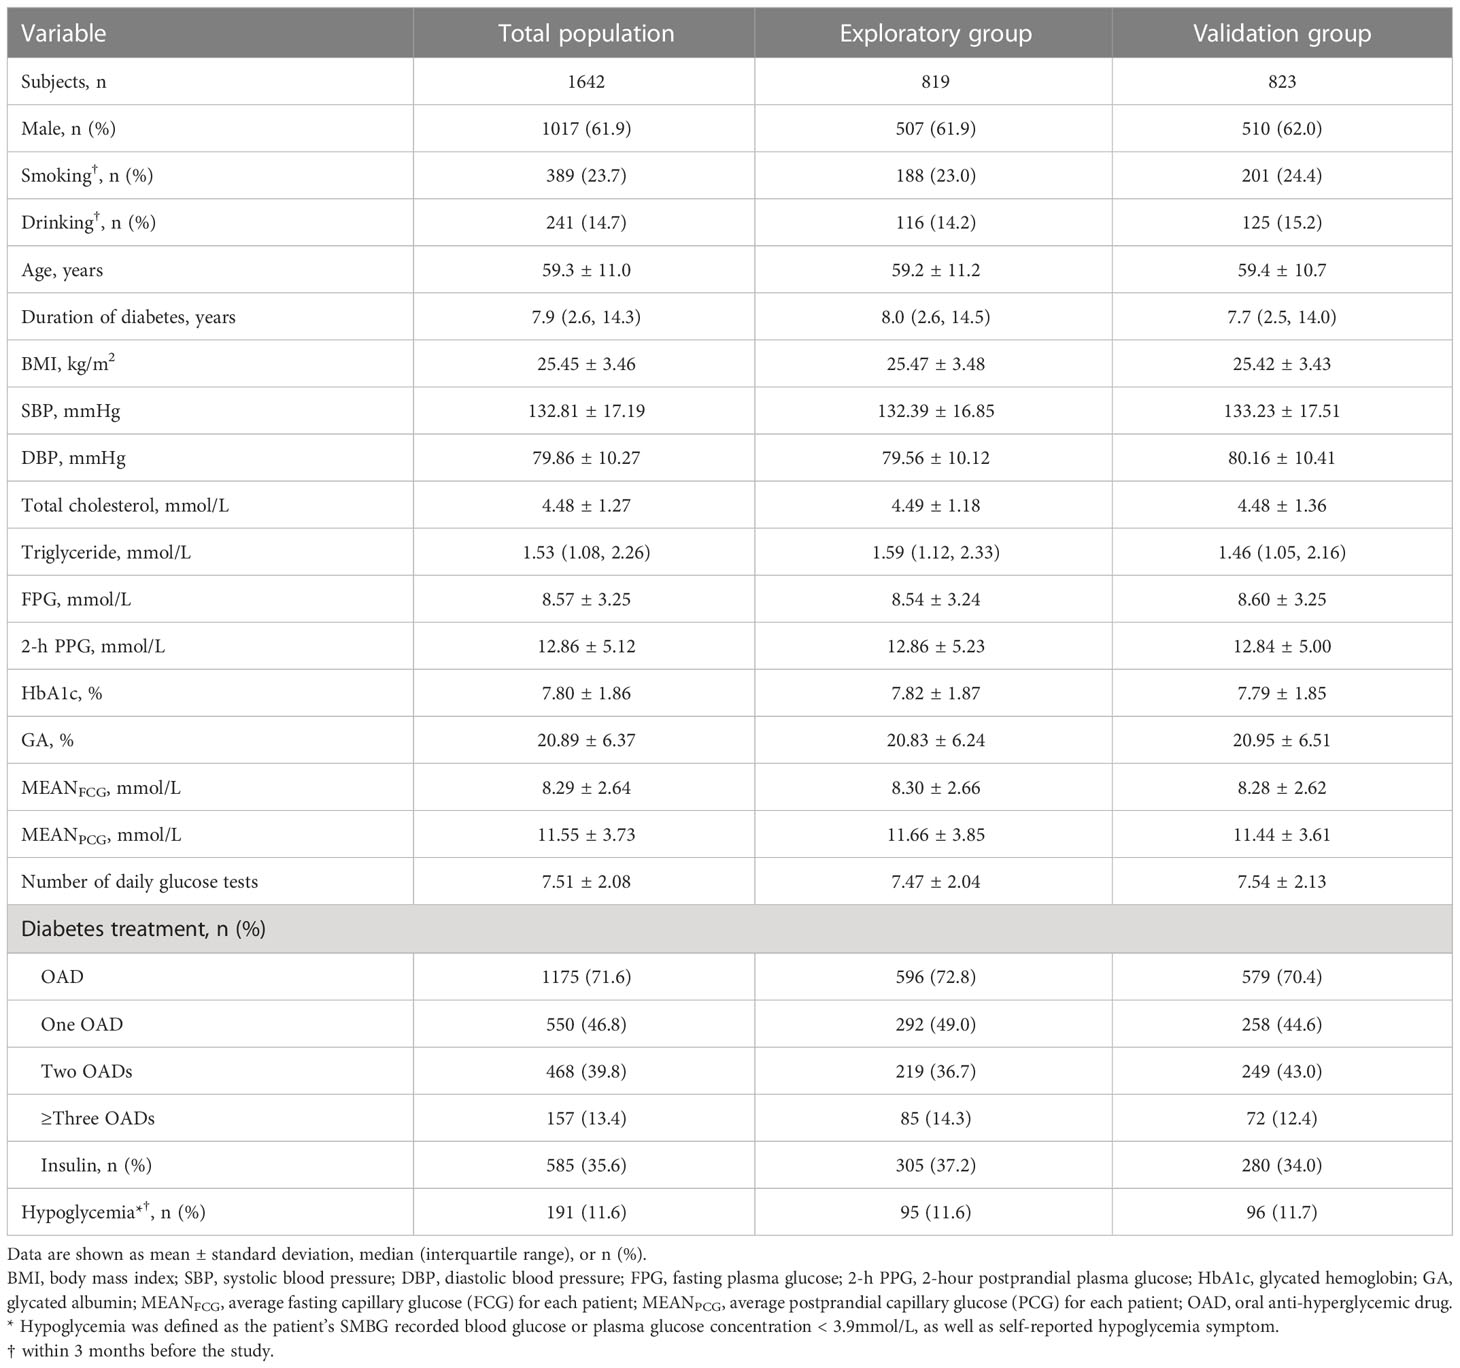
Table 1 Characteristics of 1642 patients with type 2 diabetes.
HbA1c prediction models and their performance
In the exploratory group, the trend of ridge trace became stable when ridge parameter k was 0.03 (Figure 1). The new HbA1c prediction model expressed as HbA1c (%) = 0.320×MEANFCG (mmol/L) + 0.187×MEANPCG (mmol/L) + 2.979 when k = 0.03. The four simple linear regression models of HbA1c based on MEANFCG, MEANPCG, FPG, or 2-h PPG expressed as HbA1c (%) = 0.554×MEANFCG (mmol/L) +3.218, HbA1c (%) = 0.376×MEANPCG (mmol/L) +3.434, HbA1c (%) = 0.417×FPG (mmol/L) +4.251 and HbA1c (%) = 0.256×(2-h PPG) (mmol/L) +4.527, respectively. The R2 of the new HbA1c prediction model and the linear regression model with MEANFCG, MEANPCG, FPG or 2-h PPG was 0.668, 0.622, 0.599, 0.523 and 0.511, respectively, indicating that the predictors of the new HbA1c prediction model were more strongly correlated with HbA1c compared with the other linear regression models (Table 2). In addition, the ridge regression model of HbA1c based on both FPG and 2-h PPG expressed as HbA1c (%) = 0.248×FPG (mmol/L) + 0.144×(2-h PPG) (mmol/L) + 3.844 when k = 0.02, R2 = 0.639. Sensitivity analysis of PCG was performed. In patients who had PCG of three meals (N=417), the R2 of linear regression model of HbA1c based on MEANPCGB, MEANPCGL and MEANPCGD was 0.556, 0.504 and 0.506, respectively. And R2 of the linear regression model of 2-h PPG and HbA1c in 417 patients was 0.496.
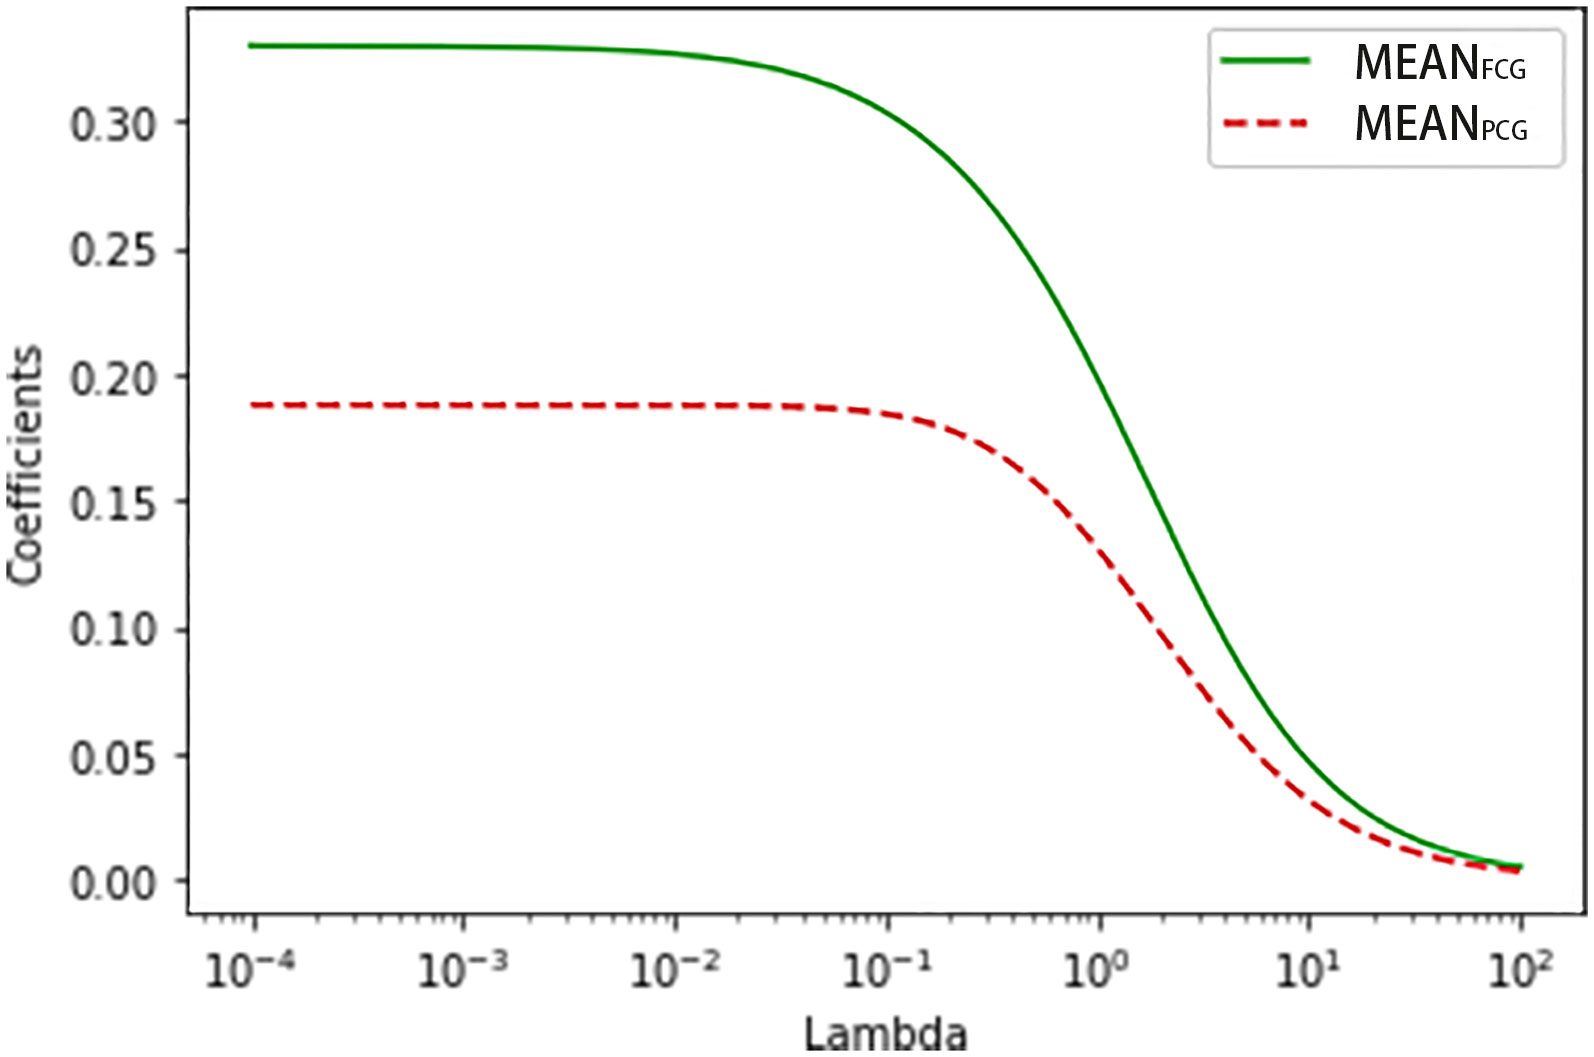
Figure 1 The ridge trace of the ridge regression model for predicting HbA1c with MEANFCG and MEANPCG.
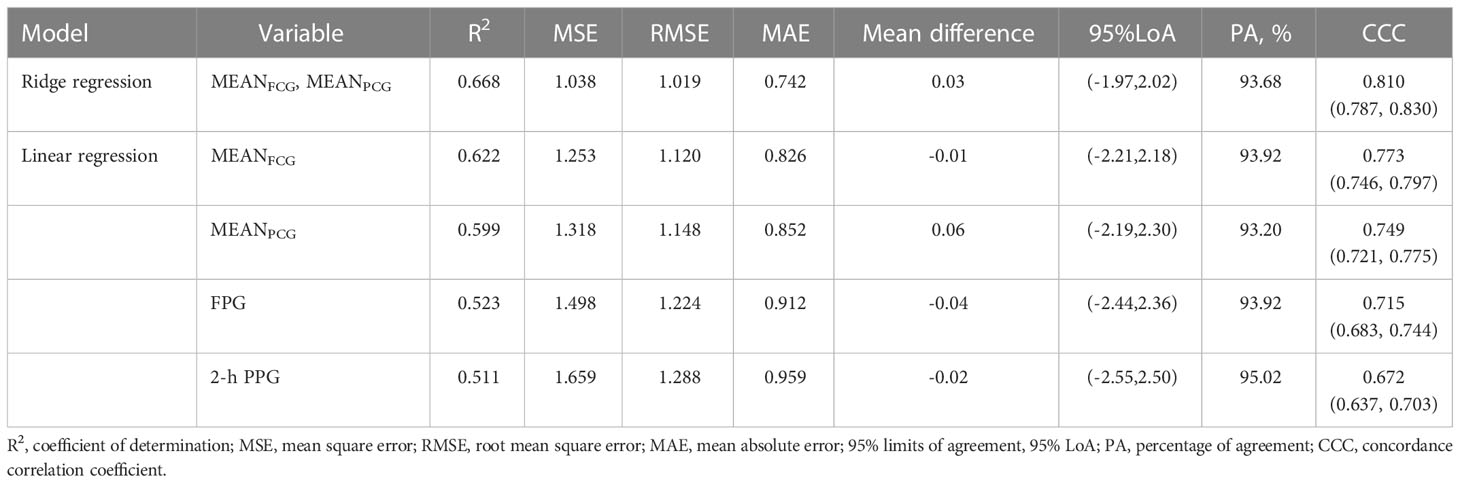
Table 2 The comparison of ridge regression model and simple linear regression model for HbA1c.
In the validation group, the new HbA1c prediction model yielded the smallest value of MSE, RMSE, and MAE compared with four simple linear regression models with MEANFCG, MEANPCG, FPG, or 2-h PPG in the validation group (Table 2). The Bland-Altman plot showed that the mean difference (95% limits of agreement) was 0.03(-1.97,2.02) between actual HbA1c and predicted HbA1c with the new prediction model (Figure 2). The mean difference of four simple linear regression models by MEANFCG, MEANPCG, FPG, or 2-h PPG was also close to zero, with -0.01(-2.21,2.18), 0.06(-2.19,2.30), -0.04(-2.44,2.36), -0.02(-2.55,2.50), respectively. Most of the differences between actual HbA1c and predicted HbA1c in different prediction models were within 95% limits of agreement. Of the new HbA1c prediction model and simple linear regression models, only the CCC of the new HbA1c prediction model was greater than 0.80, indicating that the predicted HbA1c with the new HbA1c prediction model had a stronger agreement with actual HbA1c (Table 2). After removing patients who experienced hypoglycemia, the HbA1c prediction models showed similar performance (the results were not shown here).
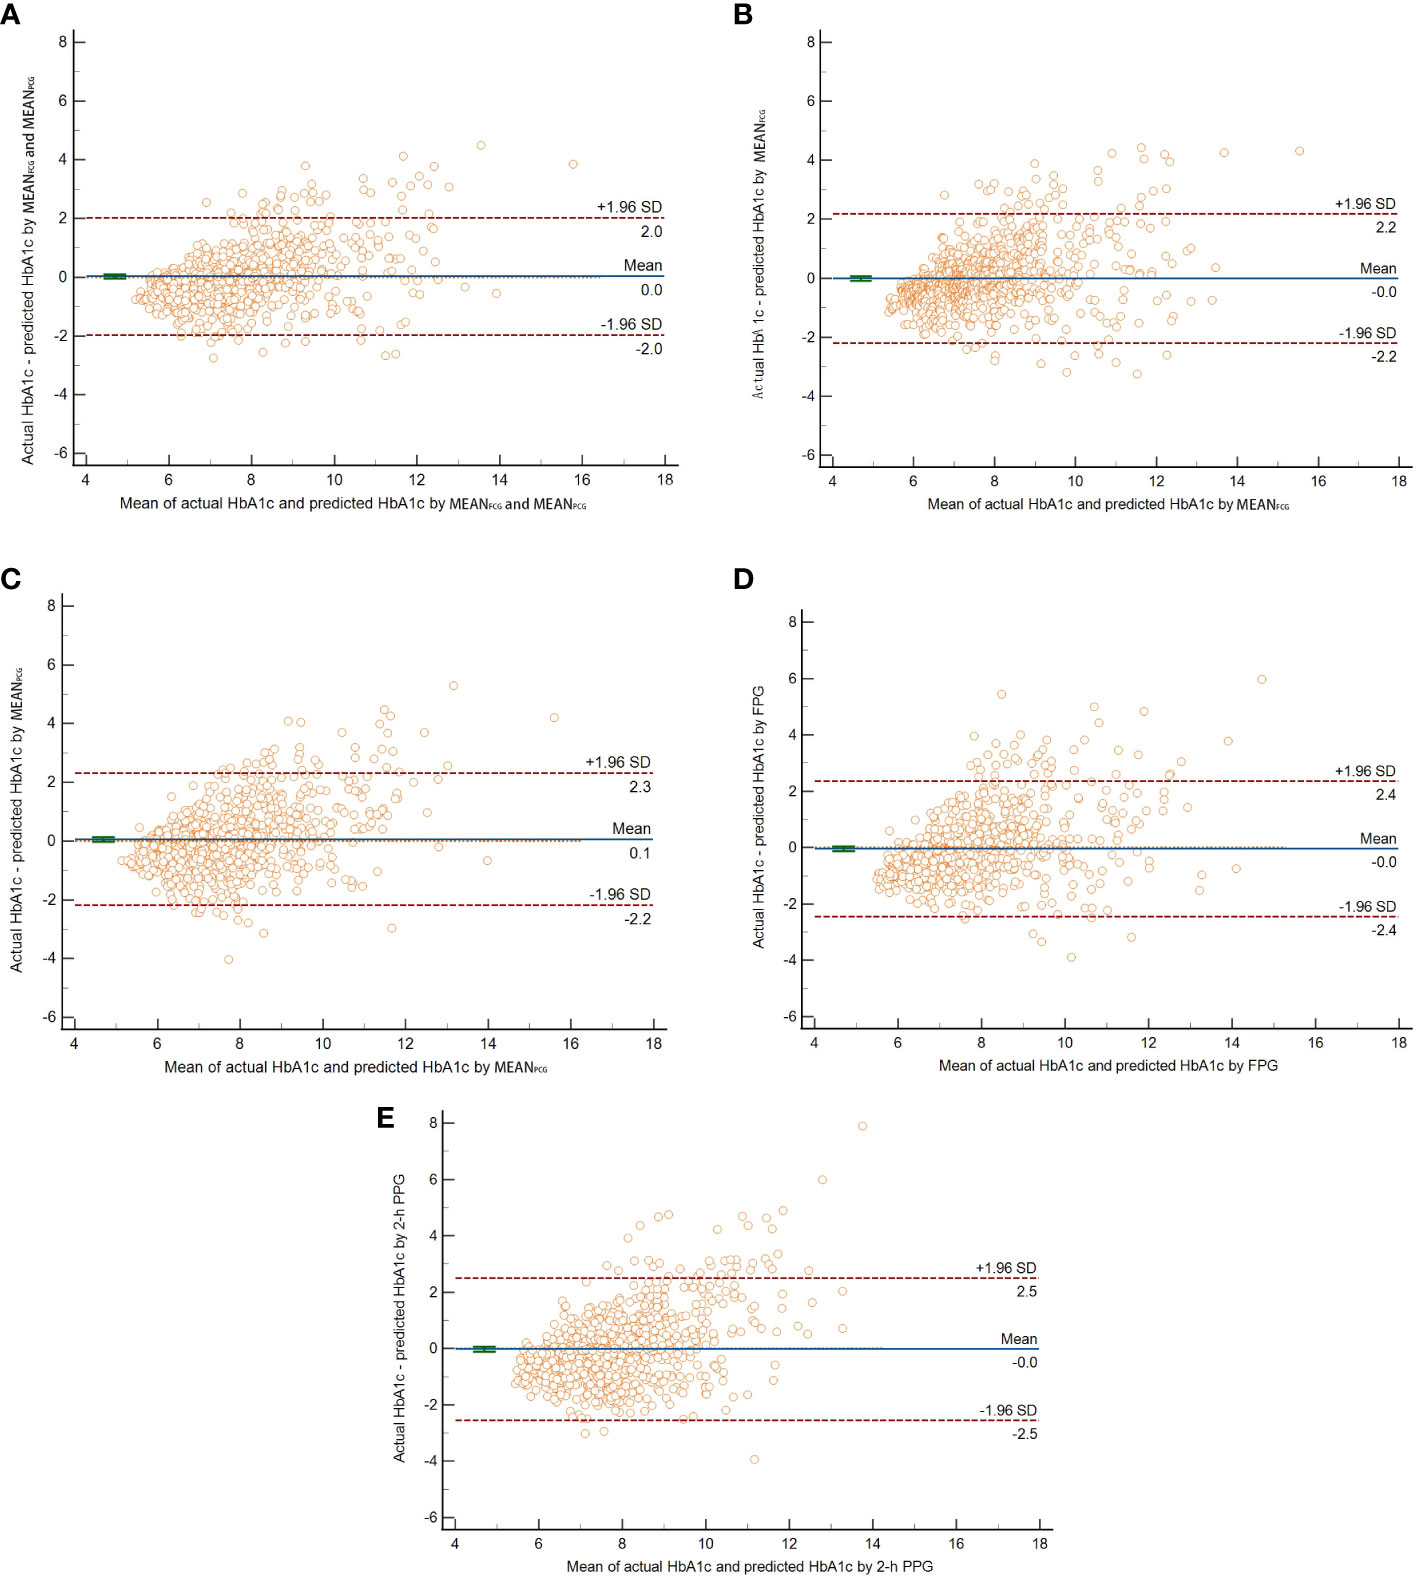
Figure 2 The Bland-Altman plot of actual HbA1c and predicted HbA1c by ridge regression with both MEANFCG and MEANPCG (A), linear regression with MEANFCG (B), MEANPCG (C), FPG (D), or 2-h PPG (E) respectively. The horizontal solid line in the middle indicated the mean difference between actual HbA1c and predicted HbA1c. The upper and lower horizontal dotted lines indicated the 95% limits of agreement.
The ability of HbA1c prediction models to detect patients with HbA1c <7%
In the validation group, the new HbA1c prediction model for predicting HbA1c with MEANFCG and MEANPCG showed strong predictive ability to detect patients who had HbA1c <7% with AUC of 0.895 (95% CI: 0.872, 0.915), which was higher than simple linear regression models with MEANPCG [0.860 (0.835, 0.883), P <0.0001], FPG [0.863 (0.838, 0.886), P=0.011] or 2-h PPG [0.850 (0.824, 0.874), P=0.001]. But the new HbA1c prediction model did not show better predictive ability compared to the simple linear regression model with MEANFCG [0.884 (0.860, 0.905), P=0.107] (Figure 3).
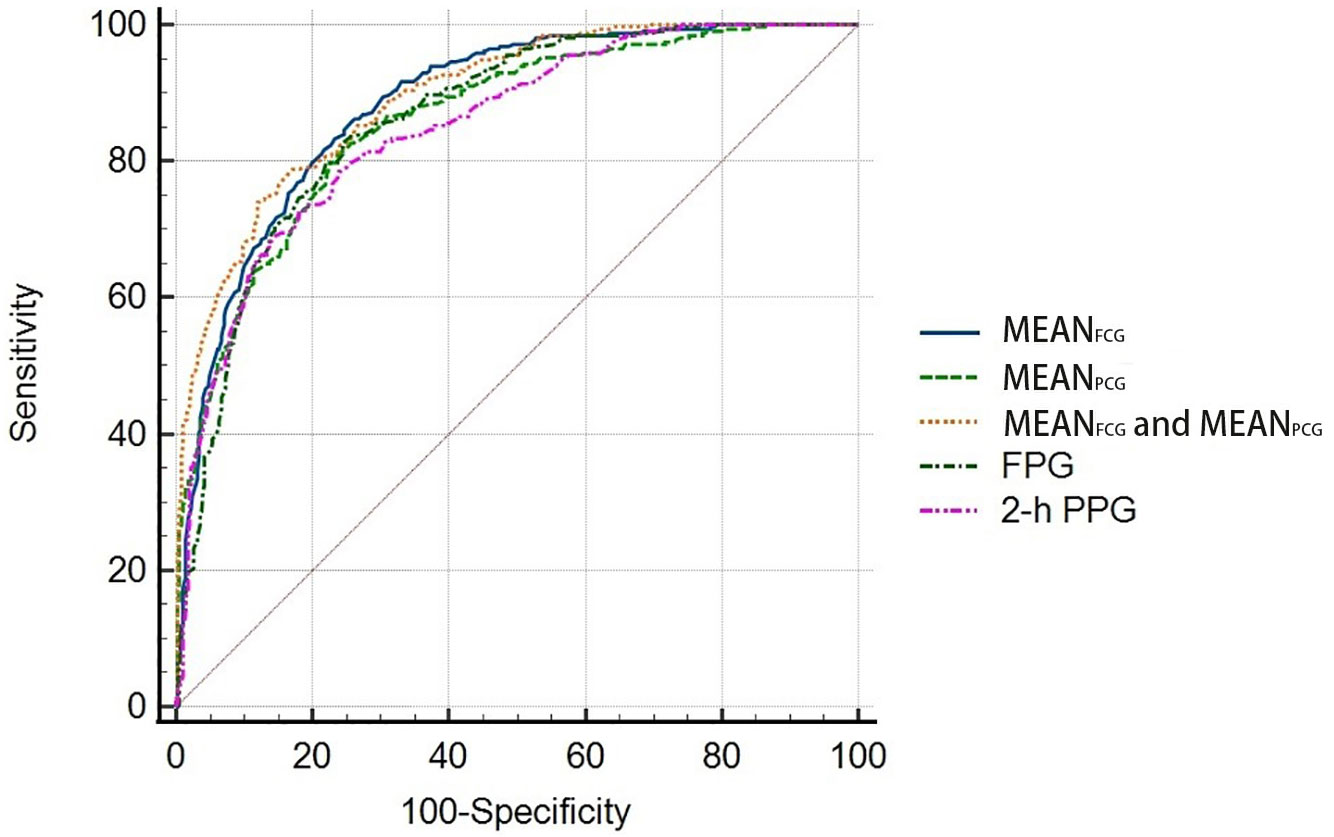
Figure 3 Receiver operating characteristic (ROC) curves for the HbA1c prediction models to detect patients with HbA1c <7%.
Consistency of actual and predicted HbA1c grouped with FCG and PCG control targets
Patients were grouped with MEANFCG ≤7.2 and >7.2 mmol/L, MEANPCG <10.0 and ≥10.0 mmol/L, respectively. More than 80% of patients had the consistency of actual and predicted HbA1c for both <7% and both ≥7% in patients with both MEANFCG and MEANPCG within/outside the control target range (Table 3). In patients who had MEANFCG within the control target range and MEANPCG ≥10.0 mmol/L, a proportion of 35.1% patients had actual HbA1c <7% but predicted HbA1c ≥7%. And two of these patients with actual HbA1c <7% but predicted HbA1c ≥7% had experienced hypoglycemia, one of them was given insulin treatment and the other one was given insulin secretagogues, compared with no one had experienced hypoglycemia in both actual and predicted HbA1c <7%. In patients who had MEANFCG >7.2 mmol/L and MEANPCG within the control target range, patients with actual HbA1c <7% but predicted HbA1c ≥7% accounted for 20.6%. Only one patient with insulin use had experienced hypoglycemia compared with no one who had experienced hypoglycemia in both actual and predicted HbA1c <7%.
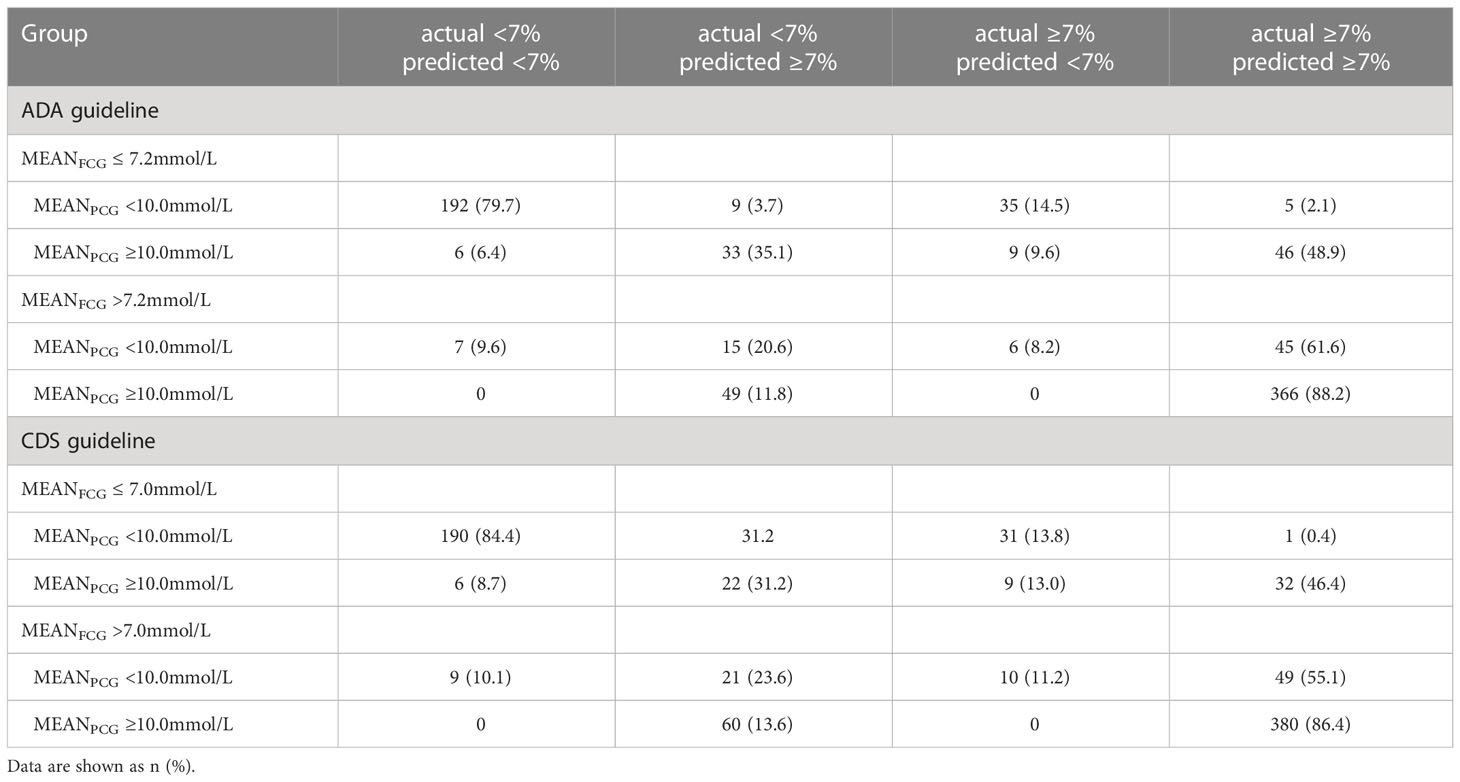
Table 3 Actual and predicted HbA1c grouped with FCG and PCG control targets.
Similar results were found when patients were grouped with MEANFCG ≤7.0 and >7.0 mmol/L, MEANPCG <10.0 and ≥10.0 mmol/L, respectively.
Discussion
Our study analyzed the correlation of MEANFCG and MEANPCG with HbA1c using ridge regression and developed a new model for predicting HbA1c by combining MEANFCG and MEANPCG. The new HbA1c prediction model predicted HbA1c with better performance than the HbA1c prediction model using MEANFCG, MEANPCG, FPG, or 2-h PPG alone. The new HbA1c prediction model had a better predictive ability to detect patients who had HbA1c <7% than simple linear model with MEANPCG, FPG, or 2-h PPG, but was similar to the simple linear model with MEANFCG.
To our knowledge, our study was the first to use a ridge regression model to establish a model using FCG and PCG together to predict HbA1c in patients with type 2 diabetes. This new HbA1c prediction model was appropriate for patients who were not suitable for HbA1c measurement after adjusting hypoglycemic treatment for less than 3 months, especially when patients only reached FCG or PCG target. Individualized predicted HbA1c with SMBG results was used to determine whether the hypoglycemic treatment should be adjusted to promote HbA1c to reach the goal quickly. When the patient’s actual HbA1c was inconsistent with the predicted HbA1c, the cause should be actively sought, such as frequent hypoglycemia, anemia, hemolysis, pregnancy, hemoglobinopathy, etc. In these patients, the new HbA1c prediction model might be applied to evaluate long-term glycemic control.
Our study showed that FCG had a stronger predictive performance for HbA1c than FPG alone, which was similar to the results of a previous study (5). When comparing PCG after three meals and 2-h PPG, it seems that PCG after breakfast was better than that after lunch, after dinner, and 2-h PPG, indicating that PCG after breakfast was more important than other meals, and superior to intravenous blood glucose after breakfast. This suggested that patients should pay more attention to PCG after breakfast in the PCG after three meals. Moreover, the R2 of the model developed using both FPG and 2-h PPG was lower than that of the new HbA1c prediction model using both MEANFCG and MEANPCG, indicating that SMBG at home was better than single intravenous blood glucose measurement in hospital when predicting HbA1c. A possible explanation was that FPG and 2-h PPG had day-to-day variability (12–14), so that the average blood glucose level over a period of time was a more accurate reflection of HbA1c levels than a single plasma glucose test.
Compared with the new prediction model, simple linear model with FCG showed comparable ability to identify patients with HbA1c <7%, but the simple linear model with PCG showed worse ability. It indicated that FCG had a higher value than PCG in determining whether patients had achieved an HbA1c goal of <7%. This was consistent with previous reports that premeal blood glucose was more closely related to HbA1c than postmeal blood glucose (15). In patients without monitoring PCG, FCG alone can be used to identify whether a patient is meeting the HbA1c goal using the simple linear model with FCG.
There was a discrepancy between the actual HbA1c and predicted HbA1c by the new HbA1c prediction model in this study. In patients who had only FCG within control target range, about 1/3 of patients with actual HbA1c <7.0% had predicted HbA1c ≥7%. Compared to patients with actual and predicted HbA1c <7.0%, we found that more patients had experience hypoglycemia in those with actual HbA1c <7.0% and predicted HbA1c ≥7%. The possible explanation was that these patients had a higher risk of hypoglycemia, which lead to the actual HbA1c reaching the goal. At this time, the actual HbA1c might be inaccurate, suggesting that clinicians should not reduce blood glucose excessively to further increase the risk of hypoglycemia in this case. For those who had only PCG within control target range, 1/4 of the patients with actual HbA1c <7% had predicted HbA1c ≥7%. Limited by the number of people with hypoglycemia occurrence, it was difficult to speculate whether these people had an increased risk of hypoglycemia.
Studies have found that blood glucose testing number correlated with HbA1c attainment in insulin-treated patients (16, 17). In our study, although the frequency of blood glucose was different in insulin-treated patients, the average blood glucose was finally included in the model for HbA1c prediction. In addition, there was no difference in the number of blood glucose tests between the insulin-treated and non-insulin-treated patients in the model-established group, which could avoid the interference to the prediction model caused by the increased number of tests in insulin-treated patients. Although more glucose tests were observed in non-insulin-treated patients than insulin-treated patients in the validation group, studies showed that SMBG frequency was not associated with glycemic control in non-insulin-treated patients (18, 19).
The strength of this study was that it was a multicenter study, and only required type 2 diabetes with insulin-treated and non-insulin-treated to have at least three FCG and three PCG measurements, indicating that this study had good extrapolation in type 2 diabetes. Several limitations exist in the current study. First, SMBG measurements were performed by the patient’s glucose-monitoring devices. Improper operation during blood glucose measurement, expiration of the test strip, and failure to calibrate might affect the accuracy and precision of the glucose readings. Second, the SMBG values were collected from four points including fasting and after three meals for several days over 3 months, some higher or lower values might be missed. But each point glucose value had at least 3 measurements for each patient with stable hypoglycemic treatment, which avoid a snapshot of glucose variability and reduce the impact of intra-individual differences. Third, validation of the new HbA1c prediction model was performed internally, and further validation of the model in external populations will be required in the future. Fourth, the efficacy and safety of this new HbA1c prediction model remained to be investigated, and we are conducting clinical trials to evaluate its efficacy and safety in patients with type 2 diabetes who have just been adjusted for hypoglycemic treatment.
In conclusion, we have established the association between FCG, PCG and HbA1c and developed a new HbA1c prediction model based on both FCG and PCG. The new HbA1c prediction model provided an available and convenient way to convert real-time SMBG readings to HbA1c. Applying the new HbA1c prediction model might help to make the most of SMBG information and promote HbA1c to reach the goal quickly in patients with type 2 diabetes.
Data availability statement
The original contributions presented in the study are included in the article/supplementary material. Further inquiries can be directed to the corresponding authors.
Ethics statement
The studies involving human participants were reviewed and approved by Peking University People’s Hospital. The patients/participants provided their written informed consent to participate in this study.
Author contributions
XZ designed this study. YY drafted the initial manuscript. XZ and LJ revised the manuscript. XZ, WJ, JZ, FZ, JD were responsible for collecting and managing the data of their hosipital. All authors contributed to the article and approved the submitted version.
Funding
This work is supported by the grant 2016YFC1305600, 2016YFC1305603 from the Major Chronic Non-communicable Disease Prevention and Control Research, National Key R&D Program of China.
Conflict of interest
The authors declare that the research was conducted in the absence of any commercial or financial relationships that could be construed as a potential conflict of interest.
Publisher’s note
All claims expressed in this article are solely those of the authors and do not necessarily represent those of their affiliated organizations, or those of the publisher, the editors and the reviewers. Any product that may be evaluated in this article, or claim that may be made by its manufacturer, is not guaranteed or endorsed by the publisher.
References
1. American Diabetes Association Professional Practice Committee. 6. glycemic targets: Standards of medical care in diabetes-2022. Diabetes Care (2022) 45:S83–96. doi: 10.2337/dc22-S006
2. American Diabetes Association Professional Practice Committee. 2. classification and diagnosis of diabetes: Standards of medical care in diabetes-2022. Diabetes Care (2022) 45:S17–38. doi: 10.2337/dc22-S002
3. American Diabetes Association Professional Practice Committee. 7. diabetes technology: Standards of medical care in diabetes-2022. Diabetes Care (2022) 45:S97–S112. doi: 10.2337/dc22-S007
4. Nathan DM, Kuenen J, Borg R, Zheng H, Schoenfeld D, Heine RJ, et al. Translating the A1C assay into estimated average glucose values. Diabetes Care (2008) 31:1473–8. doi: 10.2337/dc08-0545
5. Monami M, Lamanna C, Lambertucci L, Longo R, Cocca C, Addante F, et al. Fasting and post-prandial glycemia and their correlation with glycated hemoglobin in type 2 diabetes. J Endocrinol Invest (2006) 29:619–24. doi: 10.1007/BF03344161
6. Chubb SAP, Van Minnen K, Davis WA, Bruce DG, Davis TME. The relationship between self-monitoring of blood glucose results and glycated haemoglobin in type 2 diabetes: the fremantle diabetes study. Diabetes Res Clin Pract (2011) 94:371–6. doi: 10.1016/j.diabres.2011.07.038
7. NGSP Home. Available at: http://www.ngsp.org/ (Accessed Feb 8, 2022).
8. Chinese Diabetes Society (CDS). Guideline for the prevention and treatment of type 2 diabetes in China (2020 edition). Chinese J Diabetes (2021) 13(4):317–411. doi: 10.3760/cma.j.cn115791-20210221-00095
9. Vatcheva KP, Lee M, McCormick JB, Rahbar MH. Multicollinearity in regression analyses conducted in epidemiologic studies. Epidemiol Sunnyvale Calif (2016) 6:227. doi: 10.4172/2161-1165.1000227
10. Hoerl AE, Kennard RW. Ridge regression: Biased estimation for nonorthogonal problems. Technometrics (1970) 12:55–67. doi: 10.1080/00401706.1970.10488634
11. Chicco D, Warrens MJ, Jurman G. The coefficient of determination r-squared is more informative than SMAPE, MAE, MAPE, MSE and RMSE in regression analysis evaluation. PeerJ Comput Sci (2021) 7:e623. doi: 10.7717/peerj-cs.623
12. Ollerton RL, Playle R, Ahmed K, Dunstan FD, Luzio SD, Owens DR. Day-to-day variability of fasting plasma glucose in newly diagnosed type 2 diabetic subjects. Diabetes Care (1999) 22:394–8. doi: 10.2337/diacare.22.3.394
13. DeVries JH, Bailey TS, Bhargava A, Gerety G, Gumprecht J, Heller S, et al. Day-to-day fasting self-monitored blood glucose variability is associated with risk of hypoglycaemia in insulin-treated patients with type 1 and type 2 diabetes: A post hoc analysis of the SWITCH trials. Diabetes Obes Metab (2019) 21:622–30. doi: 10.1111/dom.13565
14. Sacks DB. A1C versus glucose testing: a comparison. Diabetes Care (2011) 34:518–23. doi: 10.2337/dc10-1546
15. Fan W, Zheng H, Wei N, Nathan DM. Estimating HbA1c from timed self-monitored blood glucose values. Diabetes Res Clin Pract (2018) 141:56–61. doi: 10.1016/j.diabres.2018.04.023
16. Elgart JF, González L, Prestes M, Rucci E, Gagliardino JJ. Frequency of self-monitoring blood glucose and attainment of HbA1c target values. Acta Diabetol (2016) 53:57–62. doi: 10.1007/s00592-015-0745-9
17. Weinstock RS, Braffett BH, McGuigan P, Larkin ME, Grover NB, Walders-Abramson N, et al. Self-monitoring of blood glucose in youth-onset type 2 diabetes: Results from the TODAY study. Diabetes Care (2019) 42:903–9. doi: 10.2337/dc18-1854
18. Davis WA, Bruce DG, Davis TME. Is self-monitoring of blood glucose appropriate for all type 2 diabetic patients? the fremantle diabetes study. Diabetes Care (2006) 29:1764–70. doi: 10.2337/dc06-0268
Keywords: type 2 diabetes, HbA1c, ridge regression, fasting capillary blood glucose, postprandial capillary blood glucose
Citation: Yuan Y, Zhou X, Jia W, Zhou J, Zhang F, Du J and Ji L (2023) The association between self-monitoring of blood glucose and HbA1c in type 2 diabetes. Front. Endocrinol. 14:1056828. doi: 10.3389/fendo.2023.1056828
Received: 29 September 2022; Accepted: 23 January 2023;
Published: 07 February 2023.
Edited by:
Hiroshi Okada, Matsushita Memorial Hospital, JapanReviewed by:
Noriyuki Kitagawa, Kameoka Municipal Hospital, JapanWuQiang Fan, Massachusetts General Hospital, United States
Copyright © 2023 Yuan, Zhou, Jia, Zhou, Zhang, Du and Ji. This is an open-access article distributed under the terms of the Creative Commons Attribution License (CC BY). The use, distribution or reproduction in other forums is permitted, provided the original author(s) and the copyright owner(s) are credited and that the original publication in this journal is cited, in accordance with accepted academic practice. No use, distribution or reproduction is permitted which does not comply with these terms.
*Correspondence: Xianghai Zhou, eGlhbmdoYWlfemhvdUBiam11LmVkdS5jbg==; Linong Ji, cHJvZl9qaWxpbm9uZ0BhbGl5dW4uY29t