
94% of researchers rate our articles as excellent or good
Learn more about the work of our research integrity team to safeguard the quality of each article we publish.
Find out more
SYSTEMATIC REVIEW article
Front. Endocrinol. , 26 April 2023
Sec. Bone Research
Volume 14 - 2023 | https://doi.org/10.3389/fendo.2023.1044039
This article is part of the Research Topic Imaging of Adipose Tissue in Bone and Muscle: Implications for Osteoporosis, Sarcopenia and Frailty View all 11 articles
 Seoyul Lee1†
 Jeong Hun Kim2,3†
 Yun Kyung Jeon2,4Jung Sub Lee2,5Keunyoung Kim2,6Sun-Kyung Hwang3
 Jae Ho Kim1,7
 Tae Sik Goh2,5*‡
 Yun Hak Kim7,8,9*‡
Context: Circulating adipokines and ghrelin affect bone remodeling by regulating the activation and differentiation of osteoblasts and osteoclasts. Although the correlation between adipokines, ghrelin, and bone mineral density (BMD) has been studied over the decades, its correlations are still controversial. Accordingly, an updated meta-analysis with new findings is needed.
Objective: This study aimed to explore the impact of serum adipokine and ghrelin levels on BMD and osteoporotic fractures through a meta-analysis.
Data sources: Studies published till October 2020 in Medline, Embase, and the Cochrane Library were reviewed.
Study selection: We included studies that measured at least one serum adipokine level and BMD or fracture risk in healthy individuals. We excluded studies with one or more of the following: patients less than 18 years old, patients with comorbidities, who had undergone metabolic treatment, obese patients, patients with high physical activities, and a study that did not distinguish sex or menopausal status.
Data extraction: We extracted the data that include the correlation coefficient between adipokines (leptin, adiponectin, and resistin) and ghrelin and BMD, fracture risk by osteoporotic status from eligible studies.
Data synthesis: A meta-analysis of the pooled correlations between adipokines and BMD was performed, demonstrating that the correlation between leptin and BMD was prominent in postmenopausal women. In most cases, adiponectin levels were inversely correlated with BMD. A meta-analysis was conducted by pooling the mean differences in adipokine levels according to the osteoporotic status. In postmenopausal women, significantly lower leptin (SMD = -0.88) and higher adiponectin (SMD = 0.94) levels were seen in the osteoporosis group than in the control group. By predicting fracture risk, higher leptin levels were associated with lower fracture risk (HR = 0.68), whereas higher adiponectin levels were associated with an increased fracture risk in men (HR = 1.94) and incident vertebral fracture in postmenopausal women (HR = 1.18).
Conclusions: Serum adipokines levels can utilize to predict osteoporotic status and fracture risk of patients.
Systematic review registration: https://www.crd.york.ac.uk/prospero/display_record.php?ID=CRD42021224855, identifier CRD42021224855.
Bones, the support system our body and protectors of internal organs, and adipose tissue, the largest endocrine tissue in the body, are closely related to nutrient metabolism and energy storage. Obesity plays a protective role in bone mineral density (BMD) (1, 2). However, a low body weight is a major risk factor for osteoporotic low-energy fractures (3, 4). Therefore, body mass index (BMI) obtained by diving body weight (in kilograms) by height (in meters) squared is included as a variable in the Fracture Risk Assessment Tool to calculate the fracture risk over 10 years (5). In contrast to previous reports, a high prevalence of obesity has been found in postmenopausal women with osteoporotic fractures (6).
Mesenchymal stem cells (MSCs) are pluripotent progenitor cells that mainly differentiate into adipocytes, osteoblasts, and chondroblasts (7). These three cell lineages differentiate from MSCs by common regulatory factors, such as hormones and cytokines, which determine their proliferation as well. Increased adiposity in the bone marrow of osteoporotic patients supports a link between bone and fat (8). Additionally, adipokines that include leptin, adiponectin, resistin, and visfatin are secreted from adipose tissue and affect bone metabolism, supporting the link between fat and bone (9, 10). Although not produced from adipose tissue, ghrelin, a type of growth hormone secretagogue, also affects lipid metabolism and regulates bone homeostasis (11, 12).
A meta-analysis was previously conducted on the correlation between blood concentrations of adipokines and ghrelin and BMD. The meta-analysis revealed that adiponectin had the inverse correlation with BMD (r = -0.14 to -0.4), independent of fat mass, BMI, and menopausal status. And leptin had the correlation with BMD (r = 0.1 to 0.33) (13). The relationship between the blood concentration of adipokines, bone density, and osteoporotic fractures has been studied extensively in the past 10 years. In particular, several studies have been conducted on the correlation between resistin and BMD measured at various sites, indicating that it has recently been in the spotlight as a biomarker for BMD (14–17). In addition, studies on the association between BMD and leptin or adiponectin have been conducted. Hence, we performed an updated meta-analysis on the impact of serum adipokines on BMD and osteoporotic fractures. According to our analysis, BMD was correlated with serum leptin level and was inversely correlated with serum adiponectin level in postmenopausal women. Furthermore, the fracture risk was predicted to be higher with a lower serum leptin level and higher serum adiponectin level. Serum adipokines levels can utilize to predict osteoporotic status and fracture risk of patients.
This review was prospectively registered in PROSPERO (CRD42021224855) and followed the guidelines of the preferred reporting items for systematic reviews and meta-analyses.
We searched the literature that was published from April 2010 to October 2020 using Medline, Embase, and the Cochrane Library. To identify studies that assessed the association between adipokines and BMD values, we searched the online databases with the following keywords: (‘adipokine’ OR ‘leptin’ OR ‘adiponectin’ OR ‘resistin’ OR ‘visfatin’ OR ‘ghrelin’) AND (‘bone density’ OR ‘osteoporosis’ OR ‘absorptiometry’ OR ‘fractures’). All searches were restricted to articles on human patients published in English.
Articles that met the following inclusion criteria were evaluated: 1) original studies that performed measurements on humans; 2) articles written in English; 3) studies that included measurement of BMD or fracture risk and at least one of the adipokines or ghrelin levels in serum; 4) studies that included BMD measured using dual-energy X-ray absorptiometry.
Studies with the following criteria were excluded: 1) patients less than 18 years old; 2) patients with comorbidities; 3) obese patients; 4) patients treated with metabolism medications (calcium and vitamin D excluded); 5) patients with high physical activities (such as an athlete); 6) did not distinguish sex or menopausal status in BMD (or fracture risk)-adipokine (or ghrelin) correlation.
Two researchers independently checked the entire search, selection, and extraction processes. To resolve disagreements on matters related to the eligibility of studies or data extraction, a discussion was held between the two researchers or a counsel with a third researcher was included.
We filtered out conference abstracts, reviews, letters, and editorials from the list of studies. We then screened the remaining articles by confirming the title and abstract. After screening the articles, we examined the full text of the selected studies and categorized patients according to sex, menopausal status, assessed BMD site, and measured adipokines or ghrelin.
Finally, we extracted the following data from eligible studies: authors, year of publication, patients’ mean age, sex, menopausal status, osteoporotic status, fat mass, BMI, body weight, height, number of patients, method, site, score of BMD evaluation, method and serum level of each adipokines or ghrelin assessment, and correlation and multivariable regression of BMD with adipokines or ghrelin.
We assessed the risk of bias for the individual cohort studies using the Newcastle-Ottawa scale (18). We used the modified version of the Newcastle-Ottawa scale to assess cross-sectional studies (19). The authors (SL, JHK) independently performed the risk of bias assessment in the included studies and confirmed the quality of evidence. The assessment results are presented in Supplementary Tables S1, S2 .
We determined whether there was a potential publication bias in the studies using funnel plots. Furthermore, we estimated the asymmetry of funnel plots using Egger’s regression test when a group included more than three studies.
We assessed the certainty of evidence through the Grading of Recommendations, Assessment, Development, and Evaluations (GRADE) framework. This framework initiates with confirming the study design and then evaluating eight domains: risk of bias, indirectness, inconsistency, imprecision, publication bias, large effect, plausible confounding, and dose-response gradient. After assessing all the noted domains, the quality of evidence is classed as high, moderate, low, or very low (20).
A meta-analysis of the pooled correlations between adipokines or ghrelin and BMD was conducted using the inverse of variance method. Furthermore, a random effects model was used in this study. Fisher’s z-transformation converted the non-adjusted (simple) correlation coefficients to calculate the pooled correlation coefficients (pooled r), 95% confidence interval (CI), and P value. We quantified statistical heterogeneity among the included studies by calculating the Q and I2 statistics (21). The pooling correlation meta-analysis and quality assessment of studies were executed using the ‘meta’ (22) and ‘dmetar’ (23) packages in R.
We also conducted a meta-analysis by pooling the mean differences in hormone levels according to osteoporotic status using the RevMan 5.0.1.8 software (Nordic Cochrane Center, Copenhagen, Denmark). Results reported in median and interquartile quartile range were converted to estimate the mean and standard deviation according to previously described methods (24). Standardized mean differences (SMD) were calculated for continuous outcome data (method of the inverse of the variance). Publication bias was determined to assess asymmetry using funnel plots.
The search process for the primary studies is shown in the flowchart in Figure 1. In the updated search, 1,126 studies, excluding duplicates, were identified through a database search. A total of 1079 studies were excluded from the assessment based on their title and abstract. The full text of the remaining 57 studies was assessed, and 10 studies were excluded because they did not meet the inclusion criteria; thus, 47 studies were selected for the meta-analysis. Of the 59 studies included in the previous meta-analysis, 57 were included in our study, excluding two abstracts (13). Two abstracts were excluded because they overlapped with the published literature or were inaccessible. Finally, 104 studies were included in this study (14–17, 25–124). The pooled correlation analysis included 11,960 participants (4,790 men, 1,392 premenopausal women, and 5,778 postmenopausal women) across 48 studies. The mean age of participants was 56.6 years for men, 36.3 years for premenopausal women, and 62.8 years for postmenopausal women. The mean BMI was 25.85 kg/m2, 21.36 kg/m2, and 25.12 kg/m2 for men, premenopausal women, and postmenopausal women, respectively. The mean BMD in lumbar spine site was 1.12 g/cm2, 1.11 g/cm2, and 0.92 g/cm2 for men, premenopausal women, and postmenopausal women, respectively. The mean BMD in femoral neck site was 0.91 g/cm2, 1.02 g/cm2, and 0.77 g/cm2 for men, premenopausal women, and postmenopausal women, respectively. The mean BMD in total body was 1.04 g/cm2, 1.15 g/cm2, and 1.00 g/cm2 for men, premenopausal women, and postmenopausal women, respectively.
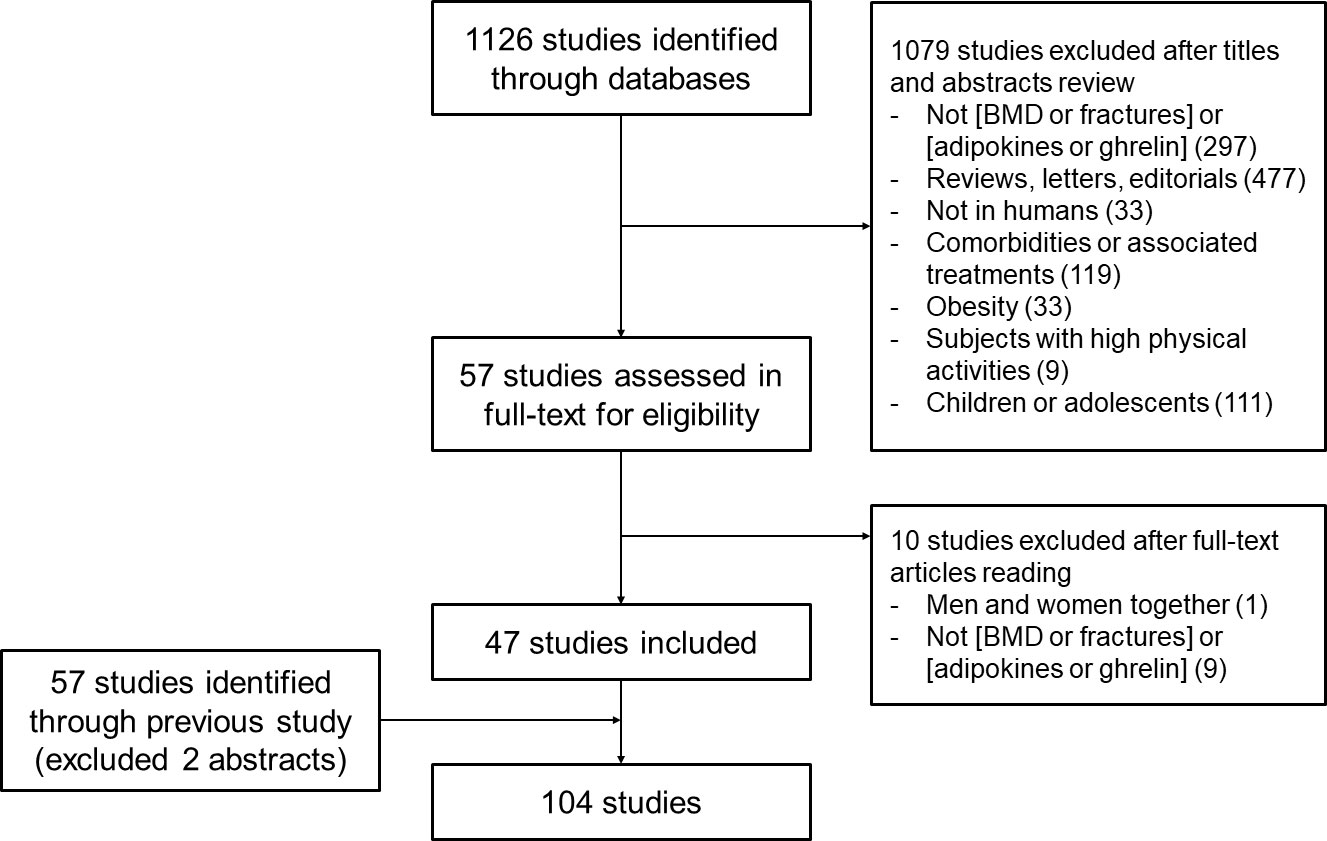
Figure 1 Flow chart depicting the search strategy employed to determine eligible studies.
We conducted a pooled correlation analysis on the selected studies according to sex, menopausal status, and BMD site (Table 1). The funnel plot for each adipokine, ghrelin, and BMD site is shown in Supplementary Figure S1. To verify the symmetry of each plot, we performed Egger’s test (Table 2). A publication bias was found in the correlation between total hip BMD and leptin levels in men; however, no publication bias was detected in other studies. The certainty of the evidence was determined by assessing the eight domains for the outcome of correlations of adipokine levels and BMD. Because all included studies are observational studies, GRADE defaults to low, and some are downgraded to very low due to the risk of bias and inconsistency (Supplementary Table S3).
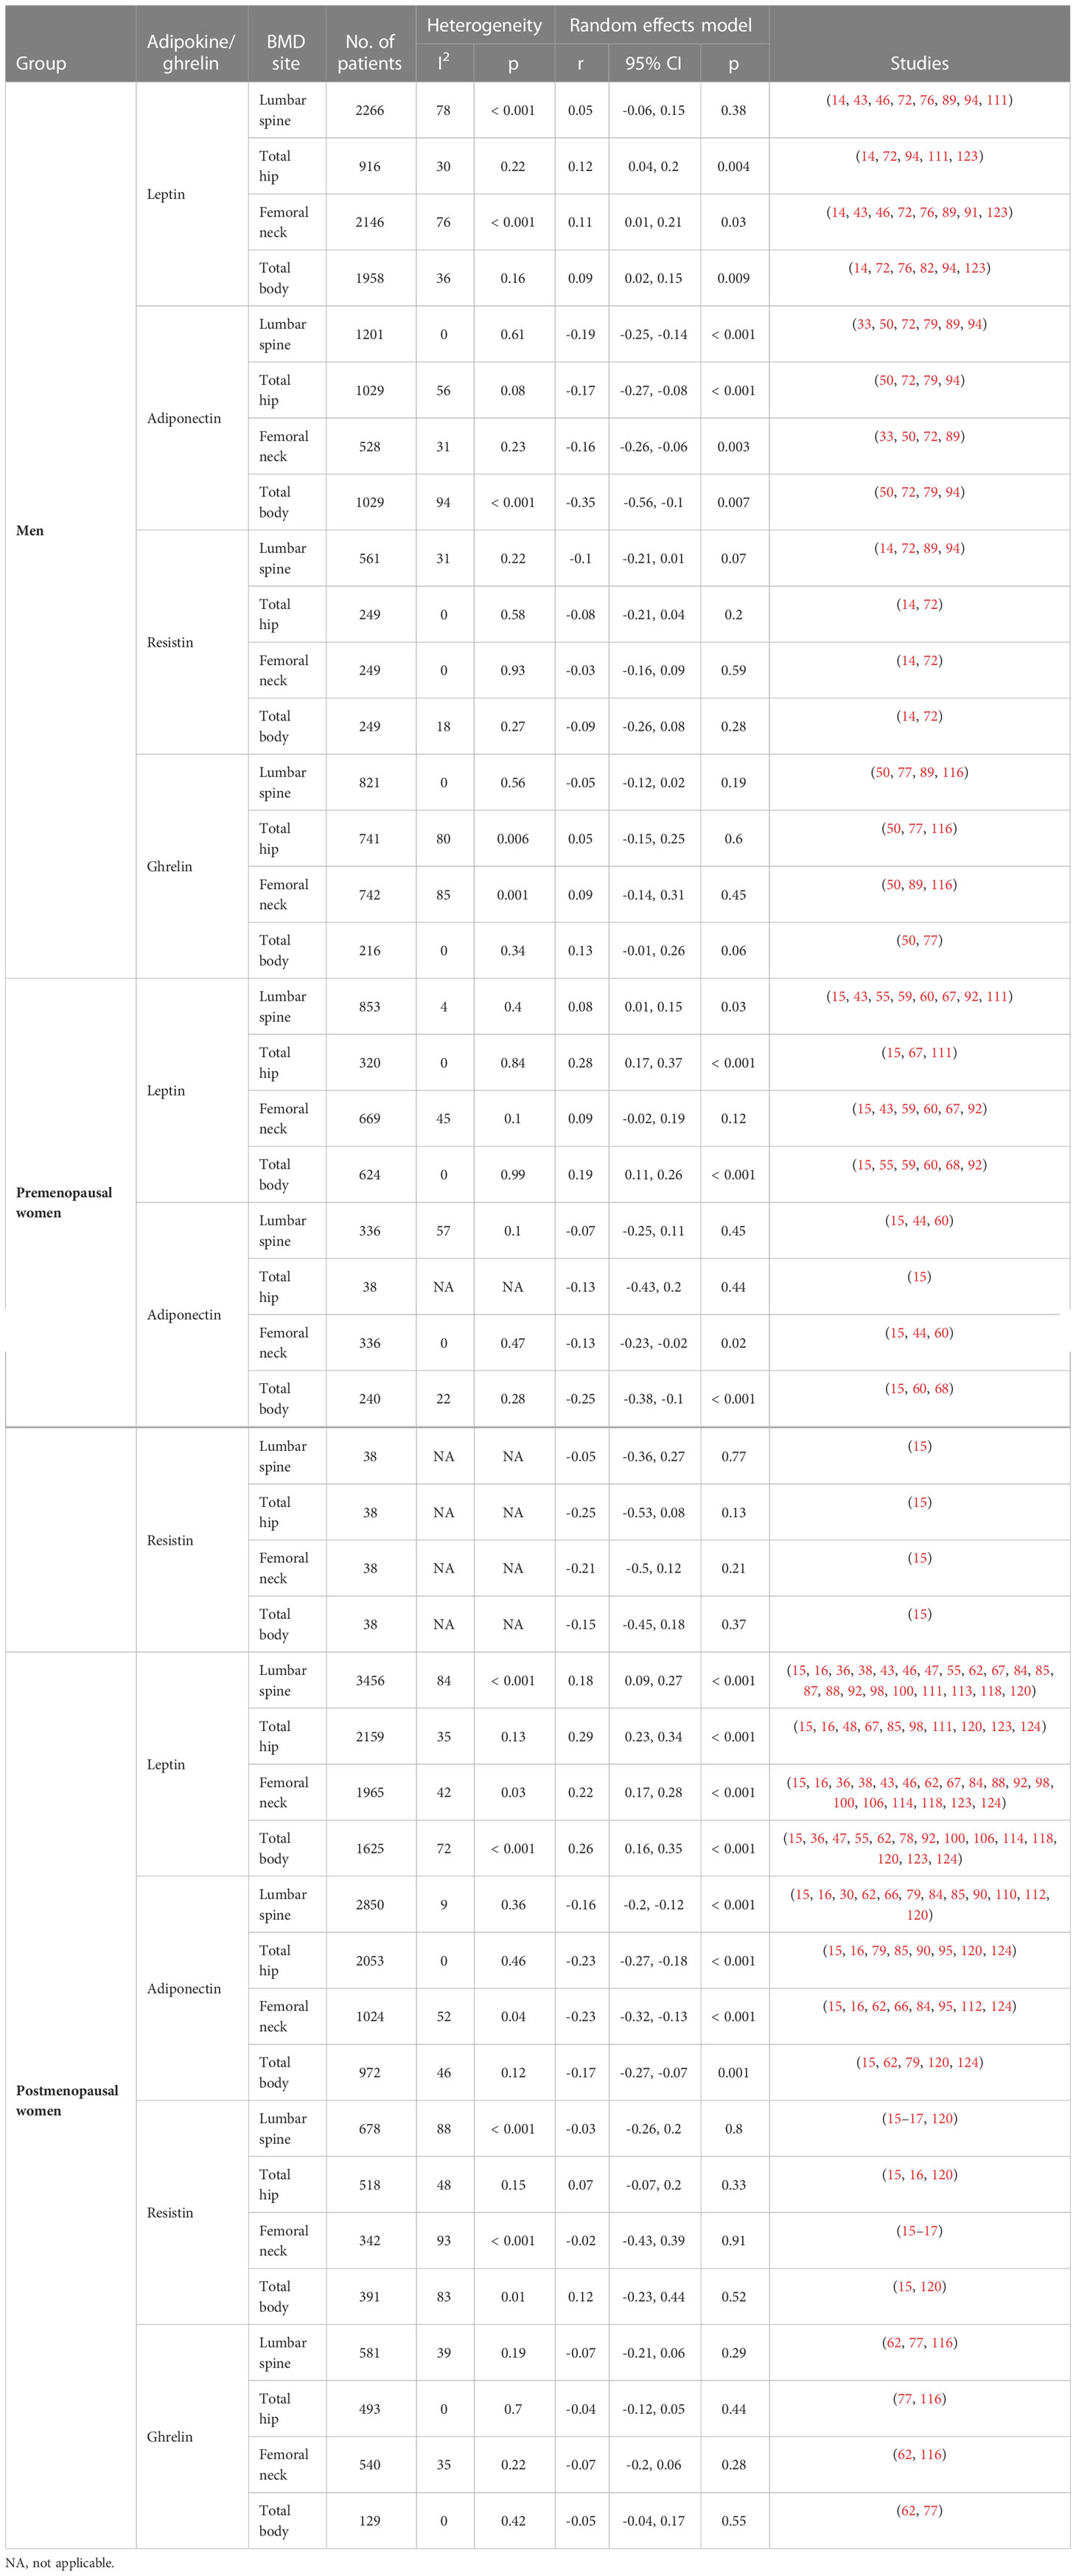
Table 1 Pooled correlations between adipokines or ghrelin level and BMD according to sex and menopausal status.
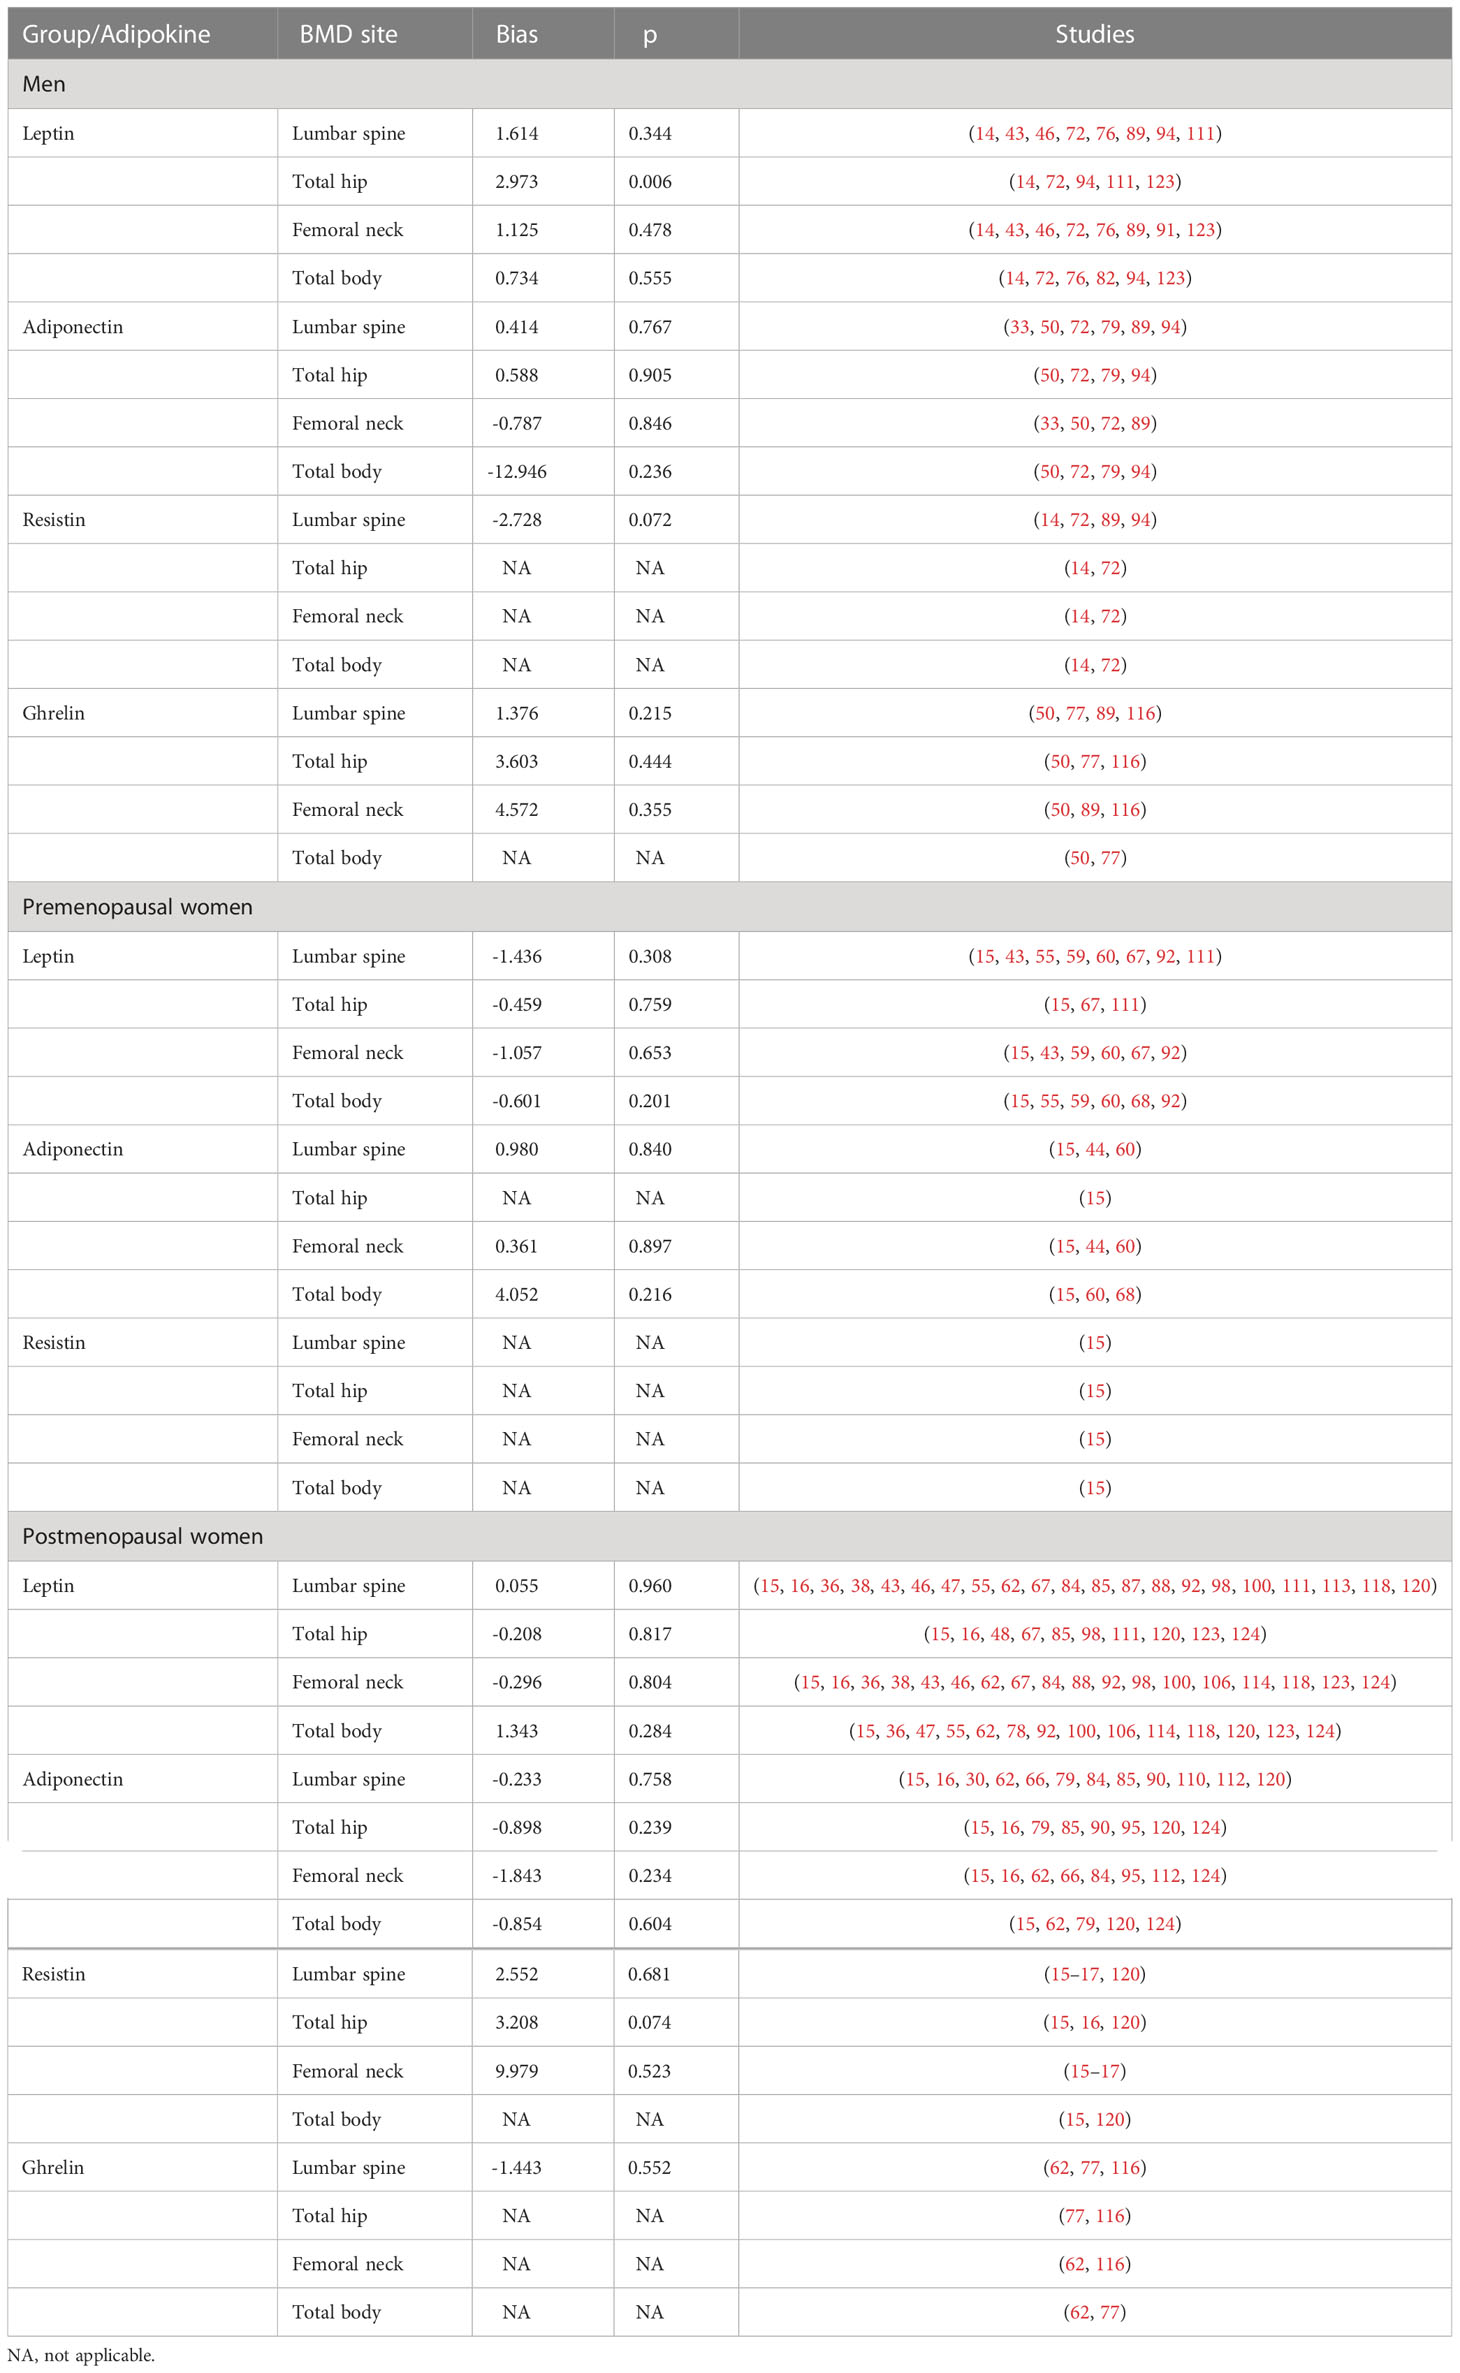
Table 2 Summarized results of the Egger’s test.
Over the past decade, many studies have been published on the correlation between adipokine levels and BMD. Several studies have also examined the correlation between leptin and BMD in postmenopausal women, as well as the impact of pre- and post- menopause on adiponectin. A decade ago, only few studies on resistin were conducted; however, since then several new studies for all groups have been performed. Although there are new findings for ghrelin, these could not be used for the meta-analysis because the correlation was not analyzed (Supplementary Figure S2).
In postmenopausal women, leptin level was positively correlated with BMD at the lumbar spine, total hip, femoral neck, and total body (r = 0.18 to 0.29). In addition, the correlation was more robust in postmenopausal women than in other cohorts. In premenopausal women, the correlation was significant at three the sites other than the femoral neck site (r = 0.08 to 0.28). Although the leptin level and BMD correlation at total hip, femoral neck, and total body sites was significant in men (r = 0.09 to 0.12), the correlation coefficients were slightly lower than those in the other two groups (14–16, 36, 38, 43, 46–48, 55, 59, 60, 62, 67, 68, 72, 76, 78, 82, 84, 85, 87–89, 91, 92, 94, 98, 100, 106, 111, 113, 114, 118, 120, 123, 124).
In men and postmenopausal women, adiponectin and BMD at all sites showed a significant inverse correlation (men: r = -0.16 to -0.35, postmenopausal women: r = -0.16 to -0.23). In premenopausal women, adiponectin and BMD correlation was only significant at the femoral neck (r = -0.13) and total body (r = -0.25) sites (15, 16, 30, 33, 44, 50, 60, 62, 66, 68, 72, 79, 84, 85, 89, 90, 94, 95, 110, 112, 120, 124).
Based on the above results, correlations between resistin (14–17, 72, 89, 94, 120) or ghrelin levels (50, 62, 77, 89, 116) and BMD were not statistically significant at any sites.
As the correlations between adipokines and BMD adjusted by body weight or BMI were reduced compared to non-adjusted correlations (125), we examined the data of both non-adjusted and adjusted correlations using body weight, BMI, or fat mass (Table 3). The correlations between leptin and BMD were generally weakened or became insignificant after adjustment for anthropometric measures, and these phenomena were distinct in postmenopausal women as well as men. However, even though the inverse correlation between adiponectin and BMD weakened even after adjustment, most studies still revealed that the correlation was significant. Although the correlations were weakened for resistin, they remained significant in postmenopausal women (lumbar spine and femoral neck) (120). Studies examining the correlation between visfatin and BMD showed a significant correlation with only total hip in men (r = 0.18) and lumbar spine in postmenopausal women (r = 0.113). However, after adjustment for anthropometric measures, all correlations of visfatin and BMD weakened (94, 112, 120).

Table 3 Non-adjusted and adjusted correlations between adipokines or ghrelin levels and BMD according to sex and menopausal status.
We further performed subgroup analysis by geographical populations. In men, pooled correlation coefficients (r) of leptin with BMD were higher in Europe (r = 0.12 to 0.27) populations than in other regions (r = -0.12 to 0.11). Correlations of adiponectin with BMD differed by region but did not appear consistently. Correlations of resistin and ghrelin with BMD were slightly stronger in Europe (resistin: r = -0.05 to -0.31; ghrelin: r = 0.04 to 0.25) than in other areas (resistin: r = -0.03 to -0.08; ghrelin: r = -0.08 to 0.12) (Supplementary Table S4). In premenopausal women, the correlation between entire groups did not appear tendency by region (Supplementary Table S5). In postmenopausal women, correlations of leptin with BMD were weaker in Asia (r = 0.07 to 0.25) than in other regions (r = 0.14 to 0.44). Correlations of adiponectin with BMD were similar in all areas. Interestingly, correlations of resistin with BMD were positive in Europe (r = 0.15 to 0.31) and were not in Asia (r = -0.02 to -0.40). Correlations of ghrelin with BMD were more robust in Europe (r = -0.10 to -0.22) than in other regions (r = -0.05 to 0.05) (Supplementary Table S6).
Regression analyses between BMD and adipokines or ghrelin levels were performed in 42 studies (Supplementary Tables S7, S8) (15–17, 26, 28, 29, 33, 35–37, 43, 45, 48, 59–62, 64, 66, 68, 70, 72, 76, 77, 79, 82, 89, 92, 94, 99, 107, 110, 112, 114–118, 120, 122–124).
Multiple regression analyses were performed to determine the variable, including adiponectin, which significantly correlated with the BMD value. A significant inverse correlation between BMD and adiponectin levels was found in 10 of the 16 studies (28, 60, 62, 64, 66, 68, 94, 117, 120, 124). One study that included men revealed that there was a inverse association between lumbar spine (β = -0.163), total hip (β = -0.148), and total body (β = -0.178) BMD and adiponectin levels (94). Three studies that included premenopausal women revealed a inverse association between lumbar spine (β = -0.283; -0.01), femoral neck (β = -0.01), and total body (β = -0.152; -0.01; -0.26) and adiponectin levels (60, 64, 68). Six studies that included postmenopausal women, revealed a inverse association between lumbar spine (β = -0.006; -0.103; B = -2.684), femoral neck (β = -0.27; -0.047; -0.445), total hip (β = -0.112; B = -2.247), total forearm (β = -0.125; B = -2.167), and total body (β = -0.105, -0.385, B = -2.54), and adiponectin level (28, 62, 66, 117, 120, 124). However, no such association was found in six studies (16, 33, 70, 72, 110, 112).
The results of studies examining the association between leptin and BMD are heterogeneous. In men, only one study revealed a positive association (total hip: β = 0.097) (99), and all other study results were not significant or demonstrated a inverse association (43, 45, 76, 82, 89, 94, 107, 123). For women, only two studies with premenopausal women (37, 59) and four studies with postmenopausal women (36, 62, 118, 123) revealed a positive association, whereas the others revealed no significance or a inverse association (16, 28, 35, 43, 48, 60, 70, 92, 99, 114, 117, 122, 124). By adjusting leptin levels by body composition-related variables, the association between leptin and BMD was either weakened, disappeared, or even inverted.
Three studies investigated the association between resistin and BMD (15, 17, 28), and only one found an association (total body BMD of postmenopausal women: β = 0.31) (15). Of the three studies (26, 62, 77) that examined the association between ghrelin and BMD, only one found an association (total hip BMD of young women: β = -0.31) (62).
Collectively, the impact of plasma adipokines or ghrelin levels on BMD would be weak and might be confounded by other body composition parameters.
The potential of adipokines or ghrelin to predict BMD changes was assessed in five cohort studies (29, 32, 45, 49, 63).
Araneta et al. reported that adiponectin was not associated with bone loss in men and postmenopausal women (29). According to Barbour et al., adiponectin was associated with hip BMD changes in the highest tertile women (Mean annualized % change = -0.67%) compared to in the lowest tertile (Mean annualized % change = -0.43%) after adjusting for age, race, BMI, diabetes, baseline hip aBMD, and weight change. Leptin was not associated with BMD changes in either men or women (32). Crabbe et al. investigated the correlation between leptin and total hip and forearm BMD changes in older men; however, their results were not statistically significant (45). Fuggle et al. investigated the association between lumbar spine and femoral neck BMD changes with leptin and adiponectin, but they found no association (49). Jürimäe et al. investigated the association between BMD changes and adipokine levels in postmenopausal women, and found a positive association between total body (β = 0.001) and femoral neck (β = 0.001) BMD reduction and leptin, and an inverse association between lumbar spine BMD reduction (β = -0.002) and adiponectin (63).
Based on these results, plasma adipokines or ghrelin levels had a weak or no association with the prediction of BMD changes.
A total of 12 studies on the level of adipokines or ghrelin according to the diagnosis of osteoporosis were included (Table 4) (16, 38, 41, 50, 66, 69, 84, 87, 95, 108, 109, 119). The meta-analysis results for leptin levels in postmenopausal women are shown in Figure 2A. Nine studies for leptin involving 757 participants, revealed a high heterogeneity (P < 0.001, I2 = 94%). In postmenopausal women, leptin levels were significantly lower in the osteoporosis group than in the normal BMD group (SMD = -0.88, 95% CI = -1.55, -0.21, P = 0.01). There were two studies on leptin levels according to the presence or absence of osteoporosis in men; however, there was no significant difference between the two groups (SMD = -0.10, 95% CI = -0.39, 0.20, P = 0.52; I2 = 0%, P = 0.72). The five studies on adiponectin involved 527 postmenopausal participants, and revealed a significantly higher adiponectin level in osteoporotic women with high heterogeneity (SMD = 0.94, 95% CI = 0.17, 1.71, P = 0.02; I2 = 95%, P < 0.001) (Figure 2B). As shown in Figure 2C, three studies on resistin involved 314 postmenopausal women. No significant difference in resistin levels was observed between the osteoporotic and control groups in postmenopausal women (SMD = -0.30, 95% CI = -1.06, 0.45, P = 0.43; I2 = 90%, P < 0.001). All adipokine levels in premenopausal women and adiponectin or resistin levels in men were insufficient for meta-analysis. For other adipokines or ghrelin, insufficient data were available for a meta-analysis.
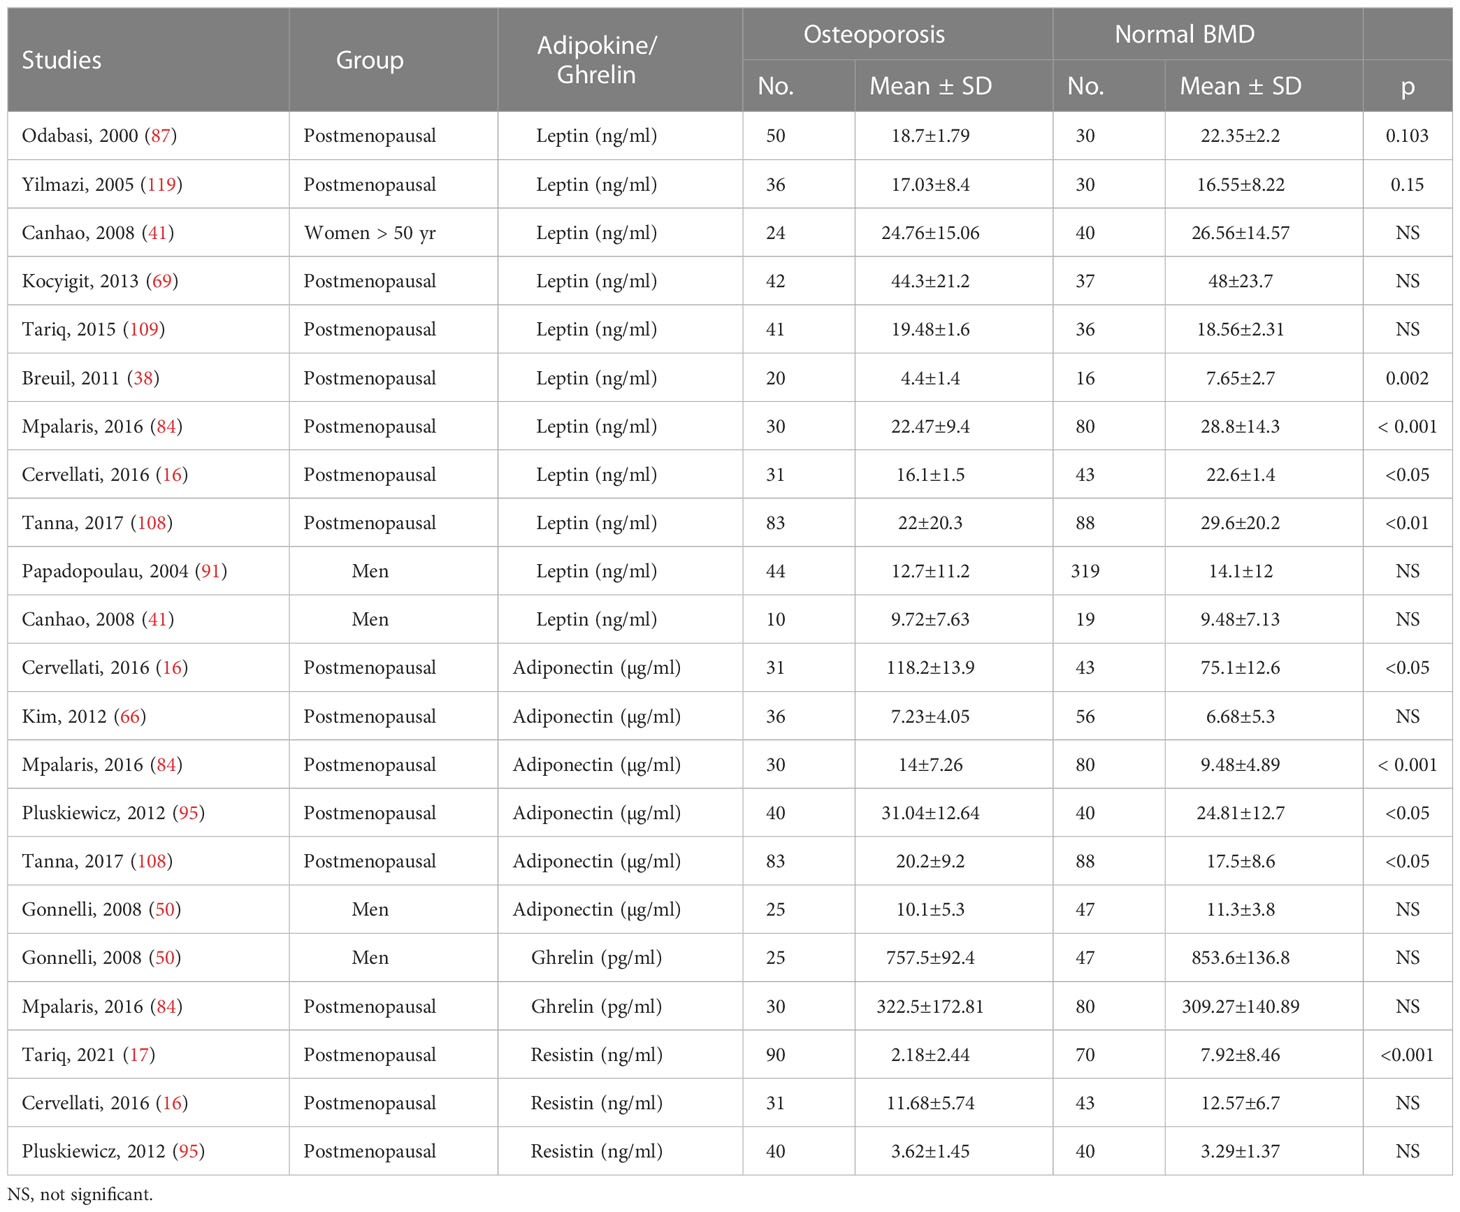
Table 4 Differences in adipokines or ghrelin levels according to osteoporosis status.
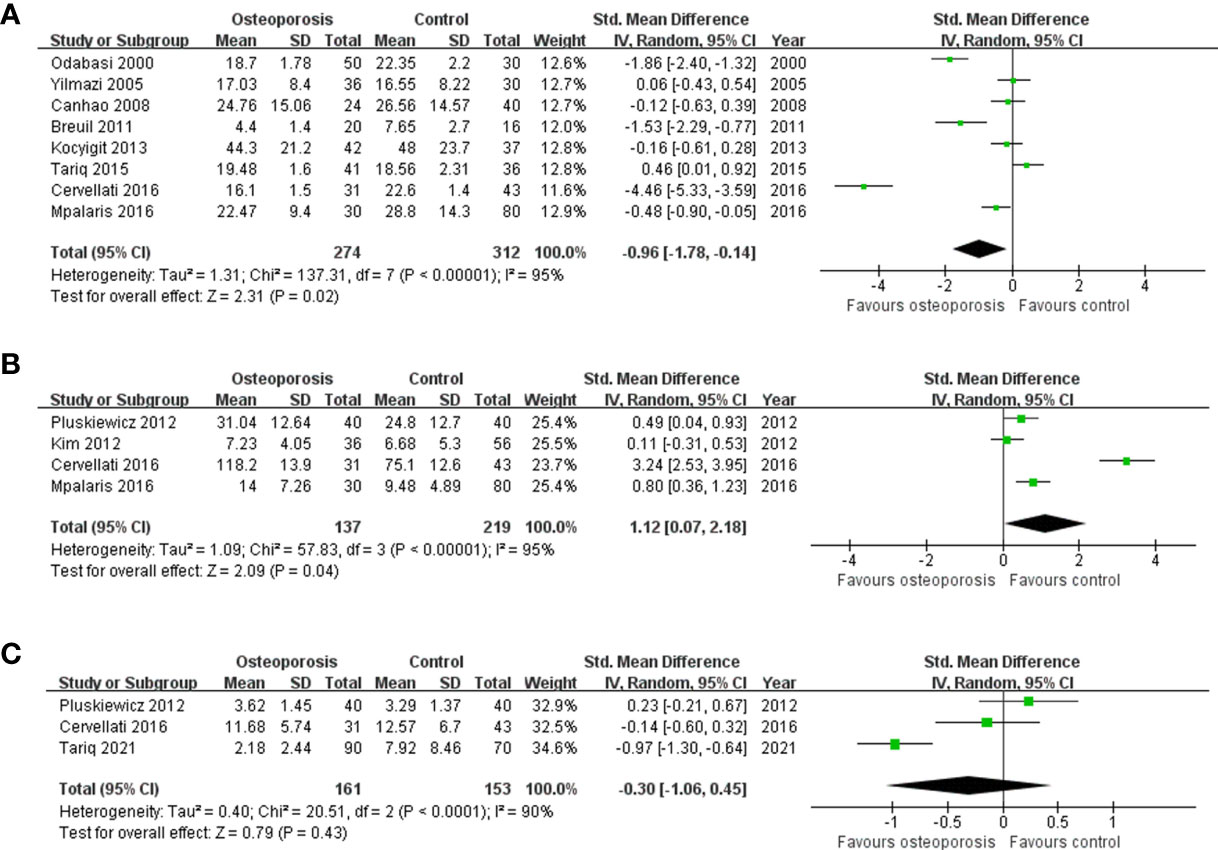
Figure 2 Forest plot depicting the differences in adipokine levels according to osteoporosis status in postmenopausal women (A) Leptin, (B) adiponectin, and (C) resistin.
Three studies reported an association between adipokines or ghrelin levels and the prevalence of vertebral fractures. Prevalent vertebral fracture was observed in 15–35% of participants (85, 108, 118). Two studies demonstrated an inconsistent association between leptin or adiponectin levels and prevalence of vertebral fracture, and one of the two studies was included in a previous meta-analysis. No data were available for other adipokines or ghrelin. Leptin level was positively correlated with the percentage of fat mass. Furthermore, only leptin levels predicted the presence of vertebral fractures in the logistic regression model (odds ratio [OR] = 0.642, 95% CI = 0.429, 0.960; p = 0.031) (118). By contrast, serum leptin level was not associated with fracture risk (OR = 1.006, 95% CI = 0.989, 1.023; p = 0.495) adjusted for age, years since menopause, fat-related parameters, and lifestyle variables (108). The pooled OR for leptin was 0.84 (95% CI = 0.55, 1.30; p = 0.43) (108, 118). Serum adiponectin level was associated with the above-adjusted fracture risk but was not statistically significant (OR = 1.034, 95% CI = 0.998, 1.071; p = 0.06) (108).
A total of six prospective cohort studies reported the association between adipokines and incident fractures (29, 31, 58, 79, 85, 102), and three new articles were included. Three studies reported a relationship between leptin and fracture outcomes (31, 85, 102). Two studies showed inconsistent fracture risk in postmenopausal women; one study with men found no association with fracture risk according to serum leptin levels (31, 85). In a cohort study with an average follow up of 6.5 years, higher leptin levels resulted in lower fracture rates based on an unadjusted model in postmenopausal women (high tertile hazard ratio [HR] = 0.68, middle tertile HR = 0.74; p = 0.009); however, in the adjusted model for age, race, and BMI, the association of leptin levels and fracture rates was attenuated (high tertile HR = 0.98, middle tertile HR = 0.86; p = 0.794) (31). Nakamura et al. showed that lower serum leptin levels were a significant risk factor for incident long-bone fractures (HR = 0.70; 95% CI = 0.50, 0.96) adjusted for age, body weight, hip BMD, prevalent fracture, osteoporosis treatment, serum albumin, calcium, and adiponectin (85). In a study that analyzed men and women together, the high tertile group with serum leptin levels showed lower fracture risk than the low tertile groups after adjusting for factors (age, sex, menopausal status, body weight, social status, smoking, alcohol consumption, physical activity, diabetes, and creatinine) (102). The HR was 0.25 (95% CI = 0.09, 0.74; p = 0.01 for trend).
For adiponectin, five studies reported a relationship between adiponectin and fracture outcomes (29, 31, 58, 79, 85). Three of the four studies found an association with fracture risk in men (29, 31, 58, 79), and two studies showed inconsistent fracture risk in postmenopausal women according to serum adiponectin levels (31, 85). Michaelsson et al. found that despite the inverse association between adiponectin and BMD, adiponectin did not increase fracture risk in men (adjusted HR = 0.97, 95% CI = 0.86, 1.10; p > 0.05) (79). A community-based longitudinal study followed up fracture data from 277 of 284 men with serial measures, where 21 (7.6%) had at least one vertebral fracture (29). Adiponectin was independently associated with vertebral fractures only in men. The adjusted OR was 1.13 (95% CI: 1.08, 1.23; p = 0.009). Fracture data from 251 of the 261 women with serial measures, revealed that 48 (19.1%) women had a vertebral fracture but no association with adiponectin. Based on a 7.4-years (average, 5.2 years) follow up with the MrOS Sweden cohort of 999 men (58), 150 men (15%) had fractures, with spine fracture being the most common. Adiponectin was associated with a significantly higher incidence of fracture in participants (HR/SD = 1.46; 95% CI = 1.23, 1.72), which was maintained after multivariate adjustment variables for age, time, total hip BMD, general health, and previous fracture (HR = 1.30; 95% CI = 1.09, 1.55). Barbour et al. (31) reported that the fracture rates per 1000 person-years were 27.5 and 14.0 for women and men, respectively, based on a mean follow up of 6.5 years. Adiponectin was significantly associated with fracture risk in men with the highest adiponectin level quartile compared to the lowest quartile (HR = 1.94; 95% CI = 1.20, 3.16) adjusted for age, race, BMI, education, weight change, and total hip BMD. However, no association was found between adiponectin levels and fracture risk in women (HR = 0.98; 95% CI = 0.67, 1.43). Nakamura et al. reported that higher serum adiponectin levels were a significant independent risk factor for incident vertebral fractures in postmenopausal women. The HR of serum adiponectin was 1.18 (95% CI 1.02–1.37, after adjusting for age, body weight, lumbar BMD, prevalent fracture, osteoporosis treatment, serum albumin, calcium, and leptin) (85).
We performed an updated meta-analysis on the effects of serum adipokines or ghrelin levels on BMD and fracture risk in healthy adults. Our meta-analysis revealed that postmenopausal women with osteoporosis had significantly lower serum leptin concentrations and higher serum adiponectin concentrations than those in postmenopausal women with normal BMD. Accordingly, the osteoporotic status can be predicted using serum concentrations of leptin and adiponectin in postmenopausal women. In a previous meta-analysis, serum adiponectin levels were not significantly associated with femoral neck BMD in postmenopausal women; however, in this study, BMD values from the lumbar spine, total hip, femoral neck, and total body in postmenopausal women showed a positive correlation with leptin level and a inverse correlation with adiponectin level, which was statistically significant. The correlations between serum leptin or adiponectin concentrations and BMD values from various sites in men and premenopausal women were almost similar to those of the previous meta-analysis, which demonstrated that femoral neck BMD in men and leptin or adiponectin showed significant correlations, and total body BMD in premenopausal women was significantly correlated with adiponectin level. After adjusting for anthropometric measures, the adiponectin concentrations showed a significant correlation with the BMD value; however, leptin concentrations were not significantly correlated most studies. Although serum resistin concentration did not significantly correlate with the BMD values in the pooled analysis, two studies demonstrated a significant inverse correlation with the lumbar spine BMD values in both postmenopausal women and men, even after adjusting for anthropometric measures (17, 89). Although leptin levels and prevalent vertebral fractures in one study were previously reported to be significant (118), the OR value in the pooled analysis with another study was not significant (108, 118).
Among the 39 pooled analyses listed in Table 1, 13 studies showed high heterogeneity. We attempted to reduce this heterogeneity by reducing the influence of confounders to more accurately determine the effect of adipokines on bone. To rule out the effects of comorbidities or treatments, we only included studies in which healthy participants were enrolled. To diminish this confounding effect, a pooled analysis based on adjusting for anthropometric measures is required. However, due to the lack of individual data, the results could only be compared within each enrolled study; these results are presented in Table 3.
Publication bias, which could have had a most severe impact on the meta-analysis results, was analyzed using the asymmetry of funnel plots and Egger’s test. Fortunately, only one publication bias was found when the relationship between total hip BMD and leptin in men was pooled and analyzed. A significant correlation was found between serum leptin and total hip BMD values, analyzed by using pooled correlation. Therefore, the publication bias could be corrected through additional research.
The bone–fat interaction is quite complex, and the precise mechanism has not been elucidated (126). Osteoblasts and adipocytes that make up bone and fat, respectively, originate from the same progenitor called MSCs (7). Therefore, the relationship between bone marrow fat and bone density is inversely proportional to each other (42, 48). The ratio of bone marrow fat increases during menopause, aging, and chronic renal failure, indicating a decrease in bone density and an increase in fracture risk (127). Therefore, it is necessary to study the interaction of ghrelin, which is related to hunger or appetite, or various adipokines mainly produced in adipocytes with osteocytes, osteoblasts, and osteoclasts.
Osteoporosis is a disease in which bone quality deteriorates, and the quantity decreases, which increases the risk of fractures (5). The incidence of osteoporosis is rapidly increasing with the increase in life expectancy. Failure to prevent subsequent fractures in osteoporosis patients leads to an exponential increase in morbidity and mortality (127). Furthermore, osteoporosis has recently emerged as a serious public health concern (128). To prevent, diagnose, treat, and manage osteoporosis, biomarkers are needed. Vitamin D, osteocalcin, and procollagen type 1 N-terminal propeptide are known representative biomarkers (104). Various studies are being conducted to identify additional biomarkers or therapeutic targets, including adipokines and ghrelin (129, 130).
Resistin, a novel adipokine, is expected to serve as a biomarker for osteoporosis diagnosis or a therapeutic target (17, 30, 130). Therefore, many resistin-related studies were included in our meta-analysis. Many studies have been conducted on the effects of adipokines, especially resistin, on bone health over the past 10 years; however, no correlation was found, or insufficient data were available for meta-analysis. Nevertheless, as mentioned above, serum resistin level may have an inverse relationship with the lumbar BMD value in healthy adult men; this notion should be verified in future studies.
Studies on the correlation between visfatin level and BMD have been conducted as studies have shown that visfatin is involved in bone homeostasis and inflammation and regulates glucose metabolism associated with bone metabolism (129). However, the number of studies still needs to be increased, and there is no consistency between studies.
Our study has some limitations. Although age is a confounding factor for our analysis, we could not separate groups by detailed age due to the lack of studies. In the case of women, many studies considered menopause, so it was possible to analyze to some extent according to age roughly by dividing the group into pre and postmenopause. However, in the case of men, only some studies are separated by age. Especially, data on young men were insufficient. Although there were no significant differences in measured adipokine concentrations by adipokine source and assay approaches, their influence could not be completely ruled out. Despite these limitations, this study has several advantages. Our analysis included more studies for leptin, adiponectin, and resistin than the previous analysis. Especially, correlation studies for resistin and BMD in pre and postmenopausal women were newly added current meta-analysis. Moreover, we added data synthesis for adipokine levels in patients according to osteoporotic status. Furthermore, we confirmed publication bias in the entire group and assessed the quality of original studies. Therefore, our analysis reinforced the data quality and reliability of than previous analysis.
In conclusion, our results suggest that leptin is correlated with BMD, and adiponectin is inversely correlated with BMD. In addition, osteoporotic patients had lower leptin levels and higher adiponectin levels than the normal control. Osteoporosis patients are increasing worldwide (128). Using the serum adipokine level as an indicator, a bone density test at an appropriate time can help diagnose osteoporosis. Furthermore, an appropriate diagnosis can help improve the prognosis of many osteoporosis patients by starting treatment at the right time (131).
The original contributions presented in the study are included in the article/Supplementary Material. Further inquiries can be directed to the corresponding authors.
SL, JeK, TG, and YK contributed to the conception and design of the study. SL and JeK conducted search, selection, and data extraction processes. YJ, JL, TG, and YK discussed the eligibility of the studies. S-KH, JaK, and KK performed the data extraction and statistical analysis. SL and JeK wrote the first draft of the manuscript. YJ, JL, KK, S-KH, JaK, TG, and YK wrote sections of the manuscript. All authors contributed to the article and approved the submitted version.
The authors disclosed receipt of the following financial support for the research, authorship, and/or publication of this article: This research was supported by the Basic Science Research Program through the National Research Foundation of Korea (NRF), funded by the Ministry of Education [NRF-2021R1F1A1064056, NRF-2018R1A5A2023879, RS-2023-00207946]; the Korean Health Technology R&D project [HI18C2383] through the Korea Health Industry Development Institute (KHIDI), funded by the Ministry of Health & Welfare, Republic of Korea.
The authors declare that the research was conducted in the absence of any commercial or financial relationships that could be construed as a potential conflict of interest.
All claims expressed in this article are solely those of the authors and do not necessarily represent those of their affiliated organizations, or those of the publisher, the editors and the reviewers. Any product that may be evaluated in this article, or claim that may be made by its manufacturer, is not guaranteed or endorsed by the publisher.
The Supplementary Material for this article can be found online at: https://www.frontiersin.org/articles/10.3389/fendo.2023.1044039/full#supplementary-material
1. Albala C, Yanez M, Devoto E, Sostin C, Zeballos L, Santos JL. Obesity as a protective factor for postmenopausal osteoporosis. Int J Obes Relat Metab Disord (1996) 20(11):1027–32.
2. Greco EA, Fornari R, Rossi F, Santiemma V, Prossomariti G, Annoscia C, et al. Is obesity protective for osteoporosis? evaluation of bone mineral density in individuals with high body mass index. Int J Clin Pract (2010) 64(6):817–20. doi: 10.1111/j.1742-1241.2009.02301.x
3. Kuo DP, Chiu YW, Chen PT, Tsai YJ, Hou CH, Chen YL, et al. Associations between body composition and vertebral fracture risk in postmenopausal women. Osteoporos Int (2022) 33:589–98. doi: 10.1007/s00198-021-06178-w
4. Topaloglu US, Erol K. Bone mineral density and fracture risk in prediabetes: a controlled cross-sectional study. Acta Reumatol Port (2021) 46(1):32–9.
5. Goh TS, Kim E, Jeon YK, Hwangbo L, Kim IJ, Pak K, et al. Spine-hip discordance and frax assessment fracture risk in postmenopausal women with osteopenia from concordant diagnosis between lumbar spine and femoral neck. J Clin Densitom (2021) 24(4):548–56. doi: 10.1016/j.jocd.2021.03.008
6. Premaor MO, Pilbrow L, Tonkin C, Parker RA, Compston J. Obesity and fractures in postmenopausal women. J Bone Miner Res (2010) 25(2):292–7. doi: 10.1359/jbmr.091004
7. Ko DS, Kim YH, Goh TS, Lee JS. Altered physiology of mesenchymal stem cells in the pathogenesis of adolescent idiopathic scoliosis. World J Clin cases (2020) 8(11):2102–10. doi: 10.12998/wjcc.v8.i11.2102
8. Li J, Lu L, Liu Y, Yu X. Bone marrow adiposity during pathologic bone loss: molecular mechanisms underlying the cellular events. J Mol Med (Berl) (2022) 100:167–83. doi: 10.1007/s00109-021-02164-1
9. Aguirre L, Napoli N, Waters D, Qualls C, Villareal DT, Armamento-Villareal R. Increasing adiposity is associated with higher adipokine levels and lower bone mineral density in obese older adults. J Clin Endocrinol Metab (2014) 99(9):3290–7. doi: 10.1210/jc.2013-3200
10. Glorie L, D'Haese PC, Verhulst A. Boning up on Dpp4, Dpp4 substrates, and Dpp4-adipokine interactions: logical reasoning and known facts about bone related effects of Dpp4 inhibitors. Bone (2016) 92:37–49. doi: 10.1016/j.bone.2016.08.009
11. Delhanty PJ, van der Eerden BC, van Leeuwen JP. Ghrelin and bone. Biofactors (2014) 40(1):41–8. doi: 10.1002/biof.1120
12. Lv Y, Liang T, Wang G, Li Z. Ghrelin, a gastrointestinal hormone, regulates energy balance and lipid metabolism. Biosci Rep (2018) 38(5):BSR20181061. doi: 10.1042/BSR20181061
13. Biver E, Salliot C, Combescure C, Gossec L, Hardouin P, Legroux-Gerot I, et al. Influence of adipokines and ghrelin on bone mineral density and fracture risk: a systematic review and meta-analysis. J Clin Endocrinol Metab (2011) 96(9):2703–13. doi: 10.1210/jc.2011-0047
14. Bilha SC, Branisteanu D, Buzduga C, Constantinescu D, Cianga P, Anisie E, et al. Body composition and circulating estradiol are the main bone density predictors in healthy young and middle-aged men. J Endocrinol Invest (2018) 41(8):995–1003. doi: 10.1007/s40618-018-0826-z
15. Bilha SC, Branisteanu D, Buzduga C, Constantinescu D, Cianga P, Anisie E, et al. Modifications in the spectrum of bone mass predictive factors with menopausal status. Endocr Res (2018) 43(3):176–85. doi: 10.1080/07435800.2018.1448991
16. Cervellati C, Bonaccorsi G, Bergamini CM, Fila E, Greco P, Valacchi G, et al. Association between circulatory levels of adipokines and bone mineral density in postmenopausal women. Menopause (2016) 23(9):984–92. doi: 10.1097/GME.0000000000000655
17. Tariq S, Tariq S, Khaliq S, Lone KP. Serum resistin levels as predictor of low bone mineral density in postmenopausal women. Health Care Women Int (2021) 42(1):82–91. doi: 10.1080/07399332.2020.1798965
18. Wells GA, Shea B, O’Connell D, Peterson J, Welch V, Losos M, et al. The Newcastle-Ottawa scale (Nos) for assessing the quality of nonrandomised studies in meta-analyses. Oxford (2000).
19. Herzog R, Alvarez-Pasquin MJ, Diaz C, Del Barrio JL, Estrada JM, Gil A. Are healthcare workers' intentions to vaccinate related to their knowledge, beliefs and attitudes? a systematic review. BMC Public Health (2013) 13:154. doi: 10.1186/1471-2458-13-154
20. Mustafa RA, Santesso N, Brozek J, Akl EA, Walter SD, Norman G, et al. The grade approach is reproducible in assessing the quality of evidence of quantitative evidence syntheses. J Clin Epidemiol (2013) 66(7):736–42. doi: 10.1016/j.jclinepi.2013.02.004
21. Higgins JP, Thompson SG. Quantifying heterogeneity in a meta-analysis. Stat Med (2002) 21(11):1539–58. doi: 10.1002/sim.1186
22. Balduzzi S, Rucker G, Schwarzer G. How to perform a meta-analysis with r: a practical tutorial. Evid Based Ment Health (2019) 22(4):153–60. doi: 10.1136/ebmental-2019-300117
23. Harrer M, Cuijpers P, Furukawa TA, Ebert DD. (2021). Doing Meta-Analysis with R: A Hands-On Guide. (Boca Raton, FL and London: Chapmann & Hall/CRC Press).
24. Wan X, Wang W, Liu J, Tong T. Estimating the sample mean and standard deviation from the sample size, median, range and/or interquartile range. BMC Med Res Methodol (2014) 14:135. doi: 10.1186/1471-2288-14-135
25. Agbaht K, Gurlek A, Karakaya J, Bayraktar M. Circulating adiponectin represents a biomarker of the association between adiposity and bone mineral density. Endocrine (2009) 35(3):371–9. doi: 10.1007/s12020-009-9158-2
26. Amini P, Cahill F, Wadden D, Ji Y, Pedram P, Vidyasankar S, et al. Beneficial association of serum ghrelin and peptide yy with bone mineral density in the Newfoundland population. BMC Endocr Disord (2013) 13:35. doi: 10.1186/1472-6823-13-35
27. Anastasilakis AD, Polyzos SA, Delaroudis S, Bisbinas I, Sakellariou GT, Gkiomisi A, et al. The role of cytokines and adipocytokines in zoledronate-induced acute phase reaction in postmenopausal women with low bone mass. Clin Endocrinol (Oxf) (2012) 77(6):816–22. doi: 10.1111/j.1365-2265.2012.04459.x
28. Ansari MGA, Hussain SD, Wani KA, Yakout SM, Al-Disi D, Alokail MS, et al. Influence of bone mineral density in circulating adipokines among postmenopausal Arab women. Saudi J Biol Sci (2020) 27(1):374–9. doi: 10.1016/j.sjbs.2019.10.007
29. Araneta MR, von Muhlen D, Barrett-Connor E. Sex differences in the association between adiponectin and bmd, bone loss, and fractures: the rancho Bernardo study. J Bone Miner Res (2009) 24(12):2016–22. doi: 10.1359/jbmr.090519
30. Azizieh FY, Shehab D, Al Jarallah K, Mojiminiyi O, Gupta R, Raghupathy R. Circulatory pattern of cytokines, adipokines and bone markers in postmenopausal women with low bmd. J Inflammation Res (2019) 12:99–108. doi: 10.2147/JIR.S203590
31. Barbour KE, Zmuda JM, Boudreau R, Strotmeyer ES, Horwitz MJ, Evans RW, et al. Adipokines and the risk of fracture in older adults. J Bone Miner Res (2011) 26(7):1568–76. doi: 10.1002/jbmr.361
32. Barbour KE, Zmuda JM, Boudreau R, Strotmeyer ES, Horwitz MJ, Evans RW, et al. The effects of adiponectin and leptin on changes in bone mineral density. Osteoporos Int (2012) 23(6):1699–710. doi: 10.1007/s00198-011-1768-x
33. Basurto L, Galvan R, Cordova N, Saucedo R, Vargas C, Campos S, et al. Adiponectin is associated with low bone mineral density in elderly men. Eur J Endocrinol (2009) 160(2):289–93. doi: 10.1530/EJE-08-0569
34. Bi X, Loo YT, Henry CJ. Relationships between adiponectin and bone: sex difference. Nutrition (2020) 70:110489. doi: 10.1016/j.nut.2019.04.004
35. Bilha SC, Bilha A, Ungureanu MC, Matei A, Florescu A, Preda C, et al. Fgf23 beyond the kidney: a new bone mass regulator in the general population. Horm Metab Res (2020) 52(5):298–304. doi: 10.1055/a-1151-2342
36. Blain H, Vuillemin A, Guillemin F, Durant R, Hanesse B, de Talance N, et al. Serum leptin level is a predictor of bone mineral density in postmenopausal women. J Clin Endocrinol Metab (2002) 87(3):1030–5. doi: 10.1210/jcem.87.3.8313
37. Blum M, Harris SS, Must A, Naumova EN, Phillips SM, Rand WM, et al. Leptin, body composition and bone mineral density in premenopausal women. Calcif Tissue Int (2003) 73(1):27–32. doi: 10.1007/s00223-002-1019-4
38. Breuil V, Amri EZ, Panaia-Ferrari P, Testa J, Elabd C, Albert-Sabonnadiere C, et al. Oxytocin and bone remodelling: relationships with neuropituitary hormones, bone status and body composition. Joint Bone Spine (2011) 78(6):611–5. doi: 10.1016/j.jbspin.2011.02.002
39. Breuil V, Fontas E, Chapurlat R, Panaia-Ferrari P, Yahia HB, Faure S, et al. Oxytocin and bone status in men: analysis of the Minos cohort. Osteoporos Int (2015) 26(12):2877–82. doi: 10.1007/s00198-015-3201-3
40. Breuil V, Panaia-Ferrari P, Fontas E, Roux C, Kolta S, Eastell R, et al. Oxytocin, a new determinant of bone mineral density in post-menopausal women: analysis of the opus cohort. J Clin Endocrinol Metab (2014) 99(4):E634–41. doi: 10.1210/jc.2013-4126
41. Canhao H, Fonseca JE, Caetano-Lopes J, Saldanha C, Queiroz MV. Assessment of laboratory measurements and -308 tnfalpha gene promoter polymorphisms in normal bone mineral density. Clin Rheumatol (2008) 27(3):301–7. doi: 10.1007/s10067-007-0706-y
42. Chan GMF, Riandini T, Ng SHX, Goh SY, Tan CS, Tai ES, et al. Role of fat and bone biomarkers in the relationship between ethnicity and bone mineral density in older men. Calcif Tissue Int (2018) 102(1):64–72. doi: 10.1007/s00223-017-0342-8
43. Chanprasertyothin S, Piaseu N, Chailurkit L, Rajatanavin R, Ongphiphadhanakul B. Association of circulating leptin with bone mineral density in males and females. J Med Assoc Thai (2005) 88(5):655–9.
44. Chanprasertyothin S, Saetung S, Payattikul P, Rajatanavin R, Ongphiphadhanakul B. Relationship of body composition and circulatory adiponectin to bone mineral density in young premenopausal women. J Med Assoc Thai (2006) 89(10):1579–83.
45. Crabbe P, Goemaere S, Zmierczak H, Van Pottelbergh I, De Bacquer D, Kaufman JM. Are serum leptin and the Gln223arg polymorphism of the leptin receptor determinants of bone homeostasis in elderly men? Eur J Endocrinol (2006) 154(5):707–14. doi: 10.1530/eje.1.02130
46. Dennison EM, Syddall HE, Fall CH, Javaid MK, Arden NK, Phillips DI, et al. Plasma leptin concentration and change in bone density among elderly men and women: the Hertfordshire cohort study. Calcif Tissue Int (2004) 74(5):401–6. doi: 10.1007/s00223-002-0017-x
47. Di Carlo C, Tommaselli GA, Di Spiezio Sardo A, Sammartino A, Attianese W, Gargano V, et al. Longitudinal evaluation of serum leptin and bone mineral density in early postmenopausal women. Menopause (2007) 14(3 Pt 1):450–4. doi: 10.1097/01.gme.0000236936.28454.6a
48. Di Monaco M, Vallero F, Di Monaco R, Mautino F, Cavanna A. Fat body mass, leptin and femur bone mineral density in hip-fractured women. J Endocrinol Invest (2003) 26(12):1180–5. doi: 10.1007/BF03349154
49. Fuggle NR, Westbury LD, Syddall HE, Duggal NA, Shaw SC, Maslin K, et al. Relationships between markers of inflammation and bone density: findings from the Hertfordshire cohort study. Osteoporos Int (2018) 29(7):1581–9. doi: 10.1007/s00198-018-4503-z
50. Gonnelli S, Caffarelli C, Del Santo K, Cadirni A, Guerriero C, Lucani B, et al. The relationship of ghrelin and adiponectin with bone mineral density and bone turnover markers in elderly men. Calcif Tissue Int (2008) 83(1):55–60. doi: 10.1007/s00223-008-9149-y
51. Goulding A, Taylor RW. Plasma leptin values in relation to bone mass and density and to dynamic biochemical markers of bone resorption and formation in postmenopausal women. Calcif Tissue Int (1998) 63(6):456–8. doi: 10.1007/s002239900557
52. Gulin T, Kruljac I, Kirigin Bilos LS, Gulin M, Grgurevic M, Borojevic M. The role of adipokines as prognostic factors of one-year mortality in hip fracture patients. Osteoporos Int (2017) 28(8):2475–83. doi: 10.1007/s00198-017-4068-2
53. Haam JH, Kim YS, Kim MJ, Koo HS, Kim HY, Kim HJ, et al. A cross-sectional study of the association between adipokine levels and bone mineral density according to obesity and menopausal status in Korean women. J Bone Miner Metab (2017) 35(6):642–8. doi: 10.1007/s00774-016-0801-8
54. Ibrahim SE, ElShishtawy H, Helmy A, A.Galal Z, Salam MHA. Serum leptin concentration, bone mineral density and bone biochemical markers in a sample of Egyptian women: a possible relationship. Egyptian Rheumatol (2011) 33(4):171–7. doi: 10.1016/j.ejr.2011.07.001
55. Iwamoto I, Douchi T, Kosha S, Murakami M, Fujino T, Nagata Y. Relationships between serum leptin level and regional bone mineral density, bone metabolic markers in healthy women. Acta Obstet Gynecol Scand (2000) 79(12):1060–4. doi: 10.1034/j.1600-0412.2000.0790121060.x
56. Jiang LS, Zhang ZM, Jiang SD, Chen WH, Dai LY. Differential bone metabolism between postmenopausal women with osteoarthritis and osteoporosis. J Bone Miner Res (2008) 23(4):475–83. doi: 10.1359/jbmr.071114
57. Johansson H, Oden A, Karlsson MK, McCloskey E, Kanis JA, Ohlsson C, et al. Waning predictive value of serum adiponectin for fracture risk in elderly men: mros Sweden. Osteoporos Int (2014) 25(7):1831–6. doi: 10.1007/s00198-014-2654-0
58. Johansson H, Oden A, Lerner UH, Jutberger H, Lorentzon M, Barrett-Connor E, et al. High serum adiponectin predicts incident fractures in elderly men: osteoporotic fractures in men (Mros) Sweden. J Bone Miner Res (2012) 27(6):1390–6. doi: 10.1002/jbmr.1591
59. Jurimae J, Jurimae T. Influence of insulin-like growth factor-1 and leptin on bone mineral content in healthy premenopausal women. Exp Biol Med (Maywood) (2006) 231(10):1673–7. doi: 10.1177/153537020623101013
60. Jurimae J, Jurimae T. Adiponectin is a predictor of bone mineral density in middle-aged premenopausal women. Osteoporos Int (2007) 18(9):1253–9. doi: 10.1007/s00198-007-0365-5
61. Jurimae J, Jurimae T. Plasma adiponectin concentration in healthy pre- and postmenopausal women: relationship with body composition, bone mineral, and metabolic variables. Am J Physiol Endocrinol Metab (2007) 293(1):E42–7. doi: 10.1152/ajpendo.00610.2006
62. Jurimae J, Jurimae T, Leppik A, Kums T. The influence of ghrelin, adiponectin, and leptin on bone mineral density in healthy postmenopausal women. J Bone Miner Metab (2008) 26(6):618–23. doi: 10.1007/s00774-008-0861-5
63. Jurimae J, Kums T, Jurimae T. Adipocytokine and ghrelin levels in relation to bone mineral density in physically active older women: longitudinal associations. Eur J Endocrinol (2009) 160(3):381–5. doi: 10.1530/EJE-08-0673
64. Jurimae J, Rembel K, Jurimae T, Rehand M. Adiponectin is associated with bone mineral density in perimenopausal women. Horm Metab Res (2005) 37(5):297–302. doi: 10.1055/s-2005-861483
65. Kim H, Koh H, Ku SY, Kim SH, Kim JH, Kim JG. Association between polymorphisms in period genes and bone density in postmenopausal Korean women. Climacteric (2014) 17(5):605–12. doi: 10.3109/13697137.2014.905527
66. Kim JH, Lee DC. Mitochondrial DNA copy number in peripheral blood is associated with femoral neck bone mineral density in postmenopausal women. J Rheumatol (2012) 39(7):1465–72. doi: 10.3899/jrheum.111444
67. Kim SM, Kim SH, Lee JR, Jee BC, Ku SY, Suh CS, et al. Association of leptin receptor polymorphisms Lys109arg and Gln223arg with serum leptin profile and bone mineral density in Korean women. Am J Obstet Gynecol (2008) 198(4):421 e1–8. doi: 10.1016/j.ajog.2007.10.799
68. King GA, Deemer SE, Thompson DL. Relationship between leptin, adiponectin, bone mineral density, and measures of adiposity among pre-menopausal Hispanic and Caucasian women. Endocr Res (2010) 35(3):106–17. doi: 10.3109/07435800.2010.496090
69. Kocyigit H, Bal S, Atay A, Koseoglu M, Gurgan A. Plasma leptin values in postmenopausal women with osteoporosis. Bosn J Basic Med Sci (2013) 13(3):192–6. doi: 10.17305/bjbms.2013.2361
70. Kontogianni MD, Dafni UG, Routsias JG, Skopouli FN. Blood leptin and adiponectin as possible mediators of the relation between fat mass and bmd in perimenopausal women. J Bone Miner Res (2004) 19(4):546–51. doi: 10.1359/JBMR.040107
71. Lee HJ, Kim H, Ku SY, Choi YM, Kim JH, Kim JG. Association between polymorphisms in leptin, leptin receptor, and beta-adrenergic receptor genes and bone mineral density in postmenopausal Korean women. Menopause (2014) 21(1):67–73. doi: 10.1097/GME.0b013e31829366ed
72. Li XP, Zeng S, Wang M, Wu XP, Liao EY. Relationships between serum omentin-1, body fat mass and bone mineral density in healthy Chinese Male adults in changsha area. J Endocrinol Invest (2014) 37(10):991–1000. doi: 10.1007/s40618-014-0140-3
73. Liu D, Chen L, Dong S, Yang H, Li L, Liu J, et al. Low bone mass is associated with carotid calcification plaque in Chinese postmenopausal women: the chongqing osteoporosis study. Climacteric (2020) 23(3):237–44. doi: 10.1080/13697137.2019.1671818
74. Liu JM, Zhao HY, Ning G, Chen Y, Zhang LZ, Sun LH, et al. Igf-1 as an early marker for low bone mass or osteoporosis in premenopausal and postmenopausal women. J Bone Miner Metab (2008) 26(2):159–64. doi: 10.1007/s00774-007-0799-z
75. Liu JM, Zhao HY, Zhao L, Chen Y, Zhang LZ, Tao B, et al. An independent positive relationship between the serum total osteocalcin level and fat-free mass in healthy premenopausal women. J Clin Endocrinol Metab (2013) 98(5):2146–52. doi: 10.1210/jc.2013-1112
76. Lorentzon M, Landin K, Mellstrom D, Ohlsson C. Leptin is a negative independent predictor of areal bmd and cortical bone size in young adult Swedish men. J Bone Miner Res (2006) 21(12):1871–8. doi: 10.1359/jbmr.060814
77. Makovey J, Naganathan V, Seibel M, Sambrook P. Gender differences in plasma ghrelin and its relations to body composition and bone - an opposite-sex twin study. Clin Endocrinol (Oxf) (2007) 66(4):530–7. doi: 10.1111/j.1365-2265.2007.02768.x
78. Martini G, Valenti R, Giovani S, Franci B, Campagna S, Nuti R. Influence of insulin-like growth factor-1 and leptin on bone mass in healthy postmenopausal women. Bone (2001) 28(1):113–7. doi: 10.1016/s8756-3282(00)00408-7
79. Michaelsson K, Lind L, Frystyk J, Flyvbjerg A, Gedeborg R, Berne C, et al. Serum adiponectin in elderly men does not correlate with fracture risk. J Clin Endocrinol Metab (2008) 93(10):4041–7. doi: 10.1210/jc.2008-0617
80. Mihai G, Gasparik AI, Pascanu IM, Cevei M, Hutanu A, Pop RM. The influence of visfatin, rbp-4 and insulin resistance on bone mineral density in women with treated primary osteoporosis. Aging Clin Exp Res (2019) 31(6):889–95. doi: 10.1007/s40520-019-01206-6
81. Mohiti-Ardekani J, Soleymani-Salehabadi H, Owlia MB, Mohiti A. Relationships between serum adipocyte hormones (Adiponectin, leptin, resistin), bone mineral density and bone metabolic markers in osteoporosis patients. J Bone Miner Metab (2014) 32(4):400–4. doi: 10.1007/s00774-013-0511-4
82. Morberg CM, Tetens I, Black E, Toubro S, Soerensen TI, Pedersen O, et al. Leptin and bone mineral density: a cross-sectional study in obese and nonobese men. J Clin Endocrinol Metab (2003) 88(12):5795–800. doi: 10.1210/jc.2003-030496
83. Morcov C, Vulpoi C, Branisteanu D. Correlation between adiponectin, leptin, insulin growth factor-1 and bone mineral density in pre and postmenopausal women. Rev Med Chir Soc Med Nat Iasi (2012) 116(3):785–9.
84. Mpalaris V, Anagnostis P, Anastasilakis AD, Goulis DG, Doumas A, Iakovou I. Serum leptin, adiponectin and ghrelin concentrations in post-menopausal women: is there an association with bone mineral density? Maturitas (2016) 88:32–6. doi: 10.1016/j.maturitas.2016.03.004
85. Nakamura Y, Nakano M, Suzuki T, Sato J, Kato H, Takahashi J, et al. Two adipocytokines, leptin and adiponectin, independently predict osteoporotic fracture risk at different bone sites in postmenopausal women. Bone (2020) 137:115404. doi: 10.1016/j.bone.2020.115404
86. Nouh O, Abd Elfattah MM, Hassouna AA. Association between ghrelin levels and bmd: a cross sectional trial. Gynecol Endocrinol (2012) 28(7):570–2. doi: 10.3109/09513590.2011.593663
87. Odabasi E, Ozata M, Turan M, Bingol N, Yonem A, Cakir B, et al. Plasma leptin concentrations in postmenopausal women with osteoporosis. Eur J Endocrinol (2000) 142(2):170–3. doi: 10.1530/eje.0.1420170
88. Oguz S, Tapisiz OL, Aytan H, Gunyeli I, Erdem S, Tuncay G, et al. Is leptin a significant predictor of bone mineral density in postmenopausal Turkish women? Rheumatol Int (2009) 29(4):393–6. doi: 10.1007/s00296-008-0711-8
89. Oh KW, Lee WY, Rhee EJ, Baek KH, Yoon KH, Kang MI, et al. The relationship between serum resistin, leptin, adiponectin, ghrelin levels and bone mineral density in middle-aged men. Clin Endocrinol (Oxf) (2005) 63(2):131–8. doi: 10.1111/j.1365-2265.2005.02312.x
90. Ozkurt B, Ozkurt ZN, Altay M, Aktekin CN, Caglayan O, Tabak Y. The relationship between serum adiponectin level and anthropometry, bone mass, osteoporotic fracture risk in postmenopausal women. Eklem Hastalik Cerrahisi (2009) 20(2):78–84.
91. Papadopoulou F, Krassas GE, Kalothetou C, Koliakos G, Constantinidis TC. Serum leptin values in relation to bone density and growth hormone-insulin like growth factors axis in healthy men. Arch Androl (2004) 50(2):97–103. doi: 10.1080/aan.50.2.97.103
92. Pasco JA, Henry MJ, Kotowicz MA, Collier GR, Ball MJ, Ugoni AM, et al. Serum leptin levels are associated with bone mass in nonobese women. J Clin Endocrinol Metab (2001) 86(5):1884–7. doi: 10.1210/jcem.86.5.7417
93. Pedone C, Napoli N, Pozzilli P, Lauretani F, Bandinelli S, Ferrucci L, et al. Bone health as a function of adipokines and vitamin d pattern in elderly patients. Rejuvenation Res (2013) 16(6):467–74. doi: 10.1089/rej.2013.1436
94. Peng XD, Xie H, Zhao Q, Wu XP, Sun ZQ, Liao EY. Relationships between serum adiponectin, leptin, resistin, visfatin levels and bone mineral density, and bone biochemical markers in Chinese men. Clin Chim Acta (2008) 387(1-2):31–5. doi: 10.1016/j.cca.2007.08.012
95. Pluskiewicz W, Adamczyk P, Marek B, Czekajlo A, Drozdzowska B, Kajdaniuk D, et al. Adiponectin and resistin in relationship with skeletal status in women from the rac-Ost-Pol study. Endokrynol Pol (2012) 63(6):427–31.
96. Rauch F, Blum WF, Klein K, Allolio B, Schonau E. Does leptin have an effect on bone in adult women? Calcif Tissue Int (1998) 63(6):453–5. doi: 10.1007/s002239900556
97. Richards JB, Valdes AM, Burling K, Perks UC, Spector TD. Serum adiponectin and bone mineral density in women. J Clin Endocrinol Metab (2007) 92(4):1517–23. doi: 10.1210/jc.2006-2097
98. Roux C, Arabi A, Porcher R, Garnero P. Serum leptin as a determinant of bone resorption in healthy postmenopausal women. Bone (2003) 33(5):847–52. doi: 10.1016/j.bone.2003.07.008
99. Ruhl CE, Everhart JE. Relationship of serum leptin concentration with bone mineral density in the united states population. J Bone Miner Res (2002) 17(10):1896–903. doi: 10.1359/jbmr.2002.17.10.1896
100. Sahin G, Polat G, Baethis S, Milcan A, Baethdatoethlu O, Erdoethan C, et al. Body composition, bone mineral density, and circulating leptin levels in postmenopausal Turkish women. Rheumatol Int (2003) 23(2):87–91. doi: 10.1007/s00296-002-0257-0
101. Scariano JK, Garry PJ, Montoya GD, Chandani AK, Wilson JM, Baumgartner RN. Serum leptin levels, bone mineral density and osteoblast alkaline phosphatase activity in elderly men and women. Mech Ageing Dev (2003) 124(3):281–6. doi: 10.1016/s0047-6374(02)00195-1
102. Schett G, Kiechl S, Bonora E, Redlich K, Woloszczuk W, Oberhollenzer F, et al. Serum leptin level and the risk of nontraumatic fracture. Am J Med (2004) 117(12):952–6. doi: 10.1016/j.amjmed.2004.07.044
103. Shaarawy M, Abassi AF, Hassan H, Salem ME. Relationship between serum leptin concentrations and bone mineral density as well as biochemical markers of bone turnover in women with postmenopausal osteoporosis. Fertil Steril (2003) 79(4):919–24. doi: 10.1016/s0015-0282(02)04915-4
104. Shabat S, Nyska M, Eintacht S, Lis M, Bogomolni A, Berner Y, et al. Serum leptin level in geriatric patients with hip fractures: possible correlation to biochemical parameters of bone remodeling. Arch Gerontol Geriatr (2009) 48(2):250–3. doi: 10.1016/j.archger.2008.02.003
105. Shen C, Deng J, Zhou R, Chen J, Fan S, Li Z, et al. Relation between bone mineral density, bone loss and the risk of cardiovascular disease in a Chinese cohort. Am J Cardiol (2012) 110(8):1138–42. doi: 10.1016/j.amjcard.2012.05.053
106. Sherk VD, Malone SP, Bemben MG, Knehans AW, Palmer IJ, Bemben DA. Leptin, fat mass, and bone mineral density in healthy pre- and postmenopausal women. J Clin Densitom (2011) 14(3):321–5. doi: 10.1016/j.jocd.2011.03.010
107. Sun AJ, Jing T, Heymsfield SB, Phillips GB. Relationship of leptin and sex hormones to bone mineral density in men. Acta Diabetol (2003) 40(Suppl 1):S101–5. doi: 10.1007/s00592-003-0039-5
108. Tanna N, Patel K, Moore AE, Dulnoan D, Edwards S, Hampson G. The relationship between circulating adiponectin, leptin and vaspin with bone mineral density (Bmd), arterial calcification and stiffness: a cross-sectional study in post-menopausal women. J Endocrinol Invest (2017) 40(12):1345–53. doi: 10.1007/s40618-017-0711-1
109. Tariq S, Tariq S, Alam SS, Baig M. Effect of ibandronate therapy on serum homocysteine and leptin in postmenopausal osteoporotic females. Osteoporos Int (2015) 26(3):1187–92. doi: 10.1007/s00198-014-2909-9
110. Tenta R, Kontogianni MD, Yiannakouris N. Association between circulating levels of adiponectin and indices of bone mass and bone metabolism in middle-aged post-menopausal women. J Endocrinol Invest (2012) 35(3):306–11. doi: 10.3275/7744
111. Thomas T, Burguera B, Melton LJ 3rd, Atkinson EJ, O'Fallon WM, Riggs BL, et al. Role of serum leptin, insulin, and estrogen levels as potential mediators of the relationship between fat mass and bone mineral density in men versus women. Bone (2001) 29(2):114–20. doi: 10.1016/s8756-3282(01)00487-2
112. Tohidi M, Akbarzadeh S, Larijani B, Kalantarhormozi M, Ostovar A, Assadi M, et al. Omentin-1, visfatin and adiponectin levels in relation to bone mineral density in Iranian postmenopausal women. Bone (2012) 51(5):876–81. doi: 10.1016/j.bone.2012.08.117
113. Ushiroyama T, Ikeda A, Hosotani T, Higashiyama T, Ueki M. Inverse correlation between serum leptin concentration and vertebral bone density in postmenopausal women. Gynecol Endocrinol (2003) 17(1):31–6. doi: 10.1080/gye.17.1.31.36
114. Varri M, Niskanen L, Tuomainen T, Honkanen R, Kroger H, Tuppurainen MT. Association of adipokines and estradiol with bone and carotid calcifications in postmenopausal women. Climacteric (2016) 19(2):204–11. doi: 10.3109/13697137.2016.1139563
115. Weiss LA, Barrett-Connor E, von Muhlen D, Clark P. Leptin predicts bmd and bone resorption in older women but not older men: the rancho Bernardo study. J Bone Miner Res (2006) 21(5):758–64. doi: 10.1359/jbmr.060206
116. Weiss LA, Langenberg C, Barrett-Connor E. Ghrelin and bone: is there an association in older adults?: the rancho Bernardo study. J Bone Miner Res (2006) 21(5):752–7. doi: 10.1359/jbmr.060209
117. Wu N, Wang QP, Li H, Wu XP, Sun ZQ, Luo XH. Relationships between serum adiponectin, leptin concentrations and bone mineral density, and bone biochemical markers in Chinese women. Clin Chim Acta (2010) 411(9-10):771–5. doi: 10.1016/j.cca.2010.02.064
118. Yamauchi M, Sugimoto T, Yamaguchi T, Nakaoka D, Kanzawa M, Yano S, et al. Plasma leptin concentrations are associated with bone mineral density and the presence of vertebral fractures in postmenopausal women. Clin Endocrinol (Oxf) (2001) 55(3):341–7. doi: 10.1046/j.1365-2265.2001.01361.x
119. Yilmazi M, Keles I, Aydin G, Orkun S, Bayram M, Sevinc FC, et al. Plasma leptin concentrations in postmenopausal women with osteoporosis. Endocr Res (2005) 31(2):133–8. doi: 10.1080/07435800500229276
120. Zhang H, Xie H, Zhao Q, Xie GQ, Wu XP, Liao EY, et al. Relationships between serum adiponectin, apelin, leptin, resistin, visfatin levels and bone mineral density, and bone biochemical markers in post-menopausal Chinese women. J Endocrinol Invest (2010) 33(10):707–11. doi: 10.3275/688610.1007/BF03346674
121. Zhao HY, Bi YF, Ma LY, Zhao L, Wang TG, Zhang LZ, et al. The effects of bisphenol a (Bpa) exposure on fat mass and serum leptin concentrations have no impact on bone mineral densities in non-obese premenopausal women. Clin Biochem (2012) 45(18):1602–6. doi: 10.1016/j.clinbiochem.2012.08.024
122. Zhong N, Wu XP, Xu ZR, Wang AH, Luo XH, Cao XZ, et al. Relationship of serum leptin with age, body weight, body mass index, and bone mineral density in healthy mainland Chinese women. Clin Chim Acta (2005) 351(1-2):161–8. doi: 10.1016/j.cccn.2004.09.003
123. Zoico E, Zamboni M, Adami S, Vettor R, Mazzali G, Tosoni P, et al. Relationship between leptin levels and bone mineral density in the elderly. Clin Endocrinol (Oxf) (2003) 59(1):97–103. doi: 10.1046/j.1365-2265.2003.01808.x
124. Zoico E, Zamboni M, Di Francesco V, Mazzali G, Fantin F, De Pergola G, et al. Relation between adiponectin and bone mineral density in elderly post-menopausal women: role of body composition, leptin, insulin resistance, and dehydroepiandrosterone sulfate. J Endocrinol Invest (2008) 31(4):297–302. doi: 10.1007/BF03346361
125. Reid IR, Richards JB. Adipokine effects on bone. Clinic Rev Bone Miner Metab (2009) 7:240–8. doi: 10.1007/s12018-009-9048-4
126. Rendina-Ruedy E, Rosen CJ. Bone-fat interaction. Endocrinol Metab Clin North Am (2017) 46(1):41–50. doi: 10.1016/j.ecl.2016.09.004
127. Moorthi RN, Fadel W, Eckert GJ, Ponsler-Sipes K, Moe SM, Lin C. Bone marrow fat is increased in chronic kidney disease by magnetic resonance spectroscopy. Osteoporos Int (2015) 26(6):1801–7. doi: 10.1007/s00198-015-3064-7
128. Shen Y, Huang X, Wu J, Lin X, Zhou X, Zhu Z, et al. The global burden of osteoporosis, low bone mass, and its related fracture in 204 countries and territories, 1990-2019. Front Endocrinol (Lausanne) (2022) 13:882241. doi: 10.3389/fendo.2022.882241
129. Franco-Trepat E, Guillan-Fresco M, Alonso-Perez A, Jorge-Mora A, Francisco V, Gualillo O, et al. Visfatin connection: present and future in osteoarthritis and osteoporosis. J Clin Med (2019) 8(8):1178. doi: 10.3390/jcm8081178
130. Kirk B, Feehan J, Lombardi G, Duque G. Muscle, bone, and fat crosstalk: the biological role of myokines, osteokines, and adipokines. Curr Osteoporos Rep (2020) 18(4):388–400. doi: 10.1007/s11914-020-00599-y
Keywords: adipokines, ghrelin, bone mineral density, fracture risk, meta-analysis
Citation: Lee S, Kim JH, Jeon YK, Lee JS, Kim K, Hwang S-K, Kim JH, Goh TS and Kim YH (2023) Effect of adipokine and ghrelin levels on BMD and fracture risk: an updated systematic review and meta-analysis. Front. Endocrinol. 14:1044039. doi: 10.3389/fendo.2023.1044039
Received: 14 September 2022; Accepted: 29 March 2023;
Published: 26 April 2023.
Edited by:
Ling Wang, Beijing Jishuitan Hospital, ChinaReviewed by:
Neha Dole, University of Arkansas for Medical Sciences, United StatesCopyright © 2023 Lee, Kim, Jeon, Lee, Kim, Hwang, Kim, Goh and Kim. This is an open-access article distributed under the terms of the Creative Commons Attribution License (CC BY). The use, distribution or reproduction in other forums is permitted, provided the original author(s) and the copyright owner(s) are credited and that the original publication in this journal is cited, in accordance with accepted academic practice. No use, distribution or reproduction is permitted which does not comply with these terms.
*Correspondence: Yun Hak Kim, eXVuaGFrMTA1MTBAcHVzYW4uYWMua3I=; Tae Sik Goh, dGFlc2lrZ29oQHB1c2FuLmFjLmty
†These authors have contributed equally to this work and share first authorship
‡These authors have contributed equally to this work and share last authorship
Disclaimer: All claims expressed in this article are solely those of the authors and do not necessarily represent those of their affiliated organizations, or those of the publisher, the editors and the reviewers. Any product that may be evaluated in this article or claim that may be made by its manufacturer is not guaranteed or endorsed by the publisher.
Research integrity at Frontiers
Learn more about the work of our research integrity team to safeguard the quality of each article we publish.