 Yongjie Chen
 Caihong Wang
 Bei Gao
- Department of Epidemiology and Statistics, School of Public Health, Tianjin Medical University, Tianjin, China
Background: The increased risk of metabolic syndrome (MetS) during the menopausal transition might partly attribute to the changes in follicle-stimulating hormone (FSH) and luteinizing hormone (LH). However, few studies were conducted to examine the associations of FSH and LH concentrations with MetS at the full range of reproductive aging, especially in the US population. The aim of this study is to examine the associations of FSH, LH, and LH/FSH ratio with the risk of MetS and severity score in the US women.
Methods: Data were derived from the National Health and Nutrition Examination Survey. Women aged from 35 to 60 years were eligible. MetS was defined as having at least 3 of the following: a waist circumference ≥ 88 cm, a triglycerides level ≥ 150 mg/dL, a high density lipoprotein < 50 mg/dL, a systolic blood pressure ≥ 130 mm Hg or a diastolic blood pressure ≥ 85 mm Hg or taking hypertension medications, or a fasting plasma glucose level ≥100 mg/dL or taking diabetes medications. The MetS severity score was calculated according to race/ethnicity- specific equation.
Results: There were 3,831 women included in this study. Increases in serum FSH and LH levels per 1 SD were separately linked to a 22.6% (OR: 0.774; 95% CI: 0.646, 0.929; and P= 0.006) and 18.5% (OR: 0.815; 95% CI: 0.690, 0.962; and P= 0.006) lower risk of MetS only in postmenopausal women. Meanwhile, increases in serum FSH and LH levels per 1SD were associated with a decrease of -0.157 (95% CI :-2.967, -2.034) and -0.078 (95% CI: -2.688, -1.806) MetS severity score in perimenopausal women and -0.195 (95% CI: -2.192, -1.023) and -0.098 (95% CI:-1.884, -0.733) in postmenopausal women. However, LH/FSH ratio had no connections with the risk of MetS and MetS severity score across the menopausal transition.
Conclusions: Elevated serum FSH and LH levels, but not LH/FSH ratio, were associated with a lower risk of MetS and MetS severity score, especially in postmenopausal women. Therefore, serum FSH and LH levels might be efficient predictors for screening and identifying women at risk of MetS across the menopausal transition.
Introduction
Metabolic syndrome (MetS) is characterized by a combination of central obesity, high blood pressure, blood sugar and triglycerides (TG), and low high density lipoprotein (HDL) cholesterol (1). In US, the prevalence of MetS was 34.7% among adults, and remained stable from 2011 to 2016 (2). However, the risk of MetS will considerably increase after shifting into menopause (3). It was declared that the prevalence of MetS will increase to 31.0-55.0% in postmenopausal women, which is not only associated with aging, but also associated with the changes in sex hormones including estrogen, follicle-stimulating hormone (FSH), and luteinizing hormone (LH) during the menopausal transition (3–5). Therefore, identifying the specific factors of MetS across the menopausal transition may contribute to the prevention of MetS.
There were many studies to investigate the associations of estrogen and androgen with MetS (6–8). However, no evidence on the association of estrogen with MetS were found. Furthermore, a different incidence of MetS was found in postmenopausal women with the same level of estrogen (9). Recently, the potential roles of FSH and LH in MetS are increasingly followed with interest. However, to date, few studies were conducted to evaluate the associations of FSH and LH with the risk of MetS. The existent studies limited to a small sample size, postmenopausal women alone, and FSH alone (9–12). Similar data regarding the relationship between FSH and MetS at the full range of reproductive aging are lacking. Furthermore, no study has be conducted to examine the association of FSH concentration with MetS in the US population until now. On the other hand, it is well documented that race/ethnicity significantly affects the incidence of MetS (13–16). Therefore, it is necessary to evaluate the association of FSH with MetS severity score, which can correct the racial/ethnic differences.
In this study, data derived from the National Health and Nutrition Examination Survey (NHANES) were used to examine the associations of FSH, LH, and LH/FSH ratio with the prevalence of MetS and severity score in the US women.
Materials and methods
Study design
The NHANES is a repeated cross-sectional survey and aims to assess and supervise the health and nutritional status in the US population. A stratified, multistage random procedure is used to recruit sample from the US population. The major information collected in the NHANES include demographic, socioeconomic, dietary, health-related behaviors, physiological measurements, and laboratory tests. Since 1959, a series of surveys were conducted in different population groups. To meet emerging needs, the NHANES has become a continuous program since 1999. The NHANES III focused on oversampling many groups, including children aged 2 months to 5 years, older adults aged 60 years or over, Mexican-American persons, and non-Hispanic black persons. However, the continuous NHANES focused on oversampling of low-income group, adolescents aged 12-19 years, older adults aged 60 years or over, African Americans, and Mexican Americans. Since data of both serum FSH and LH levels are publicly accessible only in the NHANES III and the continuous NHANES from 1999 to 2002, only the data from the NHANES III and the NHANES from 1999 to 2002 were used in this study. The NHANES III from 1988-1994 randomly recruits 39,695 participants aged 2 months and older. The continuous NHANES from 1999 to 2002 includes the NHANES 1999-2000 and the NHANES 2001-2002, which recruit 9,965 and 11,039 participants of all ages, respectively. The details of the NHANES are available at the website: https://www.cdc.gov/.
Study population
Since serum FSH and LH levels were collected only in women aged 35-60 years, this study only focused on women aged from 35 to 60 years. The inclusion criteria included: women having complete data of serum FSH and LH levels; women having complete data of metabolic risk factors, including waist circumference (WC), TG, HDL cholesterol, systolic blood pressure (SBP), diastolic blood pressure (DBP), and fasting plasma glucose levels; and women having complete data of main covariates, such as physical measurements, health-related indicators, and reproductive health indicators. The exclusion criteria included: women being pregnant or breastfeeding at the time of survey; and women having missing data of analyzed variables. The detailed process is shown in Figure 1. This study was approved by the NHANES Institutional Review Board (1999-2002: Protocol #98-12). Documented consent was obtained from participants.
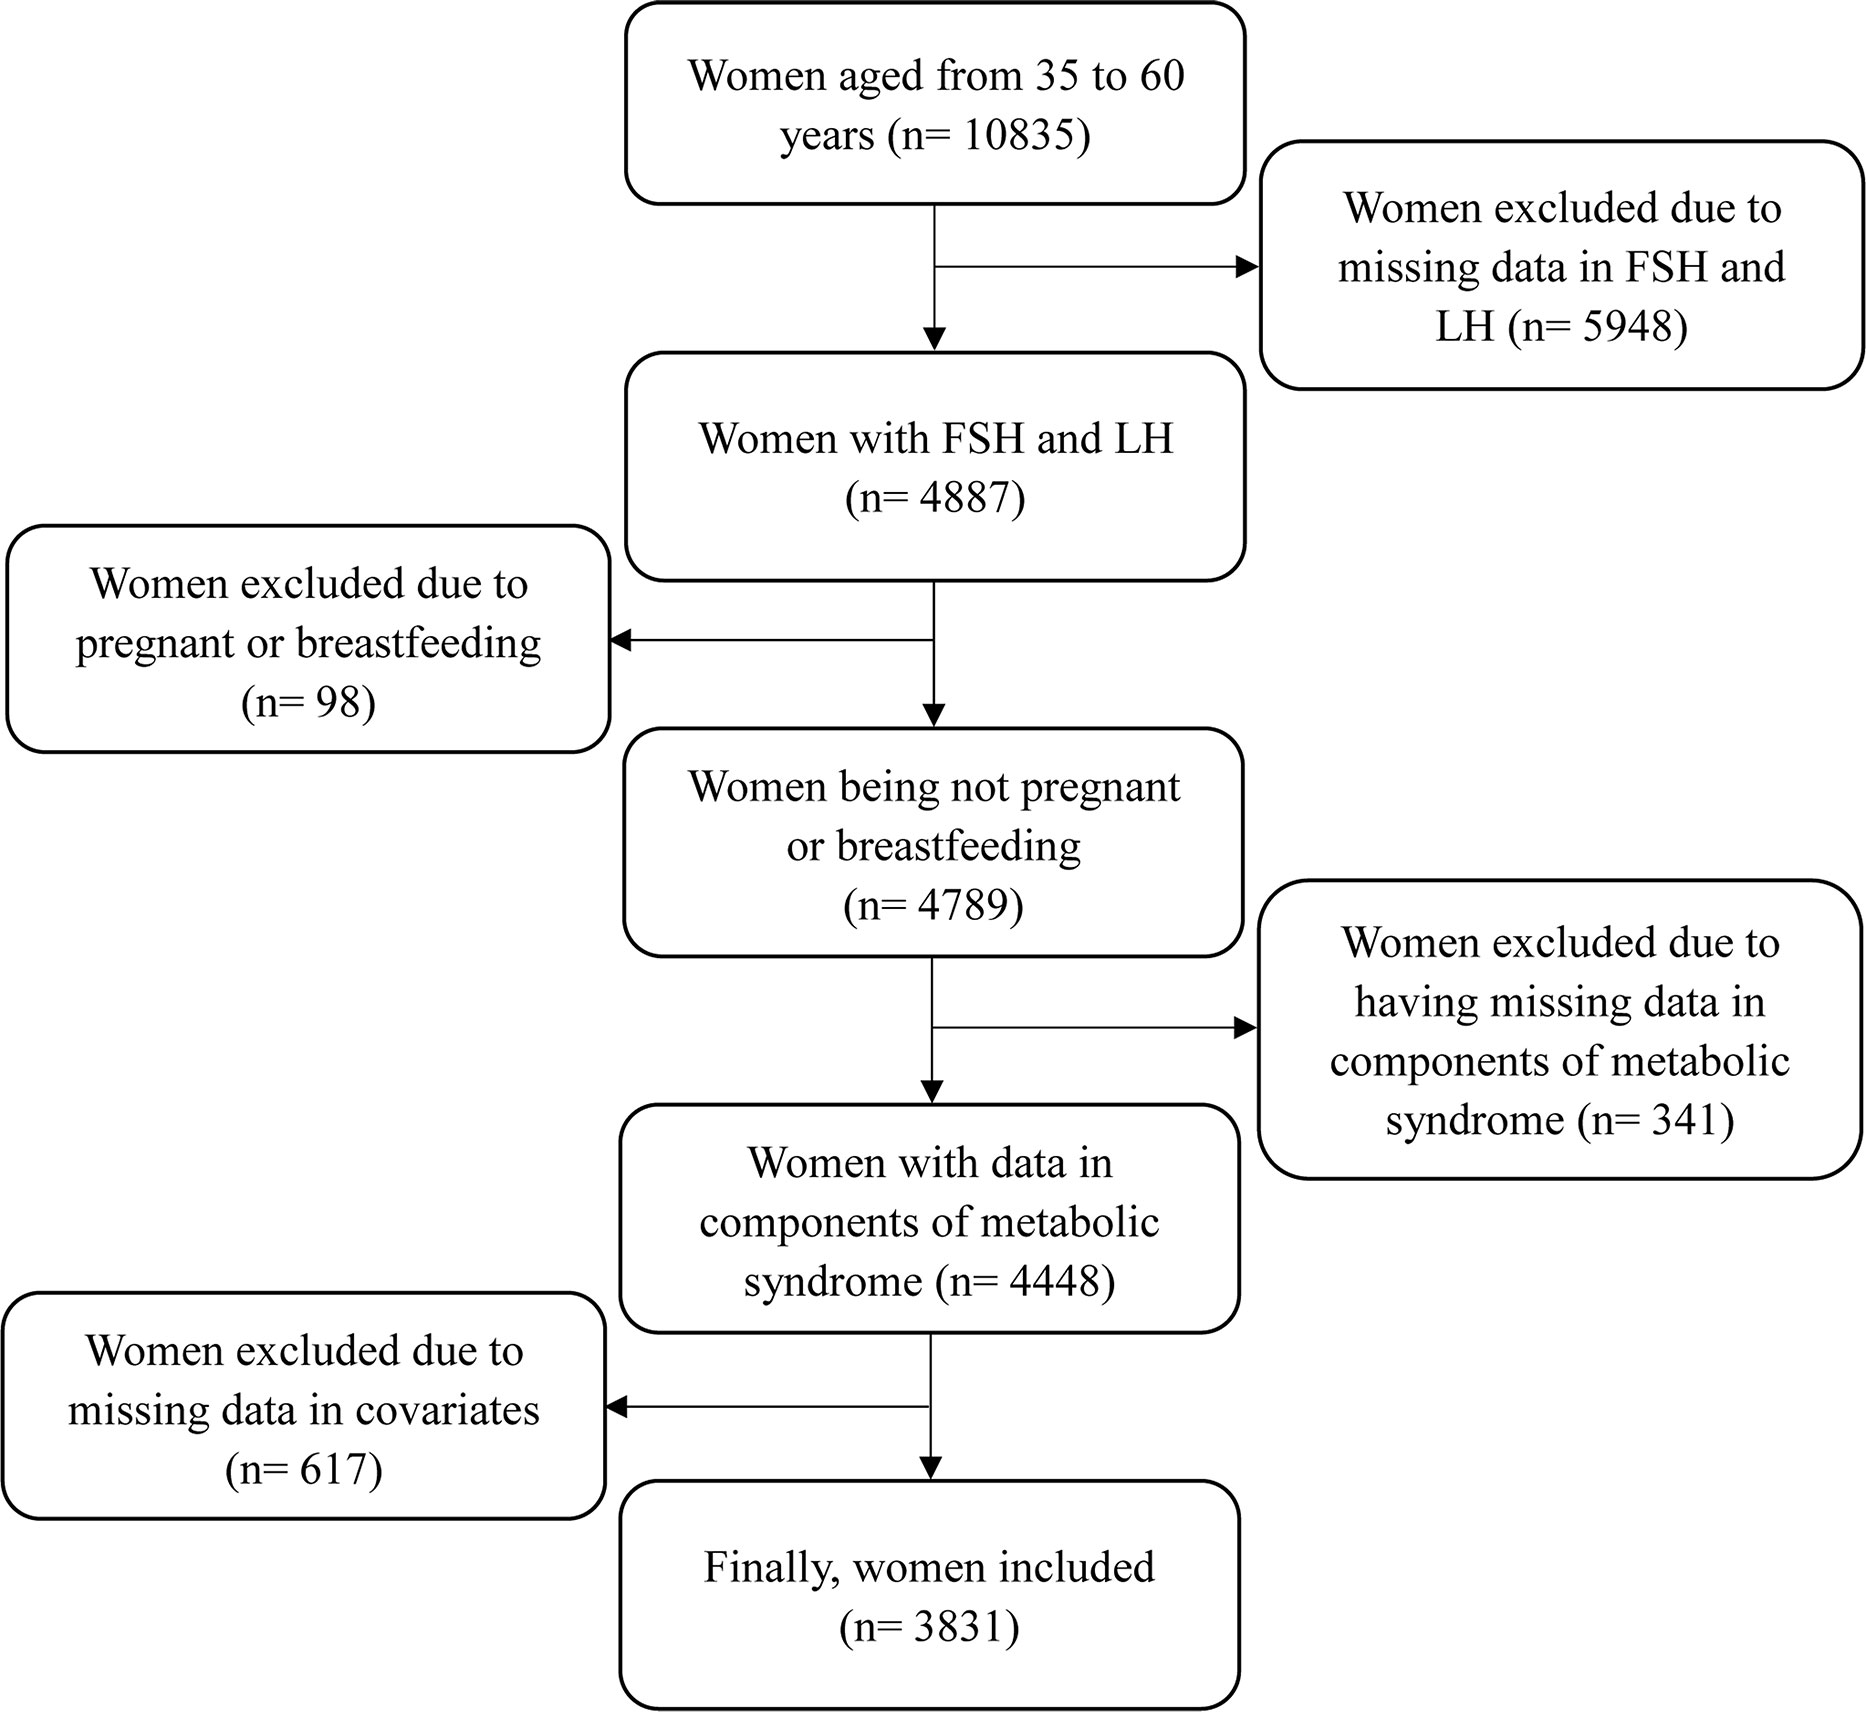
Figure 1 The detailed process of participants included.
Measurements
Fasting blood samples were collected in the mobile examination center and were used to assay serum FSH and LH levels using the Microparticle Enzyme Immunoassay technology (IMx FSH assay, IMx LH assay, Abbott Laboratories). The inter-assay coefficient of variation (CV) varied from 2.37 to 7.95 for FSH and from 1.65 to 10.1 for LH. The intra-assay CV varied from 3.20 to 4.11 for FSH and from 4.64 to 6.08 for LH. Serum TG levels were assayed using Hitachi Model 917 Multichannel Analyzer. Serum HDL levels were assayed using Hitachi 704 Analyzer. Plasma glucose levels were assayed using Enzyme hexokinase. Standard mercury sphygmomanometer was used to measure DBP and SBP, which were indicated by the first and fifth Korotkoff sounds, respectively. The averages of three measures were used in the final analysis. A question of “Because of your hypertension, have you ever taken prescribed medicine?” was used to identify whether taking hypertension medications. Similarly, a question was used to identify whether taking diabetes medications as follows: Other than during pregnancy, have you ever been told by a doctor or health professional that you have diabetes or sugar diabetes? WC was measured at the midpoint between the lower margin of the least palpable rib and the top of the iliac crest using a stretch-resistant tape.
Definition of MetS and calculation of MetS severity score
According to the National Cholesterol Education Program’s Adult Treatment Panel III, MetS was defined as having at least 3 of the following in women: a WC ≥ 88 cm, a TG level ≥ 150 mg/dL, a HDL level < 50 mg/dL, a SBP ≥ 130 mm Hg or a DBP ≥ 85 mm Hg or taking hypertension medications, or fasting plasma glucose level ≥100 mg/dL or taking diabetes medications (17).
Since sex and race/ethnicity significantly affect the incidence of MetS, all participants were divided into six subgroups based on sex and race/ethnicity to correct the influences of sex and race/ethnicity. Since this study only involved women, there were three race/ethnicity subgroups (non-Hispanic White, non-Hispanic Black, and Hispanic). For each subgroup, data derived from the NHANES 1999–2010 among adults aged 20-64 years were used to determine the weights of MetS components of WC, TG, HDL cholesterol, SBP, and fasting plasma glucose using the confirmatory factor analysis. Factor loadings from factor analysis were used to generate separately equations for each of three subgroups. The MetS severity score was calculated according to specific equation, which was described previously (18, 19).
Covariates
Covariates included age, race/ethnicity (non-Hispanic White, non-Hispanic Black, and Hispanic), current smoking (yes or no), current alcohol consumption (yes or no), annual household income, history of heart disease (yes or no), history of stroke (yes or no), parturiency status (yes or no), had a unilateral oophorectomy (yes or no), and use of hormone therapy (yes or no). Hispanic included Mexican-American and other Hispanic. Current smoking status was identified using a question as follows: Do you now smoke cigarettes/pipe/cigars/use snuff/use chewing tobacco? Alcohol consumption included consumption of liquor (such as whiskey or gin), beer, wine, wine coolers, and any other type of alcoholic beverage. Annual household income was classified as < $20,000, $20,000~$45,000, and ≥ $45,000. History of heart disease was identified using a series of questions as follows: Has a doctor or other health professional ever told you that you had congestive heart failure/coronary heart disease/angina/angina pectoris/heart attack? History of stroke was identified using a question as follows: Has a doctor or other health professional ever told you that you had a stroke? Menopausal status was categorized according to the STRAW criteria as follows: premenopausal category included all four premenopausal categories (i.e. −5 to −3), perimenopause category included the two menopausal transition categories (−2 and −1) and one early postmenopausal category (+1a), and postmenopausal category included three postmenopausal categories (+1b, +1c, and +2) (20, 21).
Statistical analysis
Kolmogorov-Smirnov test was used to test for normality of continuous variables. Continuous data with normal distribution are expressed as means ± standard deviations (SDs) and are compared between Non-MetS and MetS groups using t-test. Due to the abnormal distribution, serum FSH and LH levels are expressed as P50 (P25, P75) and are compared between-group using Wilcoxon rank sum test. Categorized variables are expressed as frequencies (percentages) and are compared using chi-square test. General linear regression was employed to analyze the associations of serum FSH and LH levels and LH/FSH ratio with MetS severity score by menopausal status. Logistic regression model was used to obtain odd ratios (ORs) and 95% confidential intervals (CIs) of serum FSH and LH levels and LH/FSH ratio with the prevalence of MetS and each component of MetS by menopausal status. Furthermore, serum FSH and LH levels were further divided into quintiles. In multivariable models, age, race/ethnicity, current smoking, current alcohol consumption, annual household income, history of heart disease, history of stroke, parturiency status, had a unilateral oophorectomy, and use of hormone therapy were adjusted. Furthermore, the sampling weight provided in the NHANES dataset was taken into account to adjust for non-responses bias and over-sampling of certain populations using PROC SURVEYLOGISTIC and PROC SURVEYREG in SAS 9.4. Meanwhile, multivariate Imputation by Chained Equations (mice) package in the statistical program R (version 3.5.1) was used to impute missing data of all the variables to investigate the impact of missing data. A sensitivity analysis was conducted to examine the associations of serum FSH and LH levels and LH/FSH ratio with the risk of MetS and MetS severity score using the complete dataset. All analyses were conducted using SAS 9.4 (SAS Institute Inc., Cary, NC, USA.). A two-tailed P≤ 0.05 was considered to be statistically significant.
Results
Characteristics of all women
There were 3,831 women included in this study. There were 728 premenopausal women, 1,502 perimenopausal women, and 1,601 postmenopausal women. The prevalence of MetS was 34.01%. The average of age was 45.94 ± 7.45 years. The medians of serum FSH and LH levels were 11.00 (5.60, 50.76) IU/L and 8.60 (3.50, 22.98) IU/L, respectively. The mean of LH/FSH ratio was 0.73 ± 0.84. The mean of MetS severity score was 0.15 ± 1.28. Table 1 shows the comparisons between non-MetS and MetS groups in all characteristics. Significant differences were observed in all characteristics, except current smoking (P= 0.089).
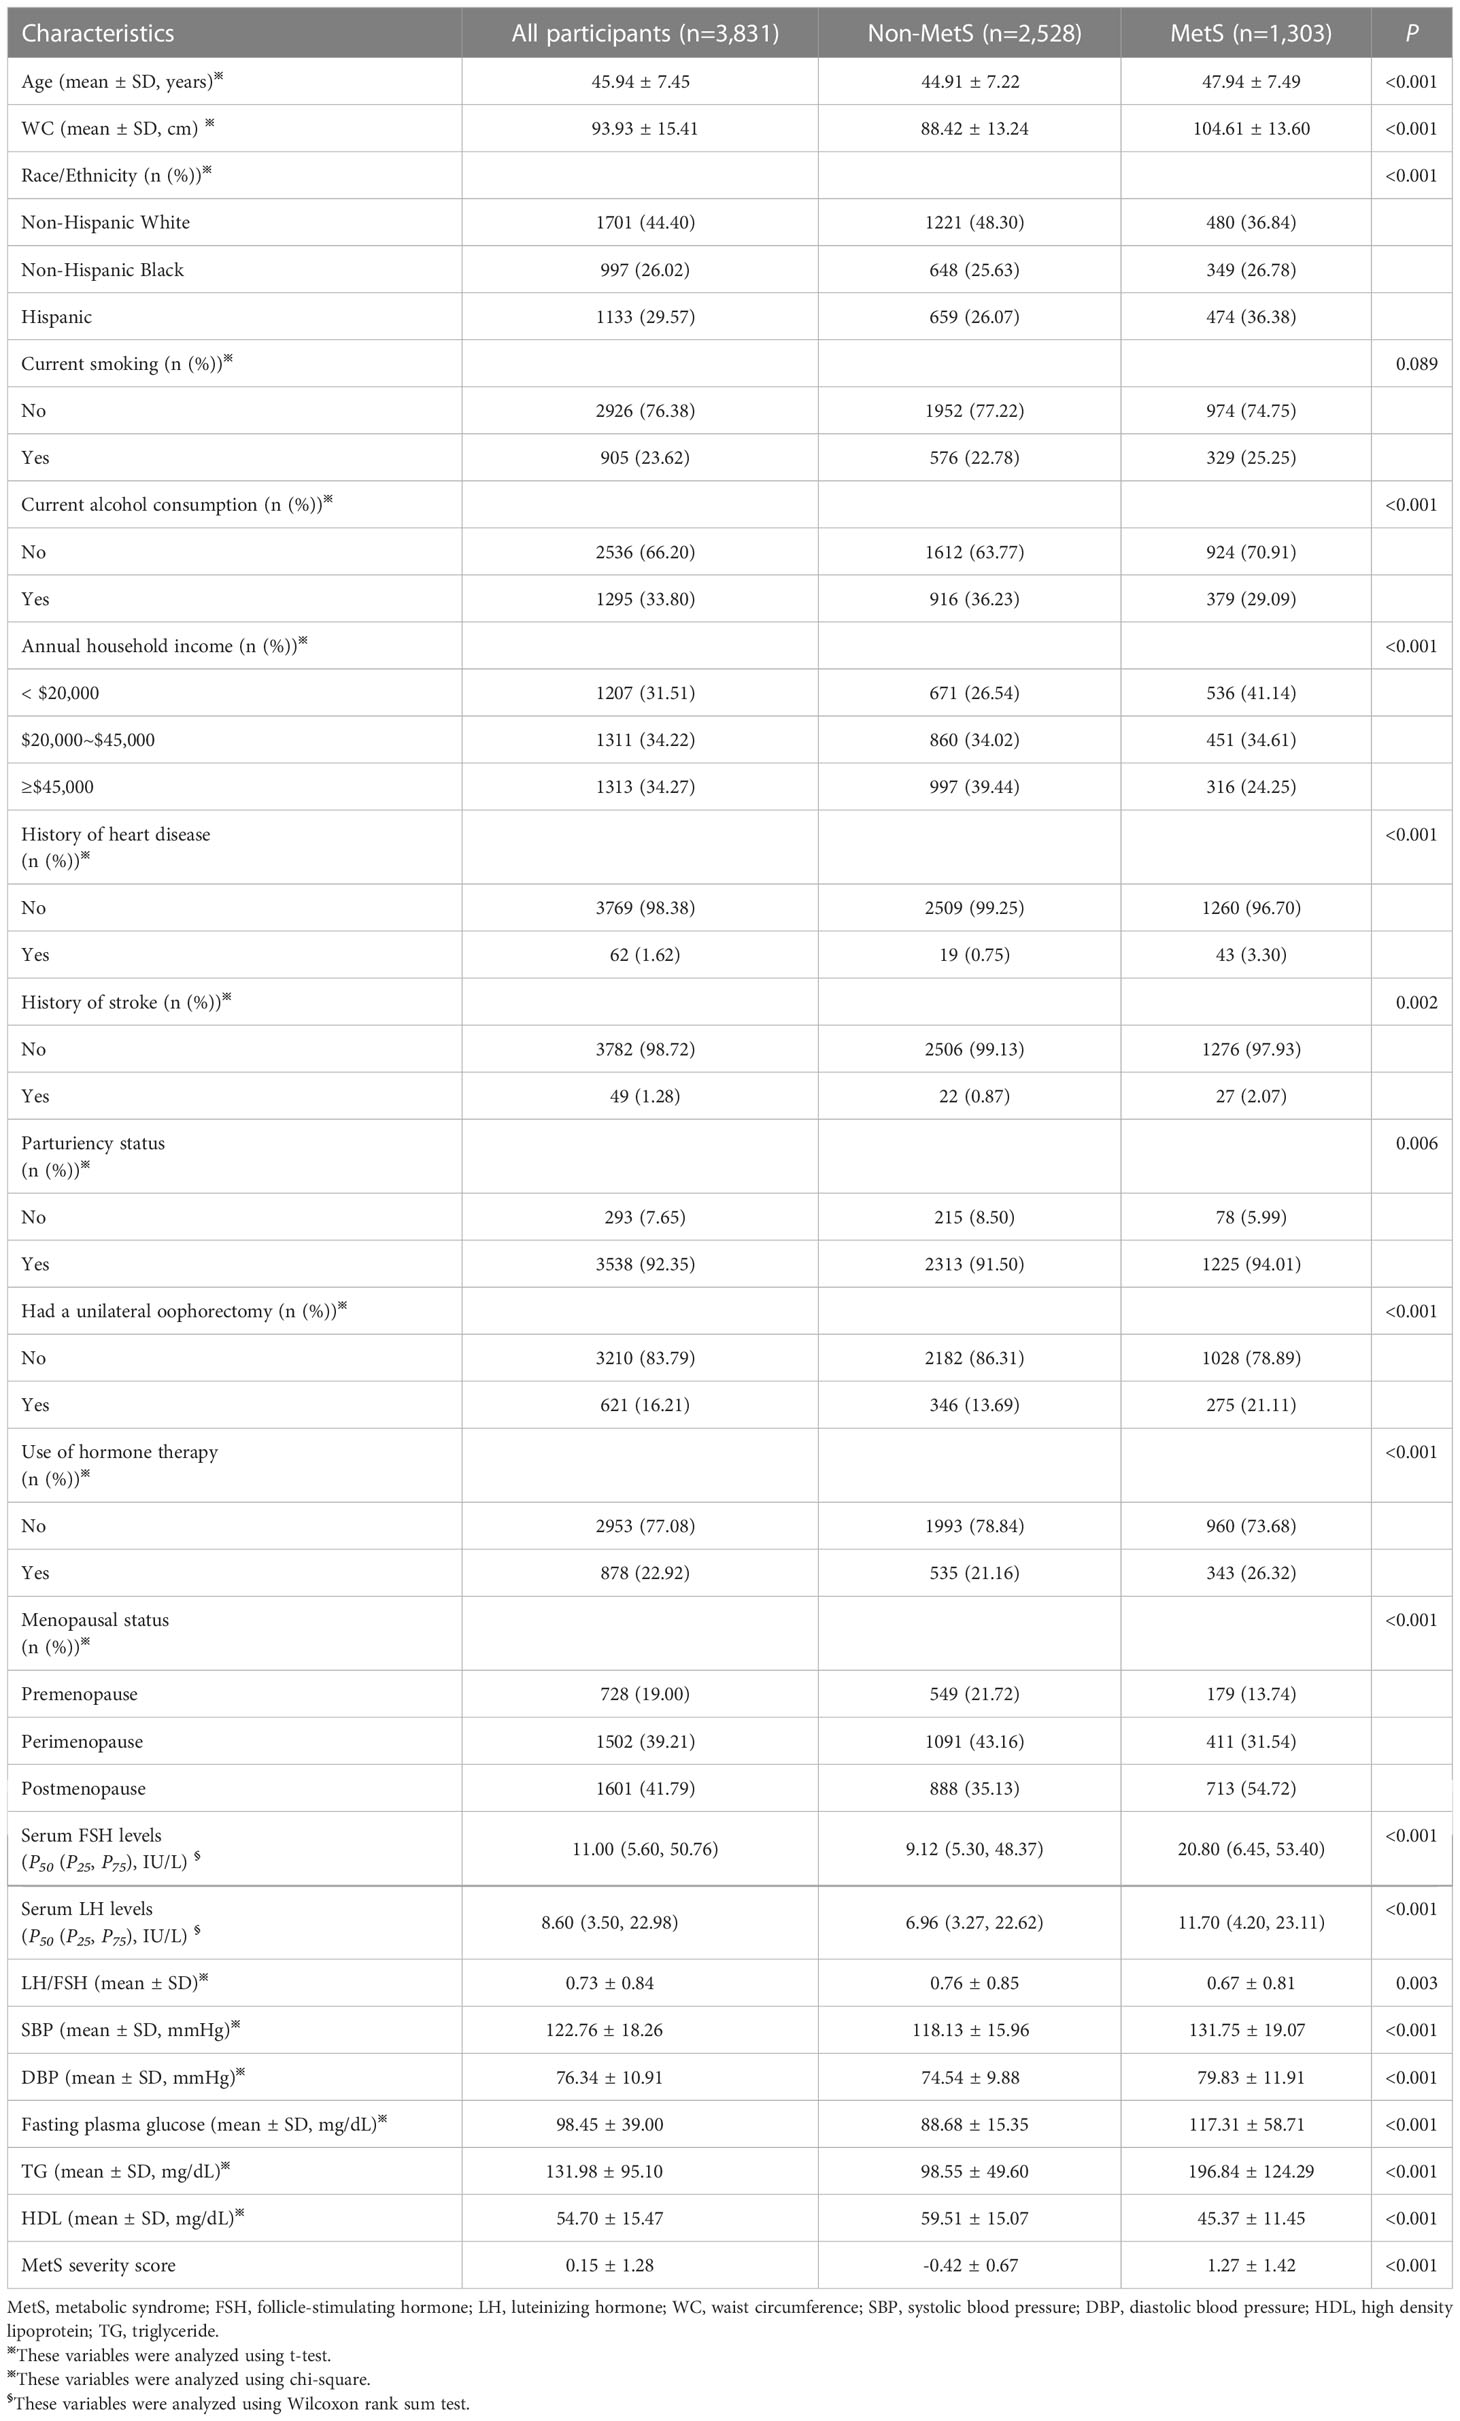
Table 1 Characteristics of all participants.
Associations of FSH, LH, and LH/FSH ratio with components of MetS
As shown in Table 2, increase in serum FSH and LH levels per 1 SD were linked to a lower risk of central obesity in pre-, peri-, and postmenopausal women. For other components of MetS, increase in serum FSH and LH levels per 1 SD were negatively associated with elevated TG, reduced HDL, and elevated plasma glucose only in postmenopausal women but not in pre- and perimenopausal women. Meanwhile, an increase in serum FSH levels per 1 SD was negatively associated with blood pressure in postmenopausal women (P= 0.012), while an increase in LH levels was negatively associated with blood pressure in perimenopausal women (P= 0.025). However, LH/FSH ratio was not associated with all components of MetS across the menopausal transition.

Table 2 The associations of FSH, LH, and LH/FSH with components of metabolic syndrome※.
Associations of FSH, LH, and LH/FSH ratio with the risk of MetS
The associations of FSH, LH, and LH/FSH ratio with MetS are displayed in Table 3. An increase in serum FSH levels was linked to a 22.6% lower risk of MetS only in postmenopausal women (OR: 0.774; 95% CI: 0.646, 0.929; and P= 0.006), but not in premenopausal women (P= 0.524) and perimenopausal women (P= 0.355). Similarly, an increase in serum LH levels was related to an 18.5% lower risk of MetS only in postmenopausal women (OR: 0.815; 95% CI: 0.690, 0.962; and P= 0.016), but not in premenopausal women (P= 0.469) and perimenopausal women (P= 0.426). However, no significant relationship between LH/FSH ratio and the prevalence of MetS was observed in pre-, peri-, and postmenopausal women (P= 0.710, 0.911, and 0.801).
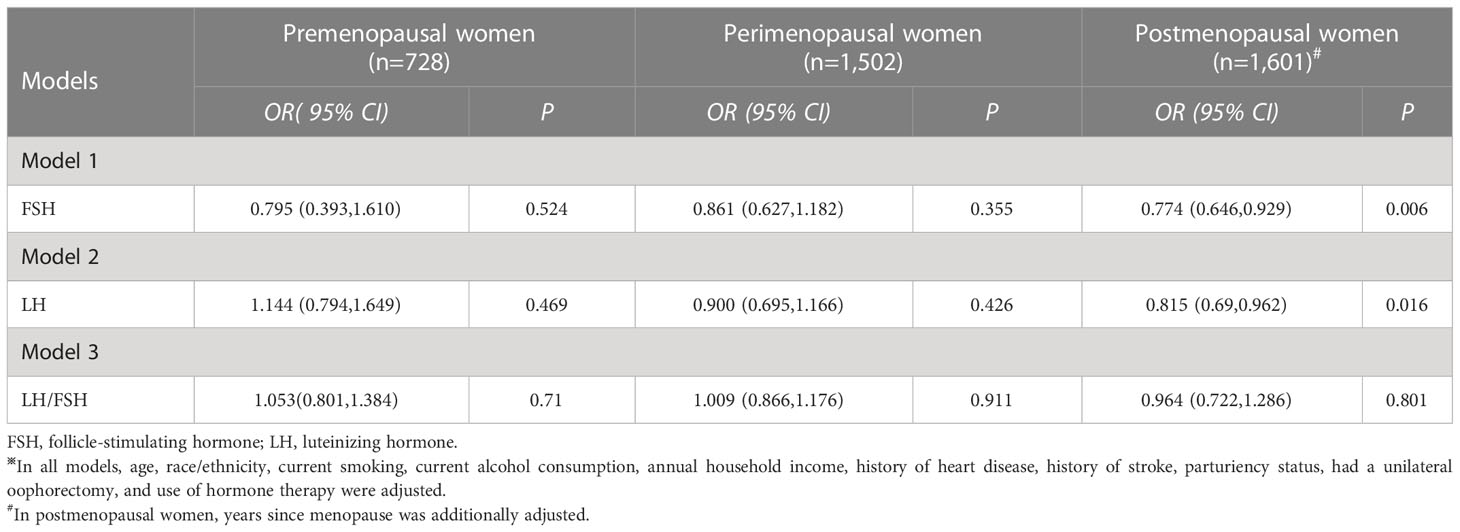
Table 3 The associations of FSH, LH, and LH/FSH with the risk of metabolic syndrome※.
The associations of serum FSH and LH quintiles with the prevalence of MetS are shown in Figure 2. No significant associations of serum FSH quintiles with the risk of MetS were observed both in pre- and perimenopausal women (P for trend= 0.517 and 0.173) as shown in Figures 2A, B. However, in postmenopausal women, compared to the lowest quintile of FSH, the second quintile of FSH was linked to a higher risk of MetS (OR: 1.452; 95% CI: 1.138, 1.766; and P= 0.020), but the fourth quintile of FSH was related to a lower risk of MetS (OR: 0.566; 95% CI: 0.228, 0.904; and P= 0.001) as shown in Figure 2C. Similarly, there were no significant associations of serum LH quintiles with MetS both in pre- and perimenopausal women (P for trend= 0.853 and 0.436) as shown in Figures 2D, E. However, a significant association of serum LH quintile with MetS was observed in postmenopausal women (P for trend= 0.002), and a negative association of fifth quintile of LH with the risk of MetS was observed (OR: 0.629; 95% CI: 0.342, 0.916; and P= 0.002) as shown in Figure 2F.

Figure 2 The associations of serum FSH and LH quintiles with the risk of MetS. (A, D) premenopausal women, (B, E) perimenopausal women, and (C, F) postmenopausal women.
Associations of FSH, LH, and LH/FSH ratio with MetS severity score
Table 4 shows the associations of FSH, LH, and LH/FSH ratio with MetS severity score. No significant association of serum FSH levels per 1 SD change with MetS severity score was observed in premenopausal women (b: -0.064; 95% CI: -1.697,-0.228; and P= 0.569). However, an increase in serum FSH levels was associated with a decrease of -0.157 (95% CI: -2.967,-2.034) in MetS severity score in perimenopausal women and -0.195 (95% CI: -2.192,-1.023) in postmenopausal women. Similarly, an increase in serum LH levels was linked to a decrease of -0.078 (95% CI: -2.688,-1.806) in MetS severity score in perimenopausal women and -0.098 (95% CI: -1.884,-0.733) in postmenopausal women. However, LH/FSH ratio has no concern with MetS severity score in pre-, peri-, and postmenopausal women (P= 0.095, 0.208, and 0.843).
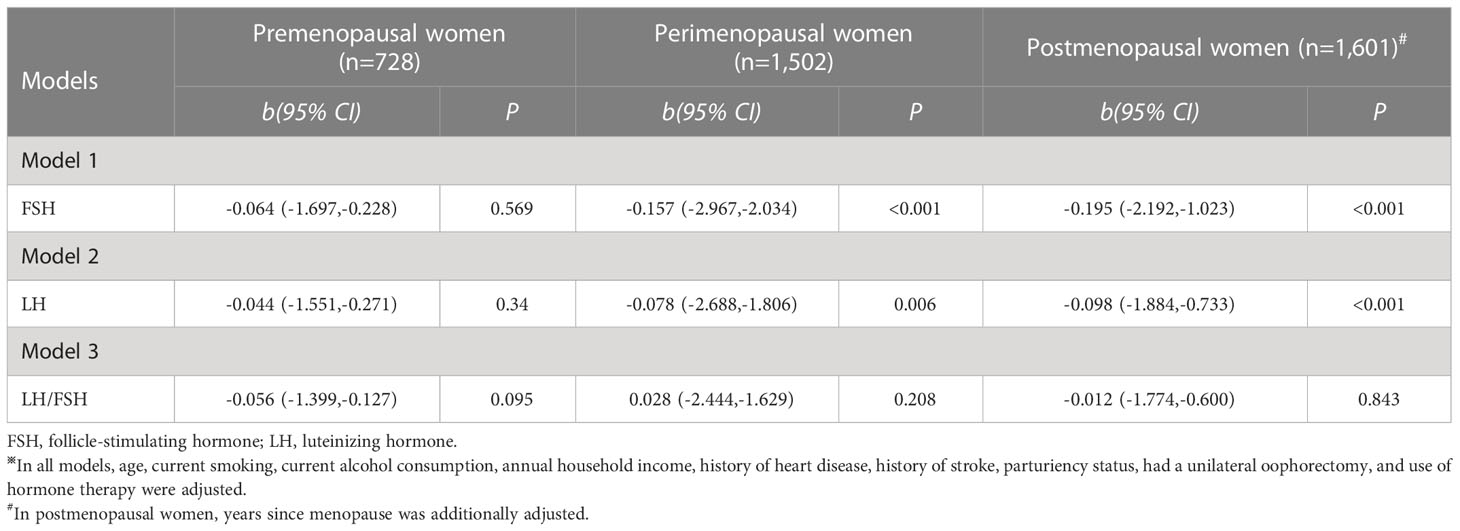
Table 4 The associations of FSH, LH, and LH/FSH with metabolic syndrome severity score※.
Figure 3 shows the associations of serum FSH and LH quintiles with MetS severity score. There was significant associations of serum FSH quintile with MetS severity score only in postmenopausal women (P for trend< 0.001, as shown in Figure 3C). Compared to the lowest quintile of FSH, only the fourth (b: -0.496; 95% CI: -0.706, -0.286; and P < 0.001) and fifth (b: -0.474; 95% CI: -0.684, -0.264; and P < 0.001) quintiles of FSH were associated with a lower Met severity score. Similarly, a significant association of serum LH quintiles with MetS severity score was observed in postmenopausal women (Figure 3F). Furthermore, only the fourth (b: -0.361; 95% CI: -0.584, -0.139; and P= 0.002) and fifth (b: -0.454; 95% CI: -0.652, -0.256; and P < 0.001) quintiles of LH were associated with a lower Met severity score in postmenopausal women.
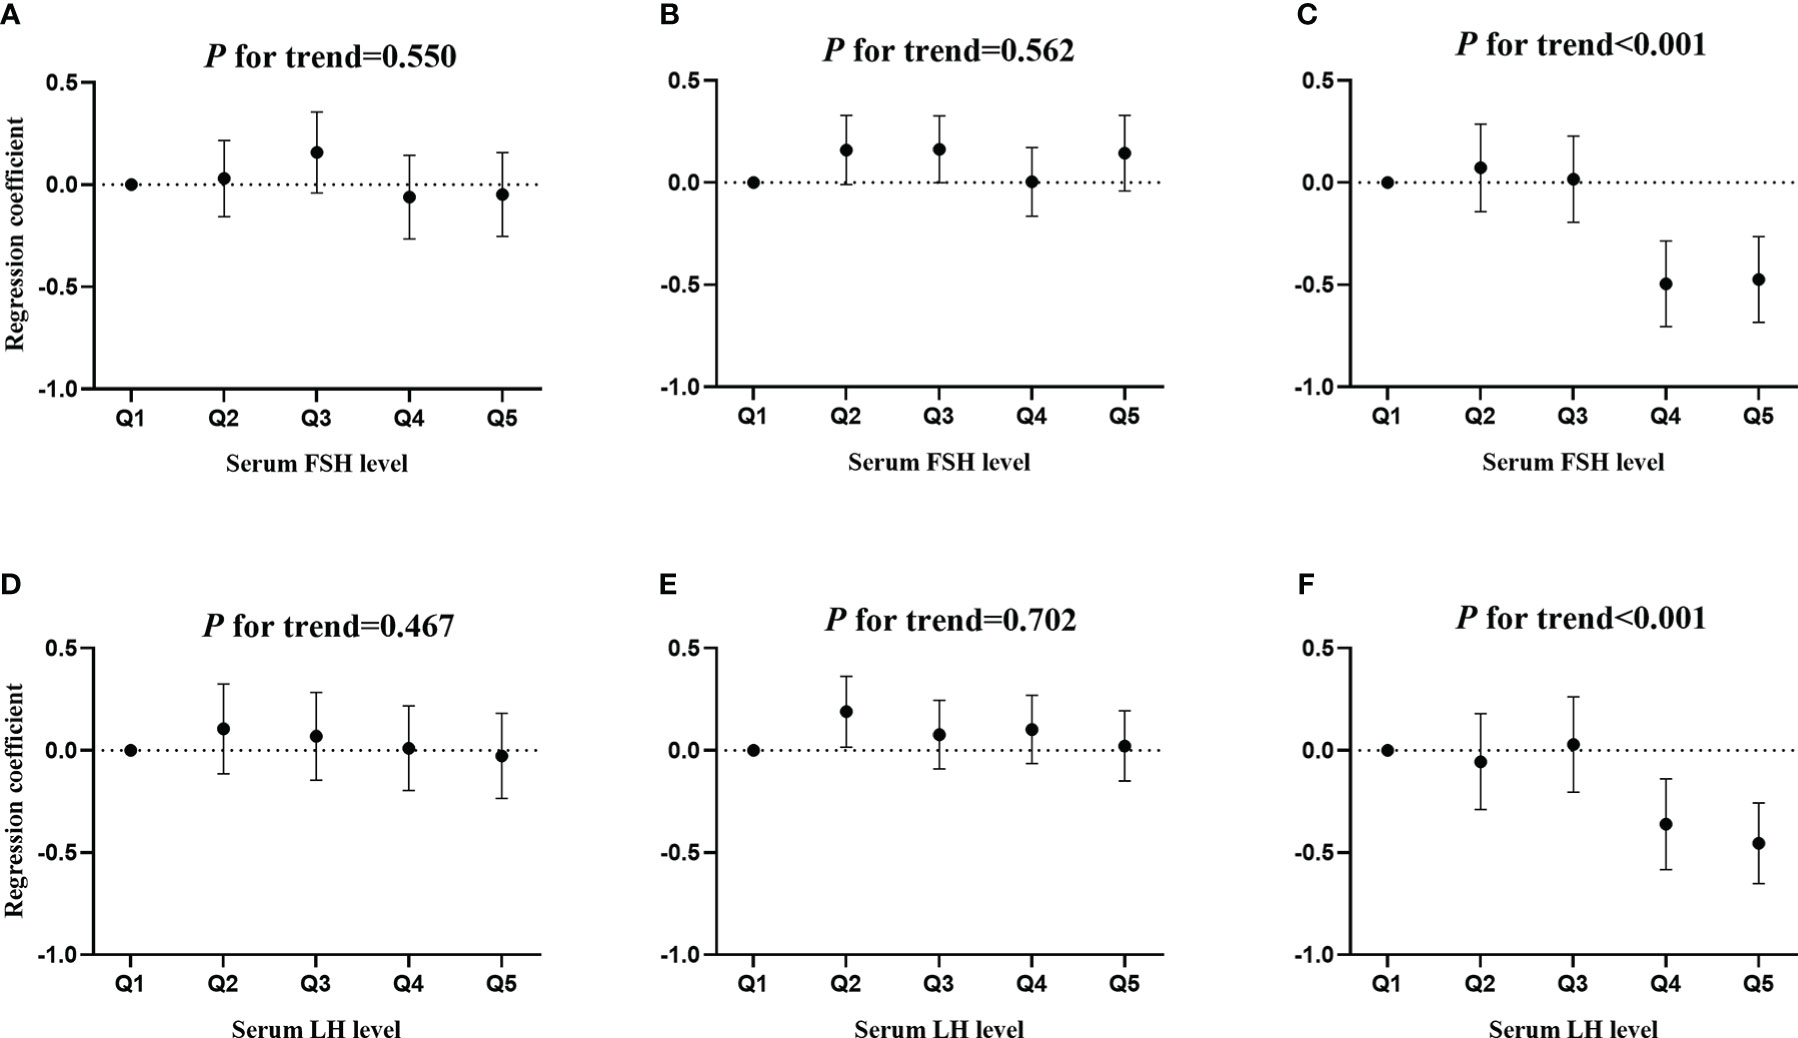
Figure 3 The associations of serum FSH and LH quintiles with MetS severity score. (A, D) premenopausal women, (B, E) perimenopausal women, and (C, F) postmenopausal women.
Sensitivity analysis
The associations of serum FSH and LH levels with the risk of MetS and MetS severity score using multiple imputation dataset are displayed in Supplemental Tables S1, S2. An increase in serum FSH levels was associated with a 25.0% (OR: 0.750; 95% CI: 0.965, 0.535; and P= 0.011) lower risk of MetS in perimenopausal women and 21.9% (OR: 0.781; 95% CI: 0.916, 0.646; and P= 0.003) in postmenopausal women. Meanwhile, an increase in serum LH levels was associated with an 18.7% (OR: 0.813; 95% CI: 0.675, 0.951; and P= 0.013) lower risk of MetS in postmenopausal women. Similarly, both serum FSH and LH levels were negatively associated with MetS severity score in peri- and postmenopausal women, which was consistent with the main results.
Discussion
In this study, a cross-sectional study was designed to assess the associations of serum FSH and LH levels and LH/FSH ratio with the risk of MetS and MetS severity score in women across the menopausal transition. Elevated serum FSH and LH levels had connections with a lower risk of MetS only in postmenopausal women. Meanwhile, there were negative associations of serum FSH and LH levels with MetS severity score in peri- and postmenopausal women, but not in premenopausal women. However, LH/FSH ratio had no connections with the risk of MetS and MetS severity score across the menopausal transition.
In this study, it was found that elevated serum FSH levels were linked to a decreased risk of MetS in postmenopausal women, which was in line with previous studies (9, 11, 12, 22, 23). Since MetS is a cluster of cardiometabolic risk factors including central obesity, blood pressure, blood sugar and TG, and HDL cholesterol, the association of serum FSH levels with MetS was mostly dependent of the associations of serum FSH levels with the components of MetS (24, 25). In this study, higher FSH levels were related to lower WC, TG, blood pressure, and plasma glucose in postmenopausal women. As a result, it was rational that there was a negative link between serum FSH levels and MetS. However, a few previous studies declared that FSH can promote lipid biosynthesis and visceral fat accumulation, and was positively related to fat mass (26–29). It seems that the results of this study were inconsistent with previous studies. Therefore, further longitudinal study should be well designed to confirm the relationship between serum FSH levels and the risk of MetS.
Furthermore, previous studies found a negative relationship between serum FSH levels and diabetes in postmenopausal women, which supported the finding of this study and might partly attribute to adiposity, insulin resistance, and inflammatory factors caused by FSH in the pathogenesis of diabetes (30, 31). On the other hand, it was reported that lower FSH levels were related to a higher blood pressure, which was consistent with the finding of this study (9, 11).
Another finding of this study was that serum FSH levels have concern with MetS only in postmenopausal women, but not in pre- and perimenopausal women. It was speculated that cardiovascular metabolic factors are protected by estrogen before menopause but not during the menopausal transition and beyond (32–34). On the other hand, the association of serum FSH levels with MetS severity score showed that there were significant associations in both peri- and postmenopausal women, but not in premenopausal women. These different associations might attribute to the impact of race/ethnicity on sex hormones and MetS. It was well documented that sex hormones trajectories and the incidence of MetS were not uniform across different race/ethnicity subgroups over the menopausal transition (13, 35). Since MetS severity score was calculated according to race/ethnicity- specific subgroups, there was no impact of race/ethnicity on the associations of serum FSH and LH quintiles with MetS severity score. Meanwhile, this might explain the differences between the associations of serum FSH and LH levels with the risk of MetS and the associations of serum FSH and LH levels with MetS severity score.
Furthermore, similar to FSH, serum LH levels were also negatively related to the risk of MetS only in postmenopausal women. FSH and LH act by pituitary–ovarian axis and change synchronously during the menopausal transition. Furthermore, both serum FSH and LH levels are regulated by the steroid hormones through feedback loop mechanisms (36). Therefore, it was reasonable that there were similar associations of serum FSH and LH levels with MetS. In this study, no significant relationships between LH/FSH ratio and the risk of MetS and MetS severity score were observed across the menopausal transition. Therefore, LH/FSH ratio might not be a potentially effective predictor of MetS in women. The underlying mechanisms on the associations of serum FSH and LH levels and LH/FSH ratio with the risk of MetS and MetS severity score need be further investigated in the future.
Strengths and limitations
This study had some strengths. Firstly, this study provided a comprehensive investigation on the associations of serum FSH levels with MetS and MetS severity score at the full range of reproductive aging. Secondly, this study firstly examined the associations of serum LH levels and LH/FSH ratio with the risk of MetS and MetS severity score across the menopausal transition. Therefore, this study will provide additional evidence for the prevention of MetS across the menopausal transition. However, there were also some limitations in this study. Firstly, a cross-sectional design was used in this study. It is difficult to establish the temporal associations of serum FSH and LH levels with MetS. Secondly, due to lack of data of serum estrogen levels in women aged 35-60 years in the NHANES, serum estrogen levels were not adjusted in this study. Thirdly, the underlying mechanisms on the associations of serum FSH and LH levels with MetS were not fully explained in this study. Fourthly, fasting blood samples were collected to assay serum FSH and LH levels in a random time but not a specific time. Therefore, there might be fluctuation in serum FSH and LH levels during different phases of menstrual cycle in premenopausal women.
In conclusion, elevated serum FSH and LH levels were linked to a lower risk of MetS only in postmenopausal women, but not in pre- and perimenopausal women. Meanwhile, negative associations of serum FSH and LH levels with MetS severity score were observed in peri- and postmenopausal women. However, LH/FSH ratio was not associated with the risk of MetS and MetS severity score across the menopausal transition. Identifying the associations of FSH and LH with the risk of MetS may help identify women at risk of MetS according to serum FSH and LH levels and contribute to the precision prevention of MetS.
Data availability statement
The datasets presented in this study can be found in online repositories. The names of the repository/repositories and accession number(s) can be found below: https://www.cdc.gov/nchs/index.htm.
Ethics statement
The studies involving human participants were reviewed and approved by NHANES Institutional Review Board (1999-2002: Protocol #98-12). The patients/participants provided their written informed consent to participate in this study.
Author contributions
CW and BS contributed to writing the original draft. BW and XiL contributed to review and editing the draft. BG, YeC, JZ, and XuL contributed to formal analysis and results interpretation. YoC contributed to study design and conceptualization. All authors contributed to the article and approved the submitted version.
Funding
This study was supported by the National Natural Science Foundation of China (81903416).
Conflict of interest
The authors declare that the research was conducted in the absence of any commercial or financial relationships that could be construed as a potential conflict of interest.
Publisher’s note
All claims expressed in this article are solely those of the authors and do not necessarily represent those of their affiliated organizations, or those of the publisher, the editors and the reviewers. Any product that may be evaluated in this article, or claim that may be made by its manufacturer, is not guaranteed or endorsed by the publisher.
Supplementary material
The Supplementary Material for this article can be found online at: https://www.frontiersin.org/articles/10.3389/fendo.2023.1034934/full#supplementary-material
References
1. Alberti KG, Eckel RH, Grundy SM, Zimmet PZ, Cleeman JI, Donato KA, et al. Harmonizing the metabolic syndrome: A joint interim statement of the international diabetes federation task force on epidemiology and prevention; national heart, lung, and blood institute; American heart association; world heart federation; international atherosclerosis society; and international association for the study of obesity. Circulation (2009) 120(16):1640–5. doi: 10.1161/CIRCULATIONAHA.109.192644
2. Hirode G, Wong RJ. Trends in the prevalence of metabolic syndrome in the united states, 2011-2016. JAMA J Am Med Assoc (2020) 323(24):2526–8. doi: 10.1001/jama.2020.4501
3. Atsma F, Bartelink ML, Grobbee DE, van der Schouw YT. Postmenopausal status and early menopause as independent risk factors for cardiovascular disease: A meta-analysis. Menopause (2006) 13(2):265–79. doi: 10.1097/01.gme.0000218683.97338.ea
4. Stefanska A, Bergmann K, Sypniewska G. Metabolic syndrome and menopause: Pathophysiology, clinical and diagnostic significance. Adv Clin Chem (2015) 72:1–75. doi: 10.1016/bs.acc.2015.07.001
5. Park YW, Zhu S, Palaniappan L, Heshka S, Carnethon MR, Heymsfield SB. The metabolic syndrome: Prevalence and associated risk factor findings in the US population from the third national health and nutrition examination survey, 1988-1994. Arch Internal Med (2003) 163(4):427–36. doi: 10.1001/archinte.163.4.427
6. Creatsa M, Armeni E, Stamatelopoulos K, Rizos D, Georgiopoulos G, Kazani M, et al. Circulating androgen levels are associated with subclinical atherosclerosis and arterial stiffness in healthy recently menopausal women. Metab: Clin Experiment (2012) 61(2):193–201. doi: 10.1016/j.metabol.2011.06.005
7. Litwak SA, Wilson JL, Chen W, Garcia-Rudaz C, Khaksari M, Cowley MA, et al. Estradiol prevents fat accumulation and overcomes leptin resistance in female high-fat diet mice. Endocrinology (2014) 155(11):4447–60. doi: 10.1210/en.2014-1342
8. Olszanecka A, Kawecka-Jaszcz K, Czarnecka D. Association of free testosterone and sex hormone binding globulin with metabolic syndrome and subclinical atherosclerosis but not blood pressure in hypertensive perimenopausal women. Arch Med Sci (2016) 12(3):521–8. doi: 10.5114/aoms.2016.59925
9. Zhang C, Zhao M, Li Z, Song Y. Follicle-stimulating hormone positively associates with metabolic factors in perimenopausal women. Int J Endocrinol (2020) 2020:7024321. doi: 10.1155/2020/7024321
10. Ambre JJ. Cocaine-induced coronary-artery constriction. New Engl J Med (1990) 322(17):1235–7. doi: 10.1056/NEJM199004263221714.
11. Wang N, Shao H, Chen Y, Xia F, Chi C, Li Q, et al. Follicle-stimulating hormone, its association with cardiometabolic risk factors, and 10-year risk of cardiovascular disease in postmenopausal women. J Am Heart Assoc (2017) 6(9):e005918. doi: 10.1161/JAHA.117.005918
12. Stefanska A, Sypniewska G, Ponikowska I, Cwiklinska-Jurkowska M. Association of follicle-stimulating hormone and sex hormone binding globulin with the metabolic syndrome in postmenopausal women. Clin Biochem (2012) 45(9):703–6. doi: 10.1016/j.clinbiochem.2012.03.011
13. Gaillard T, Schuster D, Osei K. Differential impact of serum glucose, triglycerides, and high-density lipoprotein cholesterol on cardiovascular risk factor burden in nondiabetic, obese African American women: Implications for the prevalence of metabolic syndrome. Metab: Clin Experiment (2010) 59(8):1115–23. doi: 10.1016/j.metabol.2009.09.035
14. Walker SE, Gurka MJ, Oliver MN, Johns DW, DeBoer MD. Racial/ethnic discrepancies in the metabolic syndrome begin in childhood and persist after adjustment for environmental factors. Nutr Metab Cardiovasc Dis (2012) 22(2):141–8. doi: 10.1016/j.numecd.2010.05.006
15. Sumner AE, Cowie CC. Ethnic differences in the ability of triglyceride levels to identify insulin resistance. Atherosclerosis (2008) 196(2):696–703. doi: 10.1016/j.atherosclerosis.2006.12.018
16. Lee S, Bacha F, Gungor N, Arslanian SA. Racial differences in adiponectin in youth: relationship to visceral fat and insulin sensitivity. Diabetes Care (2006) 29(1):51–6. doi: 10.2337/diacare.29.01.06.dc05-0952
17. Grundy SM, Cleeman JI, Daniels SR, Donato KA, Eckel RH, Franklin BA, et al. Diagnosis and management of the metabolic syndrome: an American heart Association/National heart, lung, and blood institute scientific statement. Circulation (2005) 112(17):2735–52. doi: 10.1161/CIRCULATIONAHA.105.169404
18. Gurka MJ, Lilly CL, Oliver MN, DeBoer MD. An examination of sex and racial/ethnic differences in the metabolic syndrome among adults: a confirmatory factor analysis and a resulting continuous severity score. Metab: Clin Experiment (2014) 63(2):218–25. doi: 10.1016/j.metabol.2013.10.006
19. Gurka MJ, Ice CL, Sun SS, Deboer MD. A confirmatory factor analysis of the metabolic syndrome in adolescents: an examination of sex and racial/ethnic differences. Cardiovasc Diabetol (2012) 11:128. doi: 10.1186/1475-2840-11-128
20. Wang Q, Ferreira DLS, Nelson SM, Sattar N, Ala-Korpela M, Lawlor DA. Metabolic characterization of menopause: Cross-sectional and longitudinal evidence. BMC Med (2018) 16(1):17. doi: 10.1186/s12916-018-1008-8
21. Harlow SD, Gass M, Hall JE, Lobo R, Maki P, Rebar RW, et al. Executive summary of the stages of reproductive aging workshop + 10: addressing the unfinished agenda of staging reproductive aging. J Clin Endocrinol Metab (2012) 97(4):1159–68. doi: 10.1210/jc.2011-3362
22. Jung ES, Choi EK, Park BH, Chae SW. Serum follicle-stimulating hormone levels are associated with cardiometabolic risk factors in post-menopausal Korean women. J Clin Med (2020) 9(4):1161. doi: 10.3390/jcm9041161
23. Stefanska A, Ponikowska I, Cwiklinska-Jurkowska M, Sypniewska G. Association of FSH with metabolic syndrome in postmenopausal women: a comparison with CRP, adiponectin and leptin. biomark Med (2014) 8(7):921–30. doi: 10.2217/bmm.14.49
24. DeBoer MD, Gurka MJ. Ability among adolescents for the metabolic syndrome to predict elevations in factors associated with type 2 diabetes and cardiovascular disease: data from the national health and nutrition examination survey 1999-2006. Metab Syndr Relat Disord (2010) 8(4):343–53. doi: 10.1089/met.2010.0008
25. Veldhuis-Vlug AG, Woods GN, Sigurdsson S, Ewing SK, Le PT, Hue TF, et al. Serum FSH is associated with BMD, bone marrow adiposity, and body composition in the AGES-Reykjavik study of older adults. J Clin Endocrinol Metab (2021) 106(3):e1156–e69. doi: 10.1210/clinem/dgaa922
26. Liu XM, Chan HC, Ding GL, Cai J, Song Y, Wang TT, et al. FSH regulates fat accumulation and redistribution in aging through the Galphai/Ca(2+)/CREB pathway. Aging Cell (2015) 14(3):409–20. doi: 10.1111/acel.12331
27. Liu P, Ji Y, Yuen T, Rendina-Ruedy E, DeMambro VE, Dhawan S, et al. Blocking FSH induces thermogenic adipose tissue and reduces body fat. Nature (2017) 546(7656):107–12. doi: 10.1038/nature22342
28. Gera S, Sant D, Haider S, Korkmaz F, Kuo TC, Mathew M, et al. First-in-class humanized FSH blocking antibody targets bone and fat. Proc Natl Acad Sci United States Am (2020) 117(46):28971–9. doi: 10.1073/pnas.2014588117
29. Han X, Meng F, Cao X, Du X, Bu G, Kong F, et al. FSH promotes fat accumulation by activating PPARgamma signaling in surgically castrated, but not immunocastrated, male pigs. Theriogenology (2021) 160:10–7. doi: 10.1016/j.theriogenology.2020.10.029
30. Wang N, Kuang L, Han B, Li Q, Chen Y, Zhu C, et al. Follicle-stimulating hormone associates with prediabetes and diabetes in postmenopausal women. Acta Diabetol (2016) 53(2):227–36. doi: 10.1007/s00592-015-0769-1
31. Watanobe H, Hayakawa Y. Hypothalamic interleukin-1 beta and tumor necrosis factor-alpha, but not interleukin-6, mediate the endotoxin-induced suppression of the reproductive axis in rats. Endocrinology (2003) 144(11):4868–75. doi: 10.1210/en.2003-0644
32. Barrett-Connor E. Clinical review 162: cardiovascular endocrinology 3: an epidemiologist looks at hormones and heart disease in women. J Clin Endocrinol Metab (2003) 88(9):4031–42. doi: 10.1210/jc.2003-030876
33. Scarabin-Carre V, Canonico M, Brailly-Tabard S, Trabado S, Ducimetiere P, Giroud M, et al. High level of plasma estradiol as a new predictor of ischemic arterial disease in older postmenopausal women: the three-city cohort study. J Am Heart Assoc (2012) 1(3):e001388. doi: 10.1161/JAHA.112.001388
34. El Khoudary SR. Gaps, limitations and new insights on endogenous estrogen and follicle stimulating hormone as related to risk of cardiovascular disease in women traversing the menopause: A narrative review. Maturitas (2017) 104:44–53. doi: 10.1016/j.maturitas.2017.08.003
35. Tepper PG, Randolph JF Jr., McConnell DS, Crawford SL, El Khoudary SR, Joffe H, et al. Trajectory clustering of estradiol and follicle-stimulating hormone during the menopausal transition among women in the study of women's health across the nation (SWAN). J Clin Endocrinol Metab (2012) 97(8):2872–80. doi: 10.1210/jc.2012-1422
Keywords: luteinizing hormone, metabolic syndrome, metabolic syndrome severity score, menopausal transition, follicle-stimulating hormone
Citation: Chen Y, Wang C, Sun B, Wang B, Lu X, Gao B, Cao Y, Zhou J and Liu X (2023) Associations of follicle-stimulating hormone and luteinizing hormone with metabolic syndrome during the menopausal transition from the National Health and Nutrition Examination Survey. Front. Endocrinol. 14:1034934. doi: 10.3389/fendo.2023.1034934
Received: 06 September 2022; Accepted: 31 January 2023;
Published: 09 February 2023.
Edited by:
Marc R. Blackman, United States Department of Veterans Affairs, United StatesReviewed by:
Ruth Clapauch, UNILAGO, BrazilChaofu Ke, Soochow University, China
Anna Stefańska, Nicolaus Copernicus University in Toruń, Poland
Yang Yang, Fudan University, China
Copyright © 2023 Chen, Wang, Sun, Wang, Lu, Gao, Cao, Zhou and Liu. This is an open-access article distributed under the terms of the Creative Commons Attribution License (CC BY). The use, distribution or reproduction in other forums is permitted, provided the original author(s) and the copyright owner(s) are credited and that the original publication in this journal is cited, in accordance with accepted academic practice. No use, distribution or reproduction is permitted which does not comply with these terms.
*Correspondence: Yongjie Chen, Y2hlbnlvbmdqaWVAdG11LmVkdS5jbg==