
95% of researchers rate our articles as excellent or good
Learn more about the work of our research integrity team to safeguard the quality of each article we publish.
Find out more
ORIGINAL RESEARCH article
Front. Endocrinol. , 15 September 2022
Sec. Obesity
Volume 13 - 2022 | https://doi.org/10.3389/fendo.2022.976998
This article is part of the Research Topic Modifiable Risk Factors and Interventions in Early Life for Cardiometabolic Health View all 7 articles
 Liwang Gao1†
 Hong Cheng2†
 Yinkun Yan1
 Junting Liu2Xinying Shan2Xi Wang1
 Jie Mi1,2* on behalf of China Child Adolescent Cardiovascular Health (CCACH) Collaboration Group
Objective: To evaluate the prevalence of hyperglycemia and dyslipidemia among different body composition and investigate the associations of body composition indicators, especially the muscle mass, with glucose and lipids metabolism in children and adolescents.
Methods: This nationwide cross-sectional study included 8,905 children and adolescents aged 6 to 18 years. All participants underwent dual-energy x-ray absorptiometry and their blood-concentrated glucose and lipids (including TC, TG, LDL-C and HDL-c) were measured. Mixed model, hierarchical analysis, and piecewise regression were used to study the effect of body composition indicators, especially the muscle mass, on glucose and lipids metabolism.
Results: The greatest prevalence of high total cholesterol (TC, 6.9% and 6.9%) and high triglyceride (22.3% and 6.6%) was found in both boys and girls with high muscle mass and high fat mass, and girls with high muscle mass and high fat mass also had the highest prevalence of hyperglycemia (7.1%). After fat stratification, higher muscle mass was associated with lower odds of hyperglycemia (OR = 0.62; 95%CI: 0.46,0.84; P = 0.002) and muscle mass was inversely associated with TC (β = −0.07; 95%CI: -0.12,-0.03; P < 0.001) in boys with normal fat mass, but high muscle mass was not significantly associated with hyperglycemia and TC in high-fat-mass group (P = 0.368 and 0.372).
Conclusions: The body composition phenotype of high muscle and high fat mass have the highest prevalence of dysglycemia and dyslipidemia. Higher muscle mass was associated with a lower risk of hyperglycemia and TC levels in individuals only with normal fat mass.
With the dramatic increase in childhood obesity globally and in China, the risk of abnormal glucose and lipid metabolism in the early stages of the cardiovascular disease chain is expected to accelerate (1–3). Despite the strong association between higher body mass index (BMI) and abnormal glucose and lipid metabolism (4, 5), obesity defined by BMI is known as a heterogeneous condition with different cardiometabolic risk among same-weight status (6).
BMI is limited by not discriminating body composition, and individuals with the same BMI status have broad variations in body composition (7, 8). This is important because fat and muscle confers different cardiovascular risk (9). Determining the effect of body composition on the development of abnormal glucose and lipid metabolism can help to understand the mechanism of obesity-induced cardiometabolic abnormalities and prevent cardiovascular disease (10). Previous studies have reported the impact of accumulation of fat in relation to glucose and lipids metabolism (11, 12), and review articles have investigated the association of muscle mass with metabolic abnormalities (13). However, the above articles separately studied the effects of fat or muscle on glucose and lipid metabolism, and whether body composition would affect glycolipid metabolism in children and adolescents remains unclear. In addition, the association of muscle mass with metabolic abnormalities is inconsistent, which may be related to inconsistent body composition measurement techniques and failure to control for potential biological and lifestyle confounders (13).
Furthermore, it has been found that fat has a negative effect on muscle in children (14, 15). The increase in body fat mass, especially the increase of fatty acids and inflammatory molecules in visceral adipose tissue, can induce muscle inflammation and negatively regulate muscle cell metabolism (16). But it is not known whether the association of muscle mass with glucose and lipids metabolism is consistent in normal-fat mass and high-fat mass. Based on that, we hypothesized that different body composition has different risk of abnormal glucose and lipid metabolism, and the protective effect of muscle on glucose and lipid metabolism is affected by body fat mass accumulation.
Therefore, we evaluated the prevalence of hyperglycemia and dyslipidemia in different body compositions and examined associations of body composition [assessed by whole-body dual-energy X-ray absorptiometry (DXA)] with glucose and lipids metabolism in large-scale cross-sectional data of children and adolescents aged 6-18 years, especially focusing on the effect of muscle mass.
The present study used data from the China Child and Adolescent Cardiovascular Health (CCACH) study, a nationally cross-sectional survey conducted between January 1, 2013, and December 31, 2015. The CCACH study, which included four cities in the northern region (Beijing, Changchun, Jinan, and Yinchuan) and three cities in the southern region (Shanghai, Chongqing, and Chengdu) of China, was designed to examine the cardiovascular health of school-age children and adolescents in China; the details of the study methods have been published elsewhere (17, 18). To assess the relationship between body composition and glucose and lipids metabolism, the data from 11,169 participants who underwent DXA were examined. Among them, those with missing data for glucose and lipids (n = 2,264) were excluded from the analyses. Ultimately, 8,905 participants were included in the analyses.
This study protocol was approved by the ethics committee of the Capital Institute of Pediatrics (approval number: 2012062), and written informed consent was obtained from all participants and/or their parents.
Body composition was measured using whole-body DXA (Hologic Explorer, Hologic Inc., Bedford, MA, USA) by a trained technician according to a standardized protocol. Before the DXA scan, the phantom was verified every other day according to the manufacturer’s guidelines, and participants were required to wear light clothing and remove all metal jewelry, plastic, and rubber materials. Fat mass index (FMI) was calculated as whole-fat mass (kg) divided by the square of height (m2), and muscle mass index (MMI) was calculated as whole lean mass (kg) excluding bone mineral content (kg) divided by height squared (m2).
Wall-mounted stadiometers and Beam scales were used to measure standing height and weight, respectively. Participants were barefoot during height measurement, and they were asked to remove any heavy clothing during weight measurement. Waist measurements are available elsewhere (19).
After an overnight fast (at least 10 hours), venous blood samples were collected by direct venipuncture into ethylene diamine tetraacetic acid (EDTA) anticoagulant tube, after which they were centrifuged for 10 minutes at 1509.3 × g at 4°C. The plasma samples from each study site were transported by air in the form of dry ice preservation to the central clinical laboratory of the Capital Institute of Pediatrics, where the specimens were stored at -80°C until the laboratory tests. Fasting plasma glucose (FPG) (enzyme hexokinase method) and lipids (enzymatic methods or direct method) were measured using an autoanalyzer (Hitachi 7080, Tokyo, Japan). Fasting insulin was determined by RIA (Cisbio Bioassays), which had no cross-reactivity with proinsulin. All the intra- and inter-assay coefficients of variation were <5% and <10%, respectively.
The sex- and age-specific BMI (weight in kilograms divided by height in meters squared) cutoff values recommended by the International Obesity Task Force were used to define weight status (normal weight, overweight, obesity) (20). Hyperglycemia was defined as FPG ≥ 6.1 mmol/L or taking antihyperglycemic medications (21). Insulin resistance was defined following the World Health Organization as values in the highest quartile of homeostasis model assessment of insulin resistance (HOMA-IR) (21), which was calculated with the following formula: fasting insulin (mU/L) × FPG (mmol/L)/22.5. Dyslipidemia, including high TC, high TG, high low-density lipoprotein cholesterol (LDL-C), low high-density lipoprotein cholesterol (HDL-C), and high non-HDL-C, was defined by the sex and age-specific lipoprotein cutoffs based on Chinese children and adolescents (22), or taking lipid-lowering medications.
For statistical analyses, the following data were further collected: resident region, family income, puberty development (menarche/spermarche), behaviors and habits in the past six months (physical activity, sedentary activity, drinking alcohol, and smoking status). A standard self-administered questionnaire was used to collect the above information. Subjects mainly answered questions by themselves or were assisted by their parents/guardians when necessary. The sedentary activity was defined as the total time spent watching TV and playing computer games < 120 min/d. Physical activity was defined as moderate or vigorous physical activity ≥ 60 min/d. Alcohol drinking was defined as consumption of alcohol ≥18 g during the past month. Smoking was defined as having smoked or attempting to smoke in the past month.
Continuous variables were expressed as mean ± standard deviation (SD) or medians (IQRs) according to their distribution type, and categorical variables were displayed as the frequency with percentage. TG was log-transformed before analysis because of the non-normal distribution. ANOVA, Kruskal-Wallis test, and χ2 tests were conducted to compare the general characteristics among the body composition. FMI and MMI were standardized to a mean of 0 and an SD of 1 specific for sex and age before analysis.
A surface plot fitted by the Gaussian method was used to illustrate the distribution of glucose and lipids on body composition. A generalized additive model (GAM) with quadratically penalized spline terms was applied to check the non-linear relations between muscle mass and glucose and lipids in children and adolescents with different fat masses. Multivariable-adjusted linear regression coefficients (βs) and odds ratios (ORs) and their 95%CIs for glucose and lipids per 1-SD increase in muscle mass were estimated by hierarchical analysis and piecewise regression to assess the associations between muscle mass and glucose and lipids in individuals with different fat mass, adjusting for family income, puberty development, physical activity, sedentary activity, drinking alcohol and smoking status.
Furthermore, to test the association between body composition and glucose and lipids, we divided participants into 4 phenotype: Normal muscle-normal fat mass: MMI z-score < 1 and FMI z-score < 1; Normal muscle-high fat mass: MMI z-score < 1 and FMI z-score ≥ 1; High muscle-normal fat mass: MMI z-score ≥ 1 and FMI z-score < 1; High muscle-high fat mass: MMI z-score ≥ 1 and FMI z-score ≥ 1.
Multivariable-adjusted βs and ORs were also calculated to assess the associations of different body compositions with glucose and lipids. Analyses were conducted using Stata software version 14 (StataCorp, College Station, Texas, USA) and R software version 3.4.0 (R Project for Statistical Computing; www.cran.r-project.org). A 2-tailed P<0.05 was considered statistically significant.
A total of 8,905 participants (4,459 boys [50.1%]) with a mean age of 12.3 ± 3.7 years were included in the present study. Table 1 shows the prevalence of the dyslipidemia and hyperglycemia with different body compositions according to sex. In the High MMI-High FMI group, participants had the highest prevalence of dyslipidemia, including high TC (6.9% and 6.9%), high TG (22.3% and 6.6%), high LDL-C (8.7% and 7.7%), and low HLD-C (30.9% and 13.4%), which were found in both boys and girls. Girls in the High MMI-High FMI group also had the highest prevalence of hyperglycemia (7.1%), while boys in the normal MMI-High FMI group had the highest prevalence of hyperglycemia (12.3%). In addition, waist and waist-to-height ratio increase as muscle and fat increase. participants with high fat-high muscle have the highest waist and waist-to-height ratio. Table S1 shows the demographic characteristics.
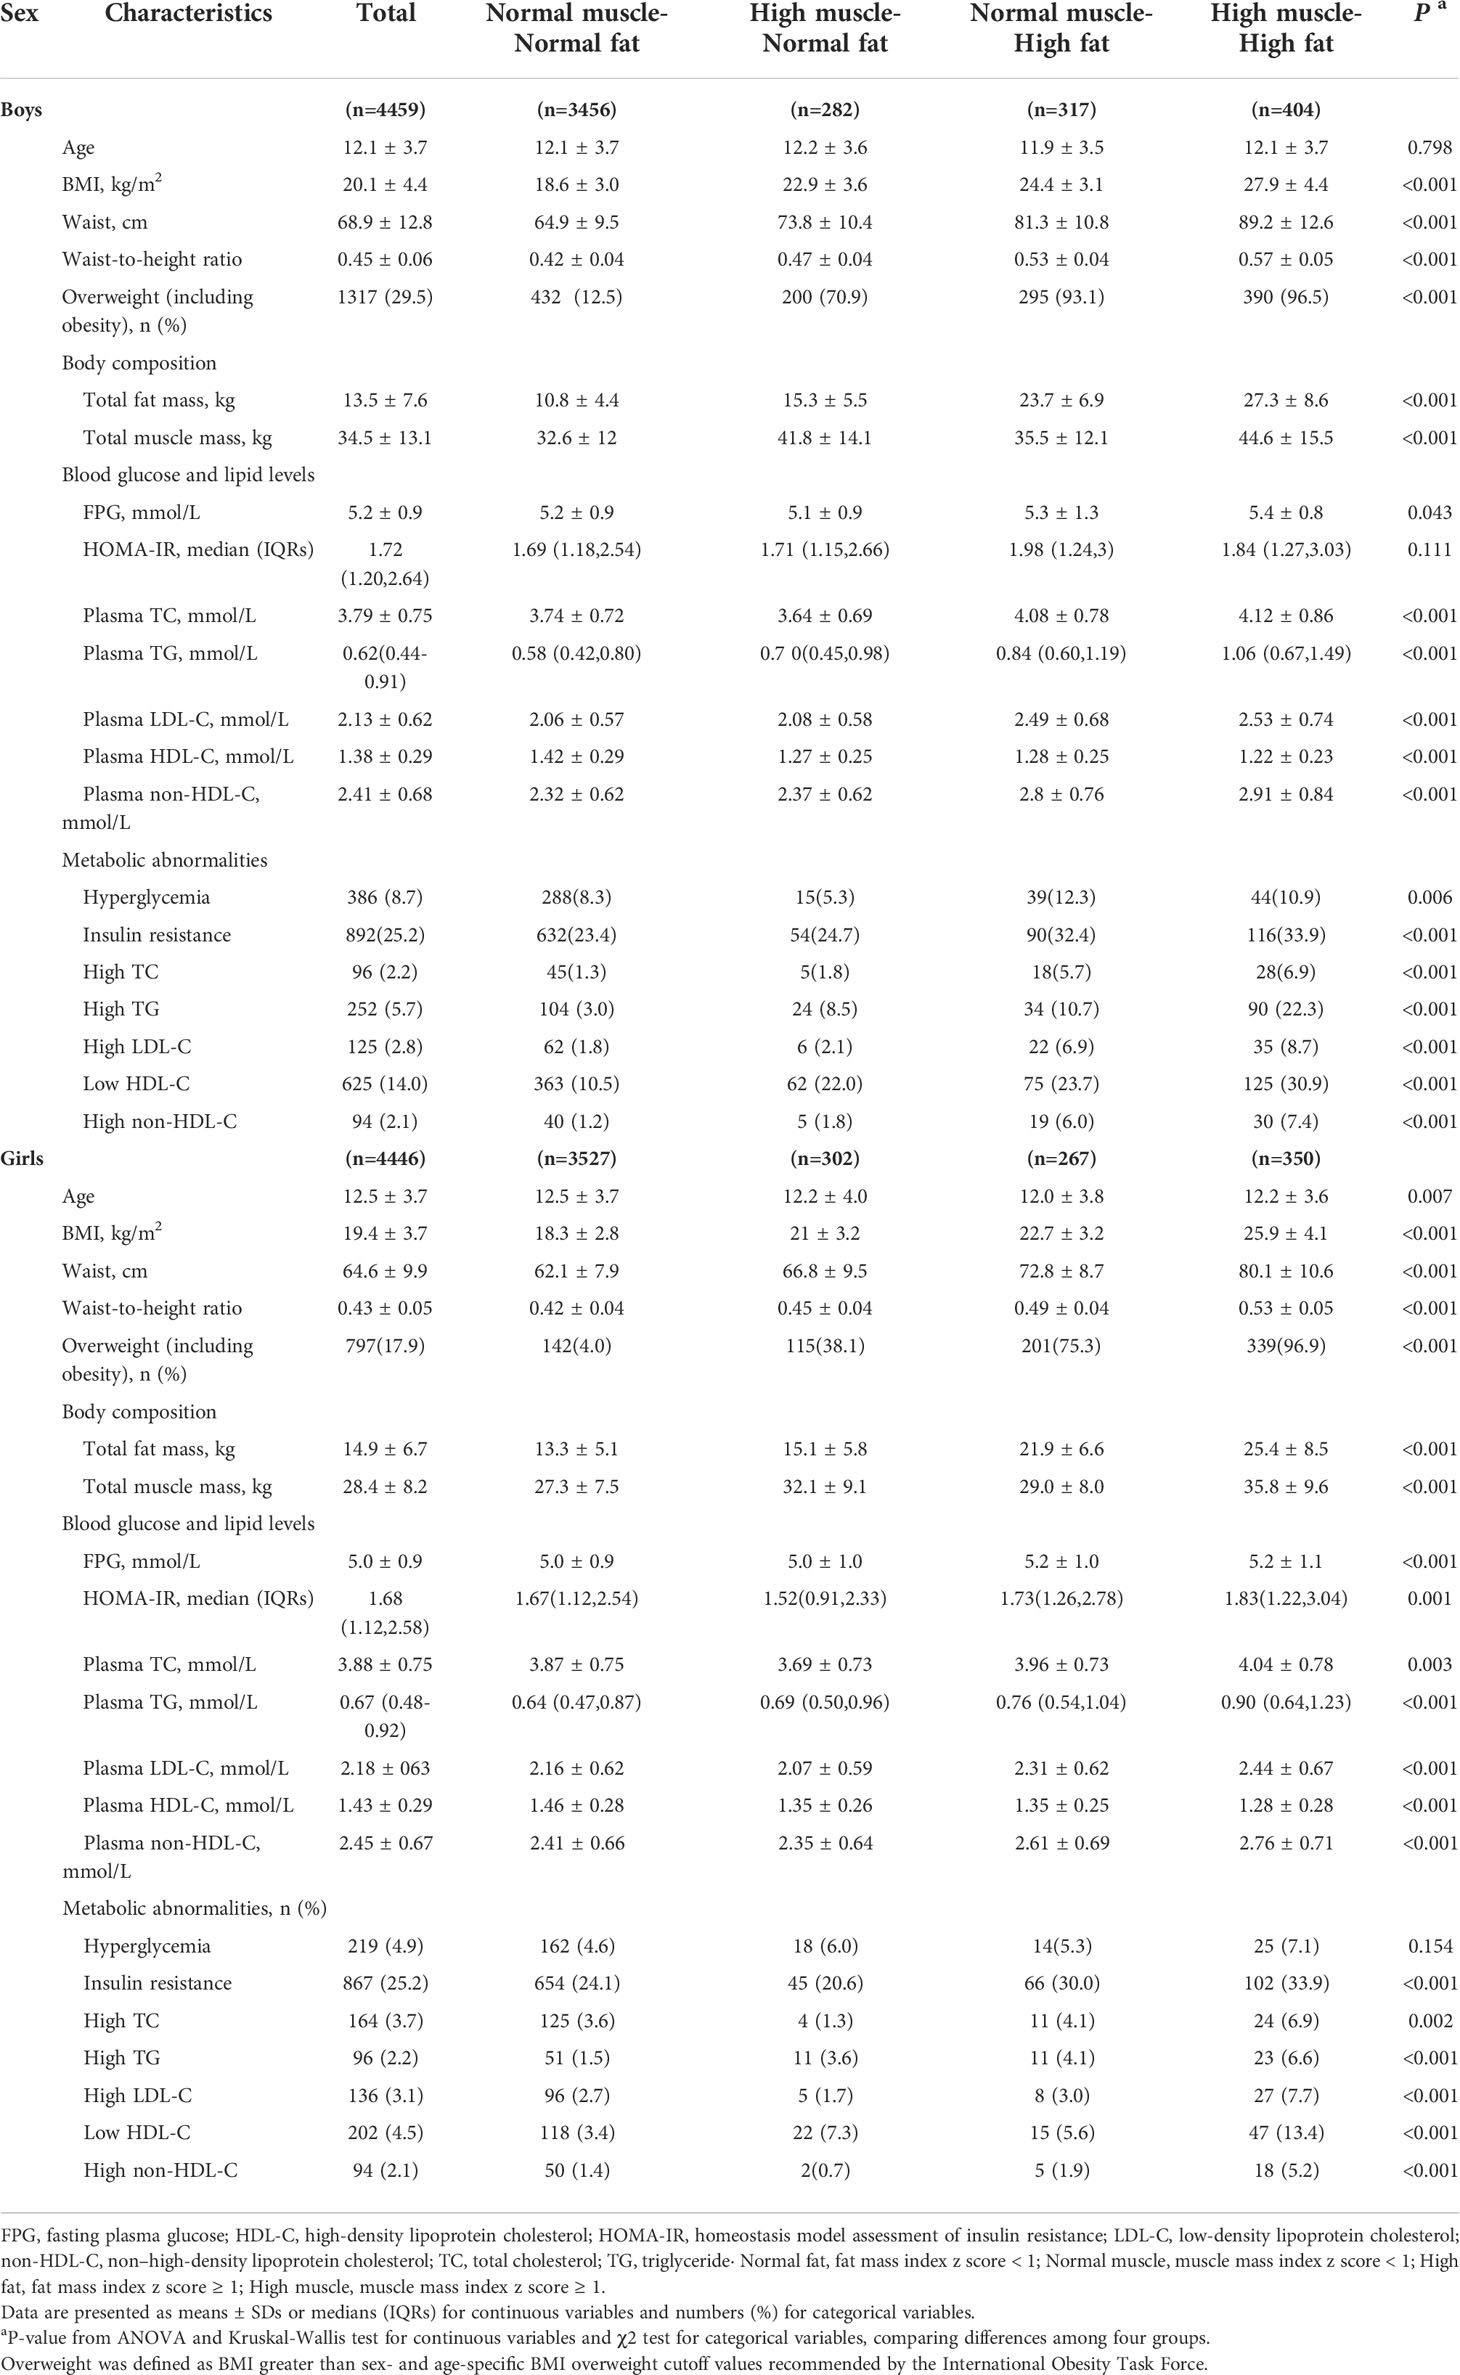
Table 1 Clinical characteristics in boys and girls, stratified by the muscle-fat composition.
Figure 1 shows the distribution of glucose and main lipids (TC and TG) according to muscle and fat mass. In boys, FPG and TC continued to decrease with increasing muscle mass in low-fat mass level (FMI z-score < 1), but not in high-fat mass (FMI z-score ≥ 1). TG remained at a low level in those with low-fat mass, even when the muscle mass increased. But there was a U-shaped relation between TG and muscle mass in those with high-fat mass. In girls, FPG, TC and TG kept decreasing or remained at a low level with increasing muscle in those with low fat mass (FMI z-score < 1), while kept rising with increasing muscle mass in those with high-fat mass (FMI z-score ≥ 1). And the highest FPG, TC, and TG levels were at C point (the high muscle and high fat mass point). Based on that, we used a z-score of 1 as a cut-off point to stratify fat mass to quantitatively study the associations of muscle mass with glucose and lipids in different fat mass levels, and used z-score of 1 to classify fat and muscle respectively and combine them into the 4 body compositions mentioned in the method to analyze the associations of body composition with glucose and lipids. The distributions of LDL-C and non-HDL-C were same as TC, and can be found in Figure S1.
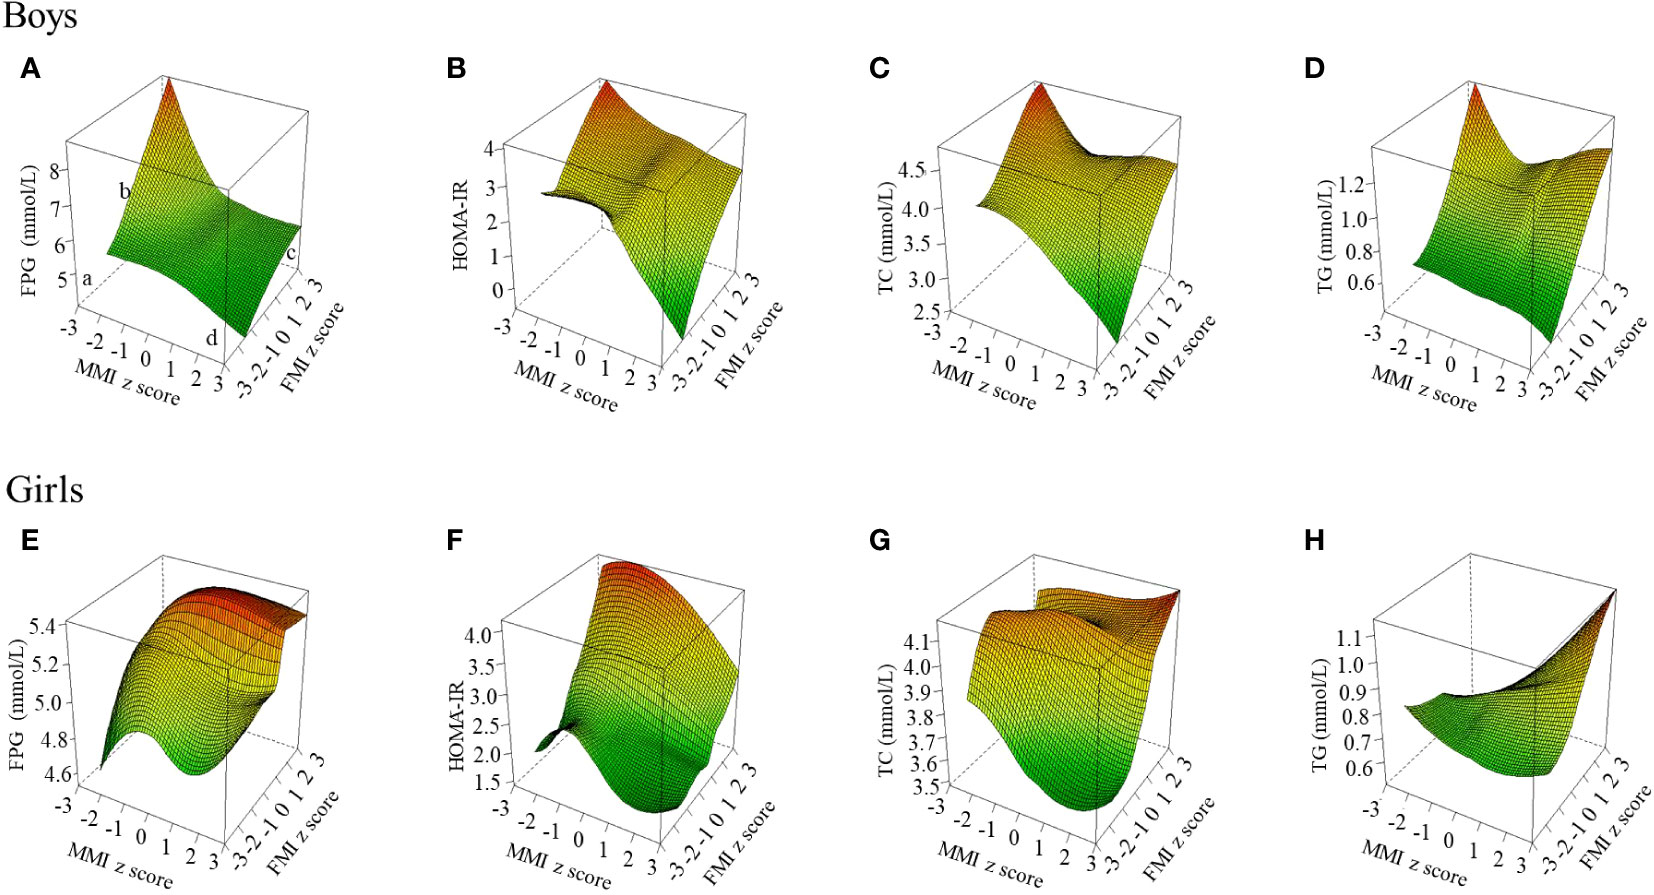
Figure 1 Blood glucose and lipid levels at different muscle-fat composition in boys and girls. The figure shows the results of TC and TG; the other results of blood lipid indicators (LDL-C, HDL-C, and non-HDL-c) are shown in Figure S1. FPG, fasting plasma glucose; FMI, fat mass index; HOMA-IR, homeostasis model assessment of insulin resistance; MMI, muscle mass index; TC, total cholesterol; TG, triglyceride. Three-dimensional surface plot of FPG, HOMA-IR, TC, and TG levels according to muscle-fat composition. (a) Low muscle mass and low-fat mass; (b) Low muscle mass and high-fat mass; (c) High muscle mass and high-fat mass; (d) High muscle mass and low-fat mass. Fat mass index and muscle mass index were age- and sex-specific z-score transformed. (A) FPG level in boys; (B) HOMA-IR level in boys; (C) TC level in boys; (D) TG level in boys; (E) FPG level in girls; (F) HOMA-IR level in girls; (G) TC level in girls; (H) TG level in girls.
Figure 2 shows the relations between muscle mass and glucose and main lipids in groups with different fat mass level as derived from the GAM. In the group with normal fat mass (FMI z-score < 1), TC significantly decreased with increasing muscle mass in boys and girls (P = 0.015 and 0.017). In the group with high-fat mass (FMI z-score ≥ 1), a significant reversed J-shaped relation between muscle mass and FPG and HOMA-IR (P = 0.017 and 0.019) was observed in boys, and TG significantly increased with increasing muscle mass in boys and girls (P = 0.026 and 0.020). The relations of muscle mass with LDL-C, HDL-C and non-HDL-C can be found in Figure S2, and HDL-C significantly decreased with increasing muscle mass in boys and girls (P < 0.05).
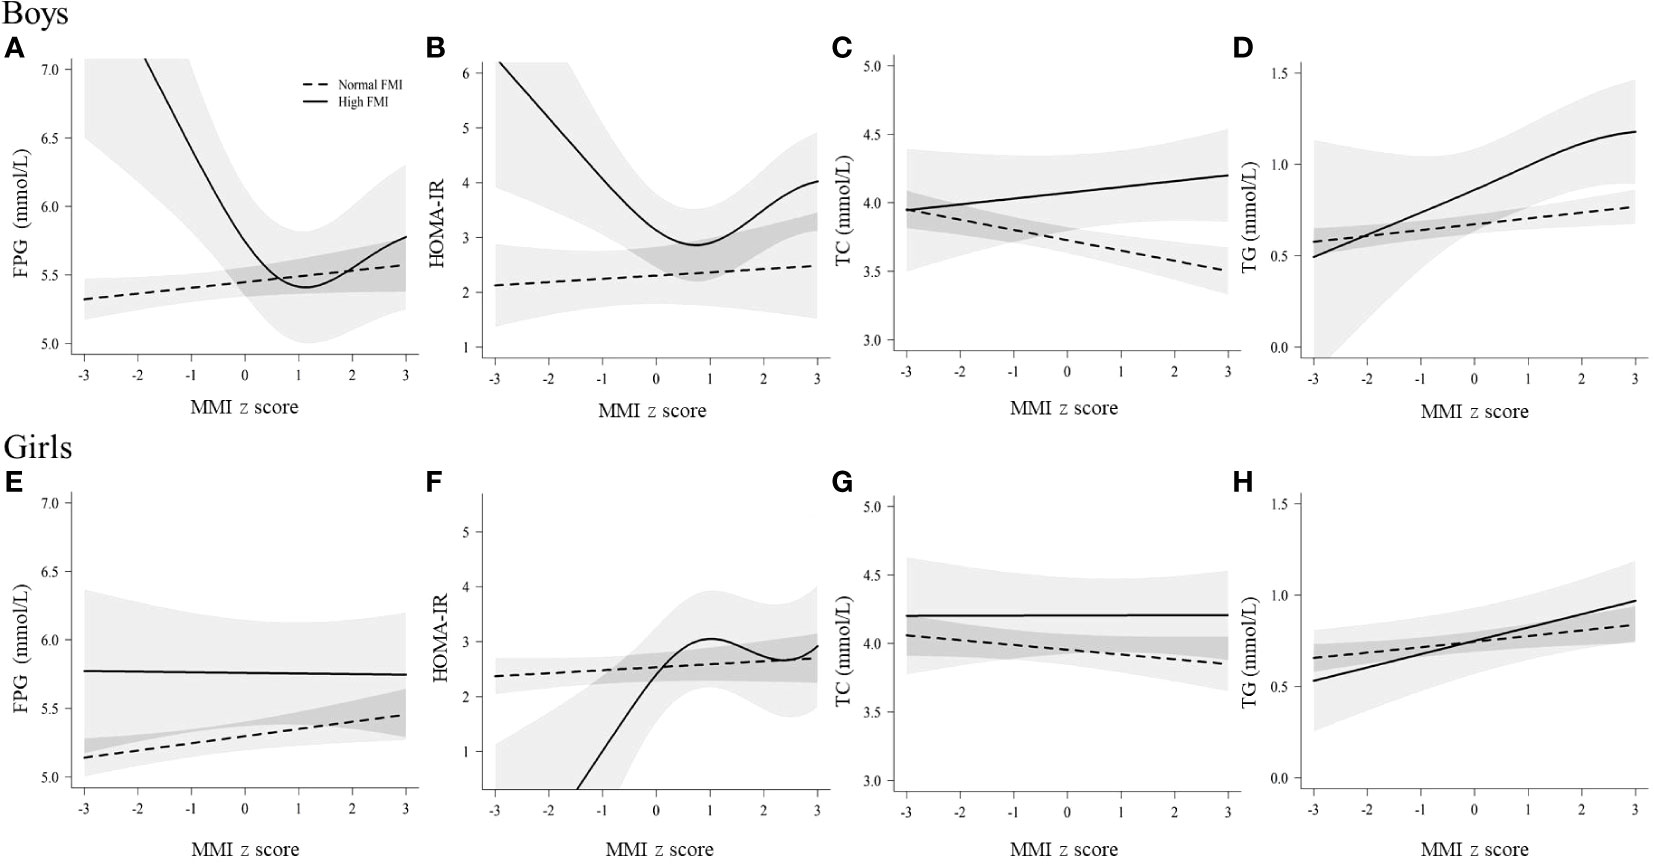
Figure 2 Relations of muscle mass with glucose and lipids in boys and girls, stratified b fat mass levels. The associations of muscle mass with TC and TG are shown; the associations of other blood lipid indicators (LDL-C, HDL-C and non-HDL-c) are shown in Figure S2. FPG, fasting plasma glucose; FMI, fat mass index; HOMA-IR, homeostasis model assessment of insulin resistance; MMI, muscle mass index; TC, total cholesterol; TG, triglyceride. Normal FMI: fat mass index z score < 1, High FMI: fat mass index z score ≥ 1. Solid linesdenote high FMI; dotted lines denote normal FMI; shadow parts indicate 95% CIs. The model was adjusted for age, family income, puberty development, physical activity, sedentary activity, drinking alcohol, and smoking status. Fat mass index and muscle mass index were age- and sex-specific z-score transformed. (A) The relationship between muscle mass and FPG in boys; (B) The relationship between muscle mass and HOMA-IR in boys; (C) The relationship between muscle mass and TC in boys; (D) The relationship between muscle mass and TG in boys; (E) The relationship between muscle mass and FPG in girls; (F) The relationship between muscle mass and HOMA-IR in girls; (G) The relationship between muscle mass and TC in girls; (H) The relationship between muscle mass and TG in girls.
Based on Figure 2 and Figure S2, we first quantitatively analyzed the linear associations of muscle mass with glucose and lipids by fat mass stratification, and Table 2 shows the adjusted βs and ORs between muscle mass and glucose and lipids in normal fat and high fa group. In normal fat mass group, muscle mass was negatively associated with TC (β = -0.07; 95%CI: -0.12,-0.03; P < 0.001) and hyperglycemia (OR = 0.62; 95%CI: 0.46,0.84; P = 0.002) in boys; TG significantly increased with increasing muscle mass (β = 0.04; 95%CI: 0.01,0.06; P = 0.007) and HDL-C significantly decreased with increasing muscle mass (β = -0.05; 95%CI: -0.07,-0.03; P < 0.001) in girls. In high fat mass levels, the negative association between muscle mass and TC was no longer statistically significant in boys with high body fat mass (β = 0.04; 95%CI: -0.05,0.14; P = 0.374), and the associations between muscle mass and TG and HDL-c were still the same as in girls with normal body fat mass.
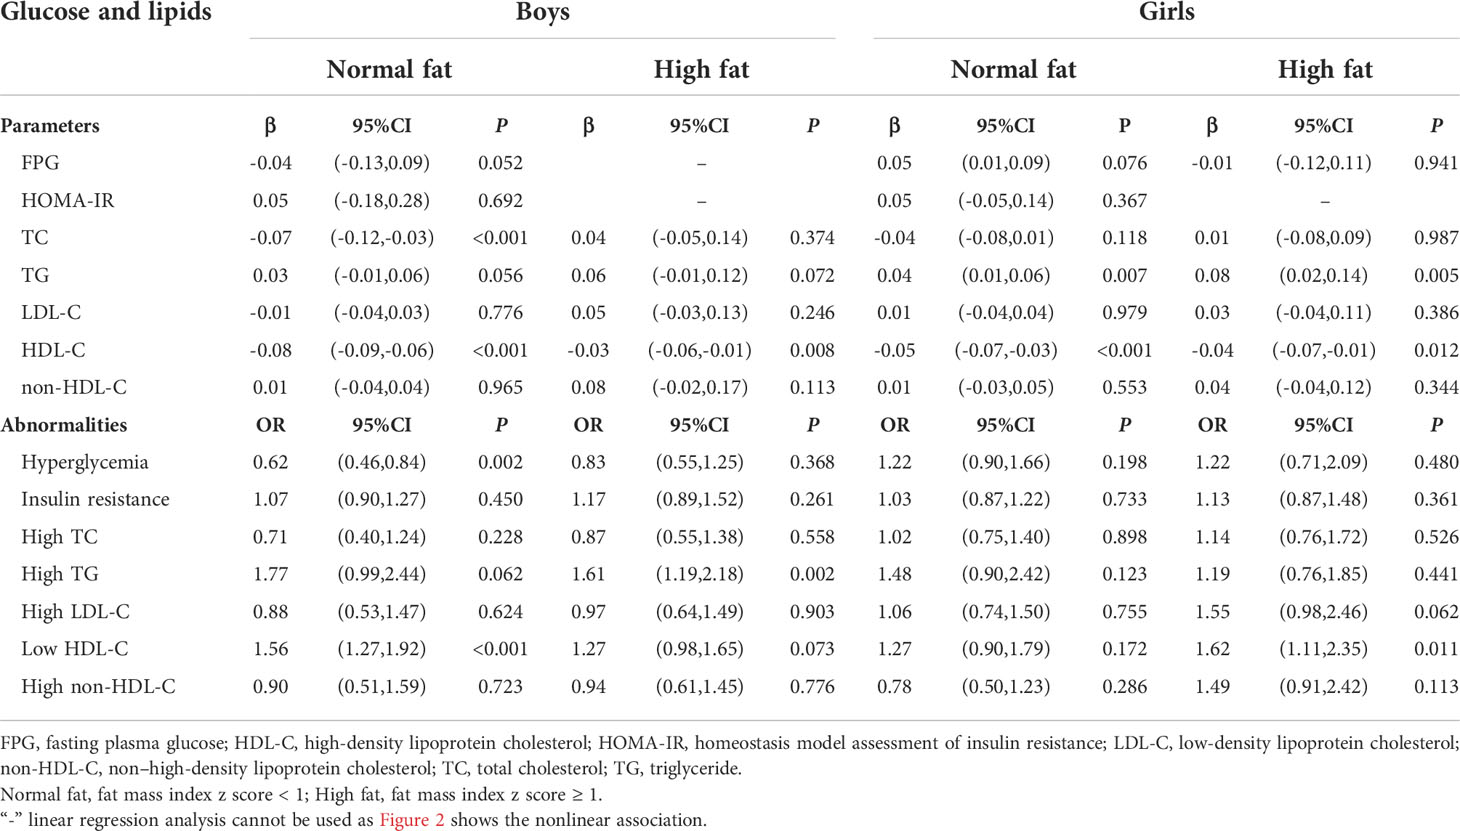
Table 2 Adjusted βs and ORs of glucose and lipids associated with muscle mass, stratified by sex and fat mass levels.
Secondly, muscle mass was found to have a non-linear relationship with FPG and HOMA-IR in those with high fat mass in Figure 2, so we stratified the muscle mass to study the effect of different muscle mass levels on FPG in high-fat mass by piecewise regression in Table 3. Muscle mass was negatively associated with FPG (β = -0.68; 95%CI: -1.19,-0.18; P = 0.008) in boys when MMI z-score < 1. However, there was no significant association between high muscle mass (MMI z-score ≥ 1) and hyperglycemia in high fat levels.
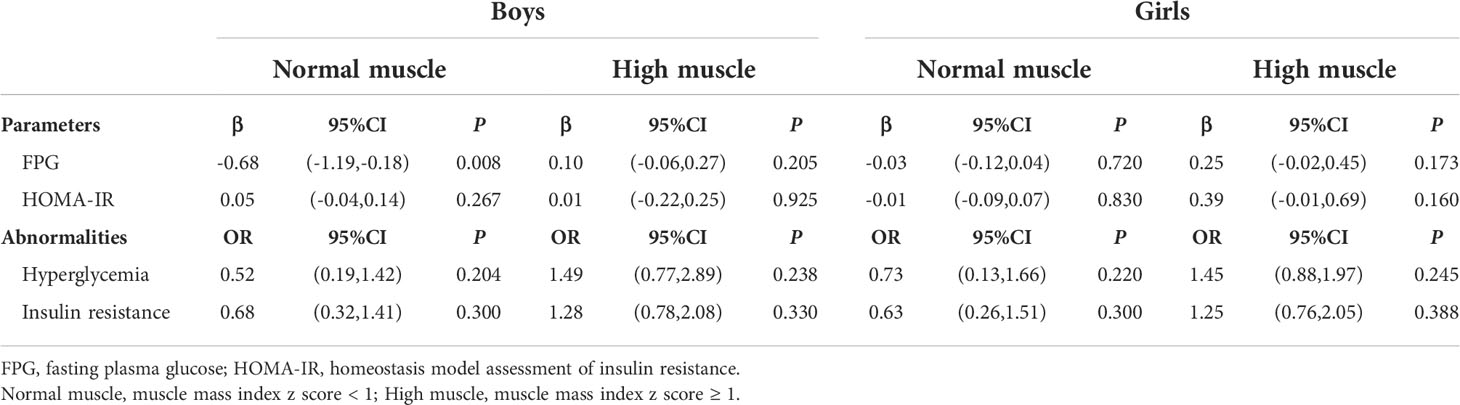
Table 3 Piecewise regression results of the association between muscle mass and glucose in high fat levels, stratified by sex.
Table 4 shows the likelihood of having abnormal glucose and lipid metabolism in relation to different body compositions. Boys with high muscle mass and normal fat mass had a significantly lower risk of hyperglycemia (OR = 0.13, 95%CI: 0.02,0.96, P = 0.045) than those without high muscle mass, while boys with high muscle mass and high fat mass had no lower risk of hyperglycemia compared to those with normal mass and normal mass (OR = 1.28; 95%CI: 0.69,2.36, P = 0.438). Furthermore, compared with children and adolescents with normal muscle mass and normal fat mass, children and adolescents with high muscle mass and high fat mass had highest risk of insulin resistance, higher TC, higher TG, higher LDL-C, lower HDL-C, and higher non-HDL-C.
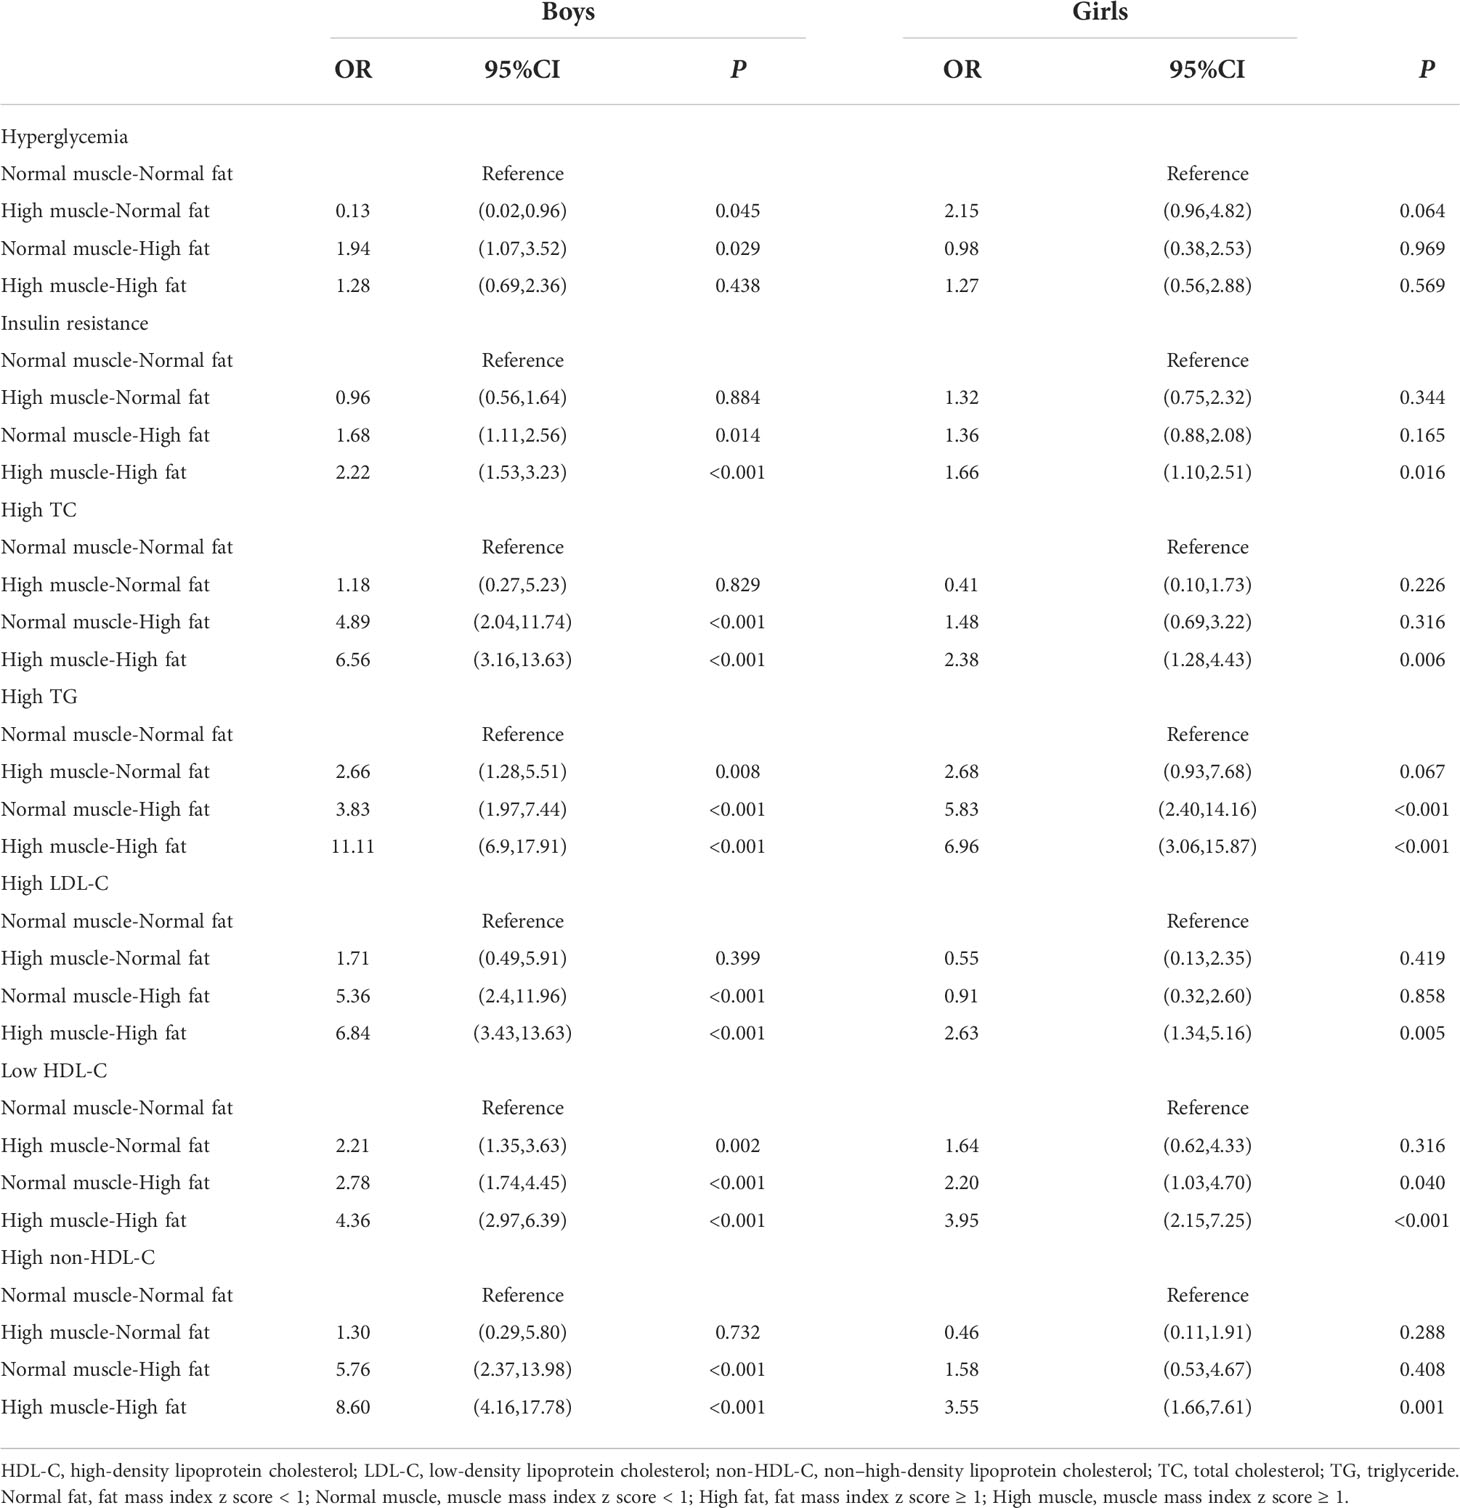
Table 4 Adjusted ORs (95%CIs) for the associations of muscle-fat composition with glucose and lipids metabolic abnormalities, stratified by sex.
The present study found that the prevalence and risk of hyperglycemia and dyslipidemia varied by body composition, with the highest prevalence and risk among those with high muscle mass and high fat mass. We further examined the association of muscle mass with glucose and lipids metabolism stratified by fat mass and found that a negative and significant association of muscle mass with glucose and TC in normal fat boys, but not in high fat boys.
Muscle is an important tissue related to human endocrine and metabolism. The analysis of skeletal muscle proteomics showed that skeletal muscle secretes a variety of myokines, which not only regulate energy demand, but also contribute to cardiovascular, metabolic and mental health and reduce cardiovascular metabolic abnormalities (hyperglycemia, hyperlipidemia, insulin resistance) occur (9, 23). Few pediatric studies have investigated the association of muscle mass with cardiometabolic risk, especially by weight status, and the results are partially consistent with ours. A study of Chilean children without obesity showed that high muscle mass was associated with lower values of metabolic syndrome z-score and TC (24). Among adolescents from the National Health and Nutrition Examination Survey, non-Hispanic blacks had a significantly lower prevalence of metabolic syndrome (2.5%) than Mexican Americans (12.9%) and non-Hispanic whites (10.9%), and in this population of adolescents, non-Hispanic blacks had a higher lean mass index than non-Hispanic whites and Mexican Americans in same weightstatus (25). Recent evidence suggests that muscle fitness levels in school-aged children and adolescents are declining (26, 27), and the World Health Organization supports the addition of muscle-strengthening activities in addition to aerobic exercise as part of physical activity guidelines for children and adolescents and suggests that monitoring muscle fitness can support Development of health promotion strategies (28, 29). Therefore, accurate assessment and monitoring of muscle development and health levels in children and adolescents is an important basis for scientific prevention and control of obesity and reduction of cardiovascular abnormalities.
Different from previous study found that muscle mass have a protective effect on cardiovascular health in children with obesity defined by BMI (24), the additional and important new insight from the present study is that muscle mass was not associated with hyperglycemia and TC in boys with high fat mass. The reason for the difference may be related to the inability of BMI to accurately assess the body composition, and there may be high muscle and low fat phenotype in children and adolescents with obesity evaluated by BMI, which affect the results of the association between muscle and cardiometabolic risk in children and adolescents with obesity (30). Furthermore, high muscle mass in the context of high fat mass may more mean the presence of excess fat in the muscle, and ectopic fat accumulation in muscle has previously been reported in children and adolescents with obesity (31, 32). Small ectopic fat depots in muscle that can adversely affect muscle function, as studies confirmed that immune cells in intramyocellular/intermuscular adiposity tissue in obesity tend to negatively regulate myocyte metabolic functions (16), and a study of 236 Finnish girls also showed that ectopic fat accumulation in skeletal muscle were important factors in increased cardiometabolic risk in adulthood (33).
Consistent with adults’ studies indicated that low muscle mass and high fat mass might have an important role in diabetes and cardiovascular diseases (34, 35), we found that normal muscle and high fat mass had higher prevalence of hyperglycemia and hyperlipidemia. Moreover, present results showed that compared with normal fat-normal muscle group, high fat-high muscle group had the highest risk of abnormal glucose and lipid metabolism. This may be related to the highest levels of waist and waist-to-heigh ratio in high fat-high muscle participants, previous studies have showed that Asians, including Chinese, are more likely to accumulate fat in the abdomen, which is associated with a higher risk of cardiometabolic abnormalities (36).
Many previous studies on young people, including ours, mainly studied the effect of fat mass on cardiometabolic risk (37–40). Some of them have demonstrated that fat stored in different regions has a differential impact on cardiometabolic risk in youth (39, 40), and pointed to that as one of the mechanisms for obesity heterogeneity. Our results extended the mechanisms of obese heterogeneity within the context of a large population-based sample of Chinese children and adolescents, and we found that different body compositions had a different impact on cardiometabolic risk in young individuals, suggesting that body composition may also be important for identifying cardiometabolic risk in children and adolescents.
The underlying sex differences in the fat mass modifying effect of muscle mass on glucose and lipids metabolism are unclear. Nevertheless, fat has been shown to adversely affect the endocrine system, including skeletal muscle, with gender differences (16, 41). Preclinical studies have shown that high fat can reduce the effect of muscle secretion of adiponectin, which has also been recently described as a muscle cytokine (42, 43). As a pleiotropic hormone, adiponectin very effectively enhances insulin sensitivity and decreases glucose (44). We analyzed 2085 samples containing adiponectin data and found that the boys with high muscle mass and high fat mass had the lowest adiponectin levels, but the girls with high muscle mass and high fat mass had the nearly highest levels (Figure S3). This also suggested that body composition might affect the endocrine function and there are gender differences.
The strength of the study is the large sample study recruited in schools from seven provinces of China, thus having a high mathematical power. Body composition and biochemical metrics were obtained using the gold standard techniques of DXA and HOMA protocols rather than peripheral measures, such as BMI and waist. Furthermore, this study is focused on ethnic-geographic regions, as it is one of the rare contemporary studies to address body compositions and glucose and lipid metabolism in the populations of Asian mega-cities, especially in mainland China. However, several limitations should be paid attention when interpreting the findings. First, the delay between the end of data collection and article submission may compromise the contribution of the findings to contemporary scientific and social representation, as the current population may have genotypic and phenotypic differences from the population at the time of data collection. Second, nutritional habits, physical activity, menstrual cycle and other unknown factors may account the associations observed in this study, particularly in the association of muscle with biochemical indicators. As children who met daily recommended moderate to vigorous physical activity or adhered to a Mediterranean diet were found to have more favorable blood lipids and body composition variables levels compared to those who did not meet these recommendations, and irregular menstrual cycles were considered risk factors for the development of metabolic disorders (45–48). Third, muscle can be measured in terms of mass and quality. The muscle quality and aerobic levels needs to be elucidated, which may help to better understand our observed associations of muscle with abnormal glucose and lipid metabolism risk. Finally, this cross-sectional study had a limited ability to demonstrate causal relationships between body interaction and glucose and lipids metabolism.
In conclusion, the prevalence of hyperglycemia and dyslipidemia was highest in children and adolescents with high muscle mass and high fat mass, and the associations of muscle mass with glucose and lipid metabolism were modified by fat mass in children and adolescents. These results demonstrate that body composition plays an important role in explaining the heterogeneity of the association between obesity and cardiometabolic risk. Specifically, it highlights the importance of focusing on muscle when studying the effects of obesity on the cardiometabolic risk factors, and high muscle mass in high-fat children and adolescents may not imply a reduction in cardiometabolic risk. Prospective studies are warranted to evaluate the long-term impacts of body composition on cardiovascular risk.
The investigators of the China Child and Adolescent Cardiovascular Health collaboration group are listed in the Supplemental Text S1.
The original contributions presented in the study are included in the article/Supplementary Material. Further inquiries can be directed to the corresponding author.
The studies involving human participants were reviewed and approved by the ethics committee of the Capital Institute of Pediatrics (approval number: 2012062). Written informed consent to participate in this study was provided by the participants’ legal guardian/next of kin.
JM had full access to all the data in the study and takes responsibility for the integrity of the data, conceptualization, and design of the study; she reviewed the manuscript and had primary responsibility for the final content; LG and HC conducted all analyses, interpreted the results, and drafted the manuscript; JL, XS, and YY were involved in data acquisition; XW contributed to the discussion. All authors reviewed the manuscript and had final approval of the submitted and published versions.
This study was supported by the National Natural Science Foundation of China (grant number: 81973110) and the National Science and Technology Support Projects for the “Twelfth Five-Year Plan” of China (2012BAI03B03).
We thank Haibo Li from Fujian Maternity and Child Health Hospital, and Liwan Fu and Pei Xiao from Beijing Children’s Hospital for their assistance in editing figures. Data described in the manuscript, codebook, and analytic code will be made available from the corresponding author on reasonable request.
The authors declare that the research was conducted in the absence of any commercial or financial relationships that could be construed as a potential conflict of interest.
All claims expressed in this article are solely those of the authors and do not necessarily represent those of their affiliated organizations, or those of the publisher, the editors and the reviewers. Any product that may be evaluated in this article, or claim that may be made by its manufacturer, is not guaranteed or endorsed by the publisher.
The Supplementary Material for this article can be found online at: https://www.frontiersin.org/articles/10.3389/fendo.2022.976998/full#supplementary-material
1. Twig G, Yaniv G, Levine H, Leiba A, Goldberger N, Derazne E, et al. Body-mass index in 2.3 million adolescents and cardiovascular death in adulthood. N Engl J Med (2016) 374:2430–40. doi: 10.1056/NEJMoa1503840
2. Llewellyn A, Simmonds M, Owen CG, Woolacott N. Childhood obesity as a predictor of morbidity in adulthood: A systematic review and meta-analysis. Obes Rev (2016) 17:56–67. doi: 10.1111/obr.12316
3. Chooi YC, Ding C, Magkos F. The epidemiology of obesity. Metabolism (2019) 92:6–10. doi: 10.1016/j.metabol.2018.09.005
4. Dale CE, Fatemifar G, Palmer TM, White J, Prieto-Merino D, Zabaneh D, et al. Causal associations of adiposity and body fat distribution with coronary heart disease, stroke subtypes, and type 2 diabetes mellitus: A mendelian randomization analysis. Circulation (2017) 135:2373–88. doi: 10.1161/CIRCULATIONAHA.116.026560
5. Emdin CA, Khera AV, Natarajan P, Klarin D, Zekavat SM, Hsiao AJ, et al. Genetic association of waist-To-Hip ratio with cardiometabolic traits, type 2 diabetes, and coronary heart disease. JAMA (2017) 317:626–34. doi: 10.1001/jama.2016.21042
6. Wildman RP, Muntner P, Reynolds K, McGinn AP, Rajpathak S, Wylie-Rosett J, et al. The obese without cardiometabolic risk factor clustering and the normal weight with cardiometabolic risk factor clustering: prevalence and correlates of 2 phenotypes among the US population (NHANES 1999-2004). Arch Intern Med (2008) 168:1617–24. doi: 10.1001/archinte.168.15.1617
7. Garn SM, Leonard WR, Hawthorne VM. Three limitations of the body mass index. Am J Clin Nutr (1986) 44:996–7. doi: 10.1093/ajcn/44.6.996
8. Javed A, Jumean M, Murad MH, Okorodudu D, Kumar S, Somers VK, et al. Diagnostic performance of body mass index to identify obesity as defined by body adiposity in children and adolescents: A systematic review and meta-analysis. Pediatr Obes (2015) 10:234–44. doi: 10.1111/ijpo.242
9. Pedersen BK, Febbraio MA. Muscles, exercise and obesity: Skeletal muscle as a secretory organ. Nat Rev Endocrinol (2012) 8:457–65. doi: 10.1038/nrendo.2012.49
10. Yan Y, Mi J. Noncommunicable chronic disease prevention should start from childhood. Pediatr Investig (2021) 5:3–5. doi: 10.1002/ped4.12254
11. Valentino G, Bustamante MJ, Orellana L, Krämer V, Durán S, Adasme M, et al. Body fat and its relationship with clustering of cardiovascular risk factors. Nutr Hosp (2015) 31:2253–60. doi: 10.3305/nh.2015.31.5.8625
12. Daniels SR, Morrison JA, Sprecher DL, Khoury R, Kimball TR. Association of body fat distribution and cardiovascular risk factors in children and adolescents. Circulation (1999) 99:541–5. doi: 10.1161/01.cir.99.4.541
13. Orsso CE, Tibaes JRB, Rubin DA, Field CJ, Heymsfield SB, Prado CM, et al. Metabolic implications of low muscle mass in the pediatric population: A critical review. Metabolism (2019) 99:102–12. doi: 10.1016/j.metabol.2019.153949
14. Tomlinson DJ, Erskine RM, Morse CI, Winwood K, Onambélé-Pearson G. The impact of obesity on skeletal muscle strength and structure through adolescence to old age. Biogerontology (2016) 17:467–83. doi: 10.1007/s10522-015-9626-4
15. Maffiuletti NA, Jubeau M, Agosti F, Col AD, Sartorio A. Quadriceps muscle function characteristics in severely obese and nonobese adolescents. Eur J Appl Physiol (2008) 103:481–4. doi: 10.1007/s00421-008-0737-3
16. Wu H, Ballantyne CM. Skeletal muscle inflammation and insulin resistance in obesity. J Clin Invest (2017) 127:43–54. doi: 10.1172/JCI88880
17. Dong H, Yan Y, Liu J, Cheng H, Zhao X, Shan X, et al. Reference centiles for evaluating total body fat development and fat distribution by dual-energy x-ray absorptiometry among children and adolescents aged 3-18 years. Clin Nutr (2021) 40:1289–95. doi: 10.1016/j.clnu.2020.08.012
18. Liu J, Yan Y, Xi B, Huang G, Mi J. Skeletal muscle reference for Chinese children and adolescents. J Cachexia Sarcopenia Muscle (2019) 10:155–64. doi: 10.1002/jcsm.12361
19. Chen F, Liu J, Yan Y, et al. Abnormal Metabolic Phenotypes Among Urban Chinese Children: Epidemiology and the Impact of DXA-Measured Body Composition. Obesity (Silver Spring) (2019) 27(5):837–844. doi: 10.1002/oby.22426
20. Cole TJ, Bellizzi MC, Flegal KM, Dietz WH. Establishing a standard definition for child overweight and obesity worldwide: International survey. BMJ (2000) 320:1240–3. doi: 10.1136/bmj.320.7244.1240
21. Alberti KG, Zimmet PZ. Definition, diagnosis and classification of diabetes mellitus and its complications. Part 1: Diagnosis and classification of diabetes mellitus provisional report of a WHO consultation. Diabetes Med (1998) 15:539–53. doi: 10.1002/(SICI)1096-9136(199807)15:7<539::AID-DIA668>3.0.CO;2-S
22. Xiao P, Huang T, Yan Y, Zhao X, Li H, Mi J. Performance of gender- and age-specific cut-points versus NCEP pediatric cutpoints in dyslipidemia screening among Chinese children. Atherosclerosis (2019) 280:37–44. doi: 10.1016/j.atherosclerosis.2018.11.018
23. Richter-Stretton GL, Fenning AS, Vella RK. Skeletal muscle - a bystander or influencer of metabolic syndrome? Diabetes Metab Syndr (2020) 14:867–75. doi: 10.1016/j.dsx.2020.06.006
24. Burrows R, Correa-Burrows P, Reyes M, Blanco E, Albala C, Gahagan S. Low muscle mass is associated with cardiometabolic risk regardless of nutritional status in adolescents: A cross-sectional study in a Chilean birth cohort. Pediatr Diabetes (2017) 18:895–902. doi: 10.1111/pedi.12505
25. De Ferranti S, Gauvreau K, Ludwig D, Neufeld EJ, Newburger JW, Rifai N. Prevalence of the metabolic syndrome in American adolescents. Circulation (2004) 110:2494–7. doi: 10.1161/01.CIR.0000145117.40114.C7
26. Sandercock GRH, Cohen DD. Temporal trends in muscular fitness of English 10-year-olds 1998-2014: An allometric approach. J Sci Med Sport (2019) 22:201–5. doi: 10.1016/j.jsams.2018.07.020
27. Moliner-Urdiales D, Ruiz JR, Ortega FB, Jiménez-Pavón D, Vicente-Rodriguez G, Rey-López JP, et al. Secular trends in health-related physical fitness in Spanish adolescents: the AVENA and HELENA studies. J Sci Med Sport (2010) 13:584–8. doi: 10.1016/j.jsams.2010.03.004
28. Piercy KL, Troiano RP, Ballard RM, Carlson SA, Fulton JE, Galuska DA, et al. The physical activity guidelines for Americans. JAMA (2018) 320:2020–8. doi: 10.1001/jama.2018.14854
29. World Health Organization. Global health estimates: Deaths by cause, age, sex and country, 2000–2012. Geneva: WHO (2014). p. 9.
30. Müller MJ, Lagerpusch M, Enderle J, Schautz B, Heller M, Bosy-Westphal A. Beyond the body mass index: tracking body composition in the pathogenesis of obesity and the metabolic syndrome. Obes Rev (2012) 13:6–13. doi: 10.1111/j.1467-789X.2012.01033.x
31. Bennett B, Larson-Meyer DE, Ravussin E, Volaufova J, Soros A, Cefalu WT, et al. Impaired insulin sensitivity and elevated ectopic fat in healthy obese vs. nonobese prepubertal children. Obesity (2012) 20:371–5. doi: 10.1038/oby.2011.264
32. Larson-Meyer DE, Newcomer BR, Ravussin E, Volaufova J, Bennett B, Chalew S, et al. Intrahepatic and intramyocellular lipids are determinants of insulin resistance in prepubertal children. Diabetologia (2011) 54:869–75. doi: 10.1007/s00125-010-2022-3
33. Cheng S, Wiklund P. The effects of muscle mass and muscle quality on cardio-metabolic risk in peripubertal girls: A longitudinal study from childhood to early adulthood. Int J Obes (Lond) (2018) 42:648–54. doi: 10.1038/ijo.2017.267
34. Seo YG, Song HJ, Song YR. Fat-to-muscle ratio as a predictor of insulin resistance and metabolic syndrome in Korean adults. J Cachexia Sarcopenia Muscle (2020) 11:710–25. doi: 10.1002/jcsm.12548
35. Wang M, Tan Y, Shi Y, Wang X, Liao Z, Wei P. Diabetes and sarcopenic obesity: Pathogenesis, diagnosis, and treatments. Front Endocrinol (2020) 11:568. doi: 10.3389/fendo.2020.00568
36. Staiano AE, Katzmarzyk PT. Ethnic and sex differences in body fat and visceral and subcutaneous adiposity in children and adolescents. Int J Obes (Lond) (2012) 36(10):1261–9. doi: 10.1038/ijo.2012.95
37. Gishti O, Gaillard R, Durmus B, Abrahamse M, Beek EM, Hofman A, et al. BMI, total and abdominal fat distribution, and cardiovascular risk factors in school-age children. Pediatr Res (2015) 77:710–8. doi: 10.1038/pr.2015.29
38. Samouda H, De Beaufort C, Stranges S, Hirsch M, Nieuwenhuyse JP, Dooms G, et al. Cardiometabolic risk: leg fat is protective during childhood. Pediatr Diabetes (2016) 17:300–8. doi: 10.1111/pedi.12292
39. Yan Y, Liu J, Zhao X, Cheng H, Huang G, Mi J. Regional adipose compartments confer different cardiometabolic risk in children and adolescents: The China child and adolescent cardiovascular health study. Mayo Clin Proc (2019) 94:1974–82. doi: 10.1016/j.mayocp.2019.05.026
40. Staiano AE, Gupta AK, Katzmarzyk PT. Cardiometabolic risk factors and fat distribution in children and adolescents. J Pediatr (2014) 164(3):560–5. doi: 10.1016/j.jpeds.2013.10.064
41. Pedersen BK. Muscle as a secretory organ. Compr Physiol (2013) 33:1337–62. doi: 10.1002/cphy.c120033
42. Yang B, Chen L, Qian Y, Triantafillou JA, McNulty JA, Carrick K, et al. Changes of skeletal muscle adiponectin content in diet-induced insulin resistant rats. Biochem Biophys Res Commun (2006) 341:209–17. doi: 10.1016/j.bbrc.2005.12.172
43. Martinez-Huenchullan SF, Tam CS, Ban LA, Ehrenfeld-Slater P, Mclennan SV, Twigg SM. Skeletal muscle adiponectin induction in obesity and exercise. Metabolism (2020) 102:154008. doi: 10.1016/j.metabol.2019.154008
44. Zhao S, Kusminski CM, Scherer PE. Adiponectin, leptin and cardiovascular disorders. Circ Res (2021) 128:136–49. doi: 10.1161/CIRCRESAHA.120.314458
45. Baran J, Weres A, Czenczek-Lewandowska E, Wyszyńska J, Łuszczki E, Dereń K, et al. Blood lipid profile and body composition in a pediatric population with different levels of physical activity. Lipids Health Dis (2018) 17:171. doi: 10.1186/s12944-018-0817-2
46. Morelli C, Avolio E, Galluccio A, Caparello G, Manes E, Ferraro S, et al. Impact of vigorous-intensity physical activity on body composition parameters, lipid profile markers, and irisin levels in adolescents: A cross-sectional study. Nutrients (2020) 12:742. doi: 10.3390/nu12030742
47. Rostami DM, Ramezani TF, Djalalinia S, Cheraghi L, Behboudi GS, Azizi F. Menstrual cycle irregularity and metabolic disorders: A population-based prospective study. PloS One (2016) 11(12):e0168402. doi: 10.1371/journal.pone.0168402
Keywords: obesity, muscle mass and fat mass, glucose, lipids, children
Citation: Gao L, Cheng H, Yan Y, Liu J, Shan X, Wang X and Mi J (2022) The associations of muscle mass with glucose and lipid metabolism are influenced by body fat accumulation in children and adolescents. Front. Endocrinol. 13:976998. doi: 10.3389/fendo.2022.976998
Received: 24 June 2022; Accepted: 29 August 2022;
Published: 15 September 2022.
Edited by:
Alexandre Gabarra Oliveira, São Paulo State University, BrazilReviewed by:
Eric Plaisance, University of Alabama at Birmingham, United StatesCopyright © 2022 Gao, Cheng, Yan, Liu, Shan, Wang and Mi. This is an open-access article distributed under the terms of the Creative Commons Attribution License (CC BY). The use, distribution or reproduction in other forums is permitted, provided the original author(s) and the copyright owner(s) are credited and that the original publication in this journal is cited, in accordance with accepted academic practice. No use, distribution or reproduction is permitted which does not comply with these terms.
*Correspondence: Jie Mi, amllbWkxMkB2aXAuc2luYS5jb20=
†These authors have contributed equally to this work
Disclaimer: All claims expressed in this article are solely those of the authors and do not necessarily represent those of their affiliated organizations, or those of the publisher, the editors and the reviewers. Any product that may be evaluated in this article or claim that may be made by its manufacturer is not guaranteed or endorsed by the publisher.
Research integrity at Frontiers
Learn more about the work of our research integrity team to safeguard the quality of each article we publish.