
94% of researchers rate our articles as excellent or good
Learn more about the work of our research integrity team to safeguard the quality of each article we publish.
Find out more
ORIGINAL RESEARCH article
Front. Endocrinol., 22 August 2022
Sec. Obesity
Volume 13 - 2022 | https://doi.org/10.3389/fendo.2022.971202
This article is part of the Research TopicMetabolically Healthy and Unhealthy Obese Children and Adolescents, volume IIView all 7 articles
 Ruziana Mona Wan Mohd Zin1
 Muhammad Yazid Jalaludin2*
 Abqariyah Yahya3Ahmad Kamil Nur Zati Iwani1Fuziah Md Zain4Janet Yeow Hua Hong4Abdul Halim Mokhtar5Wan Nazaimoon Wan Mohamud1
Introduction: Children with obesity in the absence of traditional cardiometabolic risk factors (CRF) have been described as metabolically healthy obese (MHO). Children with MHO phenotype has a favorable metabolic profile with normal glucose metabolism, lipids, and blood pressure compared to children with metabolically unhealthy obese (MUO) phenotype. This study aimed to compare several parameters related to obesity between these two groups and to examine the predictors associated with the MHO phenotype.
Methods: This study included a cross-sectional baseline data of 193 children with obesity (BMI z-score > +2 SD) aged 8-16 years enrolled in MyBFF@school program, a school-based intervention study conducted between January and December 2014. Metabolic status was defined based on the 2018 consensus-based criteria with MHO children had no CRF (HDL-cholesterol > 1.03 mmol/L, triglycerides ≤ 1.7 mmol/L, systolic and diastolic blood pressure ≤ 90th percentile, and fasting plasma glucose ≤ 5.6 mmol/L). Those that did not meet one or more of the above criteria were classified as children with MUO phenotype.
Results: The prevalence of MHO was 30.1% (95% CI 23.7 – 37.1) among schoolchildren with obesity and more common in younger and prepubertal children. Compared to MUO, children with MHO phenotype had significantly lower BMI, lower waist circumference, lower uric acid, higher adiponectin, and higher apolipoprotein A-1 levels (p < 0.01). Multivariate logistic regression showed that adiponectin (OR: 1.33, 95% CI 1.05 – 1.68) and apolipoprotein A-1 (OR: 1.02, 95% CI 1.01 – 1.03) were independent predictors for MHO phenotype in this population.
Conclusions: MHO phenotype was more common in younger and prepubertal children with obesity. Higher serum levels of adiponectin and apolipoprotein A-1 increased the possibility of schoolchildren with obesity to be classified into MHO phenotype.
The worldwide prevalence of childhood obesity continues to rise in many countries (1). Childhood obesity has been linked with many chronic diseases such as type 2 diabetes mellitus, dyslipidemia, hypertension, fatty liver disease (2) and at increased risk of adult mortality (3), hence possesses as one of the most alarming public health concerns. However, studies have shown that not all individuals with obesity exhibit similar degree of obesity-related complications. In recent years, an obese phenotype that has been characterized by the absence of associated cardiometabolic risk factors has been described as metabolically healthy obese (MHO), in contrast to those with metabolically unhealthy obese (MUO) (4). However, the diagnostic criteria of MHO are still under discussion (5), especially in children due to the paucity of the existing studies (6, 7).
Like adult population, studies have suggested that children with obesity can also be characterized as MHO (8, 9) by having a better metabolic profile with normal lipid, glucose metabolism, and blood pressure levels (10). Although children with MHO phenotype does not necessarily means lower morbidity and mortality later in life (7), and can switch to MUO phenotype during puberty (11), defining MHO among children with obesity is crucial in order to elucidate the mechanisms protecting against cardiometabolic risk factors clustering. Therefore, the clear distinction between obese phenotypes could be useful in providing more effective and targeted treatment for children with obesity rather than one-size-fits-all obesity management (12).
Currently, there are no universally accepted criteria to identify children with MHO phenotype despite several attempts have been made using various criteria and cut-off values related to insulin sensitivity and metabolic syndrome components (9, 13–16). In 2018, Damanhoury et al. proposed the first international consensus-based definition of MHO through experts’ consultation and the application of a Delphi process (6). The consensus was achieved to define children with obesity based on body mass index (BMI) for age and gender (BMI z-score) according to the WHO growth chart, and those fulfilling all the cardiometabolic criteria should be classified as MHO. This first step to achieving a universal MHO definition in children is crucial to limit the variability in definitions and to facilitate comparisons across studies (15). Our study contributes to the existing literature by reporting the obesity-related clinical and laboratory parameters among schoolchildren with obesity and to study predictors associated with MHO phenotype using this newly proposed definition.
Schoolchildren with obesity (n=193) aged 8-16 years included in this study were from baseline data of My Body is Fit and Fabulous (MyBFF@school) study conducted between January and December 2014 in Malaysia. MyBFF@school study was a school-based lifestyle intervention program specifically designed for overweight and obese schoolchildren to reduce their weight following the 6 months nutritional, physical activity, and psychological modules. Those who were diagnosed with chronic cardiac, renal, hepatic, or endocrine diseases that directly or indirectly related to obesity were excluded from the analysis. Written informed consent and assent were obtained from parents and children respectively, and all tests were performed in accordance with the approved guidelines. The MyBFF@school study was reviewed and approved by the Medical Research and Ethics Committee, Ministry of Health Malaysia. Detailed description of the study methodology has been previously published (17) and the study was also registered with ClinicalTrials.gov (identifier NCT02212873).
Children were asked to fast overnight for at least 8 hours prior to study visit. All anthropometric measurements were performed by trained personnel and medical assessments were performed by qualified pediatricians. Height was measured while standing without shoes to the nearest 0.1 cm using calibrated stadiometer (Seca 217, Germany). Body composition such as weight, fat mass and skeletal muscle mass was measured in light clothing without shoes and socks to the nearest 0.1 kg using a pre-calibrated bioelectrical impedance analyzer (InBody 720, Korea). BMI was calculated as weight in kilograms (kg) divided by the square of height in meters (m2). Waist circumference was measured twice to the nearest 0.1 cm over the skin midpoint between the tenth rib and the iliac crest at the end of normal exhalation, using an inelastic measuring tape (Seca 201, Germany) with the children standing still on both feet with arms hanging freely. Systolic (SBP) and diastolic blood pressure (DBP) were measured twice on the right arm using a mercury sphygmomanometer (Accoson, UK) after 5 minutes of rest in a seated position with the arm supported at the heart level. Self-assessment of pubertal status was performed using pictorial Tanner staging scale (18, 19) and the children were also examined by the pediatricians for the presence of acanthosis nigricans over the neck (20).
Venipuncture was performed by experienced nurses and medical doctors. Venous blood samples were kept cold and processed within 2 hours upon sample collection at the Institute for Medical Research central laboratory, and aliquots of serum/plasma were kept at -20°C for short-term storage or -80°C for long-term storage prior to analysis. Fasting plasma glucose (FPG), total cholesterol (TC), triglycerides (TG), high-density lipoprotein-cholesterol (HDL-cholesterol), low-density lipoprotein-cholesterol (LDL-cholesterol), apolipoprotein A-1 (apo A-1), apolipoprotein B (apo B), high-sensitivity C-reactive protein (hsCRP), adiponectin, uric acid (UA), alanine transaminase (ALT), aspartate transaminase (AST), gamma-glutamyl transferase (GGT) and serum creatinine were measured using an automated analyzer (Dirui CS-400, China) with reagents purchased from Randox Laboratories (Antrim, UK). HbA1c level was determined by cationic exchanged high-performance liquid chromatography (Adams A1c HA-8160, Arkray Inc., Japan) following the National Glycohemoglobin Standardization Program guidelines. Fasting insulin concentration was measured using an automated enzyme immunoassay analyzer (TOSOH AIA-360, Japan). Leptin and interleukin-6 (IL-6) were measured by an enzyme-linked immunosorbent assay (ELISA) commercial kit with sensitivity of 0.7 ng/mL (IBL International, Germany) and sensitivity of 0.4 pg/mL (R&D Systems, USA) respectively. Both ELISA assays have intra-and inter-assay coefficient of variation less than 10%.
Obesity was defined as BMI z-score > +2 standard deviation (SD) according to the WHO growth chart. All children in this study were divided into those with MHO and MUO according to the consensus-based definition proposed by Damanhoury et al. (6). Children were classified as MHO if they met all the following criteria: HDL-C > 1.03 mmol/L, TG ≤ 1.7 mmol/L, SBP and DBP ≤ 90th percentile, and FPG ≤ 5.6 mmol/L. Since no consensus was achieved regarding a measure of glycemia, FPG ≤ 5.6 mmol/L was chosen because it was most used in previous studies of MHO in children (10). Children with obesity that did not meet one or more of the above criteria were classified as MUO. Prepubertal was classified as Tanner stage 1 external genitalia development for boys and breast development for girls, while stage 2 and above were defined as pubertal. Abdominal obesity was defined as waist circumference ≥ 90th percentile of the Malaysian children (21). Homeostasis Model Assessment of Insulin Resistance (HOMA-IR) index was calculated as previously described (22), with insulin resistance defined as HOMA-IR index ≥ 2.6 and ≥ 4.0 for prepubertal and pubertal children respectively (23, 24). AST : ALT ratio less than 1 was considered as a high risk for non-alcoholic fatty liver disease (NAFLD) (25). The clinical practice guidelines for screening and management of high blood pressure in children and adolescents (26) was used to calculate blood pressure percentile. Estimated glomerular filtration rate (eGFR) was calculated using modified Schwartz formula (27) with abnormal eGFR defined as < 75 mL/min/1.73m2 (28).
The normality test for continuous data was determined using the Kolmogorov-Smirnov test. Continuous variables were presented as mean (standard deviation) for normally distributed and median (25th percentile, 75th percentile) for non-normally distributed variables, and the differences between obese phenotypes were compared using independent t-test and Mann-Whitney test respectively. Categorical variables were presented as frequency and proportion and comparisons between groups were made using the chi-square test. Multivariate logistic regression was performed and measured by calculating the odds ratio (OR) and 95% confidence interval (95% CI) to identify the predictors associated with MHO phenotype using Hosmer Lemeshow Model building strategy. All analyses were performed using IBM SPSS 26.0 and statistical significance was set at 2-sided P < 0.05.
A total of 425 overweight and obese Malay schoolchildren participated in the MyBFF@school study, of which 274 (65%) consented for blood taking. Out of these, baseline data of 193 children with obesity with BMI z-score > +2 SD were analyzed for obese phenotypes and obesity related clinical and laboratory parameters (Figure 1). The prevalence of MHO among schoolchildren with obesity was 30.1% (95% CI 23.7 – 37.1%). The values of parameters used to characterize children as either MHO or MUO were statistically significant between the two groups except for BMI z-score median [2.64 (2.46, 3.01) vs 2.85 (2.46, 3.17), p-value = 0.16] (Table 1). Among children with MUO phenotype, 88 (65.2%) presented only one risk factor, 38 (28.1%) 2 risk factors, 8 (5.9%) 3 risk factors and only 1 child (0.7%) had all four risk factors. High blood pressure (SBP or DBP > 90th percentile) was the most represented risk factor (51.9%) among MUO children and was significantly higher in boys than in girls (60.0% vs 41.7%, p-value = 0.03). Instead, elevated triglycerides (TG > 1.7 mmol/L) was the least observed risk factor among children with MUO phenotype (Table 2).
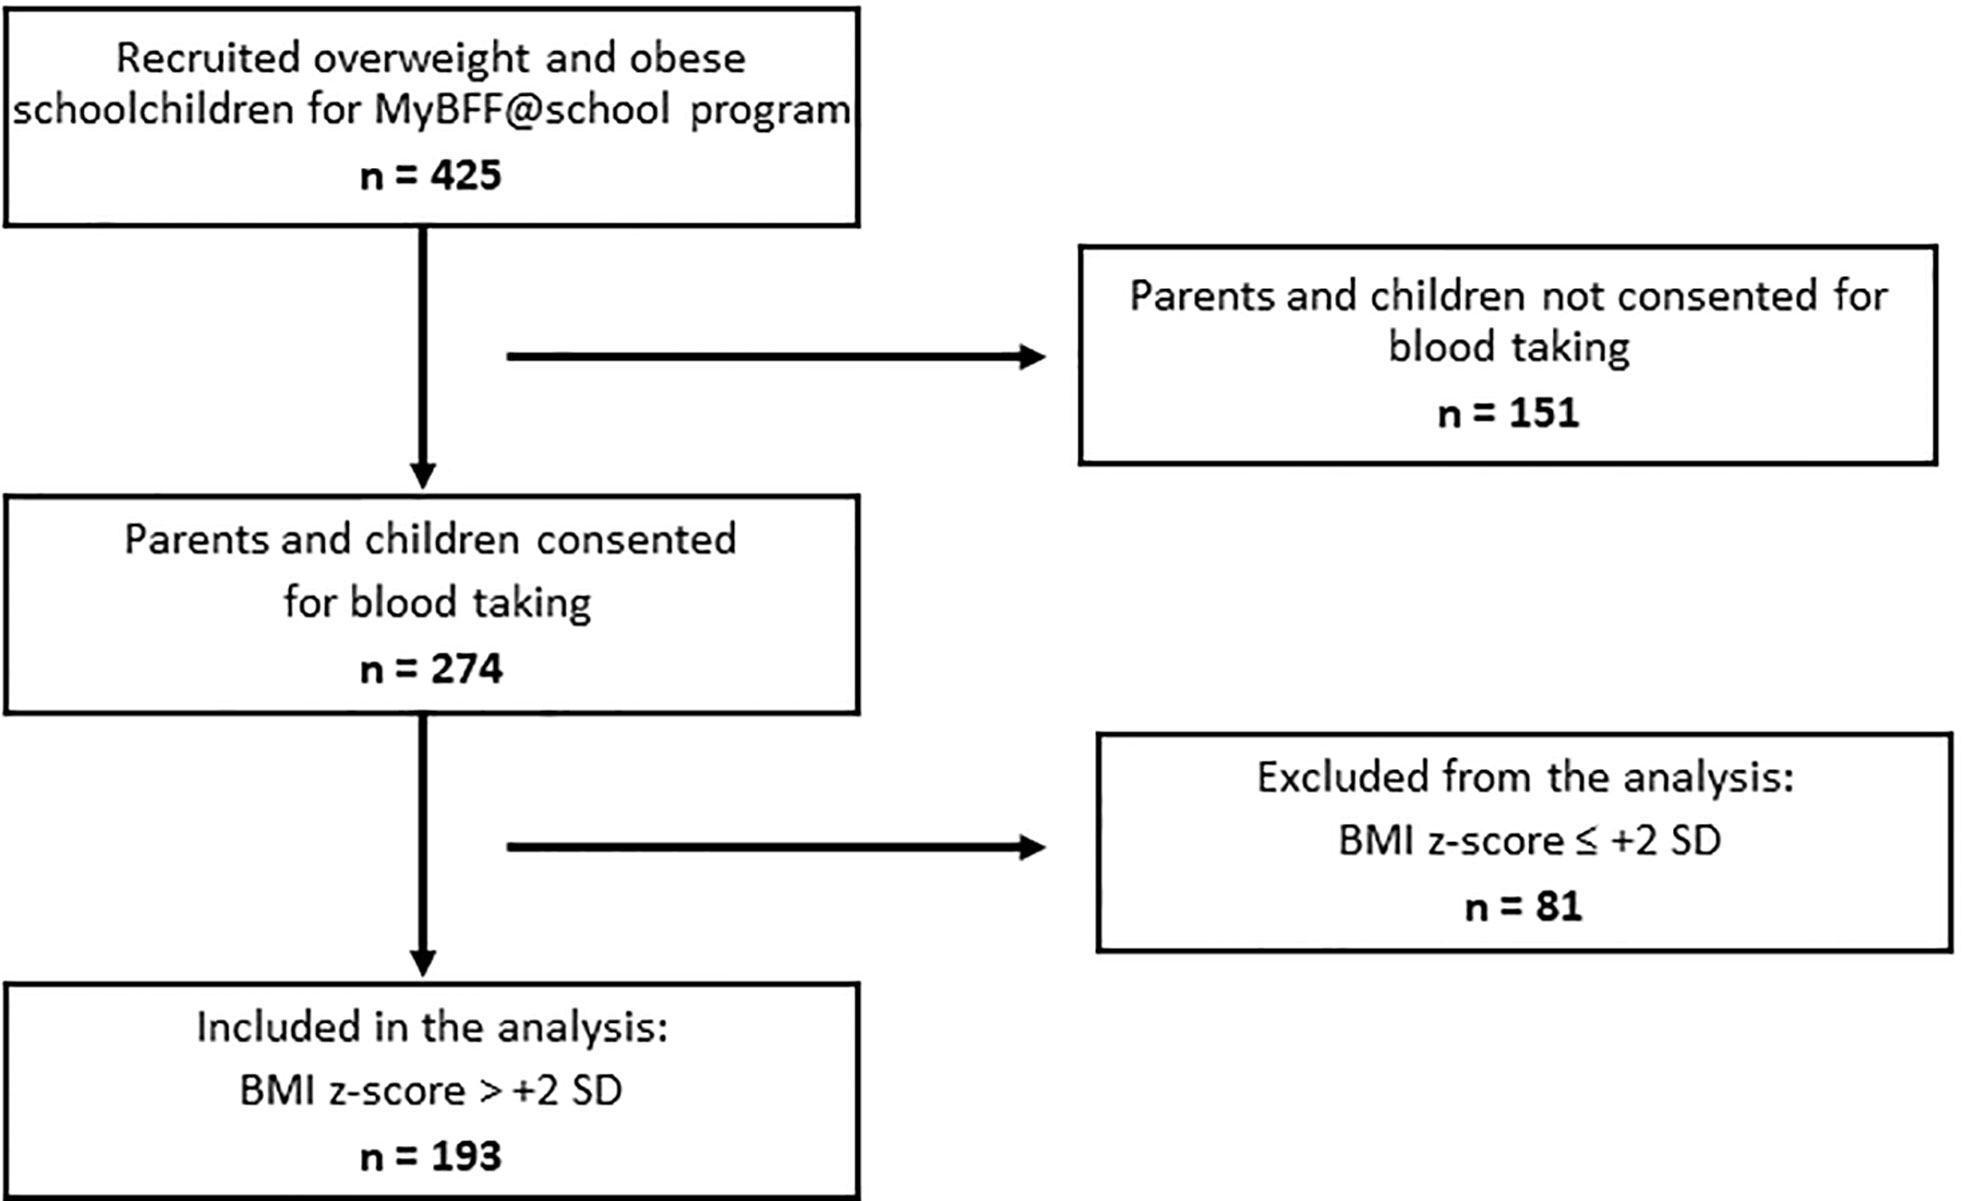
Figure 1 Flow chart for blood selection for MHO and MUO analysis.
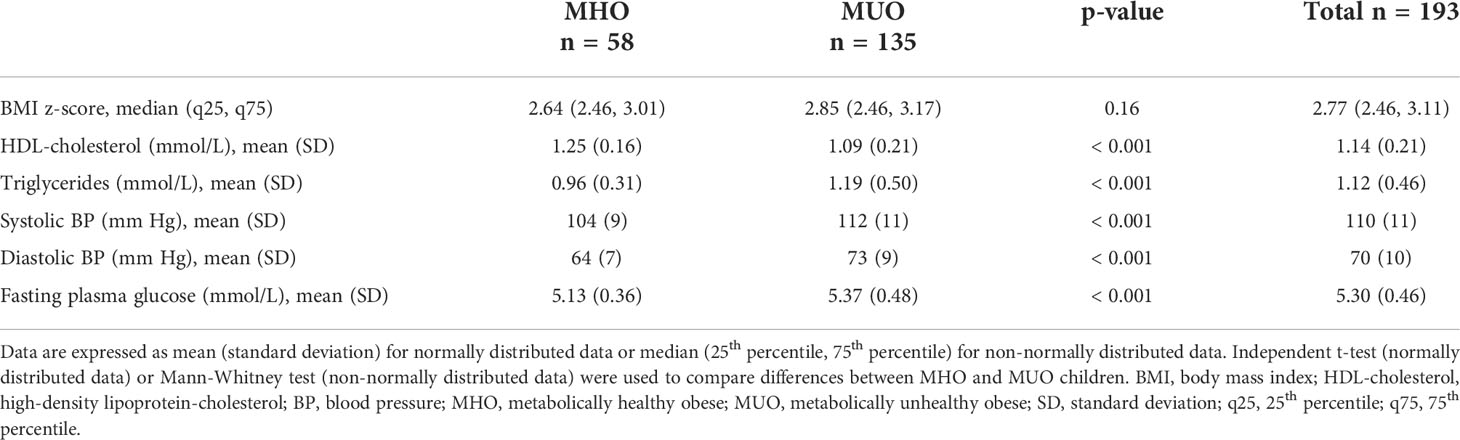
Table 1 Comparison of parameters used as criteria to define metabolically healthy obese (MHO) and metabolically unhealthy obese (MUO) phenotypes.
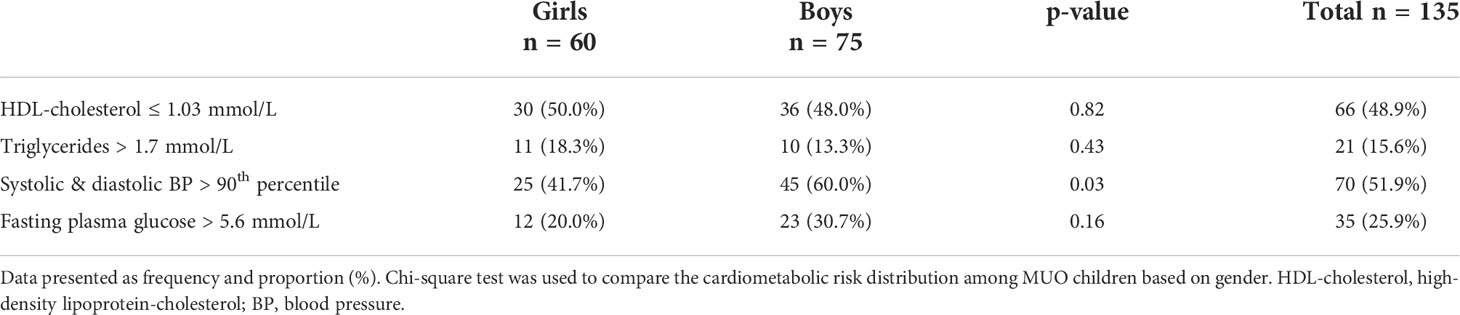
Table 2 Distribution of cardiometabolic risk factors among MUO children by gender.
Obesity-related clinical and laboratory parameters were presented in Table 3. Children with MHO phenotype was significantly younger [11.9 (2.2) vs 12.6 (2.1) years, p-value = 0.03)], had significantly lower BMI [28.4 (3.3) vs 30.0 (3.9) kg/m2, p-value < 0.01] and had significantly lower waist circumference [86.6 (8.5) vs 91.3 (9.8), p-value < 0.01)] as compared to children with MUO phenotype. Moreover, MHO phenotype was more common among prepubertal children with obesity (p-value = 0.02). The presence of acanthosis nigricans (physical marker of insulin resistance) was more common among MUO than in MHO children (p-value = 0.03). Serum apolipoprotein A-1 and adiponectin were significantly higher (p-value < 0.01) in MHO as compared to MUO children with values of 189.7 (36.2) vs 172.3 (34.5) mmol/L and 7.1 (2.4) vs 5.5 (2.1) µg/mL respectively. In addition, serum uric acid was significantly lower in MHO as compared to MUO children [364.7 (65.1) vs 389.5 (65.8) µmol/L, p-value = 0.04)].
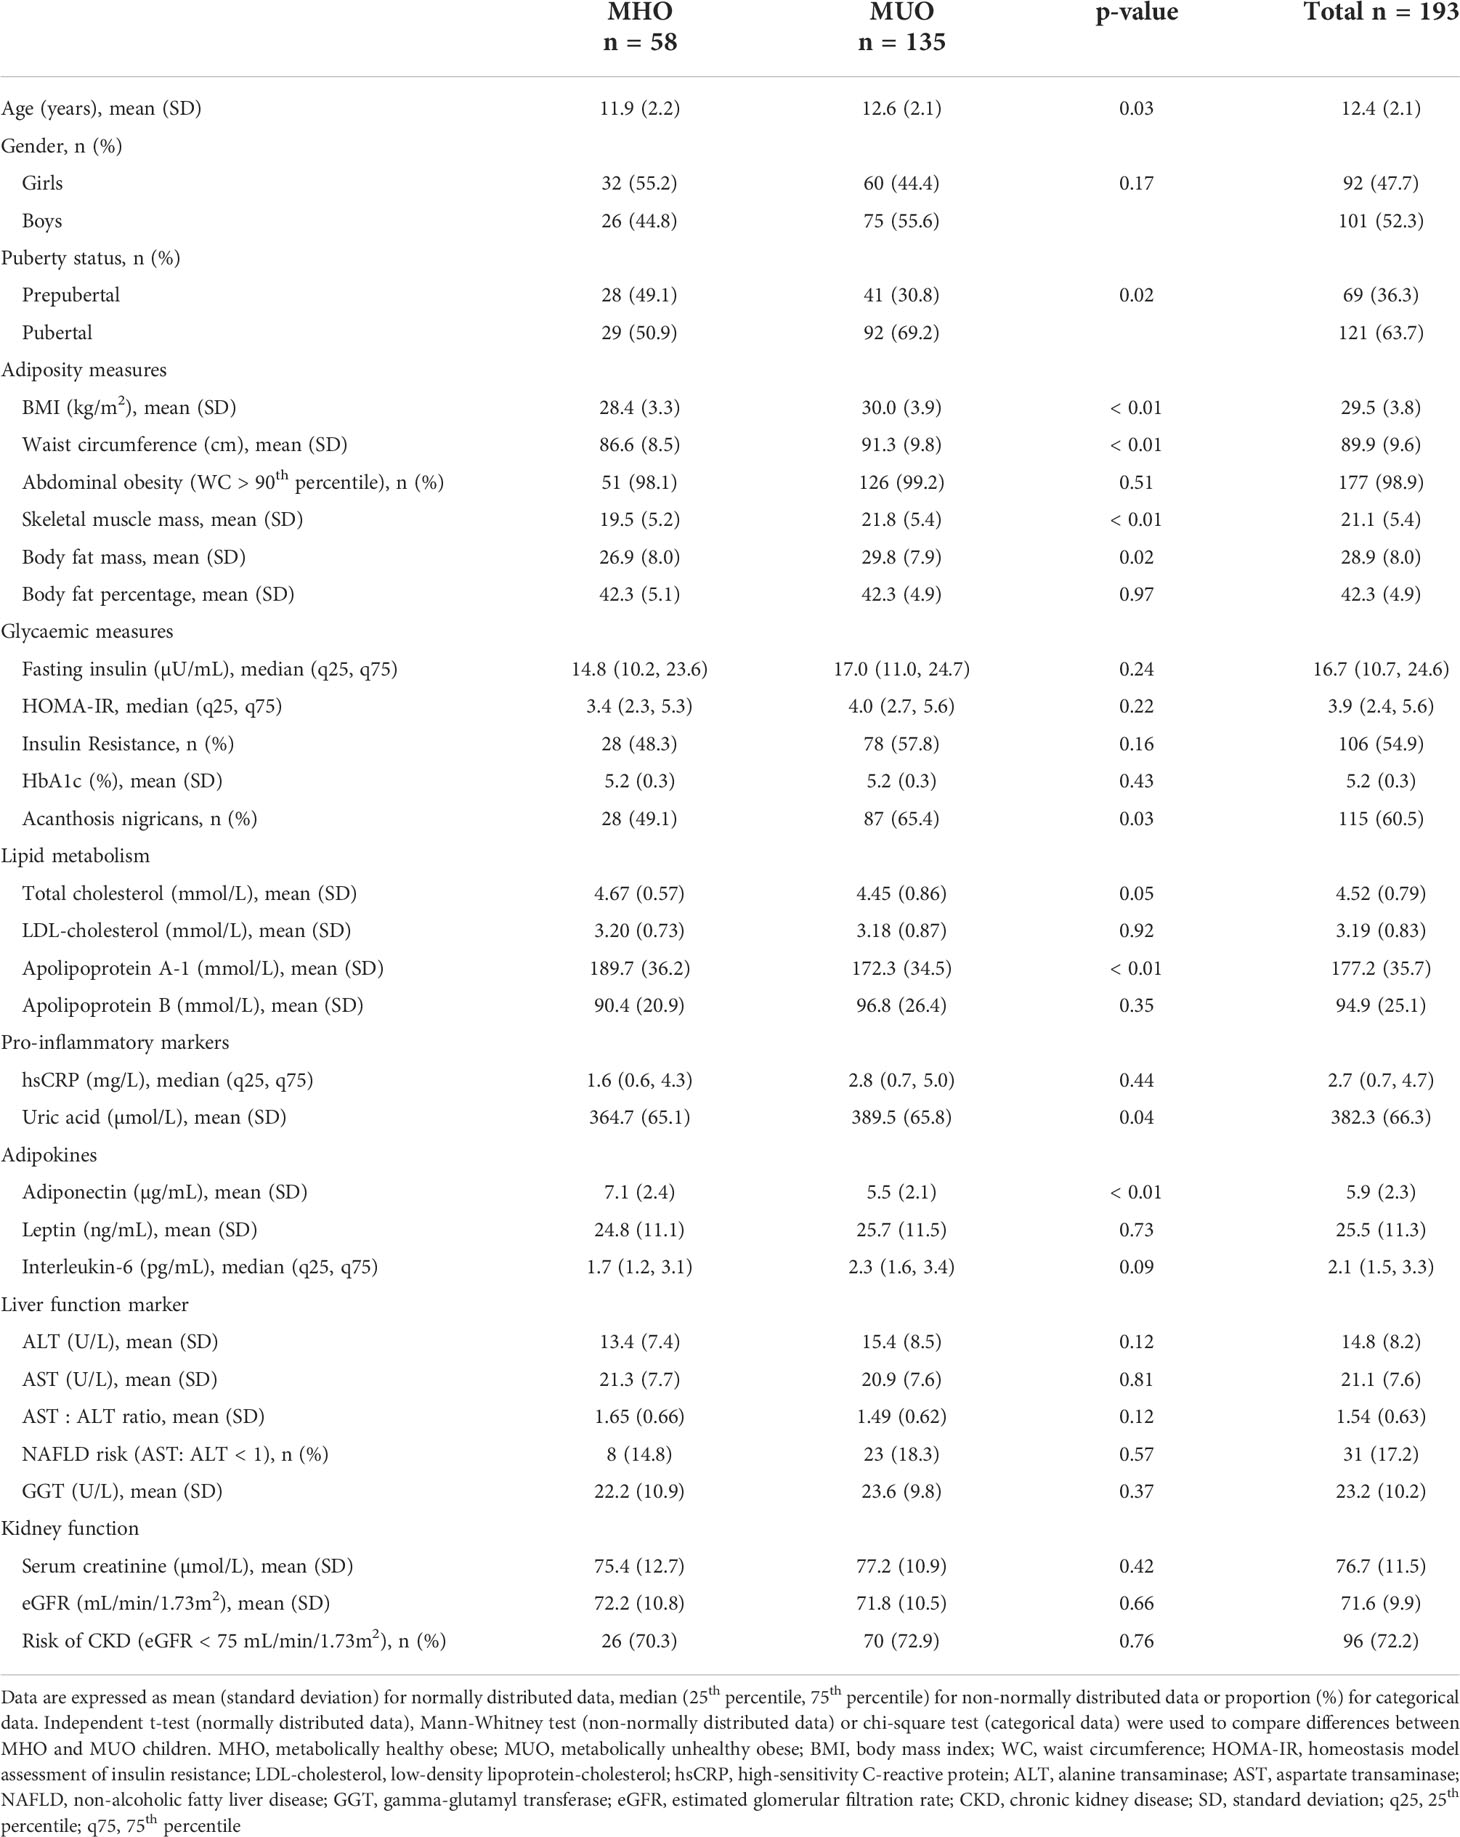
Table 3 Obesity-related clinical and laboratory parameters examined in MHO and MUO children.
Multivariate logistic regression was used to examine the predictors associated with MHO phenotype (Figure 2). Adiponectin and apolipoprotein A-1 are independent predictors for MHO phenotype in schoolchildren with obesity. The probability of being classified as MHO increased by 33% for each increment of 1µg/mL serum adiponectin [(OR: 1.33, 95% CI 1.05 – 1.68), p-value = 0.02], and by 2% for each increment of 1mmol/L serum apolipoprotein A-1 [(OR: 1.02, 95% CI 1.01 – 1.03), p-value = 0.02].
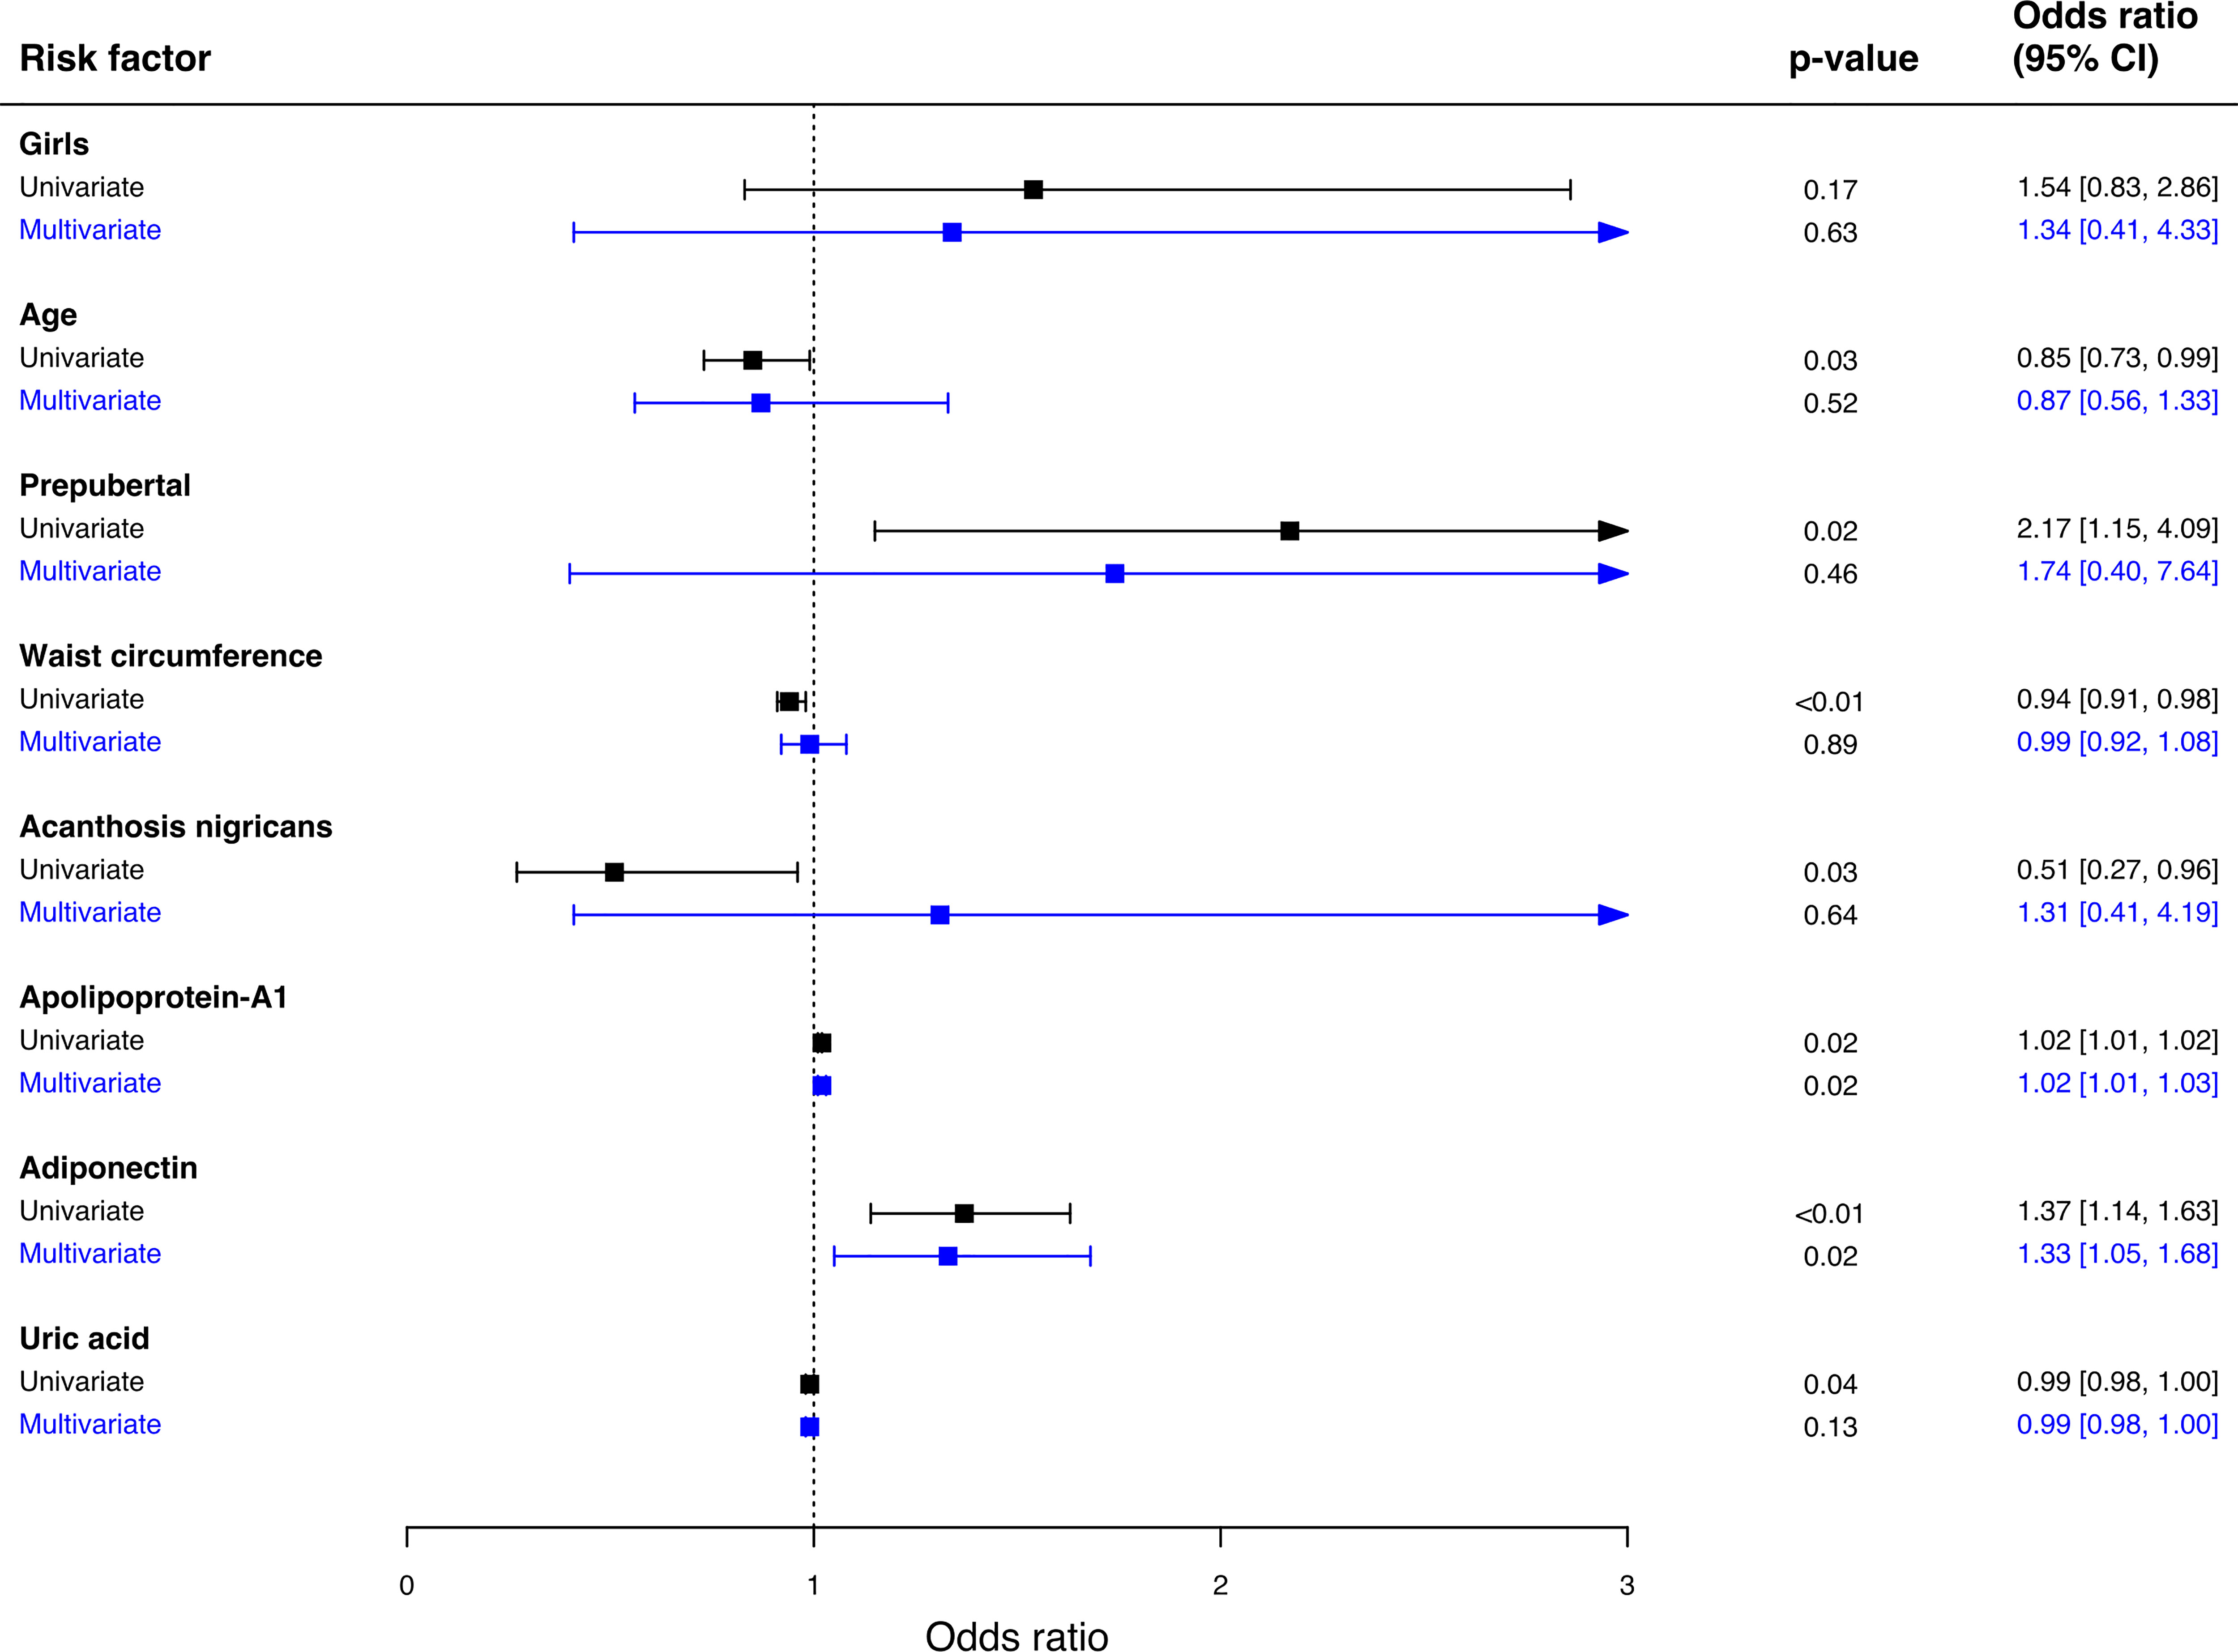
Figure 2 Predictors associated with MHO phenotype. Multivariate logistic regression was used to analyze the association between variables and MHO phenotype. Hosmer Lemeshow Test (chi-square = 5.32, p-value = 0.72), classification table, overall correctly classified percentage = 80.4. 95% CI; 95% confidence interval.
Using the recently proposed consensus-based definition (6), our study demonstrated that the prevalence of MHO was 30.1% (95% CI 23.7 – 37.1) among schoolchildren with obesity in the community, and it was more common among younger and prepubertal children. Compared to MUO, MHO children had significantly lower BMI, lower waist circumference, lower serum uric acid, higher serum adiponectin and higher serum apolipoprotein A-1 levels. Multivariate logistic regression showed that adiponectin and apolipoprotein A-1 were the independent predictors for MHO phenotype in this population.
Similar to other studies, our findings showed that MHO is more common in younger (9, 29–31) and prepubertal (11, 13) children with obesity. These observations may be explained by the physiological and pathological changes children undergo during puberty, which includes a decrease in insulin sensitivity (32). A longitudinal study reported that entering from pre-to mid-puberty caused an increased in insulin resistance and likelihood of switching from MHO to the MUO phenotype, whereas as children progressed from mid-to late puberty, insulin resistance decreased and the likelihood for crossing over from MUO to MHO increased (11). Furthermore, MHO phenotype was found to be more common in girls than in boys (13, 30, 33), and this may be attributed by differences in hormone levels, lifestyle and body fat distribution (34, 35), although the mechanisms are not fully understood. However, we did not see this discrepancy between girls and boys in our study.
Although no consensus was achieved for glycemic measures in the definition by Damanhoury et al., fasting plasma glucose with cut-off of ≤ 5.6 mmol/L was widely used in previous studies of MHO in children (6). In this study, children with MUO phenotype were highly presented with acanthosis nigricans than in children with MHO phenotype despite no significant difference was observed in fasting insulin, HOMA-IR and HbA1c between groups. Evidence indicates that acanthosis nigricans is a marker of glucose metabolism derangement and was associated with insulin resistance in children with obesity (36). Although the hyperinsulinemic-euglycemic clamp is considered the gold standard for the identification of insulin resistance, due to its complexity and invasiveness, the most widespread method for assessing insulin resistance among children is through the calculation of HOMA-IR. Studies have found that children with MHO phenotype had lower HOMA-IR index as compared to children with MUO phenotype (13, 29, 31, 37, 38), however we did not observe this trend and our finding agrees with other more recent studies (39, 40). A study found that both children with MHO and MUO phenotype had significantly higher HOMA-IR when compared to normal weight peers indicating that a state of insulin resistance was already present (40). It is also noteworthy to mention that half of our study population showed insulin resistance. This may suggest that rather than obesity per se, possible differences in the genetic predisposition of each child to develop insulin resistance could also play a role, however, this is beyond the scope of this paper.
Adiposity measures such as BMI and waist circumference have been reported to be independent predictors of MHO phenotype (9, 41, 42). Although our study found that BMI and waist circumference were significantly lower among children with MHO phenotype when compared to MUO, these two adiposity measures were not predictors for MHO phenotype in this studied population. Our findings concur with study by Ooi et al. (29) and this may suggest that there may be other underlying factors that contribute to the MHO phenotype, albeit obesity is a risk factor for metabolic morbidities (43). In addition, higher BMI observed among MUO in our study may be due to higher skeletal muscle mass and fat mass. Indeed, BMI has been reported as a poor predictor of adiposity in children with obesity due to the inability to distinguish between body fat mass and lean tissue mass (44).
Growing evidence suggests that obesity causes low-grade chronic inflammation which adipose tissue inflammation is thought to be involved in the pathogenesis of insulin resistance and cardiovascular complications (45). Adults with MHO phenotype were shown to have better pro-inflammatory markers such as hsCRP and IL-6 compared to MUO phenotype (46), however the association in children remains controversial. We did not observe any significant differences in serum hsCRP and IL-6 between MHO and MUO children, and our findings concur with Serbis et al. (40). Nevertheless, they found that pro-inflammatory markers were significantly elevated among children with obesity when compared to normal weight children, suggesting that obesity is associated with subclinical inflammation even in children with MHO phenotype (40). A more recent study found that hsCRP but not IL-6 was a predictor for MHO children (47). On the other hand, adiponectin, an anti-inflammatory protein was found to be significantly higher among MHO than in MUO children in our study. Multivariate logistic regression showed that adiponectin was an independent predictor for MHO phenotype in this population, and our finding agrees with a study by Fu et al. (48). Higher serum levels of adiponectin have been reported to have a protective effect against cardiovascular risks and was associated with preserved insulin sensitivity in children with obesity (49, 50).
This study found a significantly lower serum uric acid among children with MHO phenotype as compared to children with MUO phenotype. Hyperuricemia was linked to increased risk of developing metabolic syndrome, type 2 diabetes, and cardiovascular diseases in children with obesity (51). Studies have reported that serum uric acid was an independent predictor for MHO phenotype in children with obesity (37, 42), however our regression model could not replicate similar findings. Concerning apolipoprotein A-1, children with MHO phenotype showed significantly higher concentration than children with MUO phenotype in this study. Low concentration of apolipoprotein A-1 is linked to endothelial dysfunction in children with obesity (52). In addition, apolipoprotein A-1 was found to be an independent predictor for MHO phenotype in our studied population, however, this association must be interpreted cautiously as the odd ratio and its 95% confidence interval reaching null value.
Non-alcoholic fatty liver disease (NAFLD) has been linked with obesity, and ALT is the best screening tool to detect NAFLD in children (53). A study found that obese children with metabolic syndrome are more likely to have advanced liver fibrosis compared to those without metabolic syndrome (54). However, none of the liver function markers showed any differences between MHO and MUO children in this study, implying that not only MUO but also those with MHO phenotype are at risk of developing liver dysfunction and possibly NAFLD. Indeed, our studied population showed that 17.2% are at risk of developing NAFLD.
Studies have shown that adults with MHO phenotype are at increased risk of developing chronic kidney disease (CKD) when compared to normal weight counterparts (55, 56). Even though the evidence is not as robust in children, there are several studies that reported risk of developing CKD with obesity (57, 58). Study by Arora et al. found no significant difference in the serum creatinine and eGFR between MHO and MUO children (59), and this is consistent with our findings. However, it should be noted that 72.2% of these schoolchildren with obesity were at increased risk of developing CKD (eGFR < 75 mL/min/1.73m2), thus proves that MHO phenotype is not a benign condition and is associated with long-term development of CKD.
One of the advantages of using the consensus-based definition is the fact that most of the cut-off values were adapted from the definition of metabolic syndrome in children provided by the International Diabetes Federation (IDF) (60), and therefore has been widely used by pediatricians and researchers dealing with childhood obesity. These cut-off values have been shown reliable in children with obesity (6, 15, 29) and therefore should facilitate comparison with future studies to avoid further diversification in defining MHO among children with obesity.
Despite the notable findings in this study, there are several limitations that need to be addressed. Firstly, this study has a relatively small sample size from an epidemiological point of view and employed a cross-sectional design, hence unable to establish the causal relationship between predictors and MHO phenotype. Secondly, it could be speculated that there may be differences in fat distribution between obese phenotypes since reference methods of adiposity estimation were not used, and visceral fat accumulation has been reported to be directly linked with metabolic health (61). Lastly, information on modifiable factors such as diet and lifestyle habits were not available in this study. One of the strengths of this study was that the study population was obtained from community screening. Unlike other studies, most were done at hospital setting (11, 13, 29, 31, 37–40) where the children were already referred to the obesity clinic by their pediatricians. In addition, we measured extended obesity-related biochemical parameters to corroborate that MHO is not a totally benign condition after all.
In conclusion, our study found that one third of children with obesity had MHO phenotype and had better adiponectin and apolipoprotein A-1 levels. However, no differences were observed for other obesity-related blood parameters. Although the definition by Damanhoury et al. (6) can be potentially useful in distinguishing between the MHO and MUO phenotypes in children, this may lead to underestimating the number of children at risk for other obesity-related diseases such as fatty liver and CKD, even in the absence of the traditional cardiometabolic risks. Hence, a more comprehensive and stringent definition is needed, and until then, children with MHO phenotype should be treated similar to all children with obesity.
The raw data supporting the conclusions of this article will be made available by the authors, without undue reservation.
The studies involving human participants were reviewed and approved by Medical Research and Ethics Committee, Ministry of Health Malaysia. Written informed consent to participate in this study was provided by the participants’ legal guardian/next of kin.
WNWM was the principal researcher and was responsible for the overall conception and design of the project, seeking funding, and coordinating with schools for data collection. RMWMZ and AKNZI were responsible for the logistics, data collection, laboratory analysis of samples, data management and statistical analysis. MYJ, FMZ, and JYHH were responsible for conceptualizing the clinical data collection and conducted the clinical examinations on the study participants. AY was responsible for sample size calculation and statistical analysis. AHM was responsible for the conception and design of the project. All authors contributed to the article and approved the submitted version.
This study was fully funded by Ministry of Health Malaysia (grant number: NMRR-13-439-16563).
The authors would like to thank the Director General of Health Malaysia for his permission to publish this article, Dr Othman Warijo, Dr Husni Hussain, and Ministry of Education for their active support. We also would like to express our gratitude to children and parents for agreeing to participate in the MyBFF@school program.
The authors declare that the research was conducted in the absence of any commercial or financial relationships that could be construed as a potential conflict of interest.
All claims expressed in this article are solely those of the authors and do not necessarily represent those of their affiliated organizations, or those of the publisher, the editors and the reviewers. Any product that may be evaluated in this article, or claim that may be made by its manufacturer, is not guaranteed or endorsed by the publisher.
1. NCD Risk Factor Collaboration (NCD-RisC). Worldwide trends in body-mass index, underweight, overweight, and obesity from 1975 to 2016: A pooled analysis of 2416 population-based measurement studies in 128·9 million children, adolescents, and adults. Lancet (2017) 390(10113):2627–42. doi: 10.1016/s0140-6736(17)32129-3
2. Han JC, Lawlor DA, Kimm SYS. Childhood obesity. Lancet (2010) 375(9727):1737–48. doi: 10.1016/S0140-6736(10)60171-7
3. Aune D, Sen A, Prasad M, Norat T, Janszky I, Tonstad S, et al. Bmi and all cause mortality: Systematic review and non-linear dose-response meta-analysis of 230 cohort studies with 3.74 million deaths among 30.3 million participants. Bmj (2016) 353:i2156. doi: 10.1136/bmj.i2156
4. Tsatsoulis A, Paschou SA. Metabolically healthy obesity: Criteria, epidemiology, controversies, and consequences. Curr Obes Rep (2020) 9(2):109–20. doi: 10.1007/s13679-020-00375-0
5. De Lorenzo A, da Cruz Lamas C, Lessa R, Moreira ASB. "Metabolically healthy" obesity: Fact or threat? Curr Diabetes Rev (2018) 14(5):405–10. doi: 10.2174/1573399813666170502105859
6. Damanhoury S, Newton AS, Rashid M, Hartling L, Byrne JLS, Ball GDC. Defining metabolically healthy obesity in children: A scoping review. Obes Rev (2018) 19(11):1476–91. doi: 10.1111/obr.12721
7. Blüher S, Schwarz P. Metabolically healthy obesity from childhood to adulthood - does weight status alone matter? Metabolism (2014) 63(9):1084–92. doi: 10.1016/j.metabol.2014.06.009
8. Yoon DY, Lee YA, Lee J, Kim JH, Shin CH, Yang SW. Prevalence and clinical characteristics of metabolically healthy obesity in Korean children and adolescents: Data from the Korea national health and nutrition examination survey. J Korean Med Sci (2017) 32(11):1840–7. doi: 10.3346/jkms.2017.32.11.1840
9. Prince RL, Kuk JL, Ambler KA, Dhaliwal J, Ball GD. Predictors of metabolically healthy obesity in children. Diabetes Care (2014) 37(5):1462–8. doi: 10.2337/dc13-1697
10. Vukovic R, Dos Santos TJ, Ybarra M, Atar M. Children with metabolically healthy obesity: A review. Front Endocrinol (Lausanne) (2019) 10:865. doi: 10.3389/fendo.2019.00865
11. Reinehr T, Wolters B, Knop C, Lass N, Holl RW. Strong effect of pubertal status on metabolic health in obese children: A longitudinal study. J Clin Endocrinol Metab (2015) 100(1):301–8. doi: 10.1210/jc.2014-2674
12. Blüher M. Are metabolically healthy obese individuals really healthy? Eur J Endocrinol (2014) 171(6):R209–19. doi: 10.1530/eje-14-0540
13. Vukovic R, Milenkovic T, Mitrovic K, Todorovic S, Plavsic L, Vukovic A, et al. Preserved insulin sensitivity predicts metabolically healthy obese phenotype in children and adolescents. Eur J Pediatr (2015) 174(12):1649–55. doi: 10.1007/s00431-015-2587-4
14. Weghuber D, Zelzer S, Stelzer I, Paulmichl K, Kammerhofer D, Schnedl W, et al. High risk vs. "Metabolically healthy" phenotype in juvenile obesity - neck subcutaneous adipose tissue and serum uric acid are clinically relevant. Exp Clin Endocrinol Diabetes (2013) 121(7):384–90. doi: 10.1055/s-0033-1341440
15. Bervoets L, Massa G. Classification and clinical characterization of metabolically "Healthy" obese children and adolescents. J Pediatr Endocrinol Metab (2016) 29(5):553–60. doi: 10.1515/jpem-2015-0395
16. Cadenas-Sanchez C, Ruiz JR, Labayen I, Huybrechts I, Manios Y, González-Gross M, et al. Prevalence of metabolically healthy but Overweight/Obese phenotype and its association with sedentary time, physical activity, and fitness. J Adolesc Health (2017) 61(1):107–14. doi: 10.1016/j.jadohealth.2017.01.018
17. Iwani NA, Jalaludin MY, Zin RM, Fuziah MZ, Hong JY, Abqariyah Y, et al. Triglyceride to hdl-c ratio is associated with insulin resistance in overweight and obese children. Sci Rep (2017) 7:40055. doi: 10.1038/srep40055
18. Marshall WA, Tanner JM. Variations in pattern of pubertal changes in girls. Arch Dis Child (1969) 44(235):291–303. doi: 10.1136/adc.44.235.291
19. Marshall WA, Tanner JM. Variations in the pattern of pubertal changes in boys. Arch Dis Childhood (1970) 45(239):13. doi: 10.1136/adc.45.239.13
20. Burke JP, Hale DE, Hazuda HP, Stern MP. A quantitative scale of acanthosis nigricans. Diabetes Care (1999) 22(10):1655–9. doi: 10.2337/diacare.22.10.1655
21. Poh BK, Jannah AN, Chong LK, Ruzita AT, Ismail MN, McCarthy D. Waist circumference percentile curves for Malaysian children and adolescents aged 6.0-16.9 years. Int J Pediatr Obes (2011) 6(3-4):229–35. doi: 10.3109/17477166.2011.583658
22. Wallace TM, Levy JC, Matthews DR. Use and abuse of homa modeling. Diabetes Care (2004) 27(6):1487–95. doi: 10.2337/diacare.27.6.1487
23. Reinehr T, Andler W. Changes in the atherogenic risk factor profile according to degree of weight loss. Arch Dis Childhood (2004) 89(5):419. doi: 10.1136/adc.2003.028803
24. Yin J, Li M, Xu L, Wang Y, Cheng H, Zhao X, et al. Insulin resistance determined by homeostasis model assessment (Homa) and associations with metabolic syndrome among Chinese children and teenagers. Diabetol Metab Syndr (2013) 5(1):71–. doi: 10.1186/1758-5996-5-71
25. Matteoni CA, Younossi ZM, Gramlich T, Boparai N, Liu YC, McCullough AJ. Nonalcoholic fatty liver disease: A spectrum of clinical and pathological severity. Gastroenterology (1999) 116(6):1413–9. doi: 10.1016/S0016-5085(99)70506-8
26. Flynn JT, Kaelber DC, Baker-Smith CM, Blowey D, Carroll AE, Daniels SR, et al. Clinical practice guideline for screening and management of high blood pressure in children and adolescents. Pediatrics (2017) 140(3):e20171904. doi: 10.1542/peds.2017-1904
27. Schwartz GJ, Work DF. Measurement and estimation of gfr in children and adolescents. Clin J Am Soc Nephrol (2009) 4(11):1832. doi: 10.2215/CJN.01640309
28. Pottel H, Hoste L, Delanaye P. Abnormal glomerular filtration rate in children, adolescents and young adults starts below 75 Ml/Min/1.73 M(2). Pediatr Nephrol (2015) 30(5):821–8. doi: 10.1007/s00467-014-3002-5
29. Ooi DSQ, Ong SG, Lee OMH, Chan YH, Lim YY, Ho CWL, et al. Prevalence and predictors of metabolically healthy obesity in severely obese Asian children. Pediatr Res (2022). doi: 10.1038/s41390-022-01941-z
30. Elmaogullari S, Demirel F, Hatipoglu N. Risk factors that affect metabolic health status in obese children. J Pediatr Endocrinol Metab (2017) 30(1):49–55. doi: 10.1515/jpem-2016-0128
31. Khokhar A, Chin V, Perez-Colon S, Farook T, Bansal S, Kochummen E, et al. Differences between metabolically healthy vs unhealthy obese children and adolescents. J Natl Med Assoc (2017) 109(3):203–10. doi: 10.1016/j.jnma.2017.02.008
32. Amiel SA, Sherwin RS, Simonson DC, Lauritano AA, Tamborlane WV. Impaired insulin action in puberty. a contributing factor to poor glycemic control in adolescents with diabetes. N Engl J Med (1986) 315(4):215–9. doi: 10.1056/nejm198607243150402
33. Heinzle S, Ball GD, Kuk JL. Variations in the prevalence and predictors of prevalent metabolically healthy obesity in adolescents. Pediatr Obes (2016) 11(5):425–33. doi: 10.1111/ijpo.12083
34. Aldhoon-Hainerová I, Zamrazilová H, Hill M, Hainer V. Insulin sensitivity and its relation to hormones in adolescent boys and girls. Metabolism (2017) 67:90–8. doi: 10.1016/j.metabol.2016.10.005
35. Isasi CR, Parrinello CM, Ayala GX, Delamater AM, Perreira KM, Daviglus ML, et al. Sex differences in cardiometabolic risk factors among Hispanic/Latino youth. J Pediatr (2016) 176:121–7.e1. doi: 10.1016/j.jpeds.2016.05.037
36. Maguolo A, Maffeis C. Acanthosis nigricans in childhood: A cutaneous marker that should not be underestimated, especially in obese children. Acta Paediatrica (2020) 109(3):481–7. doi: 10.1111/apa.15031
37. Genovesi S, Antolini L, Orlando A, Gilardini L, Bertoli S, Giussani M, et al. Cardiovascular risk factors associated with the metabolically healthy obese (Mho) phenotype compared to the metabolically unhealthy obese (Muo) phenotype in children. Front Endocrinol (2020) 11:27. doi: 10.3389/fendo.2020.00027
38. Vinciguerra F, Tumminia A, Baratta R, Ferro A, Alaimo S, Hagnäs M, et al. Prevalence and clinical characteristics of children and adolescents with metabolically healthy obesity: Role of insulin sensitivity. Life (Basel) (2020) 10(8):127. doi: 10.3390/life10080127
39. Nso-Roca AP, Cortés Castell E, Carratalá Marco F, Sánchez Ferrer F. Insulin resistance as a diagnostic criterion for metabolically healthy obesity in children. J Pediatr Gastroenterol Nutr (2021) 73(1):103–9. doi: 10.1097/mpg.0000000000003097
40. Serbis A, Giapros V, Paschou SA, Siomou E. Children with metabolically healthy obesity have a worse metabolic profile compared to normal-weight peers: A cross-sectional study. Endocrine (2021) 73(3):580–7. doi: 10.1007/s12020-021-02762-6
41. Nasreddine L, Tamim H, Mailhac A, AlBuhairan FS. Prevalence and predictors of metabolically healthy obesity in adolescents: Findings from the national "Jeeluna" study in Saudi-Arabia. BMC Pediatr (2018) 18(1):281. doi: 10.1186/s12887-018-1247-z
42. Rocha E, Vogel M, Stanik J, Pietzner D, Willenberg A, Körner A, et al. Serum uric acid levels as an indicator for metabolically unhealthy obesity in children and adolescents. Horm Res Paediatr (2018) 90(1):19–27. doi: 10.1159/000490113
43. Gepstein V, Weiss R. Obesity as the main risk factor for metabolic syndrome in children. Front Endocrinol (Lausanne) (2019) 10:568. doi: 10.3389/fendo.2019.00568
44. Vanderwall C, Randall Clark R, Eickhoff J, Carrel AL. Bmi is a poor predictor of adiposity in young overweight and obese children. BMC Pediatr (2017) 17(1):135. doi: 10.1186/s12887-017-0891-z
45. Lumeng CN, Saltiel AR. Inflammatory links between obesity and metabolic disease. J Clin Invest (2011) 121(6):2111–7. doi: 10.1172/jci57132
46. Perreault M, Zulyniak MA, Badoud F, Stephenson S, Badawi A, Buchholz A, et al. A distinct fatty acid profile underlies the reduced inflammatory state of metabolically healthy obese individuals. PloS One (2014) 9(2):e88539. doi: 10.1371/journal.pone.0088539
47. Zhou J, Bai L, Dong Y, Cai R, Ding W. The association between a metabolically healthy Overweight/Obesity phenotype and markers of inflammation among Chinese children and adolescents aged 10-18 years. J Pediatr Endocrinol Metab (2022) 35(1):109–14. doi: 10.1515/jpem-2021-0224
48. Fu J, Li Y, Esangbedo IC, Li G, Feng D, Li L, et al. Circulating osteonectin and adipokine profiles in relation to metabolically healthy obesity in Chinese children: Findings from bcams. J Am Heart Assoc (2018) 7(23):e009169. doi: 10.1161/jaha.118.009169
49. Klöting N, Fasshauer M, Dietrich A, Kovacs P, Schön MR, Kern M, et al. Insulin-sensitive obesity. Am J Physiol Endocrinol Metab (2010) 299(3):E506–15. doi: 10.1152/ajpendo.00586.2009
50. Orlando A, Nava E, Giussani M, Genovesi S. Adiponectin and cardiovascular risk. from pathophysiology to clinic: Focus on children and adolescents. Int J Mol Sci (2019) 20(13):3228. doi: 10.3390/ijms20133228
51. Invitti C, Maffeis C, Gilardini L, Pontiggia B, Mazzilli G, Girola A, et al. Metabolic syndrome in obese Caucasian children: Prevalence using who-derived criteria and association with nontraditional cardiovascular risk factors. Int J Obes (Lond) (2006) 30(4):627–33. doi: 10.1038/sj.ijo.0803151
52. Tounian P, Aggoun Y, Dubern B, Varille V, Guy-Grand B, Sidi D, et al. Presence of increased stiffness of the common carotid artery and endothelial dysfunction in severely obese children: A prospective study. Lancet (2001) 358(9291):1400–4. doi: 10.1016/S0140-6736(01)06525-4
53. Vos MB, Abrams SH, Barlow SE, Caprio S, Daniels SR, Kohli R, et al. Naspghan clinical practice guideline for the diagnosis and treatment of nonalcoholic fatty liver disease in children: Recommendations from the expert committee on nafld (Econ) and the north American society of pediatric gastroenterology, hepatology and nutrition (Naspghan). J Pediatr Gastroenterol Nutr (2017) 64(2):319–34. doi: 10.1097/mpg.0000000000001482
54. Ting Y-W, Wong S-W, Anuar Zaini A, Mohamed R, Jalaludin MY. Metabolic syndrome is associated with advanced liver fibrosis among pediatric patients with non-alcoholic fatty liver disease. Front Pediatr (2019) 7:491. doi: 10.3389/fped.2019.00491
55. Chang Y, Ryu S, Choi Y, Zhang Y, Cho J, Kwon MJ, et al. Metabolically healthy obesity and development of chronic kidney disease: A cohort study. Ann Intern Med (2016) 164(5):305–12. doi: 10.7326/m15-1323
56. Jung CH, Lee MJ, Kang YM, Hwang JY, Kim EH, Park JY, et al. The risk of chronic kidney disease in a metabolically healthy obese population. Kidney Int (2015) 88(4):843–50. doi: 10.1038/ki.2015.183
57. Nehus E, Mitsnefes M. Childhood obesity and the metabolic syndrome. Pediatr Clinics North America (2019) 66(1):31–43. doi: 10.1016/j.pcl.2018.08.004
58. Kelishadi R, Gheissari A, Bazookar N, Motlagh ME, Taslimi M, Ardalan G. Kidney function in obese adolescents with or without metabolic syndrome in a nationally-representative sample of pediatric population: First report from the middle East and north Africa: The Caspian-iii study: A case-control study. J Res Med Sci (2013) 18(3):178–83.
59. Arora S, Dunkley L, Waldman LM, Chin VL, Umpaichitra V. Kidney function in minority children and adolescents with metabolically healthy and unhealthy obesity. Clin Obes (2020) 10(1):e12345. doi: 10.1111/cob.12345
60. Zimmet P, Alberti KG, Kaufman F, Tajima N, Silink M, Arslanian S, et al. The metabolic syndrome in children and adolescents - an idf consensus report. Pediatr Diabetes (2007) 8(5):299–306. doi: 10.1111/j.1399-5448.2007.00271.x
Keywords: obesity, children, metabolically healthy obese, metabolically unhealthy obese, cardiometabolic risk
Citation: Wan Mohd Zin RM, Jalaludin MY, Yahya A, Nur Zati Iwani AK, Md Zain F, Hong JYH, Mokhtar AH and Wan Mohamud WN (2022) Prevalence and clinical characteristics of metabolically healthy obese versus metabolically unhealthy obese school children. Front. Endocrinol. 13:971202. doi: 10.3389/fendo.2022.971202
Received: 16 June 2022; Accepted: 03 August 2022;
Published: 22 August 2022.
Edited by:
Bo Xi, Shandong University, ChinaReviewed by:
Mihaela Jurdana, University of Primorska, SloveniaCopyright © 2022 Wan Mohd Zin, Jalaludin, Yahya, Nur Zati Iwani, Md Zain, Hong, Mokhtar and Wan Mohamud. This is an open-access article distributed under the terms of the Creative Commons Attribution License (CC BY). The use, distribution or reproduction in other forums is permitted, provided the original author(s) and the copyright owner(s) are credited and that the original publication in this journal is cited, in accordance with accepted academic practice. No use, distribution or reproduction is permitted which does not comply with these terms.
*Correspondence: Muhammad Yazid Jalaludin, eWF6aWRqYWxAdW0uZWR1Lm15
Disclaimer: All claims expressed in this article are solely those of the authors and do not necessarily represent those of their affiliated organizations, or those of the publisher, the editors and the reviewers. Any product that may be evaluated in this article or claim that may be made by its manufacturer is not guaranteed or endorsed by the publisher.
Research integrity at Frontiers
Learn more about the work of our research integrity team to safeguard the quality of each article we publish.