
95% of researchers rate our articles as excellent or good
Learn more about the work of our research integrity team to safeguard the quality of each article we publish.
Find out more
ORIGINAL RESEARCH article
Front. Endocrinol. , 08 August 2022
Sec. Reproduction
Volume 13 - 2022 | https://doi.org/10.3389/fendo.2022.950105
This article is part of the Research Topic Developmental Biology and Endocrine Research for a Successful Pregnancy View all 16 articles
 Jingyi Ren1
 Guangqing Tan1
 Xinyi Ren1
 Weiyu Lu1
 Qiling Peng2
 Jing Tang3,4
 Yingxiong Wang2,3
 Biao Xie5*
 Meijiao Wang1,3*
Polycystic ovary syndrome (PCOS) exerts negative effects on females of childbearing age. It is important to identify more suitable models for fundamental research on PCOS. We evaluated animal models from a novel perspective with the aim of helping researchers select the best model for PCOS. RNA sequencing was performed to investigate the mRNA expression profiles in the ovarian tissues of mice with dehydroepiandrosterone (DHEA) plus high-fat diet (HFD)-induced PCOS. Meanwhile, 14 datasets were obtained from the Gene Expression Omnibus (GEO), including eight studies on humans, three on rats and three on mice, and genes associated with PCOS were obtained from the PCOSKB website. We compared the consistency of each animal model and human PCOS in terms of DEGs and pathway enrichment analysis results. There were 239 DEGs shared between prenatally androgenized (PNA) mice and PCOS patients. Moreover, 1113 genes associated with PCOS from the PCOSKB website were identified among the DEGs of PNA mice. A total of 134 GO and KEGG pathways were shared between PNA mice and PCOS patients. These findings suggest that the PNA mouse model is the best animal model to simulate PCOS.
Polycystic ovary syndrome (PCOS) is an endocrine disorder characterized by hyperandrogenemia, ovulatory dysfunction and metabolic abnormalities and is common among childbearing-aged females (1–4). PCOS has a negative impact on 5-10% of women (2, 5), but its pathogenesis is still unclear (6). Despite the differences in reproductive physiology between experimental animals and humans (7), the limitations related to ethical issues and specifically to obtaining material for research in humans are undeniable. The ease of obtaining and raising experimental animals has also led to a greater use of animal models in basic research on the pathophysiology of PCOS (8, 9).
Various animal models of PCOS have been explored and studied for over 60 years (8). According to the Rotterdam criteria for PCOS diagnosis (2), the main features of PCOS are excess androgens, increased numbers of cystic follicles, and abnormal menstrual cycles (estrous cycles in animal models). The widely used animal models of PCOS include the androgen model (10, 11), estrogen model (12, 13), aromatase inhibitor model (14, 15) and combined models, such as the dehydroepiandrosterone (DHEA) plus high fat diet (HFD)-induced mouse model (16), high-fat high-sugar (HFHS)-induced mouse model (17, 18), etc. Although a variety of PCOS animal models have been established for research purposes, there is still disagreement which model best recapitulates the disease (19, 20). Thus, the choice of an optimal model remains an important issue.
Whether the reproductive characteristics of the model meet the Rotterdam criteria for PCOS diagnosis and their degree of similarity to the characteristics of PCOS patients are the main concerns for researchers in selecting the best model. However, there is still controversy about which model is best because no single animal model exhibits all of the key pathophysiological features of patients with PCOS. Bioinformatics analysis of data from many different studies of PCOS could help us determine how the potential mechanisms cause phenotypic alterations.
Therefore, it is necessary to evaluate PCOS animal models from a novel perspective. In this study, we compared the eight groups of PCOS animal models’ data (our data the mRNA expression profile of a DHEA plus HFD-induced PCOS mouse model, and seven groups’ data from public databases) with PCOS patients’ data to identify the consistency of differentially expressed genes (DEGs) of PCOS and control, respectively. It provides new insights and reliable references for researchers when selecting models.
The workflow diagram is illustrated in Figure 1.
All animal studies were approved by the Ethics Committee of Chongqing Medical University. PCOS model mice were established as described by Wang et al. (21). Twenty-one-day-old female C57BL/6J mice were obtained from the animal research center of Chongqing Medical University. All animals were maintained under standard housing conditions (20 °C and 12 h day/night cycles) with free access to water and food according to the institutional guidelines. After four days of acclimatization, the mice were randomly divided into two groups (a control group of 25 mice and a PCOS group of 20 mice). The mice in the PCOS group were injected with DHEA (6 mg/100 g/d) dissolved in 0.1 ml of sesame oil daily and fed a HFD (60% of calories from fat). The control mice were injected with 0.1 ml of sesame oil daily and fed normal chow.
The estrous cycle was examined by vaginal smears. Inspections were performed daily at 9:00 a.m. for ten consecutive days before sacrifice. The estrous cycle was determined by analysis of vaginal smears under a microscope. If leukocytes were the predominant cell type, the sample was determined to be in the diestrus stage. If nucleated cells were abundant, the sample was considered to be in the proestrus stage. If cornified squamous epithelial cells were the predominant cell type, the sample was determined to be in the estrus stage. If squamous epithelial cells and leukocytes were abundant, the sample was considered to be in the metestrus stage. Mice already in estrus were sacrificed to eliminate the effect of the estrous cycle on the rest of the experiment.
The serum testosterone (T) concentrations of the mice were determined using commercial iodine [125I] radioimmunoassay kits (North Institute, Bio-Tech, Beijing, China). The intra- and inter-assay errors among all assays were <10% and 15%, respectively. The sensitivity limit of testosterone was 0.02 ng/mL.
Ovaries were sectioned at 4 μm, with 40 μm discarded between every section, and six sections were collected from each ovary. Sections were stained with hematoxylin and eosin (H&E) according to standard histological procedures and analyzed by conventional light microscopy. The examination was performed by two histologists who were unaware of the source of the material. Follicles were classified according to Kauffman et al. (22).
Ovarian tissues from PCOS and control mice were taken, and total RNA was extracted by the TRIzol method. RNA sequencing (RNA-seq) was conducted by Beijing Allwegene Technology Company Limited (Beijing, China). The cDNA library was constructed by polymerase chain reaction (PCR). RNA-seq was performed using the PE150 sequencing strategy of Illumina’s second-generation high-throughput sequencing platform. Poor quality RNA-seq reads and adapters were filtered out. Clean read data were aligned using Tophat2 and Cufflinks software to complete the transcriptome comparison (23).
Gene expression profiles from PCOS patients were obtained from the Gene Expression Omnibus (GEO; https://www.ncbi.nlm.nih.gov/geo/). In this study, the eight datasets from PCOS patients were GSE1615, GSE5850, GSE10946, GSE34526, GSE98595, GSE102293, GSE137684 and GSE168404. Three datasets from rats are GSE108499, GSE83220 and GSEGS59456. Three datasets from mice are GSE156895, GSE103056 and GSE171431. These data are shown in Table 1. Using the exprSet function in the “limma” package (version 3.42.2), the data were normalized to produce the expression matrix. The sample consisted of the PCOS group and the control group. Genes associated with PCOS were obtained from the PCOSKB database (http://pcoskb.bicnirrh.res.in/), a compilation of molecular, biochemical and clinical databases on PCOS (24).
The useMart function in the “biomaRt” R package was used to establish a relationship with the Ensembl BioMart web service, and the datasets were selected by setting the dataset parameter to hsapiens_gene_ensembl, mmusculus_gene_ensembl and rnorvegicus_gene_ensembl (25). The 14 datasets obtained from the GEO database were intersected with our data to obtain the shared genes.
The Empirical Bayes (EB) method was used to remove batch effects among different datasets (26). Principal component analysis (PCA) was performed to visualize the results of batch effect removal using EB. Datasets with the same animal model method were merged, while eight datasets of PCOS patients were also merged.
For each group of PCOS animal models and PCOS patients, DEGs were screened by comparing the PCOS group with the control group using Student’s t test. The DEGs were identified according to P < 0.05, t value > 0 for up-regulated genes and t value < 0 for down-regulated genes. To identify the functions of the DEGs, Gene Ontology (GO) enrichment analysis was performed for three categories: biological processes (BP), cellular component (CC) and molecular function (MF). Kyoto Encyclopedia of Genes and Genomes (KEGG) pathway enrichment analysis was performed to determine the function of DEGs.
Protein-protein interaction (PPI) network analysis of the DEGs was conducted using the STRING online biological database (https://string-db.org/) with a threshold value of ≥ 0.4 (medium confidence). PPI networks were constructed and visualized using Cytoscape software (http://cytoscape.org/). The Molecular Complex Detection (MCODE) and CytoHubba plug-ins were utilized to analyze the modules and hub genes of the PPI network in Cytoscape, respectively. The GeneCards database (https://www.genecards.org/) was searched to determine the functions of the hub genes.
Student’s t test and false discovery rate (FDR) were applied in the identification of DEGs. The “sva” package (version 3.34.0) is used for batch effect removal. The “biomaRt” R package (version 2.42.1) was used for homology processing among different species. The “clusterProfiler” R package (version 3.14.3) was used to cluster the DEG enrichment pathways, and the “GOplot” package (version 1.0.2) and “ggplot2” (version 3.3.5) were used to visualize the results of the enrichment analysis. Statistical analysis was performed using R software (version 3.6.3). In the animal experiments, Student’s t test was used to analyze the serum testosterone concentration, and GraphPad Prism 9 was used for plotting. All data are presented as the mean ± SD. A two-sided P value < 0.05 indicated that the difference was statistically significant.
H&E staining showed increased numbers of atretic and cystic follicles and decreased numbers of corpora lutea in the ovarian tissues of PCOS mice compared with control mice (P < 0.05, P < 0.001; Supplementary Figures 1A–C). Furthermore, an irregular estrous cycle (Supplementary Figures 1E, F) and elevated serum testosterone levels (P < 0.001; Supplementary Figure 1D) were observed in this model compared with the control, which indicated that the PCOS model was successfully constructed. RNA-seq analysis was performed on three ovarian tissue samples in each group of control and PCOS patients, and DEGs were screened out.
The homology analysis of the datasets is shown in Supplementary Table 1, and 5724 shared genes were obtained from the intersection. As shown in Figures 2A, C, E, there were batch effects among the different datasets. The EB method was used to remove batch effects and cluster all samples together, as shown in Figures 2B, D, F. The datasets generated using the same model approach were merged, and the eight datasets from PCOS patients were also merged. Then, data from eight groups of PCOS animal models and PCOS patients were obtained. The model approach, metabolic changes and reproductive abnormalities of the eight groups of PCOS animal models are shown in Table 2.
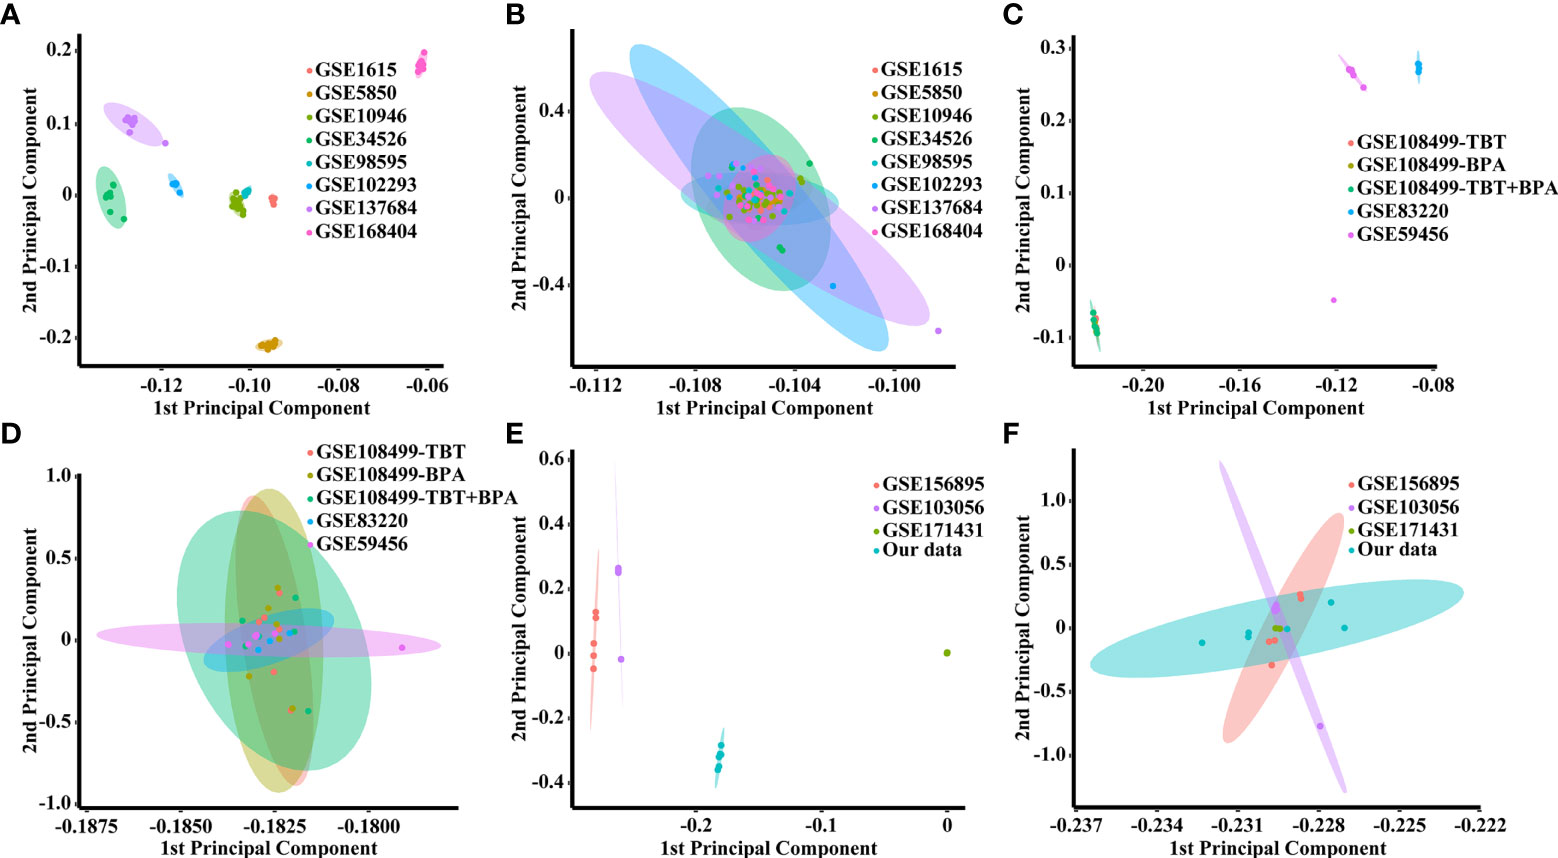
Figure 2 PCA score plots for classifying samples from different datasets. (A) Human datasets before batch effect removal. (B) Human datasets after batch effect removal by the EB method. (C) Rat datasets before batch effect removal. (D) Rat datasets after batch effect removal by the EB method. (E) Mouse datasets before batch effect removal. (F) Mouse datasets after batch effect removal by the EB method.
A total of 791 DEGs, including 509 up-regulated and 282 down-regulated genes, were identified in PCOS patients compared with controls (Supplementary Table 2). The DEGs from the eight groups of animal models of PCOS was compared with those of PCOS patients (Figure 3). The results showed 239 shared genes between prenatally androgenized (PNA) mice and PCOS patients, including 99 upregulated and 77 downregulated DEGs, as shown in Figure 3F. DHT-induced PCOS rats and mice shared fewer DEGs with PCOS patients than PNA mice. The 188 and 107 overlapping genes in DHT-induced PCOS rats and mice are shown in Figures 3E, G respectively. The top five DEGs shared by PNA mice and PCOS patients were Atg2a, Tapbp, Tagln, P4ha1 and Amz2, as illustrated in box plots in Figure 4.
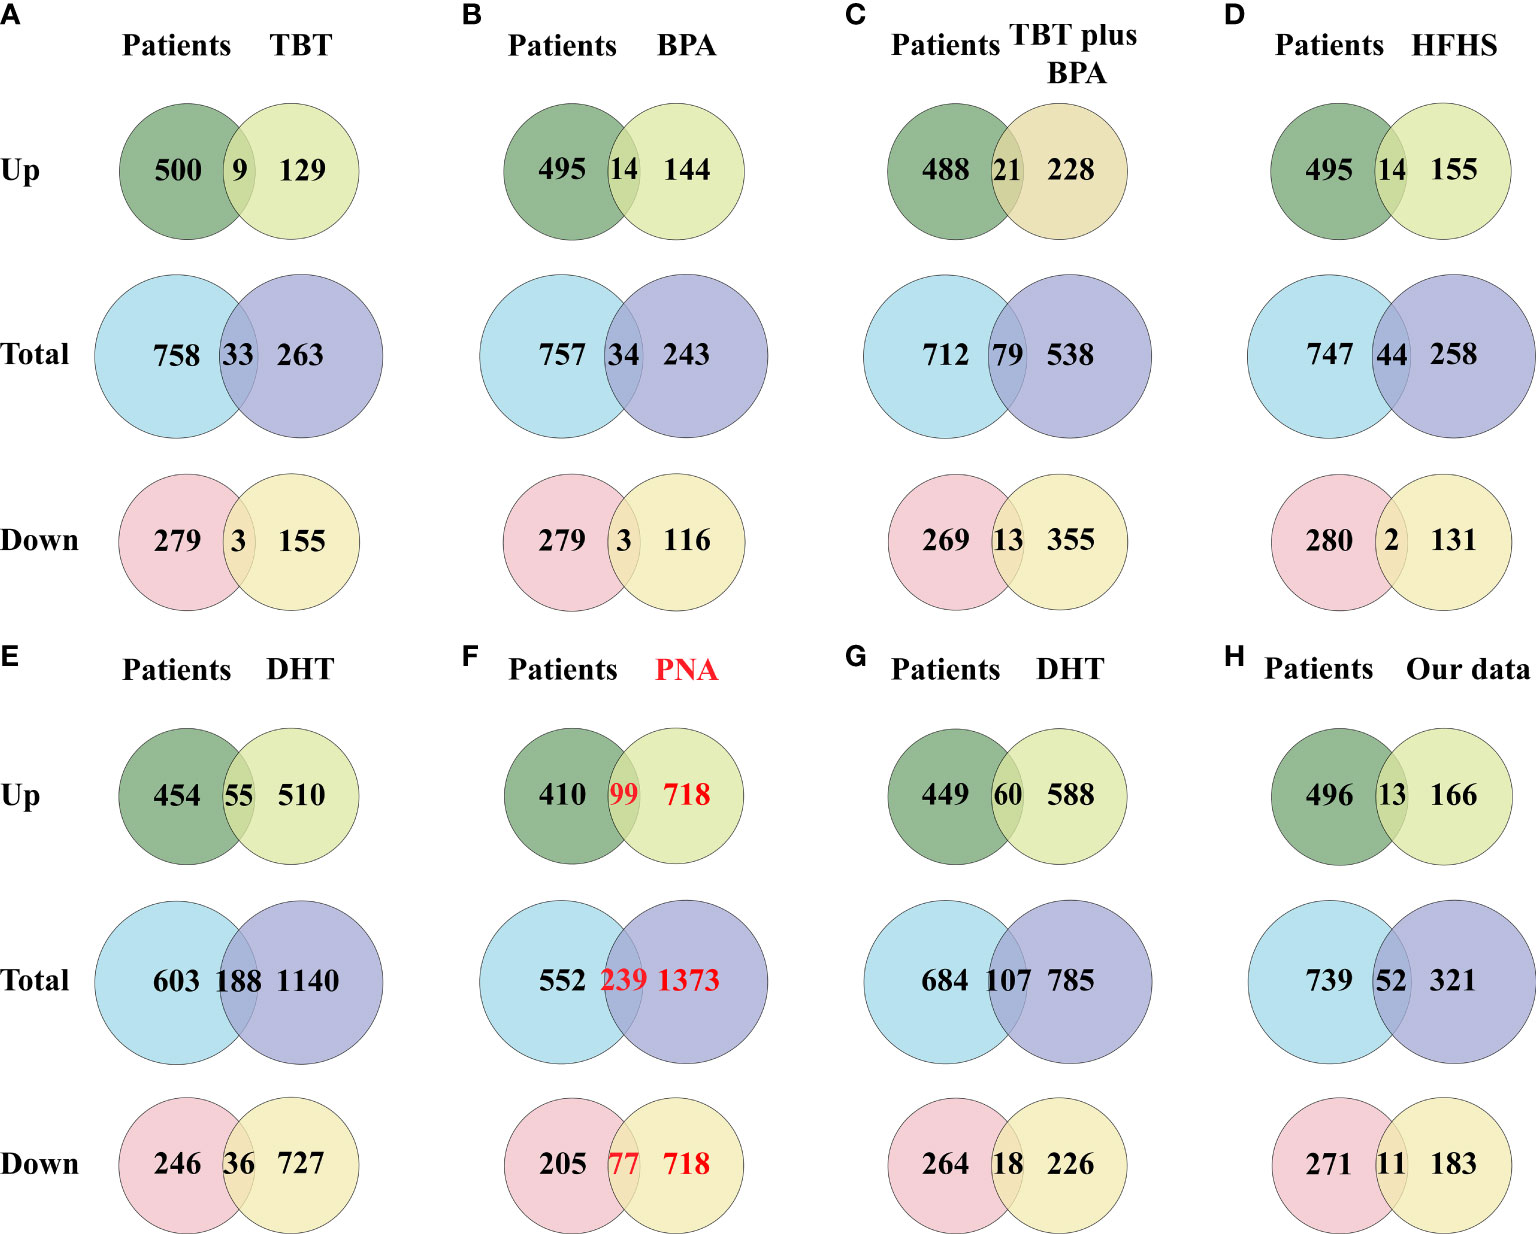
Figure 3 Venn diagram showing the intersection of DEGs (including up-regulated genes and down-regulated genes) between the PCOS animal modeland patients. (A) DEGs of the TBT-induced PCOS rat model. (B) DEGs of the BPA-induced PCOS rat model. (C) DEGs of the TBT plus BPAinduced PCOS rat model. (D) DEGs of the HFHS-induced PCOS rat model. (E) DEGs of the DHT-induced PCOS rat model. (F) DEGs of the PNA PCOS mouse model. (G) DEGs of the DHT-induced PCOS mouse model. (H) DEGs of the DHEA plus HFD-induced PCOS mouse model.
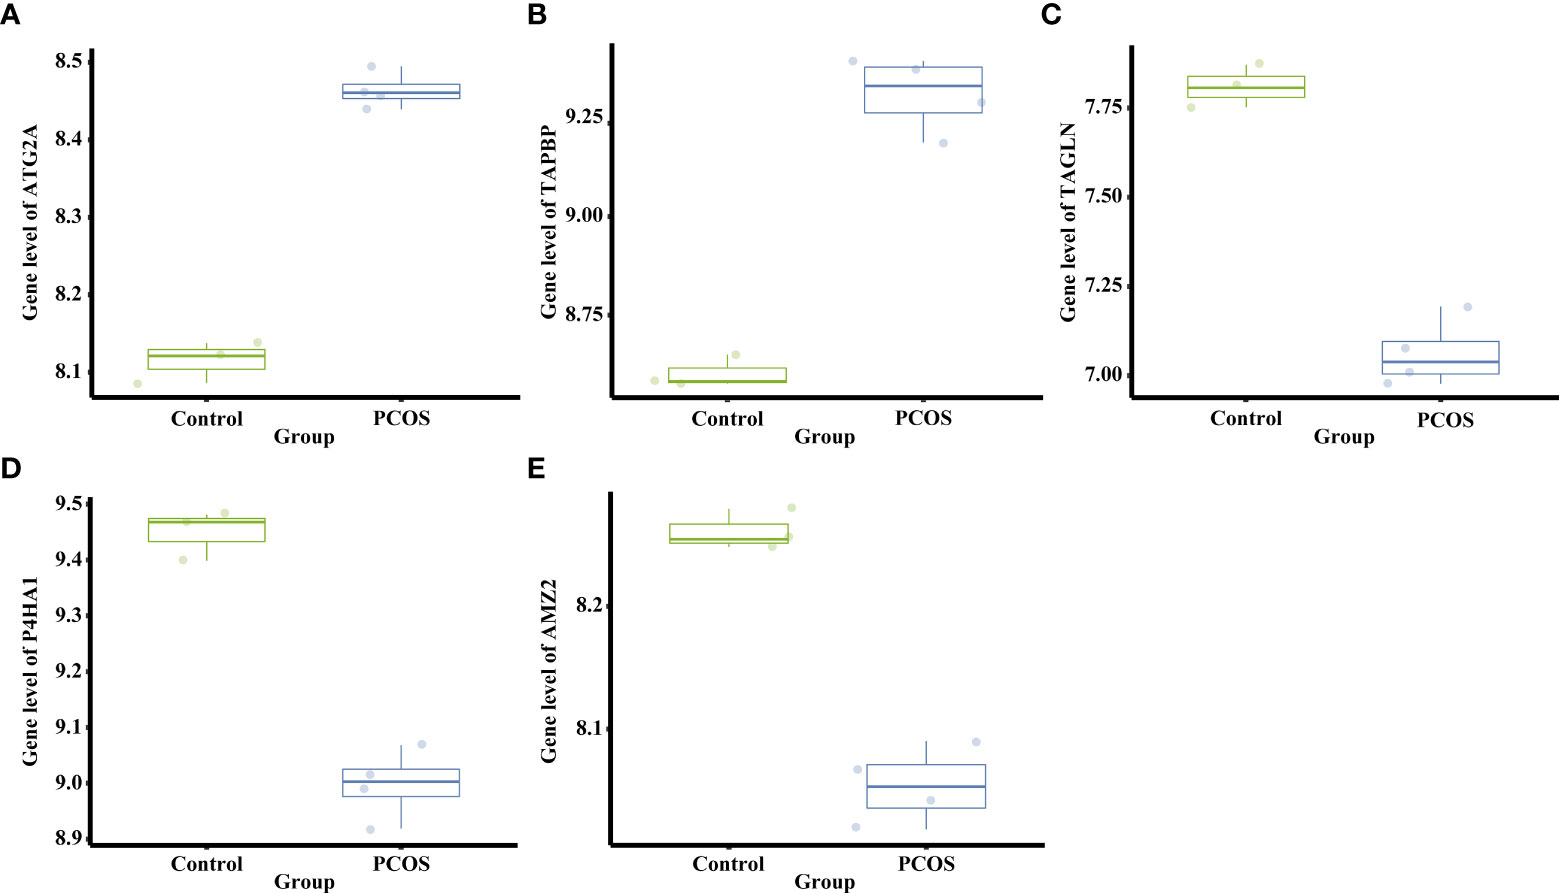
Figure 4 Differential mRNA expression of the top five DEGs shared between PNA mice and PCOS patients. (A) The gene level of Atg2a. (B) The gene level of Tapbp. (C) The gene level of Tagln. (D) The gene level of P4ha1. (E) The gene level of Amz2.
The above results were confirmed when comparing the PCOS-related genes obtained from the PCOSKB database with the DEGs in the eight groups of PCOS animal models Figure 5. From the PCOSKB website, 9,977 genes associated with PCOS were obtained. Of these PCOS-related genes, 1113 were identified in PNA mice (Figure 5F). The next highest number of overlapping genes were observed in DHT-induced PCOS rats and mice, with 931 and 611 DEGs shared with PCOS-associated genes, respectively (Figures 5E–G).
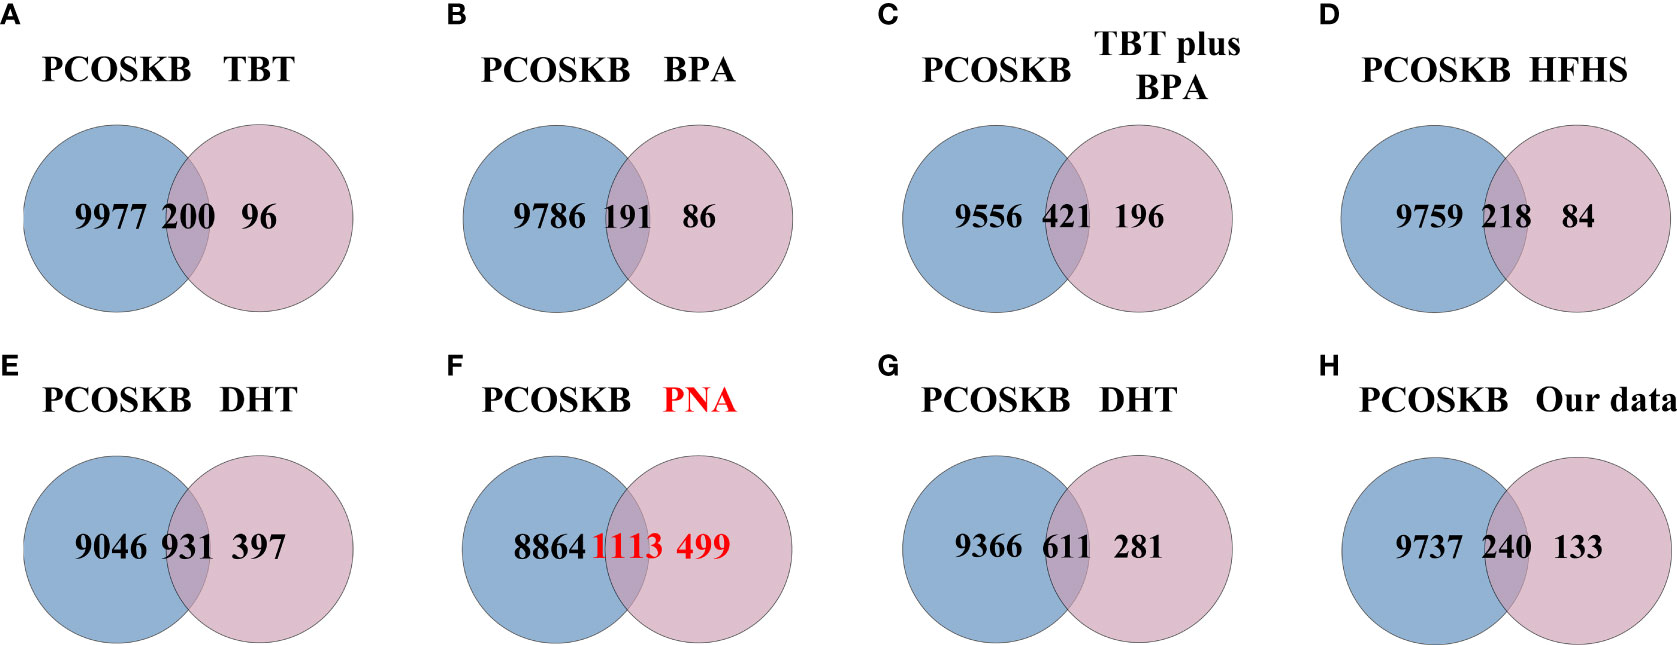
Figure 5 Venn diagram showing the intersection of PCOS animal models and genes from PCOSKB. (A) DEGs of the TBT-induced PCOS rat model. (B) DEGs of the BPA-induced PCOS rat model. (C) DEGs of the TBT plus BPA-induced PCOS rat model. (D) DEGs of the HFHS-induced PCOS rat model. (E) DEGs of the DHT-induced PCOS rat model. (F) DEGs of the PNA PCOS mouse model. (G) DEGs of the DHT-induced PCOS mouse model. (H) DEGs of the DHEA plus HFD-induced PCOS mouse model.
A total of 791 DEGs from PCOS patients were selected for GO and KEGG pathway enrichment analyzes, and 185 pathways were obtained. The comparison showed that 134 of the pathways enriched in PNA mice were the same as those enriched in PCOS patients (Figure 6F and Supplementary Table 3). The top ten pathways of PNA in ascending order of FDR value are shown in Figure 7. PCOS patients shared 105 pathways with DHT-induced rats and 40 pathways with DHT-induced mice. The top ten pathways selected from each model are shown in Supplementary Figures 2, 3.
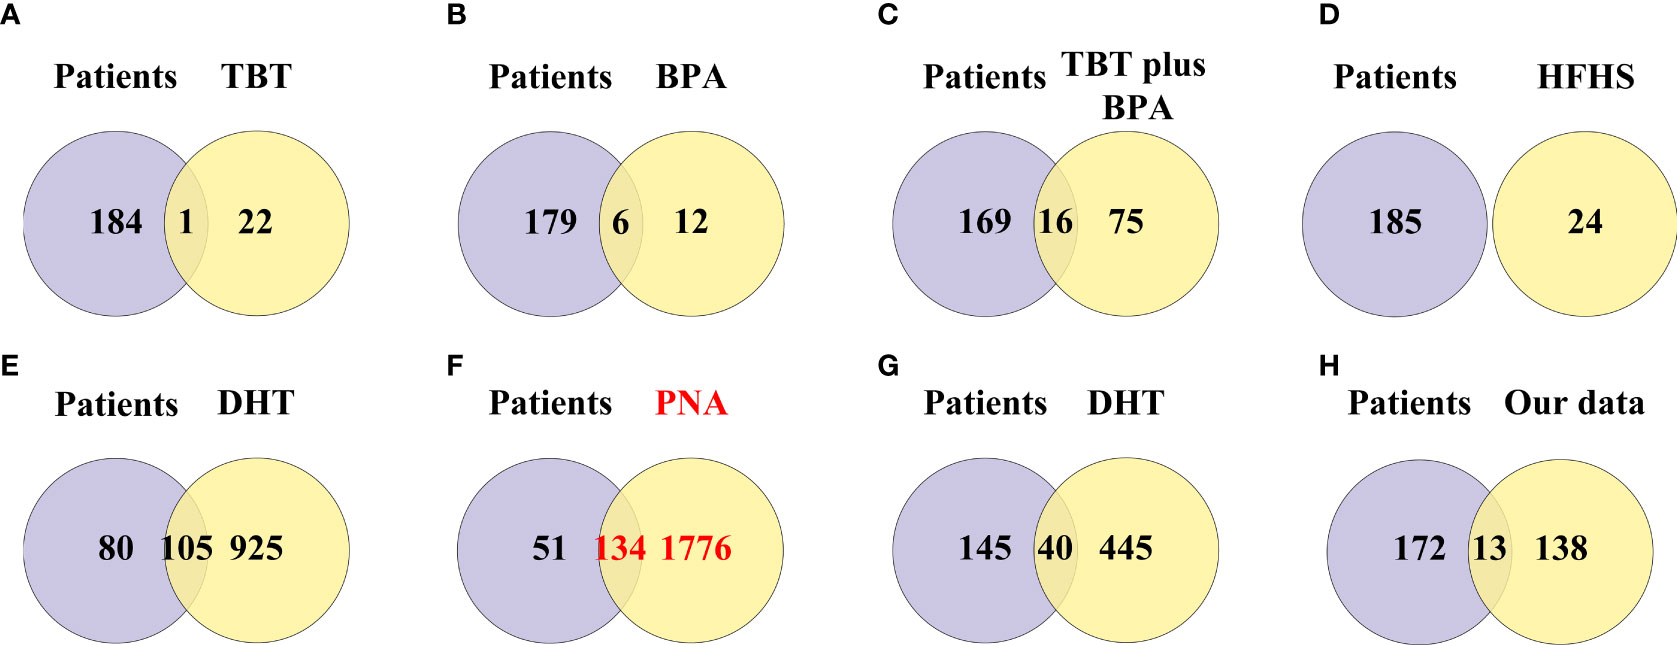
Figure 6 Venn diagram showing the intersection of pathway enrichment analyzes between PCOS animal models and patients. (A) GO and KEGG terms enriched in the TBT-induced PCOS rat model. (B) GO and KEGG terms enriched in the BPA-induced PCOS rat model. (C) GO and KEGG terms enriched in the TBT plus BPA-induced PCOS rat model. (D) GO and KEGG terms enriched in the HFHS-induced PCOS rat model. (E) GO and KEGG terms enriched in the DHT-induced PCOS rat model. (F) GO and KEGG terms enriched in the PNA PCOS mouse model. (G) GO and KEGG terms enriched in the DHT-induced PCOS mouse model. (H) GO and KEGG terms enriched in the DHEA plus HFD-induced PCOS mouse mod.
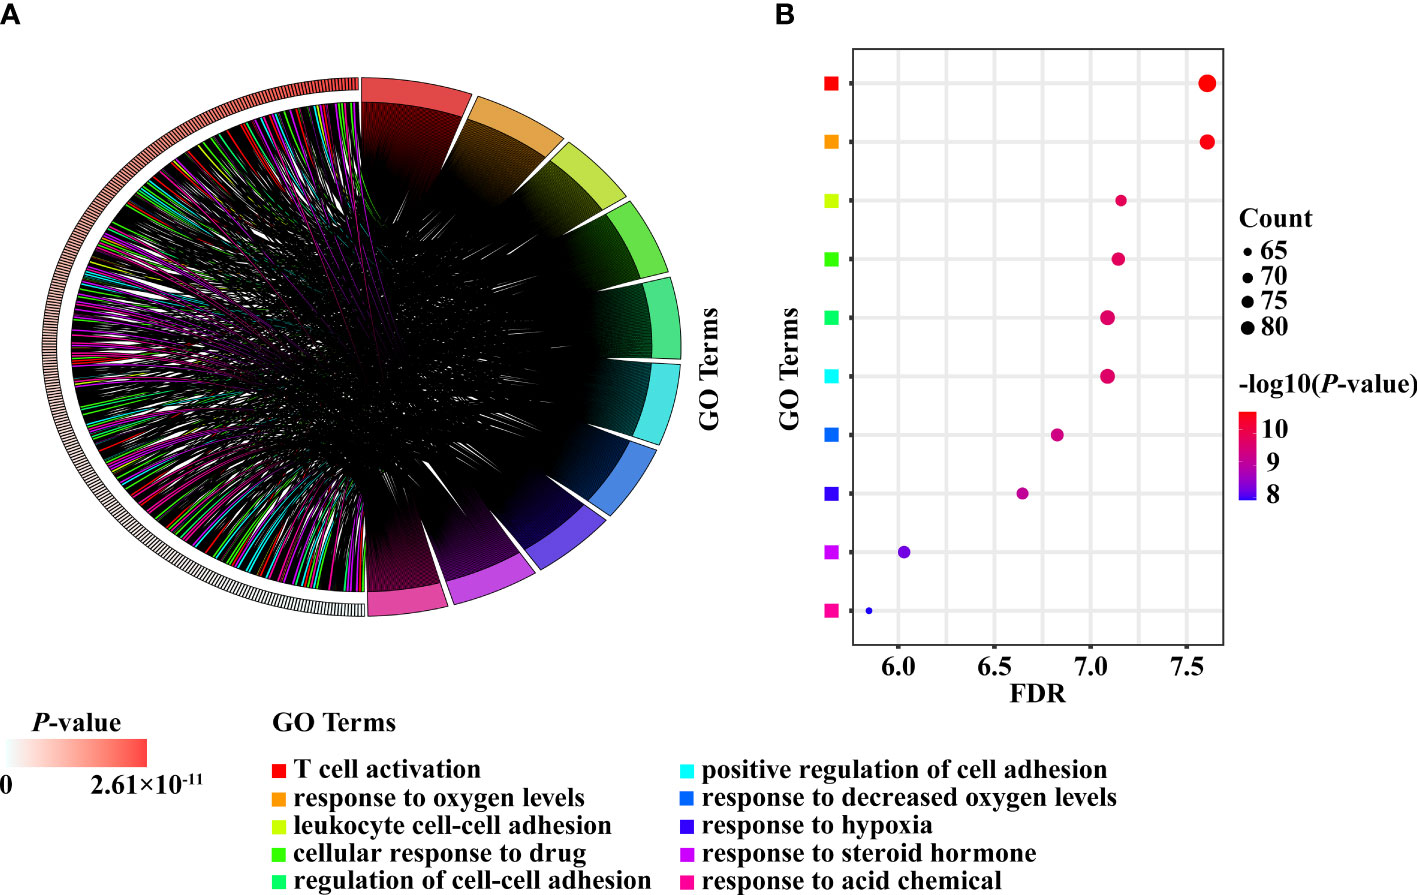
Figure 7 The top ten enriched pathways shared between PCOS patients and PNA mice. (A) Chord diagram. (B) Bubble diagram.
The PPI networks based on the intersection of DEGs between PCOS animal models and patients were downloaded from the STRING website and visualized using Cytoscape software. The PPI network for the PNA mice is shown in Figure 8A, which was composed of 211 nodes and 492 edges. The top module, with a maximum rating of 7.5, is shown in Figure 8B, created by the MCODE plug-in. The ten most highly connected genes in this PPI network were selected as hub genes (Cdc6, Rpa1, Rfc6, Mcm5, Prim2, Rfc2, Orc5, Psma3, Msh2 and Psmd14) in Figure 8C. DHT-induced rats and mice were also individually submitted to PPI network analysis in Supplementary Figures 4 and 5, respectively.
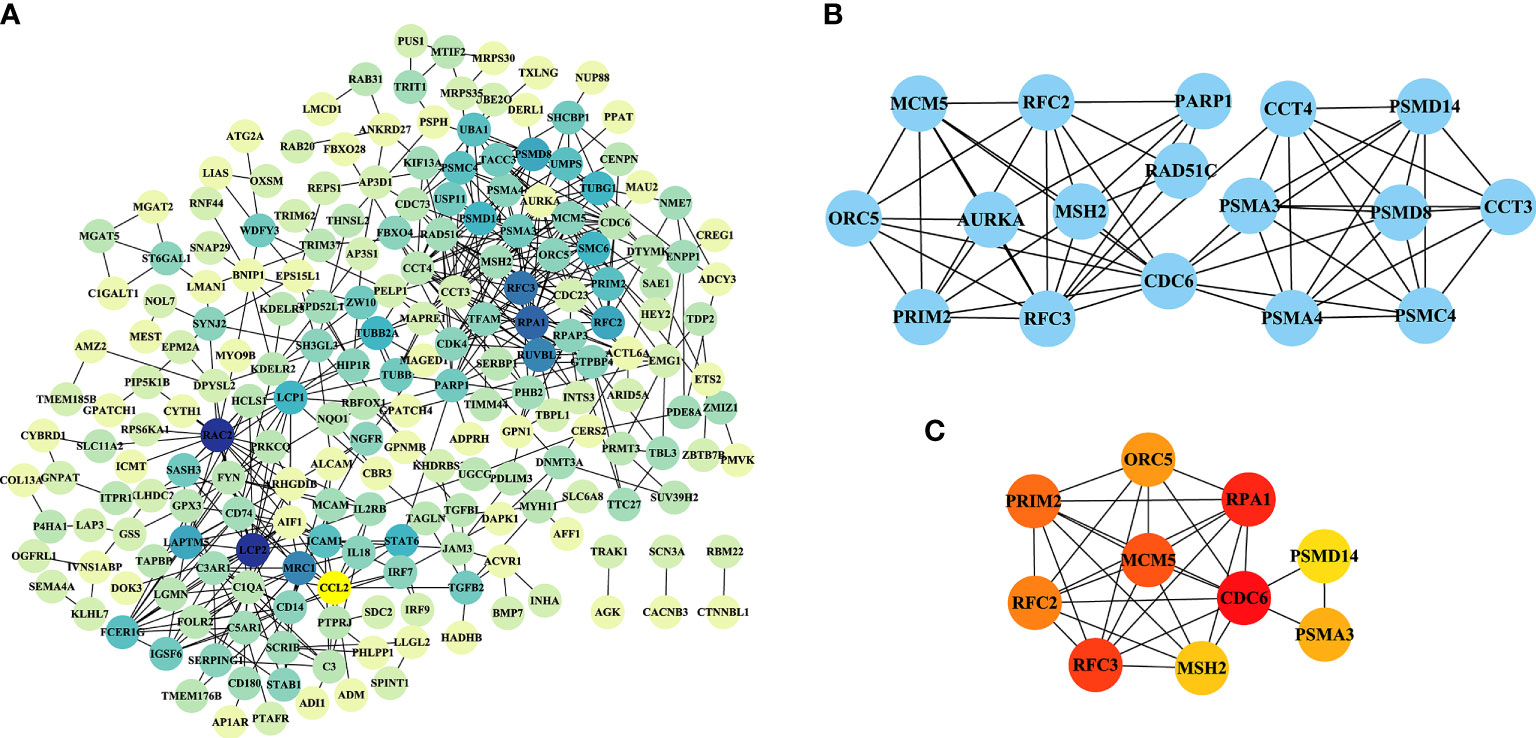
Figure 8 PPI network analysis of DEGs in PNA mice. (A) A PPI network with 211 nodes and 492 edges was constructed using Cytoscape software. (B) The top module results of MCODE PPI analysis. (C) The ten genes with the greatest linkage were selected for treatment as hub genes.
Although there are many studies involving patients with PCOS, animal models have been used as the basis of pathophysiological research (8). More than 30 animal models of PCOS have been reported, but most of the models express only certain PCOS phenotypes or exhibit additional relevant features that are generally beyond the scope of the syndrome (9). In our study, the modelling approach, metabolic changes and reproductive abnormalities of the eight models used in PCOS research were taken into consideration (Table 2). Because the DHEA plus HFD-induced animal model is highly similar to PCOS in terms of metabolism and phenotypic characteristics (21), we used this method to establish a PCOS mouse model. We further employed RNA-seq analysis of ovarian tissue from PCOS patients and controls and included these results for analysis together with the seven datasets mentioned above.
We analyzed the consistency between eight PCOS animal models and patients at the mRNA level in terms of DEGs obtained from the GEO database, PCOS-related genes obtained from the PCOSKB website and pathways obtained by GO and KEGG pathway enrichment analyzes. This study confirmed that the PNA mouse model can best simulate patients in terms of DEG and pathway enrichment analyzes, followed by the DHT-induced PCOS rat and mouse models. The PNA model was prepared by subcutaneous or intramuscular injection of testosterone, testosterone propionic acid, DHT, and DHT propionic acid at different doses and different stages of pregnancy, from early-to-mid to late gestation (19), and the offspring rats were used as subjects in this study.
Based on the data of PNA mice in GSE103056 and GSE156895 from the relevant literature (34, 35), the subcutaneous injection of 70 μl of sesame oil alone or containing 350 μg of DHT per day on days 16-18 of gestation in females was used for model induction, and the offspring of the treated mice were considered the target PNA mice. This leads to the conclusion that, among the existing modelling methods, DHT treatment may be the optimal method for constructing rodent models of PCOS. Maternal treatment of study subjects may be a better model than direct DHT-induced PCOS in rats and mice. PCOS is known to have a tendency to run in families (36) and is a highly complicated genetic disorder (37). Hyperandrogenic gestation in the uterus can lead to the development of PCOS in adult offspring (38, 39), which may account for the superiority of PNA mice over DHT-induced rats and mice. This result also suggests that genetic factors influencing PCOS should be considered when selecting an animal model of PCOS, and it also provides clues for subsequent mechanistic studies.
The top ten DEGs of PNA mice, including Axl, Atg2a, Klhl5, Mafb, Brix, Gpc3, Cdc42ep3, Prkag2, Porcn and Haus5, were associated with autophagy, immunity, cytokinesis, cytoskeleton and inflammation. Atg2a, TAPBP, Tagln, P4ha1, Amz2, Arhgdib, Cybrd1, Tmem185b, Prim2 and Ets2 are the top ten DEGs with concordance in PCOS patients and PNA mice. These genes are associated with apoptosis, senescence, inflammation, autophagy and cell signaling. There is evidence that the rate of granular cell apoptosis is significantly increased in the antral follicles of women with PCOS compared to normal controls (40, 41). Apoptosis of follicular granulosa cells may therefore also be involved in the abnormal development of follicles associated with PCOS (42). PCOS is an inflammatory disease characterized by persistent nonspecific low-grade inflammation (43, 44). It has been shown that dietary induction stimulates the inflammatory response of monocytes in women with PCOS (45). There is a genetic basis for the inflammation observed in PCOS (46). Interestingly, Atg2a is shared by PNA mice and PCOS patients, but no studies of this gene relevant to PCOS are available. Meanwhile, Klhl5, Mafb, Brix, Cdc42ep3, Haus5, TAPBP, Tagln, P4ha1, Arhgdib, Tmem185b, Prim2 and Ets2 are all mentioned on the PCOSKB website. The GO and KEGG pathway enrichment analyses in the PNA mice showed that the top ten pathways in ascending order of FDR values were associated with chromosomes, lipid metabolism, membranes, and the mitotic cell cycle. A total of 134 GO and KEGG pathways enriched in PNA mice were shared with PCOS patients. The top ten pathways of PNA are shown in Figure 7 and correlate with cell adhesion, T cells, hypoxia, steroid hormones and acidic chemicals. Cdc6, Rpa1, Mcm5, Prim2, Orc5 and Msh2 were associated with DNA replication in the PPI network analysis of PNA mice, which may also explain the greater likelihood of PCOS in the PNA mouse model. There is a chance that PNA mice may share not only reproductive but also immunity and hypoxia-related characteristics with PCOS patients.
Alcam and Klf15 are in the top ten DEGs of both DHT-induced rat models and PCOS patients. The GeneCards website shows that Alcam and Klf15 are associated with immunity and DNA replication, respectively. Sgta also possesses concordance, but studies have shown that Sgta is nominally significant (47) and has the potential to modulate androgen receptor signalling (48). In a DHT-induced PCOS rat model, GO and KEGG pathway enrichment analyzes showed that the top ten pathways were associated with metabolic processes, glandular development and intrauterine embryonic development through a variety of substances. As in PCOS patients, the top ten pathways were associated with hypoxia and metabolism of multiple substances. Glandular development and response to steroid hormones are present in both of the abovementioned groups.
Mgst2, Cdkn1b, Tst, Mtmr3, Vdac1, Lpp, Pdhb, Pfkp, Hmga2 and Bckdhb are the top ten DEGs in the DHT-induced mouse model, and the GeneCards website shows that they are associated with inflammation, mitochondria and metabolism. One study suggests that Lpp may be a new candidate gene for PCOS (49). Pfkp was among the top ten DEGs of both the DHT-induced mouse model and PCOS patients. A low level of Pfkp expression in cumulus oocyte complexes was found in Chinese patients with PCOS, suggesting a potential link between cumulus oocyte complexes and reduced glycolysis in women with PCOS (50). Among them, Mgst2, Cdkn1b, Lpp, Pdhb and Bckdhb are all listed on the PCOSKB website. Pathway enrichment analysis in a DHT-induced mouse model revealed that the top ten results were associated with hypoxia, ketones, amino acids, amine metabolism, hematopoietic cell differentiation and regulation. Consistent with that in PCOS patients, the top ten pathways in DHT-induced mice showed correlation with mitochondria, hypoxia, vesicle lumen and amino acid metabolism.
Meanwhile, we observed that the DEGs and the enrichment pathways were different when lean and obese PCOS patients were compared with controls (51). The differentially enriched pathways of lean and obese PCOS patients included mitochondrial gene expression, cell adhesion and signal transduction, cell migration, ubiquitin catabolic process, inflammation and immune response. Our findings differ from those of Idicula-Thomas et al. Among them, mitochondria, cell adhesion, immunity and inflammation are consistent, but we also found that in the top ten pathways of the three better models, metabolism of various substances and hypoxia are also very important. This enriches the current understanding of PCOS. Although we did not consider the effect of obesity on PCOS in this study, we believe that this factor should be taken into account when constructing models.
In addition, several novel PCOS loci have been identified in genome-wide association studies (GWASs) in China and Europe (52–55). It has been shown that 14 independent loci, including ERBB4, THADA, and KRR1, are significantly associated with the risk of PCOS, and 11 of these loci may be associated with the endocrine and metabolic pathways in PCOS (56). We looked for novel PCOS loci in the DEGs of eight groups of animal models and found that the trend of Irf1 expression was the same in the DHT rat model as in humans. The novel Mapre1 locus showed the same trend in the PNA mouse model and in humans. Therefore, when studying PCOS candidate genes, it is necessary to compare the models with humans at the mRNA level to select an appropriate model.
However, some limitations exist in our study. First, it is important to mention that the GEO dataset for PCOS includes only rats and mice. There are no reports on other mammalian models, such as primates, which are more similar to humans. Second, the sample size of each model was relatively small; however, more data are expected to be uploaded to these public databases.
In conclusion, the current study shows that among selected mouse and rat models, the PNA mouse model has the best consistency with PCOS patients at the mRNA level. Among the existing modelling methods, treatment with DHT may be the optimal method for constructing rodent models of PCOS. This study provides a new perspective for the evaluation of PCOS models and serves as a reference for researchers to select a more suitable animal model of PCOS.
The data analyzed in this study is subject to the following licenses/restrictions: The datasets used and analyzed during thecurrent study are available in the GEO (https://www.ncbi.nlm.nih.gov/geo/) repository. The dataset of DHEA plus HFD mouse model analyzed are not publicly available as it is still under study but are available from the corresponding author on reasonable request. Requests to access these datasets should be directed to Meijiao Wang,bWVpamlhb3dhbmdAY3FtdS5lZHUuY24=.
The studies involving human participants were reviewed and approved by The Ethics Committees of Chongqing Medical University. Written informed consent for participation was not required for this study in accordance with the national legislation and the institutional requirements. The animal study was reviewed and approved by The Ethics Committees of Chongqing Medical University.
JR and GT conceived the study. MW performed the animal experiments. JR analyzed the data and wrote the manuscript. WL and XR revised the figures and tables. MW, BX, JT, QP, and YW critically revised the manuscript. BX and MW made significant contributions to the conception and coordination. The authors read and approved the submitted version.
The study was funded by National Natural Science Foundation of China (No. 82171624; 81972023), the Chongqing Natural Science Foundation (No. cstc2020jcyj-msxmX0294), Science and Technology Project of Chongqing Yuzhong District (No. 20200103), Scientific Research & Innovation Experiment Project of Chongqing Medical University (SRIEP202106; SRIEP202002) and the Chongqing Postdoctoral Science Foundation (No. cstc2021jcyj-bsh0029).
The authors declare that the research was conducted in the absence of any commercial or financial relationships that could be construed as a potential conflict of interest.
All claims expressed in this article are solely those of the authors and do not necessarily represent those of their affiliated organizations, or those of the publisher, the editors and the reviewers. Any product that may be evaluated in this article, or claim that may be made by its manufacturer, is not guaranteed or endorsed by the publisher.
The Supplementary Material for this article can be found online at: https://www.frontiersin.org/articles/10.3389/fendo.2022.950105/full#supplementary-material
1. Conway G, Dewailly D, Diamanti-Kandarakis E, Escobar-Morreale HF, Franks S, Gambineri A, et al. The polycystic ovary syndrome: a position statement from the European society of endocrinology. Eur J Endocrinol (2014) 171(4):P1–P29. doi: 10.1530/EJE-14-0253
2. Fauser BCJM, Chang J, Azziz R, Legro R, Dewailly D, Franks S, et al. Revised 2003 consensus on diagnostic criteria and long-term health risks related to polycystic ovary syndrome (PCOS). Hum Reprod (2004) 19(1):41–7. doi: 10.1093/humrep/deh098
3. Legro RS, Kunselman AR, Dunaif A. Prevalence and predictors of dyslipidemia in women with polycystic ovary syndrome. Am J Med (2001) 111(8):607–13. doi: 10.1016/S0002-9343(01)00948-2
4. Escobar-Morreale HF. Polycystic ovary syndrome: definition, aetiology, diagnosis and treatment. Nat Rev Endocrinol (2018) 14(5):270–84. doi: 10.1038/nrendo.2018.24
5. Bozdag G, Mumusoglu S, Zengin D, Karabulut E, Yildiz BO. The prevalence and phenotypic features of polycystic ovary syndrome: a systematic review and meta-analysis. Hum Reprod (2016) 31(12):2841–55. doi: 10.1093/humrep/dew218
6. Ben-Shlomo I, Younis JS. Basic research in PCOS: are we reaching new frontiers? Reprod Biomed Online (2014) 28(6):669–83. doi: 10.1016/j.rbmo.2014.02.011
7. Hanna CW, Demond H, Kelsey G. Epigenetic regulation in development: is the mouse a good model for the human? Hum Reprod Update (2018) 24(5):556–76. doi: 10.1093/humupd/dmy021
8. Ryu Y, Kim SW, Kim YY, Ku SY. Animal models for human polycystic ovary syndrome (PCOS) focused on the use of indirect hormonal perturbations: A review of the literature. Int J Mol Sci (2019) 20(11):27. doi: 10.3390/ijms20112720
9. Azziz R. PCOS: Animal models for PCOS - not the real thing. Nat Rev Endocrinol (2017) 13(7):382–4. doi: 10.1038/nrendo.2017.57
10. Benrick A, Chanclón B, Micallef P, Wu Y, Hadi L, Shelton JM, et al. Adiponectin protects against development of metabolic disturbances in a PCOS mouse model. Proc Natl Acad Sci USA (2017) 114(34):E7187–96. doi: 10.1073/pnas.1708854114
11. Li Y, Zheng Q, Sun D, Cui X, Chen S, Bulbul A, et al. Dehydroepiandrosterone stimulates inflammation and impairs ovarian functions of polycystic ovary syndrome. J Cell Physiol (2019) 234(5):7435–47. doi: 10.1002/jcp.27501
12. Jung JH, Park HT, Kim T, Jeong MJ, Lim SC, Nah SY, et al. Therapeutic effect of korean red ginseng extract on infertility caused by polycystic ovaries. J Ginseng Res (2011) 35(2):250–5. doi: 10.5142/jgr.2011.35.2.250
13. Raja MA, Maldonado M, Chen J, Zhong Y, Gu J. Development and evaluation of curcumin encapsulated self-assembled nanoparticles as potential remedial treatment for PCOS in a female rat model. Int J Nanomed (2021) 16:6231–47. doi: 10.2147/IJN.S302161
14. He Y, Wang Q, Li X, Wang G, Zhao J, Zhang H, et al. Correction: Lactic acid bacteria alleviate polycystic ovarian syndrome by regulating sex hormone related gut microbiota. Food Funct (2021) 12(10):4720–1. doi: 10.1039/D1FO90033A
15. Esparza LA, Schafer D, Ho BS, Thackray VG, Kauffman AS. Hyperactive LH pulses and elevated kisspeptin and NKB gene expression in the arcuate nucleus of a PCOS mouse model. Endocrinology (2020) 161(4):bqaa018. doi: 10.1210/endocr/bqaa018
16. Zhang H, Yi M, Zhang Y, Jin H, Zhang W, Yang J, et al. High-fat diets exaggerate endocrine and metabolic phenotypes in a rat model of DHEA-induced PCOS. Reproduction (2016) 151(4):431–41. doi: 10.1530/REP-15-0542
17. Volk KM, Pogrebna VV, Roberts JA, Zachry JE, Blythe SN, Toporikova N. High-fat, high-sugar diet disrupts the preovulatory hormone surge and induces cystic ovaries in cycling female rats. J Endocr Soc (2017) 1(12):1488–505. doi: 10.1210/js.2017-00305
18. Roberts JS, Perets RA, Sarfert KS, Bowman JJ, Ozark PA, Whitworth GB, et al. High-fat high-sugar diet induces polycystic ovary syndrome in a rodent model. Biol Reprod (2017) 96(3):551–62. doi: 10.1095/biolreprod.116.142786
19. Stener-Victorin E, Padmanabhan V, Walters KA, Campbell RE, Benrick A Giacobini P, et al. Animal models to understand the etiology and pathophysiology of polycystic ovary syndrome. Endocrine Rev (2020) 41(4):39. doi: 10.1210/endrev/bnaa010
20. Walters KA, Bertoldo MJ, Handelsman DJ. Evidence from animal models on the pathogenesis of PCOS. Best Pract Res Clin Endocrinol Metab (2018) 32(3):271–81. doi: 10.1016/j.beem.2018.03.008
21. Wang M, Zhao D, Xu L, Guo W, Nie L, Lei Y, et al. Role of PCSK9 in lipid metabolic disorders and ovarian dysfunction in polycystic ovary syndrome. Metabolism-Clinical Exp (2019) 94:47–58. doi: 10.1016/j.metabol.2019.02.002
22. Kauffman AS, Thackray VG, Ryan GE, Tolson KP, Glidewell-Kenney CA Semaan SJ, et al. A novel letrozole model recapitulates both the reproductive and metabolic phenotypes of polycystic ovary syndrome in female mice. Biol Reprod (2015) 93(3):69. doi: 10.1095/biolreprod.115.131631
23. Trapnell C, Roberts A, Goff L, Pertea G, Kim D, Kelley DR, et al. Differential gene and transcript expression analysis of RNA-seq experiments with TopHat and cufflinks. Nat Protoc (2012) 7(3):562–78. doi: 10.1038/nprot.2012.016
24. Joseph S, Barai RS, Bhujbalrao R, Idicula-Thomas S. PCOSKB: A KnowledgeBase on genes, diseases, ontology terms and biochemical pathways associated with PolyCystic ovary syndrome. Nucleic Acids Res (2016) 44(D1):D1032–5. doi: 10.1093/nar/gkv1146
25. Durinck S, Spellman PT, Birney E, Huber W. Mapping identifiers for the integration of genomic datasets with the R/Bioconductor package biomaRt. Nat Protoc (2009) 4(8):1184–91. doi: 10.1038/nprot.2009.97
26. Johnson WE, Li C, Rabinovic A. Adjusting batch effects in microarray expression data using empirical bayes methods. Biostatistics (2007) 8(1):118–27. doi: 10.1093/biostatistics/kxj037
27. Yang Z, Shi J, Guo Z, Chen M, Wang C, He C, et al. A pilot study on polycystic ovarian syndrome caused by neonatal exposure to tributyltin and bisphenol a in rats. Chemosphere (2019) 231:151–60. doi: 10.1016/j.chemosphere.2019.05.129
28. de Araujo JFP, Podratz PL, Sena GC, Merlo E, Freitas-Lima LC, Ayub JGM, et al. The obesogen tributyltin induces abnormal ovarian adipogenesis in adult female rats. Toxicol Lett (2018) 295:99–114. doi: 10.1016/j.toxlet.2018.06.1068
29. Fernandez M, Bourguignon N, Lux-Lantos V, Libertun C. Neonatal exposure to bisphenol a and reproductive and endocrine alterations resembling the polycystic ovarian syndrome in adult rats. Environ Health Perspect (2010) 118(9):1217–22. doi: 10.1289/ehp.0901257
30. Caldwell AS, Middleton LJ, Jimenez M, Desai R, McMahon AC, Allan CM, et al. Characterization of reproductive, metabolic, and endocrine features of polycystic ovary syndrome in female hyperandrogenic mouse models. Endocrinology (2014) 155(8):3146–59. doi: 10.1210/en.2014-1196
31. Chen M-J, Chou CH, Chen SU, Yang WS, Yang YS, Ho HN, et al. The effect of androgens on ovarian follicle maturation: Dihydrotestosterone suppress FSH-stimulated granulosa cell proliferation by upregulating PPAR gamma-dependent PTEN expression. Sci Rep (2015) 5:18319. doi: 10.1038/srep18319
32. Lei L, Ding L, Su J, Liu M, Shi Q, Zhou J, et al. Attenuated expression of MTR in both prenatally androgenized mice and women with the hyperandrogenic phenotype of PCOS. PloS One (2017) 12(12):e0187427. doi: 10.1371/journal.pone.0187427
33. Wu XY, Li ZL, Wu CY, Liu YM, Lin H, Wang SH, et al. Endocrine traits of polycystic ovary syndrome in prenatally androgenized female sprague-dawley rats. Endocrine J (2010) 57(3):201–9. doi: 10.1507/endocrj.K09E-205
34. Lei L, Ding L, Su J, Liu M, Shi Q, Zhou J, et al. Attenuated expression of MTR in both prenatally androgenized mice and women with the hyperandrogenic phenotype of PCOS. PloS One (2017) 12(12):15. doi: 10.1371/journal.pone.0187427
35. Qin YL, Li T, Zhao H, Mao Z, Ding C, Kang Y, et al. Integrated transcriptomic and epigenetic study of PCOS: Impact of Map3k1 and Map1lc3a promoter methylation on autophagy. Front Genet (2021) 12:14. doi: 10.3389/fgene.2021.620241
36. Dapas M, Lin FTJ, Nadkarni GN, Sisk R, Legro RS, Urbanek M, et al. Distinct subtypes of polycystic ovary syndrome with novel genetic associations: An unsupervised, phenotypic clustering analysis. PloS Med (2020) 17(6):28. doi: 10.1371/journal.pmed.1003132
37. Moghetti P, Tosi F, Bonin C, Sarra DD, Fiers T, Kaufman JM, et al. Divergences in insulin resistance between the different phenotypes of the polycystic ovary syndrome. J Clin Endocrinol Metab (2013) 98(4):E628–37. doi: 10.1210/jc.2012-3908
38. Filippou P, Homburg R. Is foetal hyperexposure to androgens a cause of PCOS? Hum Reprod Update (2017) 23(4):421–32. doi: 10.1093/humupd/dmx013
39. Abbott DH, Dumesic DA. Passing on PCOS: new insights into its epigenetic transmission. Cell Metab (2021) 33(3):463–6. doi: 10.1016/j.cmet.2021.02.008
40. Kumariya S, Ubba V, Jha RK, Gayen JR. Autophagy in ovary and polycystic ovary syndrome: role, dispute and future perspective. Autophagy (2021) 17(10):2706–33. doi: 10.1080/15548627.2021.1938914
41. Paixao L, Ramos RB, Lavarda A, Morsh DM, Spritzer PM. Animal models of hyperandrogenism and ovarian morphology changes as features of polycystic ovary syndrome: a systematic review. Reprod Biol Endocrinol (2017) 15(1):12. doi: 10.1186/s12958-017-0231-z
42. Peng S-L, Wu QF, Xie Q, Tan J, Shu KY. PATL2 regulated the apoptosis of ovarian granulosa cells in patients with PCOS. Gynecolog Endocrinol (2021) 37(7):629–34. doi: 10.1080/09513590.2021.1928066
43. Patel S. Polycystic ovary syndrome (PCOS), an inflammatory, systemic, lifestyle endocrinopathy. J Steroid Biochem Mol Biol (2018) 182:27–36. doi: 10.1016/j.jsbmb.2018.04.008
44. Yang Y, Xia J, Yang Z, Wu G, Yang J. The abnormal level of HSP70 is related to Treg/Th17 imbalance in PCOS patients. J Ovarian Res (2021) 14(1). doi: 10.1186/s13048-021-00867-0
45. Gonzalez F, Rote NS, Minium J, Kirwan JP. In vitro evidence that hyperglycemia stimulates tumor necrosis factor-a release in obese women with polycystic ovary syndrome. J Endocrinol (2006) 188(3):521–9. doi: 10.1677/joe.1.06579
46. Escobar-Morreale HF, Botella-Carretero JI, Alvarez-Blasco F, Sancho J, San Millan JL. The polycystic ovary syndrome associated with morbid obesity may resolve after weight loss induced by bariatric surgery. J Clin Endocrinol Metab (2005) 90(12):6364–9. doi: 10.1210/jc.2005-1490
47. Ewens KG, Stewart DR, Ankener W, Urbanek M, McAllister JM Chen C, et al. Family-based analysis of candidate genes for polycystic ovary syndrome. J Clin Endocrinol Metab (2010) 95(5):2306–15. doi: 10.1210/jc.2009-2703
48. Butler MS, Yang X, Ricciardelli C, Liang X, Norman RJ, Tilley WD, et al. Small glutamine-rich tetratricopeptide repeat-containing protein alpha is present in human ovaries but may not be differentially expressed in relation to polycystic ovary syndrome. Fertility Sterility (2013) 99(7):2076–83.e1. doi: 10.1016/j.fertnstert.2013.01.140
49. Zhang B, Zhao H, Li T, Gao X, Gao Q, Tang R, et al. Association study of gene LPP in women with polycystic ovary syndrome. PloS One (2012) 7(10):e46370. doi: 10.1371/journal.pone.0046370
50. Zhai Y,W, Yao G, Rao F, Wang Y, Song X, Sun F, et al. Excessive nerve growth factor impairs bidirectional communication between the oocyte and cumulus cells resulting in reduced oocyte competence. Reprod Biol Endocrinol (2018) 16(1):28. doi: 10.1186/s12958-018-0349-7
51. Idicula-Thomas S, Gawde U, Bhaye S, Pokar K, Bader GD, et al. Meta-analysis of gene expression profiles of lean and obese PCOS to identify differentially regulated pathways and risk of comorbidities. Comput Struct Biotechnol J (2020) 18:1735–45. doi: 10.1016/j.csbj.2020.06.023
52. Chen Z-J, Zhao H, He L, Shi Y, Qin Y, Shi Y, et al. Genome-wide association study identifies susceptibility loci for polycystic ovary syndrome on chromosome 2p16.3, 2p21 and 9q33.3. Nat Genet (2011) 43(1):55–U75. doi: 10.1038/ng.732
53. Day FR, Hinds DA, Tung JY, Stolk L, Styrkarsdottir U, Saxena R, et al. Causal mechanisms and balancing selection inferred from genetic associations with polycystic ovary syndrome. Nat Commun (2015) 6. doi: 10.1038/ncomms9464
54. Hayes MG, Urbanek M, Ehrmann DA, Armstrong LL, Lee JY, Sisk R, et al. Genome-wide association of polycystic ovary syndrome implicates alterations in gonadotropin secretion in European ancestry populations. Nat Commun (2015) 6:7502. doi: 10.1038/ncomms10762
55. Shi Y, Karaderi T, Jones MR, Meun C, He C, Drong A, et al. Genome-wide association study identifies eight new risk loci for polycystic ovary syndrome. Nat Genet (2012) 44(9):1020–5. doi: 10.1038/ng.2384
Keywords: polycystic ovary syndrome (PCOS), bioinformatics, animal model, dehydroepiandrosterone (DHEA), differentially expressed genes (DEG), RNA sequencing (RNA-seq)
Citation: Ren J, Tan G, Ren X, Lu W, Peng Q, Tang J, Wang Y, Xie B and Wang M (2022) The PNA mouse may be the best animal model of polycystic ovary syndrome. Front. Endocrinol. 13:950105. doi: 10.3389/fendo.2022.950105
Received: 22 May 2022; Accepted: 11 July 2022;
Published: 08 August 2022.
Edited by:
Junping Wen, Fujian Provincial Hospital, ChinaReviewed by:
Wenshan Lv, The Affiliated Hospital of Qingdao University, ChinaCopyright © 2022 Ren, Tan, Ren, Lu, Peng, Tang, Wang, Xie and Wang. This is an open-access article distributed under the terms of the Creative Commons Attribution License (CC BY). The use, distribution or reproduction in other forums is permitted, provided the original author(s) and the copyright owner(s) are credited and that the original publication in this journal is cited, in accordance with accepted academic practice. No use, distribution or reproduction is permitted which does not comply with these terms.
*Correspondence: Biao Xie, a3liaWFvQGNxbXUuZWR1LmNu; Meijiao Wang, bWVpamlhb3dhbmdAY3FtdS5lZHUuY24=
Disclaimer: All claims expressed in this article are solely those of the authors and do not necessarily represent those of their affiliated organizations, or those of the publisher, the editors and the reviewers. Any product that may be evaluated in this article or claim that may be made by its manufacturer is not guaranteed or endorsed by the publisher.
Research integrity at Frontiers

Learn more about the work of our research integrity team to safeguard the quality of each article we publish.