 Jinfang Song1,2
 Na Li1Ruonan Hu1Yanan Yu1Ke Xu1Hongwei Ling3
 Qian Lu1Tingting Yang1Tao Wang1,4*Xiaoxing Yin1*
- 1Jiangsu Key Laboratory of New Drug Research and Clinical Pharmacy, Xuzhou Medical University, Xuzhou, China
- 2Department of Pharmacy, Affiliated Hospital of Jiangnan University, Wuxi, China
- 3Department of Endocrinology, Affiliated Hospital of Xuzhou Medical University, Xuzhou, China
- 4Department of Pharmacy, Affiliated Hospital of Xuzhou Medical University, Xuzhou, China
Background: Exenatide is a GLP-1R agonist that often exhibits considerable interindividual variability in therapeutic efficacy. However, there is no evidence about the impact of genetic variants in the PPARD on the therapeutic efficacy of exenatide. This research was aimed to explore the influence of PPARD gene polymorphism on the therapeutic effect of exenatide, and to identify the potential mechanism futher.
Methods: A total of 300 patients with T2DM and 200 control subjects were enrolled to identify PPARD rs2016520 and rs3777744 genotypes. A prospective clinical study was used to collect clinical indicators and peripheral blood of T2DM patients treated with exenatide monotherapy for 6 months. The SNaPshot method was used to identify PPARD rs2016520 and rs3777744 genotypes, and then we performed correlation analysis between PPARD gene variants and the efficacy of exenatide, and conducted multiple linear regression analysis of factors affecting the therapeutic effect of exenatide. HepG2 cells were incubated with exenatide in the absence or presence of a PPARδ agonist or the siPPARδ plasmid, after which the levels of GLP-1R and the ratio of glucose uptake were determined.
Results: After 6 months exenatide monotherapy, we observed that homeostasis model assessment for insulin resistance (HOMA-IR) levels of the subjects with at least one C allele of the PPARD rs2016520 were significantly lower than those with the TT genotype, which suggested that the PPARD rs2016520 TT genotype conferred the poor exenatide response through a reduction of insulin resistance, as measured by HOMA-IR. The carriers of G alleles at rs3777744 exhibited higher levels of in waist to hip ratio (WHR), fasting plasma glucose (FPG), hemoglobin A1c (HbA1c) and HOMA-IR compared to individuals with the AA genotype following 6 months of exenatide treatment, potentially accounting for the lower failure rate of exenatide therapy among the AA homozygotes. In an insulin resistant HepG2 cell model, the PPARδ agonists enhanced exenatide efficacy on insulin resistance, with the expression of GLP-1R being up-regulated markedly.
Conclusion: These data suggest that the PPARD rs2016520 and rs3777744 polymorphisms are associated with exenatide monotherapy efficacy, due to the pivotal role of PPARδ in regulating insulin resistance through affecting the expression of GLP-1R. This study was registered in the Chinese Clinical Trial Register (No. ChiCTR-CCC13003536).
Introduction
Within the past few decades, the prevalence of type 2 diabetes mellitus (T2DM) has risen at an astounding rate over the world (1). T2DM is a metabolic disease caused by a complex combination of environmental and genetic factors, characterized by impaired insulin secretion and insulin resistance (2). Genome-wide association studies (GWAS) have led to the identification of hundreds of risk genes, including peroxisome proliferator-activated receptor δ gene (PPARD), associated with T2DM susceptibility or abnormal indicators of metabolism (3). PPARD is located on chromosome 6p21.1-p21.2, and its coding product PPAR-δ (also named PPAR-β) is a member of the peroxisome proliferator activated receptor family, which is widely distributed in the liver, kidney, cardiac and skeletal muscle, adipose tissue, brain, pancreatic and vasculature (4). PPARD was not observed as the susceptibility gene for T2DM in a case-control clinical study conducted in a Korean population in 2004, but PPARD variants were founded to be associated with elevated fasting plasma glucose (FPG) and body mass index (BMI) (5). Studies in Chinese Han population have shown that PPARD rs2016520 variant (also named +294T > C or -87T > C) is associated with blood glucose, insulin level and insulin resistance, and is a key factor affecting the development of metabolic syndrome and T2DM (6, 7). Studies in Mexican population have produced similar results (8). Meanwhile, pathogenesis research already pointed that PPAR-δ plays an important role in insulin resistance and islet β-cell function (9–11). More recently, PPAR-δ activation came into focus as an interesting novel approach for the treatment of metabolic syndrome. Both preclinical and clinical studies showed that PPAR-δ specific agonist therapy enhanced β-oxidation, decreased free fatty acid, and improved insulin sensitivity (12, 13). Current studies have demonstrated the effect of PPARD on metabolic metrics, but the mechanisms responsible for this effect are not well characterized.
Exenatide is a glucagon-like peptide 1 (GLP1) analogue that exerts its pharmacological effects through activating glucagon-like peptide 1 receptor (GLP1-R). It mirrors many of the effects of GLP-1 and improve glycemic control through a combination of mechanisms, which includes glucose-dependent stimulation of insulin secretion, suppression of glucagon secretion, slowing of gastric emptying and reduction of appetite (14, 15). The results of a multi-center randomized controlled clinical trial showed that there were significant individual differences in glycemic control, islet function, and body mass index in T2DM patients undergoing exenatide monotherapy for 48 weeks (16). Our research team conducted a previous retrospective clinical study to investigate the hypoglycemic efficacy of 148 T2DM patients treated with exenatide and discovered that the proportion of T2DM patients who did not respond to exenatide treatment was as high as 37.84% (17). The non-response of exenatide treatment not only affects the glycemic standard of T2DM patients and reduces the medication compliance, but also brings a heavy economic burden to patients. Some studies have shown that gene variants can affect the stimulatory effect of GLP-1 receptor agonists on insulin secretion (18–20). The TCF7L2 rs7903146 mutation was found to attenuate GLP-1-induced insulin secretion in German and Danish populations (18, 19). Another study suggested that mutations in the WFS1 gene attenuated GLP-1-induced insulin secretion, but not in relation with insulin sensitivity (20). Therefore, genetic factors are essential to the efficacy of exenatide. We analyzed the GLP-1R promoter using the National Center for Biotechnology Information (https://www.ncbi.nlm.nih.gov/) and JASPAR database (http://jaspar.genereg.net/), and found the potential PPARδ binding site (Supplementary Figure S1).
Pharmacogenomic studies have identified genetic factors as an important cause of individual differences in the efficacy of hypoglycemic drugs (2, 21, 22). However, it remains unknown whether PPARD single nucleotide polymorphisms (SNPs) have the same influence on the therapeutic effects of exenatide. In this study, we investigated the association between PPARD variants and the efficacy of exenatide in newly diagnosed Chinese T2DM patients who received exenatide monotherapy for 6 months, and further explored the potential mechanism.
Materials and methods
Participants and study design
A total of 300 patients with T2DM (196 male and 104 female) and 200 healthy controls (139 male and 61 female) were enrolled for PPARD variants analysis. T2DM patients and healthy subjects were recruited from the Department of Endocrinology and Health Screening Center, Affiliated Hospital of Xuzhou Medical University, Xuzhou, China. T2DM was diagnosed according to the 1999 World Health Organization criteria. The inclusion criteria were: newly diagnosed T2DM without drug therapy; 25 to 70 years old; Hemoglobin A1c (HbA1c) 7%-12%; BMI 20-35 kg/m2; Stable body weight (≤10% change within 3 months); Female subjects were required to use birth control pills during the three months prior to screening and during the study, or surgical contraception, or postmenopausal women. Subjects with acute or severe chronic diabetic complications, serious comorbid diseases, New York Heart Function Scale (NYHA) III~IV, severe osteoporosis or a history of fractures, alanine aminotransferase (ALT) and aspartate transaminase (AST) ≥2.5 times of upper limit, or serum creatinine level ≥133 µmol/L, severe gastrointestinal dysfunction, ongoing use of weight-loss drugs, glucocorticoids, drugs that affecting gastrointestinal motility, transplant therapy drugs, any investigational drugs, a history of pancreatitis, or serum triglyceride level ≥5 mmol/L were excluded. A total of 105 newly diagnosed T2DM patients (73 male and 32 female) with different PPARD rs2016520 and rs3777744 genotypes were randomly selected to receive exenatide injection subcutaneously for 6 months and completed the follow-up. During the 1st week to the 4th week, exenatide was given 5 µg once, twice a day, after which the dose was adjusted to 10 µg once, twice a day. The protocol was approved by the Ethics Committee of the Affiliated Hospital of Xuzhou Medical University. Written informed consent was obtained from each participant before taking part in the study.
Anthropometric and biochemical measurements
The general anthropometric parameters such as height, weight, waist circumference and hip circumference were measured in the morning on an empty stomach. Waist circumference was measured at the midpoint of the line connecting the lower rib cage and the skeleton, and hip circumference was measured at the level of the greater trochanter of the femur. BMI and waist to hip ratio (WHR) were calculated. BMI = body weight (kg)/height (m)2, WHR = waist circumference (cm)/hip circumference (cm). Venous blood was collected both after fasting overnight and 2 h later during a standard oral glucose tolerance test. Parameters were measured before administration of exenatide, 3 months and 6 months after administration. Plasma glucose and serum lipids were detected using a Roche Cobas8000 analyzer (Roche, Basel, Switzerland) with standard laboratory methods. Accordingly, the levels of insulin and HbA1c were measured by an electrochemiluminescence assay (Roche, Shanghai, China) and high-performance liquid chromatography (HPLC). The homeostasis model assessment for insulin resistance (HOMA-IR) and homeostasis model assessment for beta cell function (HOMA-B) were calculated using the formula: HOMA-IR = fasting insulin (mU/L)×fasting plasma glucose (mmol/L)/22.5; homeostasis model assessment HOMA-B = 20×fasting serum insulin (FINS)/(FPG-3.5) (23).
Genotyping
Genomic DNA was extracted from peripheral whole blood leukocytes with a DNA extraction kit (Tiangen Biotech, Beijing, China) according to the manufacturer’s protocol. The allelic discrimination of PPARD rs2016520 and rs3777744 was performed by SNaPshot assay (Genesky Biotechnologies Inc., Shanghai, China) with the standard protocol (24).
Definition of the response to exenatide
The guideline of National Institute for Health and Care Excellence (NICE) define T2DM patients who have a ≥1.0% reduction in HbA1c or a ≥3% reduction in body weight after 6 months of treatment with GLP-1 agonists as the treatment response group, and those who do not meet these criteria are defined as Non-responders (25). Based on UK prospective diabetes study (UKPDS)results, a 1% decrease in HbA1c was associated with a 37% reduction in the risk of diabetic microvascular complications and a 21% reduction in diabetes-related end points (26). Since diabetes complications are closely related to HbA1c level, this study mainly evaluated HbA1c changes after exenatide treatment, and defined those T2DM patients whose HbA1c decreased ≥1.0% or endpoint HbA1c < 7.0% after 6 months of exenatide treatment as Responders. Those who do not meet the above criteria are Non-responders.
Cell culture
The human hepatoma cell line (HepG2) was obtained from the Type Culture Collection of the Chinese Academy of Sciences (Shanghai, China), cultured in Dulbecco’s modified Eagle’s medium supplemented with 10% fetal bovine serum (Gibco BRL, USA) and were placed in a humidified incubator containing an atmosphere of 5% CO2 at 37°C. The insulin-resistant cell model was induced using the previous method (27). HepG2 cells were allowed to attach for 12 h and then serum-starved for 8 h. HepG2 cells were incubated with fresh medium containing 1% FBS, 10-3 mmol/L insulin (Wanbang Biologic & Medicinal Co., Ltd., Jiangsu, China) for 6 h. Subsequently, the medium was exchanged with medium containing 1% FBS, 10-6 mmol/L insulin and Exendin-4 (10-1 mmol/L, Sigma). Cells were incubated in this medium for 12 h.
Gene transfection
The transfection of plasmids (6 µg) was carried out using Lipofectamine 3000 Transfection Reagent (Invitrogen, USA) according to the manufacturer’s instructions. The ratio of plasmids (μg) and transfection reagents (μL) was 3:4 (27–29). The cells were harvested 48 h after transfection.
Glucose uptake tests of HepG2 cells
Glucose content was determined by the enzymatic method of the diagnostic kit using 10 μL of medium (Nanjing Jiancheng Bioengineering Inst, China). Data were expressed as extracellular glucose consumption (nmol/mg protein) and calculated as follows: [before extracellular glucose content (nmol) - after extracellular glucose content (nmol)]/mg cellular protein (27), which was measured using the Nanodrop 2000 spectrophotometer (Thermo, USA).
Western blot analysis for protein levels
Western blot analysis was performed as previously described (28), and the antibodies were applied at concentrations according to the manufacturer’s instructions. Actin served as the loading control. Bands were quantified using Image J software. Anti-Actin (AP0060, Bioworld, USA), anti-PPARδ (101562-AP, Proteintech, USA) and anti-GLP-1R (DF7750, Affinity Biosciences, USA) were used in our study.
Real-time quantitative RT-PCR
Total RNA in HepG2 cells was isolated using Trizol Reagent (15596-026, Invitrogen, USA) according to the manufacturer’s instructions, and the steps of RT-PCR were carried out as described previously (29, 30). Data were normalized to internal control β-actin mRNA. Primers were designed and synthesized by Sangon Biotech (Shanghai, China). We used the primer pair 5′-TCTGGAATGGTCTGGAGTGGTCTG-3′ (forward) and 5′-GCCTTGAAGCAGTCCTGTAGAGATC-3′ (reverse) for human PPARδ, 5′- GCAAAGACCTGTACGCCAAC -3′ (forward) and 5′- AGTACTTGCGCTCAGGAGGA -3′ (reverse) for human β-actin, 5′-CCTCCAGATGTCCCCTCCAGATG-3′ (forward) and 5′-CTAAGTGTGCCGCTGCTCCTTC-3′ (reverse) for mouse PPARδ, 5′-AGAGGGAAATCGTGCGTGAC-3′ (forward) and 5′-CAATAGTGATGACCTGGCCGT-3′ (reverse) for mouse β-actin, 5′-GTTCCCCTGCTGTTTGTTGT-3′ (forward) and 5′-CTTGGCAAGTCTGCATTTGA-3′ (reverse) for human GLP-1R.
Statistical analysis
All data were expressed as mean ± standard deviation (Mean ± SD) or percentage as appropriate. Statistical analyses were performed using SPSS software (version 13.0 for Windows; SPSS Inc., Chicago, IL, USA). Chi-square test was used to compare the Hardy-Weinberg equilibrium, allele frequency and genotype distribution among different groups. Linkage disequilibrium (LD) among SNPs was estimated in subjects using Haploview version 3.2. The two-sample t-test was used to compare the baseline characteristics between T2DM patients and healthy subjects. The paired Student’s t-test was applied for evaluating the parameters between the two groups before and after exenatide treatment. For parameters of normal distribution, two-sample t-test was used for comparison between two groups, and one-way analysis of variance (ANOVA) was used for comparison among multiple groups. Parameters with nonnormal distribution were analyzed by the Mann-Whitney U-test or the Kruskal-Wallis test. ANOVA for repeated measurement was used to compare the parameters collected at different treatment time points of the same patient. Statistical power was calculated by power calculator software (http://www.ncss.com). In the experimental study, differences between treated and control results were compared using one-way ANOVA with a Tukey-Kramer post-test for multiple comparisons or unpaired t-test. Two-sided tests were used for all analyses, and P < 0.05 indicated statistically significant.
Results
Allelic frequency analysis
In the present study, PPARD rs2016520 and rs3777744 variants were genotyped in 300 patients with T2DM (196 male and 104 female) and 200 healthy controls (139 male and 61 female) (Table 1). The frequency of the A allele at the PPARD rs3777744 locus was lower in patients with T2DM than in healthy controls (57.00% vs. 62.75%, P = 0.004), whereas the PPARD rs2016520 variant, there was no significant difference in allele frequencies between the two groups. The genotype distributions of rs2016520 (P = 0.105) and rs3777744 (P = 0.171) SNPs were in Hardy-Weinberg equilibrium. Assessment of the LD between the variants using our control subjects revealed a relatively low disequilibrium between rs2016520 and rs3777744 (D’ = 0.110).
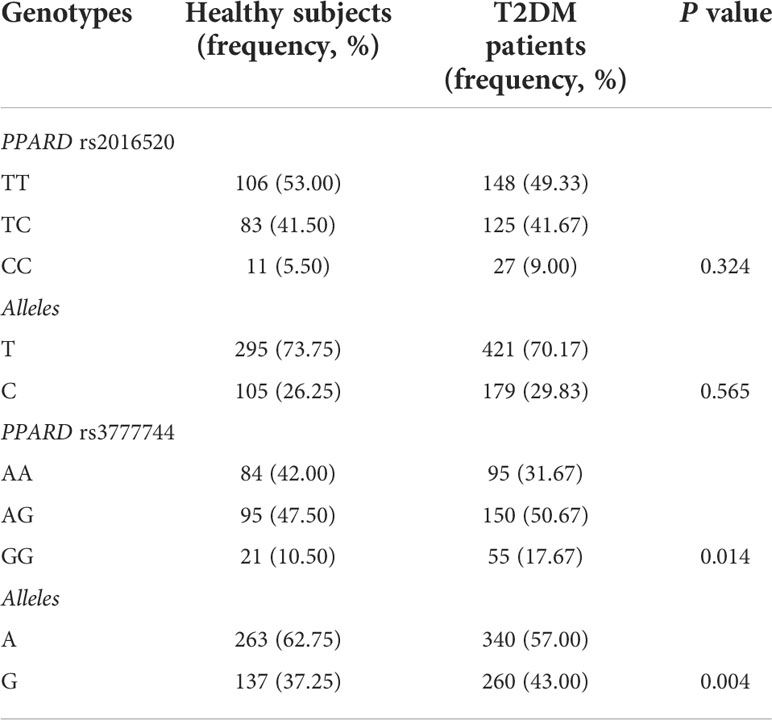
Table 1 Comparison of genotype and frequencies of PPARD variants between healthy controls (n = 200) and patients with type 2 diabetes mellitus (T2DM) (n = 300).
Assessment of clinical characteristics in T2DM patients with different rs2016520 and rs3777744 genotypes
In the present study, the baseline clinical characteristics of 300 T2DM patients with different rs2016520 and rs3777744 genotypes were analyzed (Tables 2, 3). There were no significant differences in gender, age, postprandial plasma glucose (PPG), HbA1c, postprandial serum insulin (PINS), HOMA-B, triglyceride (TG), high-density lipoprotein-cholesterol (HDL-C) and low-density lipoprotein-cholesterol (LDL-C) between different genotype groups. However, significant differences were observed among patients with different genotypes of PPARD rs2016520 in terms of BMI (P = 0.000), WHR (P = 0.001) and TG (P = 0.006) (Supplementary Figure S2). Compared to patients with the AA genotype, patients with the rs3777744 risk G allele had noticeably higher WHR (P = 0.000), PPG (P = 0.011), FINS (P = 0.004) and HOMA-IR (P = 0.000) levels (Supplementary Figure S3).
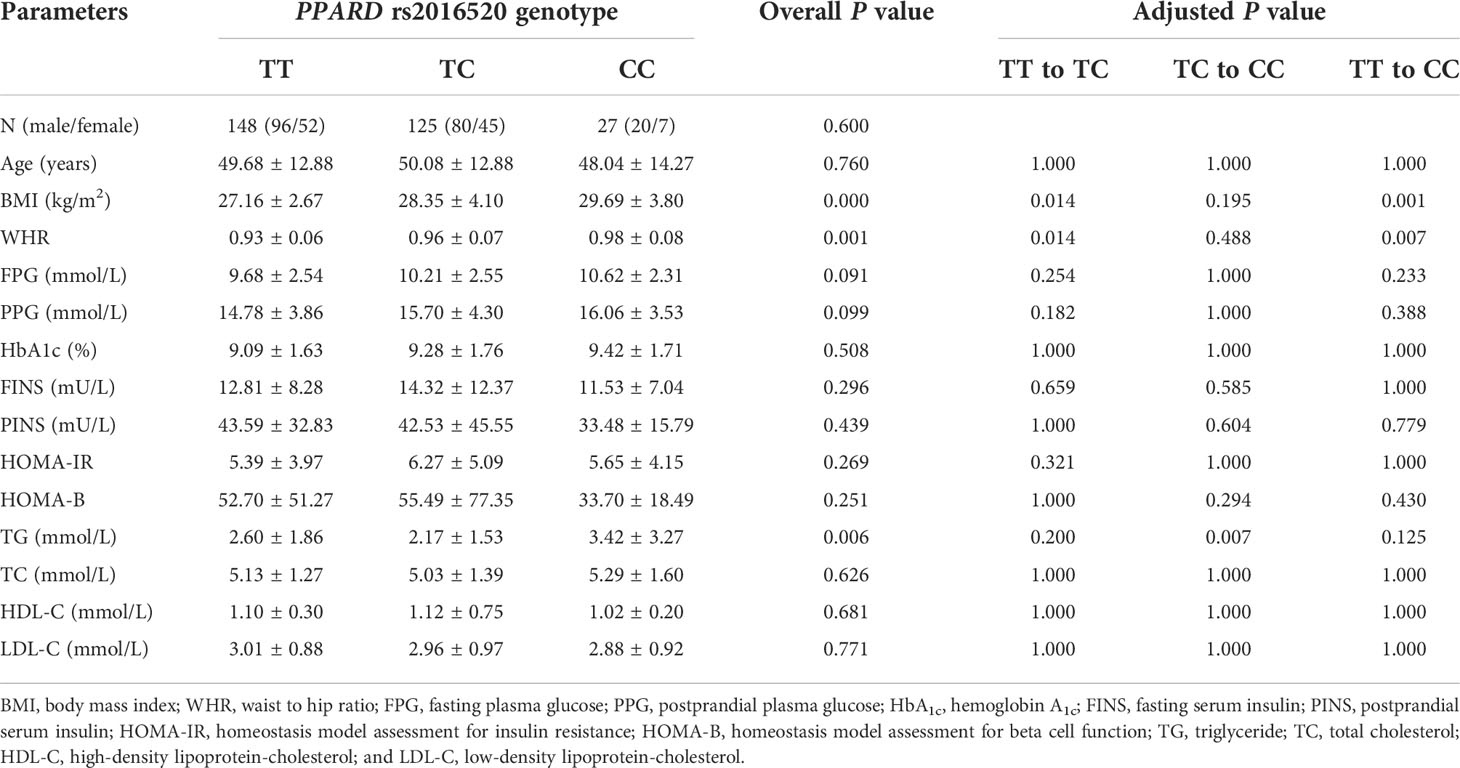
Table 2 The baseline characteristics in type 2 diabetes mellitus (T2DM) patients with various PPARD rs2016520 genotypes before treatment with exenatide (n=300).
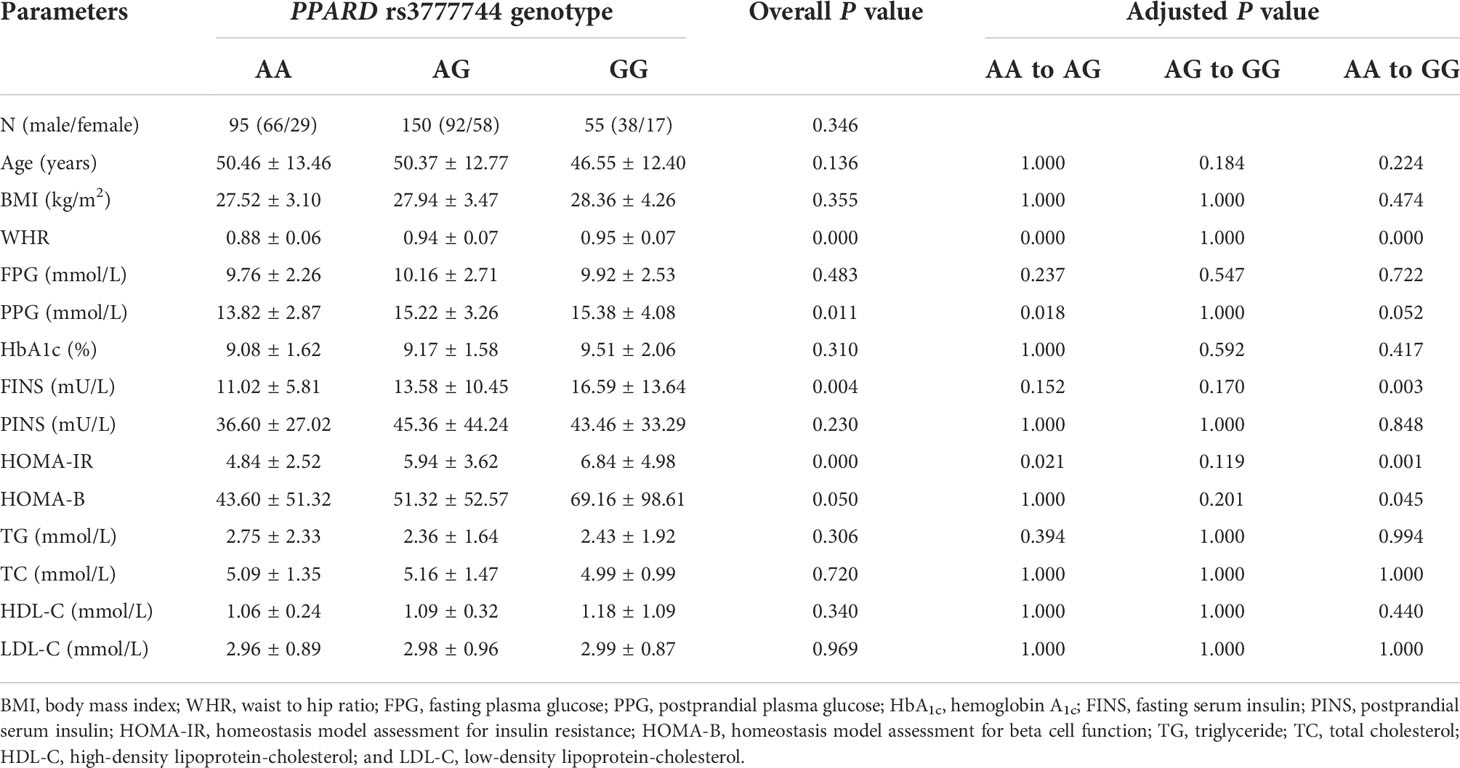
Table 3 The baseline characteristics in type 2 diabetes mellitus (T2DM) patients with various PPARD rs3777744 genotypes before treatment with exenatide (n=300).
Effects of the rs2016520 and rs3777744 variants on the efficacy of exenatide in T2DM patients
After 6 months of exenatide treatment, the BMI, WHR, FPG, PPG, HbA1c, HOMA-IR, total cholesterol (TC), TG, and LDL-C values of patients with T2DM were significantly decreased, but the levels of FINS and HOMA-B increased, compared with the pretreatment values (Supplementary Table S1).
Our data also showed that patients with genotype TT at PPARD rs2016520 had poor efficacy of exenatide monotherapy with respect to HOMA-IR than C allele carriers (Supplementary Table S2 and Figure 1). Moreover, patients with PPARD rs3777744 AG + GG genotypes had attenuated efficacy of exenatide monotherapy with respect to WHR, FPG, HbA1c and HOMA-IR compared with AA genotype carriers (Supplementary Table S2 and Figure 2).
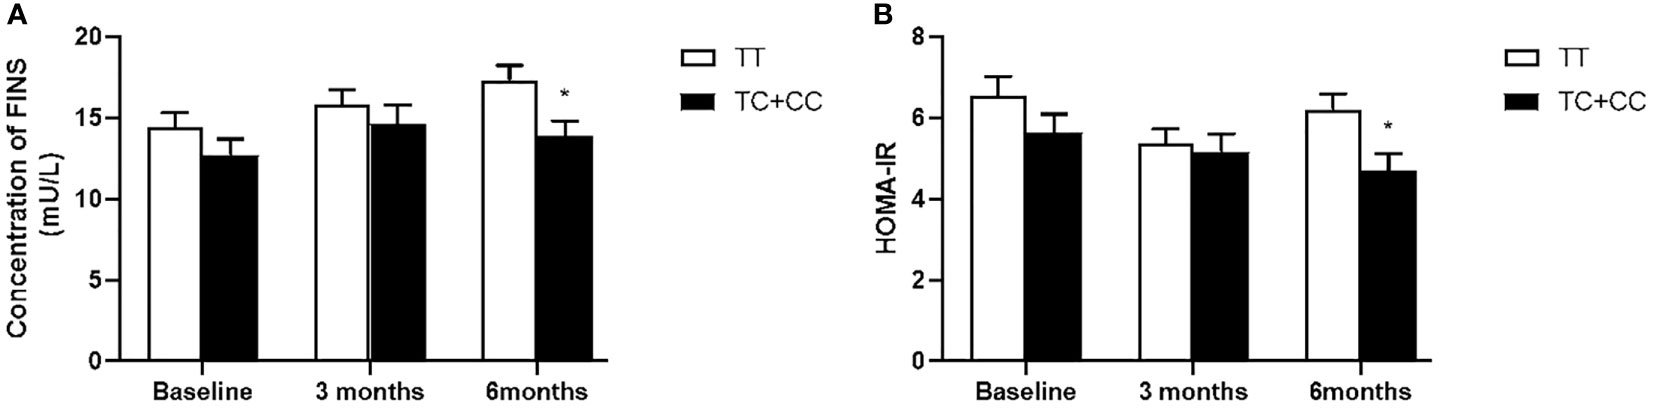
Figure 1 Comparison of fasting serum insulin (FINS) (A) and homeostasis model assessment for insulin resistance (HOMA-IR) (B) between T2DM patients with the TT genotype (n = 62) and those with TC and CC genotypes (n = 43) genotypes of PPARD rs2016520 in T2DM patients before, at 3 months and at 6 months of exenatide treatment. Data are expressed as the mean ± SE, *P<0.05 compared with TT genotype group (n= 105).
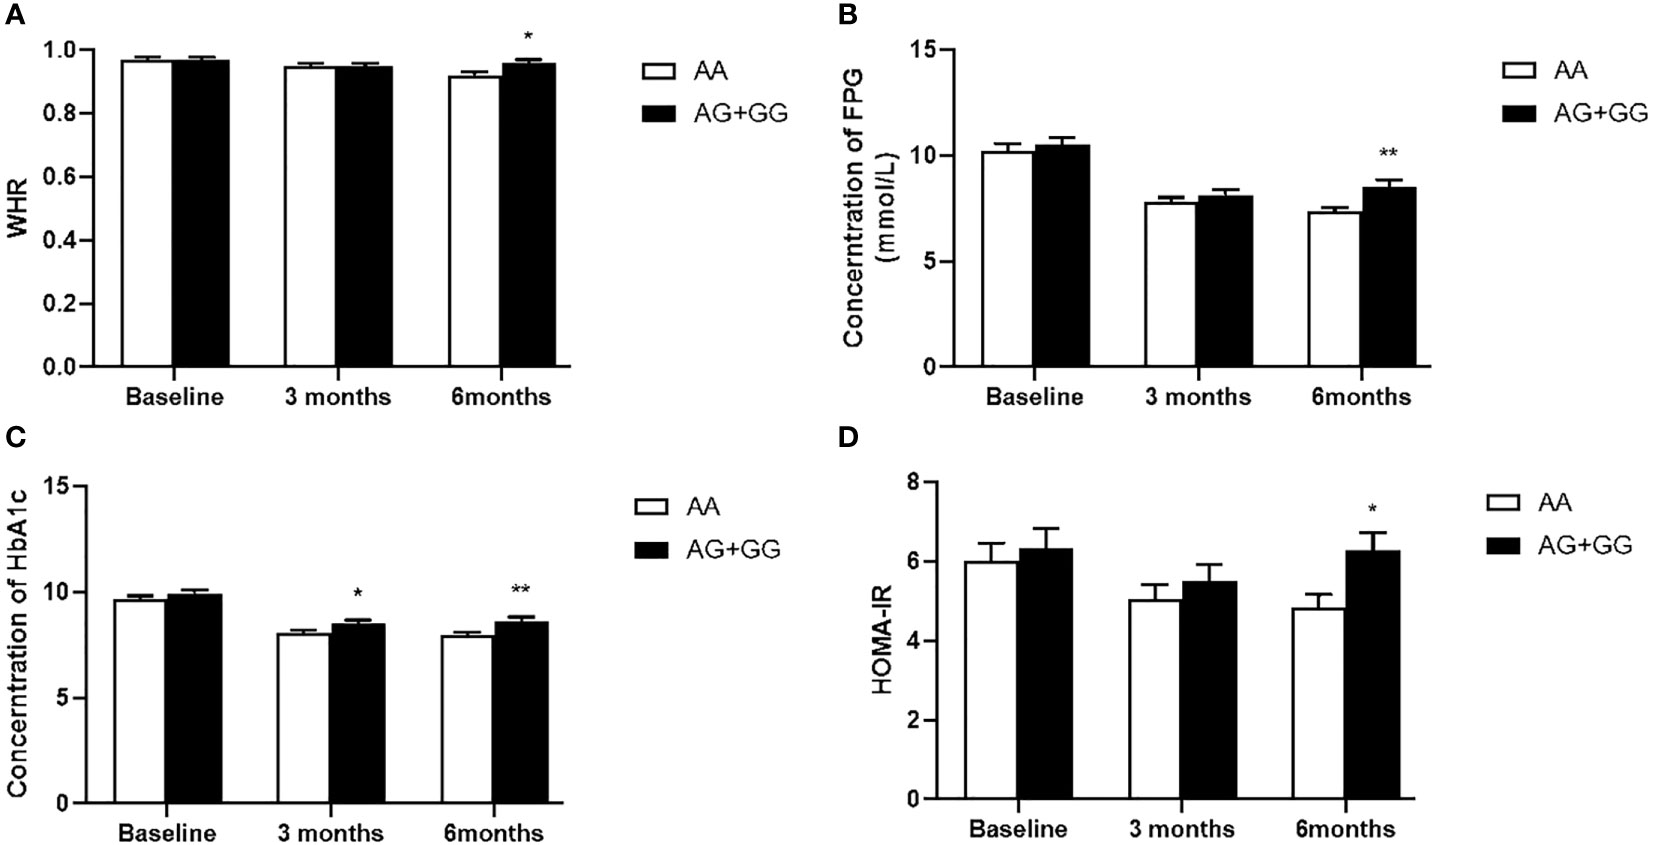
Figure 2 Comparison of waist to hip ratio (WHR) (A), fasting plasma glucose (FPG) (B), hemoglobin A1c (HbA1c) (C) and homeostasis model assessment for insulin resistance (HOMA-IR) (D) between T2DM patients with the AA genotype (n = 50) and those with AG and GG genotypes (n = 55) genotypes of PPARD rs3777744 in T2DM patients before, at 3 months and at 6 months of exenatide treatment. Data are expressed as the mean ± SE, *P<0.05 and **P<0.01 compared with AA genotype group (n = 105).
Association of the rs2016520 and rs3777744 variants with response rate to exenatide treatment
In order to assess the association of the PPARD genetic variants with the response rate to exenatide treatment in the present study, the genotypes and allele frequencies were analyzed in the Responder and Non-responder groups (Table 4). According to predetermined exenatide response criteria, PPARD rs3777744 A allele carriers exhibited higher response rate to exenatide treatment (P = 0.007); AA allele homozygotes had the highest response rate (84.00%), while AG heterozygous and GG homozygous had 61.36% and 54.55%, respectively (P = 0.022). No significant effects of PPARD rs2016520 variant on exenatide therapy were observed.
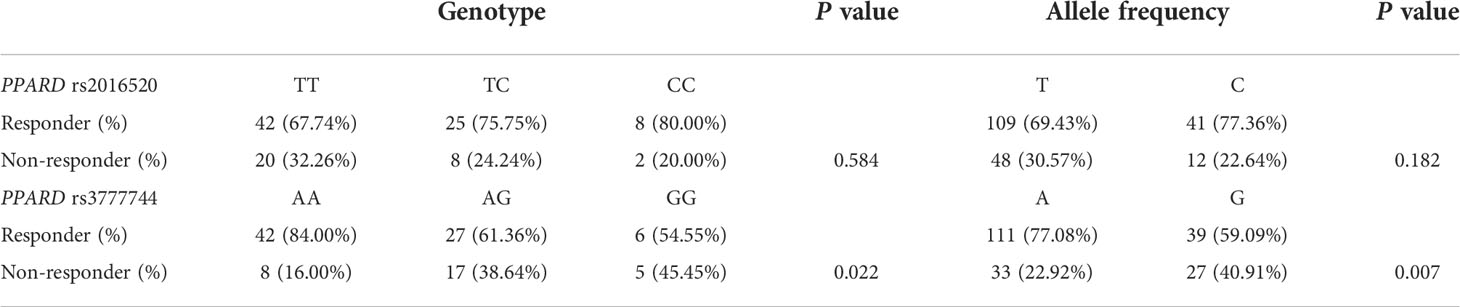
Table 4 Genotype and allele distributions between responders and non-responders of PPARD rs2016520 and rs3777744 variants (n = 105).
To further determine the correlation between PPARD variant and improvement in HbA1c after exenatide treatment, a multiple linear regression model was used, with the dependent variable being the decrease in HbA1c after 6 months of exenatide treatment and the independent variables being age, gender, baseline BMI, baseline WHR, baseline HbA1c, rs2016520 and rs3777744. The results showed that the improvement of HbA1c after exenatide treatment was significantly correlated with baseline HbA1c and rs3777744, and the difference between PPARD rs3777744 AG+GG genotype and AA genotype in the improvement of HbA1c was statistically significant (P = 0.009). Higher the baseline HbA1c was, more significantly the HbA1c improved after 6 months of exenatide treatment (P = 0.000) (Table 5).
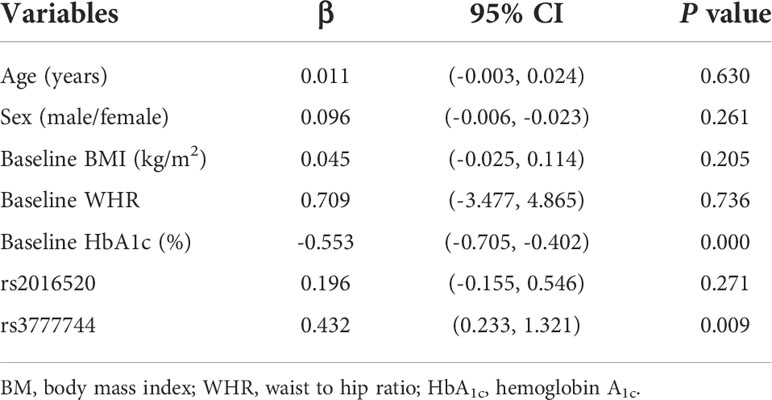
Table 5 Multiple linear regression analysis of HbA1c improvement after 6 months of exenatide treatment (n = 105).
Expression of PPARδ in liver tissues of db/db mice and in an insulin-resistant HepG2 cell model
To clarify the effect of insulin resistance on the expression level of PPARδ, we used RT-PCR and Western blot to detect the expression level of PPARδ in the liver tissues of db/db mice and in an insulin-resistant HepG2 cell model. When compared with the db/m group, the mRNA and protein levels of PPARδ in the liver tissues of db/db group were significantly lower (P < 0.05) (Supplementary Figures S4A, B). The results of in vitro experiments showed that in HepG2 cells, there was no difference between PPARδ expression in the solvent control group (SC) and the negative control group (NC), but both mRNA and protein expression of PPARδ were significantly lower in the insulin resistant group (IR) (P < 0.05) (Supplementary Figures S4C, D). According to the in vivo and in vitro results, PPARδ expression levels were significantly decreased in insulin resistant HepG2 cells and in liver tissue of db/db mice.
PPARδ controls exenatide therapeutic efficacy in insulin resistance by regulating the expression of GLP-1R
To further validate the mechanism by which PPARδ regulates exenatide therapeutic efficacy, relationship between PPARδ activity and GLP-1R expression was investigated. The silencing PPARδ plasmid and silencing negative control (siNC) plasmid were transfected in HepG2 cells, and the knockdown efficiency of the three plasmids (siPPARδ-1, siPPARδ-2 and siPPARδ-3) was detected. The RT-PCR and western blot results showed the most significant reduction in the siPPARδ-3 group (Supplementary Figure S5). Therefore, the silencing plasmid named siPPARδ-3 was finally selected for the follow-up experiment.
As shown in Figure 3A, both PPARδ agonists (GW501516) and Exendin-4 significantly increased the ratio of glucose uptake in IR HepG2 cells, and the efficacy of Exendin-4 was significantly enhanced after treatment with GW501516. In addition, the expression of GLP-1R in IR HepG2 cells were up-regulated markedly after administration of PPARδ agonist (Figure 3B, C). As predicted, the knockdown of PPARδ hindered glucose metabolism and down-regulated the expression of GLP-1R in HepG2 cells (Figure 4). These results indicated that PPARδ plays a pivotal role in insulin resistance through regulating the expression of GLP1-R and influences the ability of exenatide to agonize GLP-1R to improve insulin resistance.
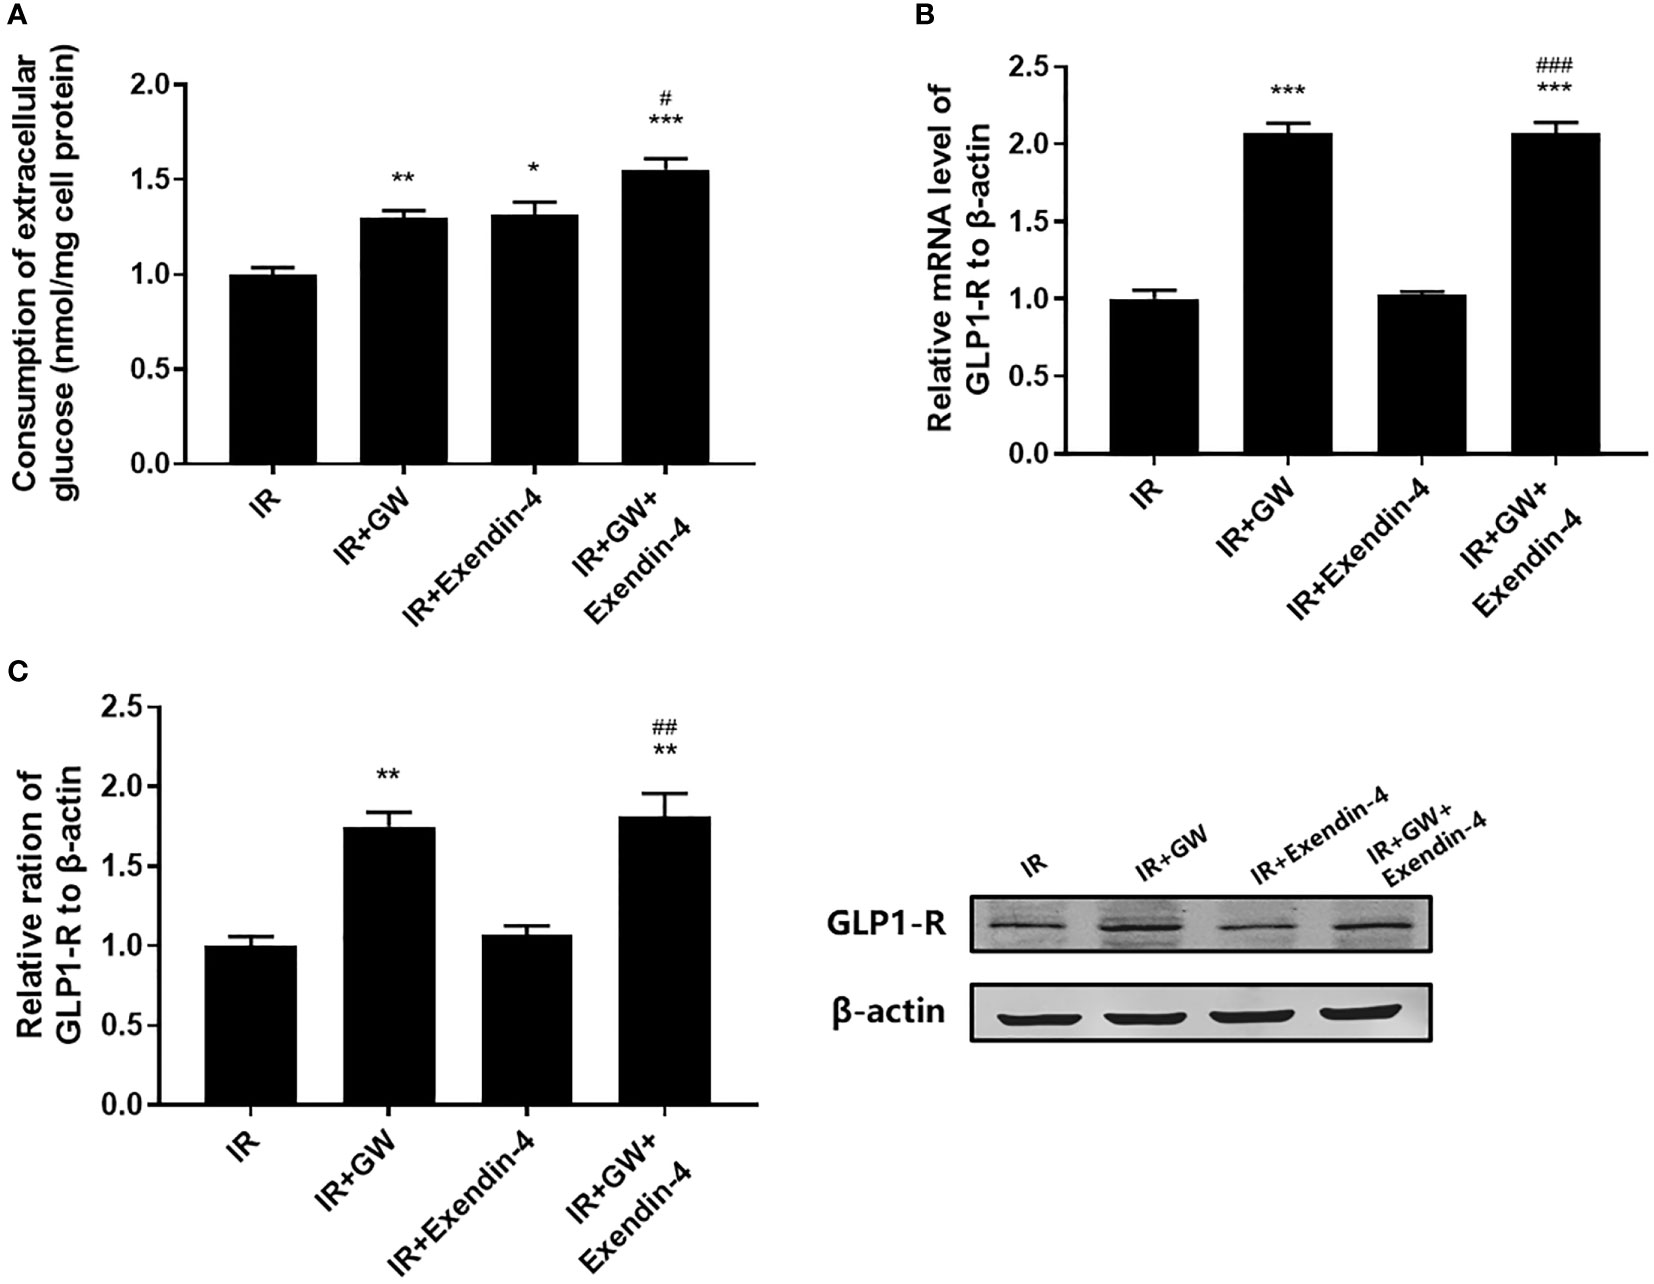
Figure 3 Effect of PPARδ agonists (GW501516) on the exenatide therapeutic efficacy by regulating the expression of GLP-1R. (A) Enzymatic methods were used to assay for glucose. (B) The mRNA level of GLP-1R was measured by RT-PCR. (C) The relative protein expression level of GLP-1R was measured by Western blot. Data are expressed as the mean ± SE, n = 3. *P < 0.05, **P < 0.01 and ***P < 0.001 compared with IR. #P < 0.05, ##P < 0.01 and ###P < 0.001 compared with IR+Exendin-4.
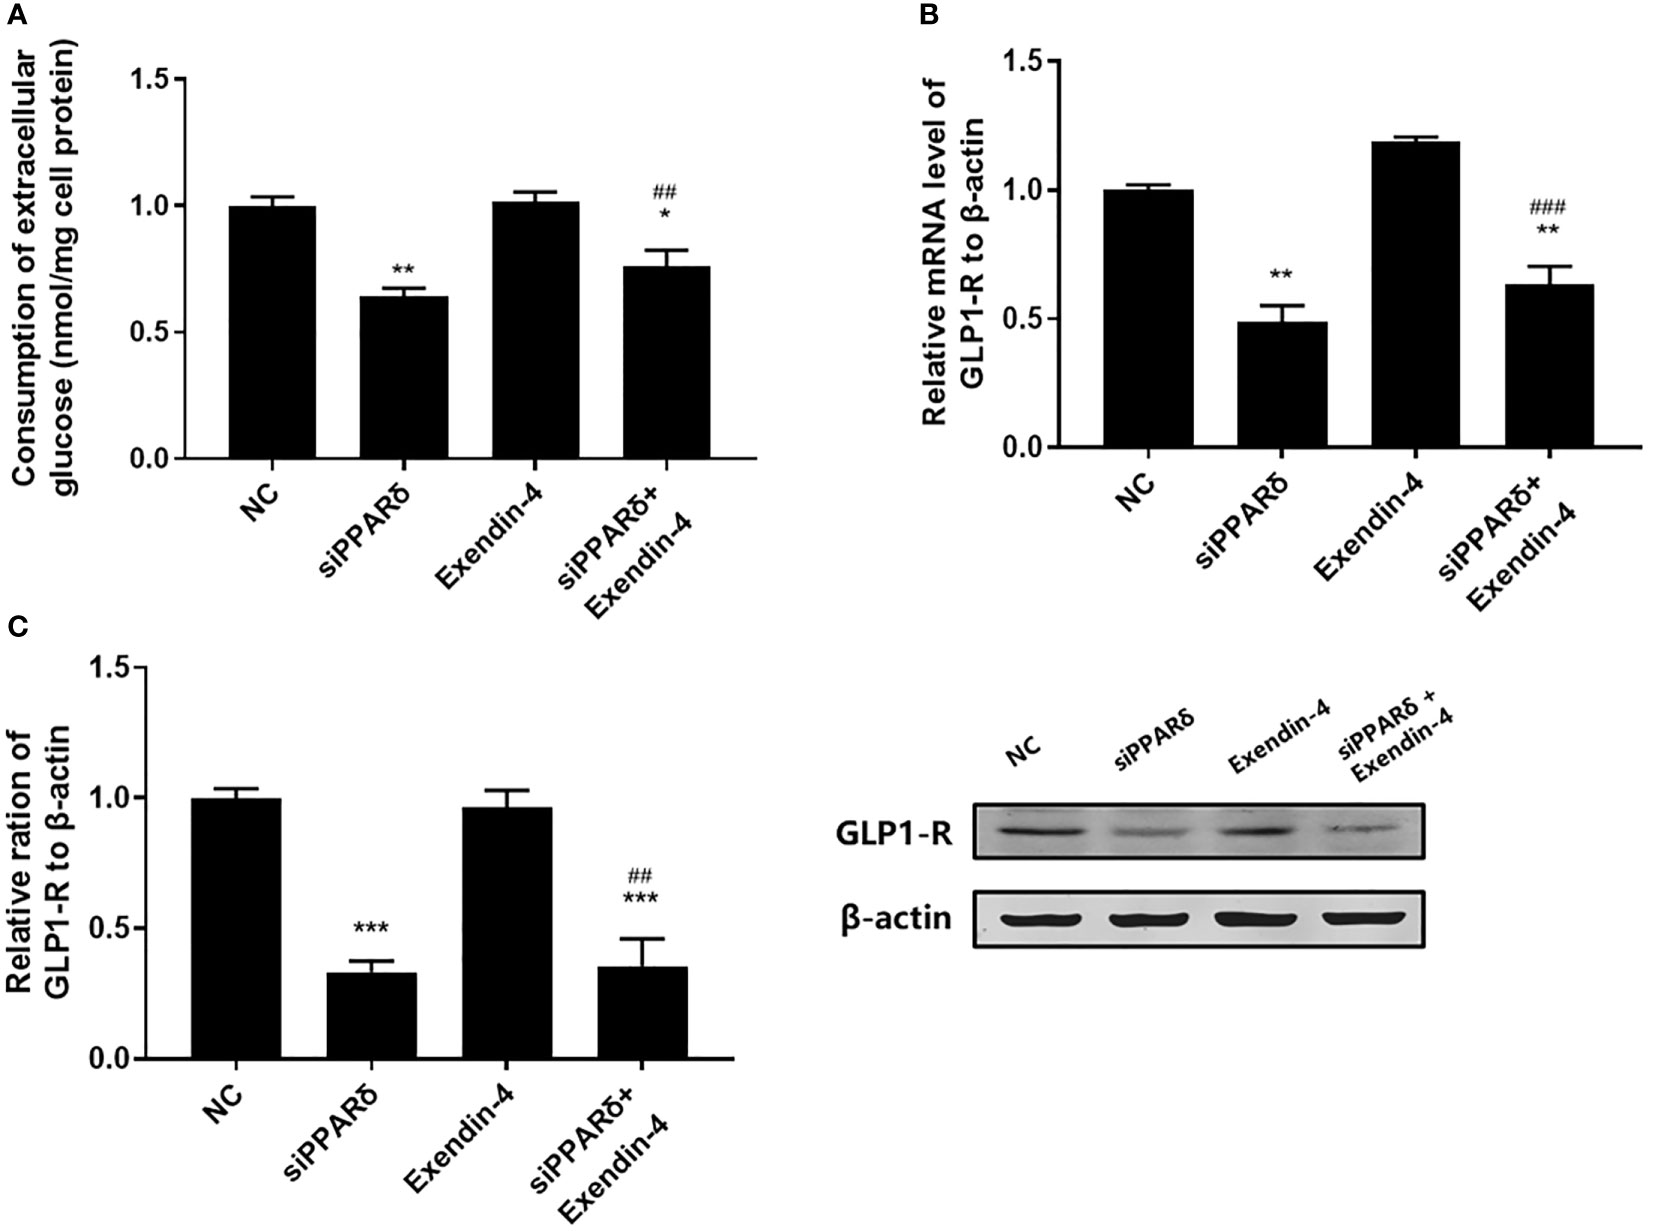
Figure 4 Effect of PPARδ knockdown on the exenatide therapeutic efficacy by regulating the expression of GLP-1R. (A) Enzymatic methods were used to assay for glucose. (B) The mRNA level of GLP-1R was measured by RT-PCR. (C) The relative protein expression level of GLP-1R was measured by Western blot. Data are expressed as the mean ± SE, n = 3. *P < 0.05, **P < 0.01 and ***P < 0.001 compared with NC. ##P < 0.01, ###P < 0.001 compared with Exendin-4.
Discussion
In the current study, we evaluated the potential impact of two SNPs (rs2016520 and rs3777744) of PPARD on the outcomes of exenatide in treating Chinese patients with T2DM. Genetic variants associated with T2DM susceptibility or metabolism-related indicators have been proved in several pharmacogenomic studies to be important factors in the efficacy of exenatide (18–20). The results of this study revealed that patients with the TT genotype of PPARD rs2016520 or the G allele of rs3777744 may have a weaker response to exenatide therapy, indicating that the PPARD genotype can be used as a predictor of response to exenatide. Therefore, our findings support the prior generation of genotyping and screening of patients with T2DM for gene-directed individualized dosing in the clinical application of exenatide. Moreover, we also observed the critical role of PPARδ in regulation of the expression of GLP-1R, the receptor for exenatide, and effects on insulin resistance.
Common SNPs in PPARD are associated with an increased risk of impaired glucose tolerance, fasting glucose elevation and insulin resistance in populations with diverse ethnic backgrounds including Chinese, Korean and Mexican (5–8). In the present study, we focused on genetic variants in PPARD and found that the risk G allele of rs3777744 (43.00%) in patients with T2DM had a higher frequency than that in the control group (P < 0.01) and it was higher than the data from the 1000 Genomes (36.60%) (31). In contrast, PPARD rs2016520 did not show a significant association with T2DM in our subjects, but the frequency of the C allele of rs2016520 (29.83%) was lower than that in the data from the 1000 Genomes (36.60%) (31). Comparison of our findings with the 1000 Genomes data showed that PPARD rs2016520 and rs3777744 showed dramatically different allele frequencies in different ethnic populations. The major reasons for this discrepancy may be the differences in specific ethnic groups and exposure to environmental factors. The main drivers of this variation may be due to differentiation in specific ethnic groups and the influence of exposure to diverse environments. The current study also displayed higher BMI and WHR values in T2DM patients with PPARD rs2016520 TC and CC genotypes, which indicated a potential contribution of the genetic variant to the prevalence of overweight and obesity in T2DM patients (Table 2 and Supplementary Figure S2). In contrast, WHR, PPG, FINS and HOMA-IR were higher in patients with the rs3777744 risk G allele compared with those carrying the A allele (Table 3 and Supplementary Figure S3). Potent associations have been determined between genetic variation in the PPARD gene and elevated susceptibility to T2DM, as well as obesity and insulin resistance. In addition, PPARδ is involved in regulating energy metabolism in liver, skeletal muscle and adipose tissue, and it is a mechanism by which PPARD gene variants lead to obesity and insulin resistance (32, 33).
The known involvement of PPARδ in insulin resistance, either directly or indirectly suggests that PPARD gene variants may account for individual differences in the clinical efficacy of exenatide. There is no evidence from previous studies that patients with specific PPARD gene variants have better or worse clinical efficacy of exenatide. In this study, we observed that the FINS and HOMA-IR levels of the subjects with at least one C allele of the PPARD rs2016520 were significantly lower than those with the TT genotype after 6 months of treatment, which suggested that the PPARD rs2016520 TT genotype conferred the poor exenatide response through a reduction of insulin resistance, as measured by HOMA-IR. PPARδ is engaged in glucose and lipid metabolism in the liver and exerts insulin-sensitizing effects, thereby improving hepatic insulin resistance (34). Therefore, our findings suggest that PPARD rs2016520 may affect the biological function of PPARδ, thereby influenceing the therapeutic effects of exenatide on improving insulin resistance of patients with T2DM.
The carriers of G alleles at rs3777744 exhibited higher levels of WHR, FPG, HbA1c and HOMA-IR compared to individuals with the AA genotype following 6 months of exenatide treatment, potentially accounting for the lower failure rate of exenatide therapy among the AA homozygotes. Additional analysis of metabolic features revealed that the G allele of rs3777744 had a detrimental effect on FPG and HOMA-IR, suggesting that an increased FPG and HbA1c may be caused, at minimum partially, by the negative effects of insulin resistance. Regarding rs3777744, which is located at intron2 of PPARD at chromosome 6p21.31, it is confirmed that the rs3777744 G allele is associated with cardiovascular disease risk in the Chinese population, though the underlying mechanism is unclear (35). A wealth of studies support the notion that cardiovascular disease is related to both insulin resistance and the compensatory hyperinsulinemia associated with insulin resistance (36).
Therefore, the genetic variants of PPARD might be responsible for interindividual differences in exenatide response. The underlying mechanisms leading to these findings remain unclear, but the effects of the PPARD rs3777744 G allele on IR, PPG and HbA1c need to be explored further to clarify the underlying mechanisms.
We hypothesize that the underlying mechanism by which PPARD variants contribute to individual differences in the development of T2DM and the therapeutic effects of exenatide is that PPARδ regulates the expression and function of GLP-1R. To fully illustrate the role of PPARD on exenatide efficacy and its associated pathways in IR, we established the insulin resistance model in HepG2 cells. Interestingly, evidence showed that SNPs in intron regions can affect gene function mainly by influencing splice site activity, while SNPs in the 5’-UTR may affect its binding to transcription factors, thus affecting protein expression and function (37). Therefore, we hypothesized that the regulation of PPARD gene expression in cells could resemble the genetic variation and functional changes of PPARD in the clinic. PPARδ is essentially a class of ligand-dependent transcriptional regulators, and GLP-1R is the pharmacological target of exenatide. We identified potential PPARδ binding sites by analyzing the GLP-1R promoter through the JASPAR database (Supplementary Figure S1). Therefore, we hypothesized that PPARδ regulates the level and function of GLP-1R and may be the underlying mechanism of PPARD gene variants. In this study, we found that the activation of PPARδ enhanced the uptake of extracellular glucose and the protein expression of GLP-1R in IR HepG2 cells, suggesting that PPARδ played a critical role in the regulation of insulin signaling pathways under pathological conditions. To further assess whether PPARδ is involved in the efficacy of exenatide, we examined the efficacy of exenatide on glucose uptake in the cellular level. In an IR cell model, we observed that activation of PPARδ potentiated the therapeutic benefits of exenatide in IR and the expression level of GLP-1R were significantly elevated. Consistent with the results of clinical trial, these data strongly suggest that exenatide increases insulin sensitivity in the liver, which could be further strengthened by overexpression of PPARδ. On the other hand, we knocked down PPARδ on HepG2 cells and performed the mentioned experiments and observed the opposite effect, corroborating with the above results.
Meanwhile, several shortcomings of this study need to be considered when interpreting our findings. First, the sample size is relatively small, which results in restricted statistical power and low frequency of mutant phenotypes, this may have led us to miss some meaningful results. The current study had an estimated 81-97% power (for α=0.05) to detect the difference in the parameters. Consequently, further detailed studies with expanded sample size are warranted to validate the effects of PPARD variants on exenatide efficacy. Second, individual differences are the product of interactions between multiple genetic and environmental factors. In the present study, different exenatide responses were found to be associated with PPARD gene variants, but it cannot be excluded that other susceptibility genetic variants are also involved in individual differences of exenatide therapeutic efficacy. Therefore, we will estimate the co-effect of multiple loci on the efficacy of exenatide in the following studies. Third, the different locations of PPARD rs2016520 (in the 5’-UTR) and rs3777744 (located in intron2) have made it more difficult to carry out functional studies. We only explored the regulatory effect of PPARδ on GLP-1R and its effect on exenatide efficacy, however, the mechanism of SNPs in PPARD influence on PPARδ has not been elucidated.
In conclusion, the PPARD variants appear to be associated with the therapeutic response to exenatide in patients with T2DM. There may be a link between PPARδ and GLP-1R in the diabetic condition, which may be the molecular mechanism by which PPARD gene variants influence T2DM risk, insulin resistance and clinical response to exenatide. Therefore, the PPARD risk mutations may serve as exenatide response predictors based on PPARδ regulating GLP-1R expression and mediating insulin resistance. More detailed pharmacogenetic and functional studies are needed to elucidate the exact effects of PPARD variants on exenatide therapeutic efficacy, which is necessary to lay the foundation for a more precise and patient-tailored therapy for T2DM.
Data availability statement
The data presented in the study are deposited in the https://submit.ncbi.nlm.nih.gov/subs/biosample/SUB11888229/overview (NCBI) repository, accession number SUB11888229.
Ethics statement
The studies involving human participants were reviewed and approved by Ethics Committee of the Affiliated Hospital of Xuzhou Medical University. The patients/participants provided their written informed consent to participate in this study. The animal study was reviewed and approved by Animal Experiment Ethics Review Committee of Xuzhou Medical University.
Author contributions
JS contributed to conception of the article, data acquisition, statistical analysis, result interpretation, manuscript drafting and approved the final version. TW and XY designed the experiments and revised the paper. NL, RH, YY, KX, QL and TY helped with the experiments. HL contributed to data acquisition, and revised the paper. All authors contributed to the article and approved the submitted version.
Funding
This work was supported by grants from the National Natural Science Foundation of China (82003866), the Science and Technology Planning Project of Xuzhou (KC20093), the Wuxi Science and Technology Development Medical and Health Guidance Project (No. CSZ0N1809), and Jiangsu Research Hospital Association for Precision Medication (No. JY202011).
Acknowledgments
We thank all the volunteers in this study for their cooperation, and the physicians from the Department of Endocrinology, the Affiliated Hospital of Xuzhou Medical University for their support.
Conflict of interest
The authors declare that the research was conducted in the absence of any commercial or financial relationships that could be construed as a potential conflict of interest.
Publisher’s note
All claims expressed in this article are solely those of the authors and do not necessarily represent those of their affiliated organizations, or those of the publisher, the editors and the reviewers. Any product that may be evaluated in this article, or claim that may be made by its manufacturer, is not guaranteed or endorsed by the publisher.
Supplementary material
The Supplementary Material for this article can be found online at: https://www.frontiersin.org/articles/10.3389/fendo.2022.949990/full#supplementary-material
Supplementary Figure 1 | Predicted GLP-1R binding motif site sequence from the database JASPAR.
Supplementary Figure 2 | Baseline levels of body mass index (BMI) (A), waist to hip ratio (WHR) (B) and triglyceride (TG) (C) in T2DM patients with TT (n = 148), TC (n = 125) and CC (n = 27) genotypes of PPARD rs22016520. *P < 0.05 and **P<0.01 compared with the TT genotype group, ##P<0.01 compared with the TC genotype group (n = 300).
Supplementary Figure 3 | Baseline levels of waist to hip ratio (WHR) (A), postprandial plasma glucose (PPG) (B), fasting serum insulin (FINS) (C) and homeostasis model assessment for insulin resistance (HOMA-IR) (D) in T2DM patients with AA (n = 95), AG (n = 150) or GG (n = 55) genotypes of PPARD rs3777744. *P < 0.05, **P < 0.01 and ***P < 0.001compared with the AA genotype group (n = 300).
Supplementary Figure 4 | The expression of PPARδ decreased in IR HepG2 cell model and db/db mice. (A) The mRNA level of PPARδ in HepG2 cells was measured by RT-PCR. Data are expressed as the mean ± SE, n = 3. (B) The relative protein expression level of PPARδ in HepG2 cells was measured by Western blot. Data are expressed as the mean ± SE, n = 3. ***P < 0.001 compared with NC. (C) The mRNA level of PPARδ in db/db mice was measured by RT-PCR. Data are expressed as the mean ± SE, n = 6. (D) The relative protein expression level of PPARδ in db/db mice was measured by Western blot. Data are expressed as the mean ± SE, n = 6. ***P < 0.001 compared with db/m.
Supplementary Figure 5 | Validation of PPARδ plasmid knockdown efficiency in HepG2 cells. (A) The mRNA level of PPARδ in HepG2 cells was measured by RT-PCR. (B) The relative protein expression level of PPARδ in HepG2 cells was measured by Western blot. Data are expressed as the mean ± SE, n = 3. *P < 0.05, **P < 0.01 and ***P < 0.001 compared with siNC.
References
1. American Diabetes Association. Improving care and promoting health in populations: Standards of medical care in diabetes-2021. Diabetes Care (2021) 44(Suppl 1):S7–S14. doi: 10.2337/dc21-S001.
2. Mannino GC, Andreozzi F, Sesti G. Pharmacogenetics of type 2 diabetes mellitus, the route toward tailored medicine. Diabetes Metab Res Rev (2019) 35(3):e3109. doi: 10.1002/dmrr.3109
3. Persaud SJ, Jones PM. A wake-up call for type 2 diabetes? N Engl J Med (2016) 375(11):1090–2. doi: 10.1056/NEJMcibr1607950
4. Wagner N, Wagner KD. PPAR beta/delta and the hallmarks of cancer. Cells. (2020) 9(5):1133. doi: 10.3390/cells9051133
5. Shin HD, Park BL, Kim LH, Jung HS, Cho YM, Moon MK, et al. Genetic polymorphisms in peroxisome proliferator-activated receptor delta associated with obesity. Diabetes (2004) 53(3):847–51. doi: 10.2337/diabetes.53.3.847
6. Tang L, Lü Q, Cao H, Yang Q, Tong N. PPARD rs2016520 polymorphism is associated with metabolic traits in a large population of Chinese adults. Gene (2016) 585(2):191–5. doi: 10.1016/j.gene.2016.02.035
7. Hu C, Jia W, Fang Q, Zhang R, Wang C, Lu J, et al. Peroxisome proliferator-activated receptor (PPAR) delta genetic polymorphism and its association with insulin resistance index and fasting plasma glucose concentrations in Chinese subjects. Diabetes Med (2006) 23(12):1307–12. doi: 10.1111/j.1464-5491.2006.02001.x
8. Carrillo-Venzor MA, Erives-Anchondo NR, Moreno-González JG, Moreno-Brito V, Licón-Trillo A, González-Rodríguez E, et al. Pro12Ala PPAR-γ2 and +294T/C PPAR-δ polymorphisms and association with metabolic traits in teenagers from northern Mexico. Genes (Basel) (2020) 11(7):776. doi: 10.3390/genes11070776
9. Cao M, Tong Y, Lv Q, Chen X, Long Y, Jiang L, et al. PPARδ activation rescues pancreatic β-cell line INS-1E from palmitate-induced endoplasmic reticulum stress through enhanced fatty acid oxidation. PPAR Res (2012) 2012:680684. doi: 10.1155/2012/680684
10. Iglesias J, Barg S, Vallois D, Lahiri S, Roger C, Yessoufou A, et al. PPARβ/δ affects pancreatic β cell mass and insulin secretion in mice. J Clin Invest (2012) 122(11):4105–17. doi: 10.1172/JCI42127
11. Han L, Shen WJ, Bittner S, Kraemer FB, Azhar S. PPARs: regulators of metabolism and as therapeutic targets in cardiovascular disease. Part II: PPAR-β/δ and PPAR-γ. Future Cardiol (2017) 13(3):279–96. doi: 10.2217/fca-2017-0019
12. Bojic LA, Telford DE, Fullerton MD, Ford RJ, Sutherland BG, Edwards JY, et al. PPARδ activation attenuates hepatic steatosis in ldlr-/- mice by enhanced fat oxidation, reduced lipogenesis, and improved insulin sensitivity. J Lipid Res (2014) 55(7):1254–66. doi: 10.1194/jlr.M046037
13. Greene NP, Fluckey JD, Lambert BS, Greene ES, Riechman SE, Crouse SF. Regulators of blood lipids and lipoproteins? PPARδ and AMPK, induced by exercise, are correlated with lipids and lipoproteins in overweight/obese men and women. Am J Physiol Endocrinol Metab (2012) 303(10):E1212–21. doi: 10.1152/ajpendo.00309.2012
14. Nauck MA, Meier JJ. Incretin hormones: Their role in health and disease. Diabetes Obes Metab (2018) 20 Suppl 1:5–21. doi: 10.1111/dom.13129
15. McCormack PL. Exenatide twice daily: A review of its use in the management of patients with type 2 diabetes mellitus. Drugs (2014) 74(3):325–51. doi: 10.1007/s40265-013-0172-6
16. Xu W, Bi Y, Sun Z, Li J, Guo L, Yang T, et al. Comparison of the effects on glycaemic control and β-cell function in newly diagnosed type 2 diabetes patients of treatment with exenatide, insulin or pioglitazone: A multicentre randomized parallel-group trial (the CONFIDENCE study). J Intern Med (2015) 277(1):137–50. doi: 10.1111/joim.12293
17. Wang T, Zhang F, Wang X, Li X, Ling H, Lv D, et al. Predictive factors associated with glycaemic response to exenatide in Chinese patients with type 2 diabetes mellitus. J Clin Pharm Ther (2020) 45(5):1050–7. doi: 10.1111/jcpt.13134
18. Pilgaard K, Jensen CB, Schou JH, Lyssenko V, Wegner L, Brøns C, et al. The T allele of rs7903146 TCF7L2 is associated with impaired insulinotropic action of incretin hormones, reduced 24 h profiles of plasma insulin and glucagon, and increased hepatic glucose production in young healthy men. Diabetologia (2009) 52(7):1298–307. doi: 10.1007/s00125-009-1307-x
19. Schäfer SA, Tschritter O, Machicao F, Thamer C, Stefan N, Gallwitz B, et al. Impaired glucagon-like peptide-1-induced insulin secretion in carriers of transcription factor 7-like 2 (TCF7L2) gene polymorphisms. Diabetologia (2007) 50(12):2443–50. doi: 10.1007/s00125-007-0753-6
20. Schäfer SA, Müssig K, Staiger H, Machicao F, Stefan N, Gallwitz B, et al. A common genetic variant in WFS1 determines impaired glucagon-like peptide-1-induced insulin secretion. Diabetologia (2009) 52(6):1075–82. doi: 10.1007/s00125-009-1344-5
21. Ordelheide A, Hrabě de Angelis M, Häring H, Staiger H. Pharmacogenetics of oral antidiabetic therapy. Pharmacogenomics (2018) 19(6):577–87. doi: 10.2217/pgs-2017-0195
22. Gloyn AL, Drucker DJ. Precision medicine in the management of type 2 diabetes. Lancet Diabetes Endocrinol (2018) 6(11):891–900. doi: 10.1016/S2213-8587(18)30052-4
23. Kong X, Xing X, Hong J, Zhang X, Yang W. Association of a type 2 diabetes genetic risk score with insulin secretion modulated by insulin sensitivity among Chinese Hans. Clin Genet (2017) 91(6):832–42. doi: 10.1111/cge.12817
24. Li Y, Qiao X, Yin F, Guo H, Huang X, Lai J, et al. A population-based study of four genes associated with heroin addiction in han Chinese. PloS One (2016) 11(9):e0163668. doi: 10.1371/journal.pone.0163668
25. NICE. NICE guidance on managing type 2 diabetes in adults. Prescriber (2016) 27(4):22–9. doi: 10.1002/psb.1450
26. Stratton IM, Adler AI, Neil HA, Matthews DR, Manley SE, Cull CA, et al. Association of glycaemia with macrovascular and microvascular complications of type 2 diabetes (UKPDS 35): Prospective observational study. BMJ (2000) 321(7258):405–12. doi: 10.1136/bmj.321.7258.405
27. Zhou X, Zhu J, Bao Z, Shang Z, Wang T, Song J, et al. A variation in KCNQ1 gene is associated with repaglinide efficacy on insulin resistance in Chinese type 2 diabetes mellitus patients. Sci Rep (2016) 6:37293. doi: 10.1038/srep37293
28. Du L, Qian X, Li Y, Li XZ, He LL, Xu L, et al. Sirt1 inhibits renal tubular cell epithelial-mesenchymal transition through YY1 deacetylation in diabetic nephropathy. Acta Pharmacol Sin (2021) 42(2):242–51. doi: 10.1038/s41401-020-0450-2
29. Zhang MY, Li Y, Yin SY, Kong L, Liu XL, Yin XX, et al. Sarsasapogenin suppresses aβ overproduction induced by high glucose in HT-22 cells. Naunyn Schmiedebergs Arch Pharmacol (2018) 391(2):159–68. doi: 10.1007/s00210-017-1445-5
30. Zhu X, Cheng YQ, Du L, Li Y, Zhang F, Guo H, et al. Mangiferin attenuates renal fibrosis through down-regulation of osteopontin in diabetic rats. Phytother Res (2015) 29(2):295–302. doi: 10.1002/ptr.5254
31. 1000 Genomes Project Consortium, Auton A, Brooks LD, Durbin RM, Garrison EP, Kang HM, et al. A global reference for human genetic variation. Nature (2015) 526(7571):68–74. doi: 10.1038/nature15393
32. Wang YX, Lee CH, Tiep S, Yu RT, Ham J, Kang H, et al. Peroxisome-proliferator-activated receptor delta activates fat metabolism to prevent obesity. Cell (2003) 113(2):159–70. doi: 10.1016/S0092-8674(03)00269-1
33. Burch LR, Zhou K, Donnelly LA, Doney AS, Brady J, Goddard C, et al. A single nucleotide polymorphism on exon-4 of the gene encoding PPARdelta is associated with reduced height in adults and children. J Clin Endocrinol Metab (2009) 94(7):2587–93. doi: 10.1210/jc.2009-0392
34. Zarei M, Aguilar-Recarte D, Palomer X, Vázquez-Carrera M. Revealing the role of peroxisome proliferator-activated receptor β/δ in nonalcoholic fatty liver disease. Metabolism (2021) 114:154342. doi: 10.1016/j.metabol.2020.154342
35. Zhang J, Liu XL, Jia QW, Zhao CH, Liu JY, An FH, et al. The association between peroxisome proliferator-activated receptor Δ rs3777744, rs3798343, and rs6922548 and coronary artery disease. Biosci Rep (2019) 39(1):BSR20181510. doi: 10.1042/BSR20181510
36. Ormazabal V, Nair S, Elfeky O, Aguayo C, Salomon C, Zuñiga FA. Association between insulin resistance and the development of cardiovascular disease. Cardiovasc Diabetol (2018) 17(1):122. doi: 10.1186/s12933-018-0762-4
Keywords: PPARD gene, genetic variant, type 2 diabetes mellitus, exenatide, insulin resistance
Citation: Song J, Li N, Hu R, Yu Y, Xu K, Ling H, Lu Q, Yang T, Wang T and Yin X (2022) Effects of PPARD gene variants on the therapeutic responses to exenatide in chinese patients with type 2 diabetes mellitus. Front. Endocrinol. 13:949990. doi: 10.3389/fendo.2022.949990
Received: 22 May 2022; Accepted: 22 July 2022;
Published: 16 August 2022.
Edited by:
Jian-Quan Luo, Central South University, ChinaReviewed by:
Qian Ren, Nanjing Normal University, ChinaGopal L. Khatik, National Institute of Pharmaceutical Education and Research, India
Copyright © 2022 Song, Li, Hu, Yu, Xu, Ling, Lu, Yang, Wang and Yin. This is an open-access article distributed under the terms of the Creative Commons Attribution License (CC BY). The use, distribution or reproduction in other forums is permitted, provided the original author(s) and the copyright owner(s) are credited and that the original publication in this journal is cited, in accordance with accepted academic practice. No use, distribution or reproduction is permitted which does not comply with these terms.
*Correspondence: Tao Wang, bWlzc3d0MjAxMUAxMjYuY29t; Xiaoxing Yin, eWlueHhAeHptYy5lZHUuY24=