 Yikai Liu
 Zhiying Chen
 Hongzhi Chen
 Zhiguang Zhou
- Key Laboratory of Diabetes Immunology, National Clinical Research Center for Metabolic Diseases, Ministry of Education, and Department of Metabolism and Endocrinology, The Second Xiangya Hospital of Central South University, Changsha, China
Background: T-cell immunoglobulin and mucin domain (Tim) proteins are immunomodulatory molecules that play key roles in the regulation of T-cell activation. Published studies have reported that Tim molecules are involved in the pathogenesis of certain autoimmune diseases. Type 1 diabetes (T1D) is an autoimmune disease in which T cells mediate the destruction of islet β cells. However, the expression of Tim molecules in T1D remains unclear. In this study, we measured the expression of Tim family molecules as well as T-cell subset-specific transcription factors in T1D patients, and we explored the possible involvement of Tim molecules in the pathogenesis of T1D.
Methods: Ninety T1D patients, Thirty-six type 2 diabetes (T2D) patients and forty healthy controls (HCs) were recruited for this study. Peripheral blood mononuclear cells (PBMCs) were isolated, RNA was extracted from the PBMCs and reverse transcribed into cDNA, and gene expression patterns were analysed by RT–qPCR. The expression of Tim molecules in different T-cell subsets was analysed by flow cytometry.
Results: Compared with that in HCs, the mRNA expression of Tim-1 and RORC was increased in T1D patients (P=0.0355 and P=0.0423, respectively), while the expression of Tim-3 was decreased (P=0.0013). In addition, compared with HCs, the ratio of Tim-3 to Tim-1 expression in diabetic patients was decreased (P<0.0001 for T1D and P=0.0387 for T2D). The ratios of T-Bet to GATA3 expression and RORC to FOXP3 expression were higher in T1D patients than in HCs (P=0.0042 and P=0.0066, respectively). Furthermore, the T1D patients with defective islet function had more significant imbalances in the Tim-3/Tim-1 and RORC/FOXP3 ratios (P<0.0001, and P=0.001, respectively). Moreover, Both Tim-3 expression in CD4+ T cells and the Tim-3 to Tim-1 ratio were elevated in T1D in the remission phase compared to T1D.
Conclusion: Our study revealed altered expression of Tim molecules in T1D patients. The imbalanced ratios of Tim-3/Tim-1 expression were more pronounced in T1D patients with defective islet function. However, alterations in Tim molecule expression are mitigated in T1D in the remission phase. All these findings suggest that Tim family molecules may be involved in the pathogenesis of T1D.
Introduction
Type 1 diabetes (T1D), also known as insulin-dependent diabetes, is a common autoimmune disease. In T1D, the insulin-producing cells of the pancreas are destroyed by T lymphocytes, resulting in an absolute lack of insulin in patients (1). Although T1D occurs mostly in children and adolescents, new evidence suggests that the incidence of adult-onset T1D may be underestimated (2, 3). The onset of T1D is relatively rapid, and ketoacidosis can occur in severe cases and can even be life-threatening. At present, the pathogenesis of T1D is not fully understood. It mainly includes genetic and environmental factors, both of which increase the risk of T1D by causing immune imbalance (4, 5). Imbalance of T-cell immune homeostasis is a major factor in the development and progression of autoimmune. Therefore, determining the cause of immune imbalance is significant for the effective treatment of T1D, and this is an urgent problem that needs to be solved.
Members of the T-cell immunoglobulin and mucin domain (Tim) molecule family have been shown to be important regulators of the immune response (6). As the name suggests, Tim molecules were originally identified in T cells, and they mainly regulate the responses of T helper (Th) cells (7). In humans, the Tim family is composed of three members (Tim-1, Tim-3, and Tim-4). The genes that encode the Tim molecules are all located on chromosome 5q33.2 (8). All the Tim molecules contain an IgV domain, a mucin domain, a transmembrane domain, and an intracellular domain, which are considered to play critical roles in maintaining immune homeostasis (9). Tim-1 is preferentially expressed on Th2 cells, where it serves as an effective costimulatory molecule for T-cell activation (10). Tim-3 was first identified on Th1 cells (11). As an inhibitor of inflammatory Th1 cells, Tim-3 interacts with its ligand to promote the death of Th1 cells, thereby reducing the production of interferon-γ (IFN-γ). Tim-4 is mainly expressed on antigen-presenting cells. As a costimulatory molecule for T-cell activation, Tim-4 plays an important role in the activation and development of T cells (12), which can promote the development of Th2 cells and inhibit naive CD4+ T cells (13).
Tim family molecules are mainly involved in the regulation of T cells. Activated CD4+ T cells may differentiate into several subgroups of cells that perform different functions; these cell types include Th1, Th2, Th17 and regulatory T cells (Tregs) (14). The imbalances in Th-cell subsets and their cytokine production are thought to play essential roles in the pathogenesis of T1D (15).
Herein, we hypothesize that Tims (Tim-1, Tim-3, and Tim-4) may be involved in the pathogenesis of T1D. We evaluated the expression of Tims and T-cell subset-specific transcription factors in T1D patients to elucidate the role of Tim molecules in T1D.
Materials and methods
Subjects and clinical parameters
All the patients involved in this study were recruited from the Second Xiangya Hospital. The study included ninety T1D patients, thirty-six T2D patients and forty HCs. T1D was diagnosed based on the World Health Organization (WHO) criteria from 1999 (16): dependence on insulin therapy at disease onset; positive test results for at least one classic islet-specific autoantibody (glutamate acid decarboxylase antibody [GADA], zinc transporter 8 antibody [ZnT8A] or insulinoma-associated protein-2 antibody [IA-2A]), or insufficient C-peptide secretion. The diagnostic criteria for T2D were as follows: insulin resistance and insufficient insulin secretion; negative test results for any pancreatic islet autoantibodies; and no immediate need for insulin treatment. The exclusion criteria for the enrolment of HCs were inflammation and autoimmune diseases. The general demographic information and clinical parameters were obtained from hospital records. The details of all the subjects are summarized in Table 1.

Table 1 Clinical characteristics of all the study participants.
This study was approved by the Ethics Committee of Second Xiangya Hospital, Central South University, and informed consent was obtained from all the patients before the study.
Autoantibodies
GADA, IA-2A, and ZnT8A levels were measured by radiobinding assays (17, 18), which were validated by the Diabetes Antibody Standardization Program (International Association for the Study of Pain [IASP] 2012), and the cut-off values for positivity were 18 units/mL, 2.7 units/mL and 0.011 (ZnT8A index), respectively.
Isolation of RNA from PBMCs
Blood samples were collected from patients and HCs into heparin sodium tubes, and PBMCs were isolated by Ficoll-Paque density gradient centrifugation. TRIzol reagent (Invitrogen, Thermo Fisher Scientific, Shanghai, China) was used to harvest total RNA from the PBMCs, and the RNA concentration was quantified by measuring the ultraviolet absorbance at 260 nm. Equal amounts of RNA (1μg) were converted to complementary deoxyribonucleic acid (cDNA) with a Thermo Scientific RevertAid First-Strand cDNA Synthesis Kit (Thermo Scientific, Waltham, MA, USA) according to the manufacturer’s instructions.
Real-time quantitative reverse transcription-polymerase chain reaction (RT–qPCR)
The synthesized cDNAs were amplified with oligonucleotides specific for Tim molecules (Tim-1, Tim-3, and Tim-4), T box expressed in T cells (T-Bet), GATA binding protein 3 (GATA3), forkhead box protein 3 (FOXP3) and related orphan receptor C (RORC) with the SYBR Green kit (Yeasen Biotechnology, Shanghai, China). Quantitative real-time PCR was performed on an ABI PRISM Step One Sequence Detection System (Applied Biosystems, Carlsbad, CA, USA) with the following PCR protocol: in the two-step PCR method, predenaturation was performed by heating at 95°C for 20 seconds, followed by denaturation at 95°C for 1 second and then annealing and extension at 60°C for 20 seconds. The denaturation, annealing, and extension steps were repeated for 40 cycles. Amplification was performed in a total volume of 20 μl containing 2 μg of total cDNA, 0.4 μl of 10 nmol/L primer, 10 μl of SYBM Green mix and 7.2 μl of ddH2O. T-cell subset-specific transcription factors expression was measured relative to messenger RNA (mRNA) gene expression; the transcription factors associated with each T-cell subset were as follows: Th1=T-Bet, Th2=GATA3, Th17=RORC, and Treg=FOXP3. All the relative mRNA expression levels of the target genes were calculated as the fold change relative to the GAPDH mRNA expression levels (endogenous control) by using the 2-ΔΔCT method (19). All the primer sequences are listed in Table 2.
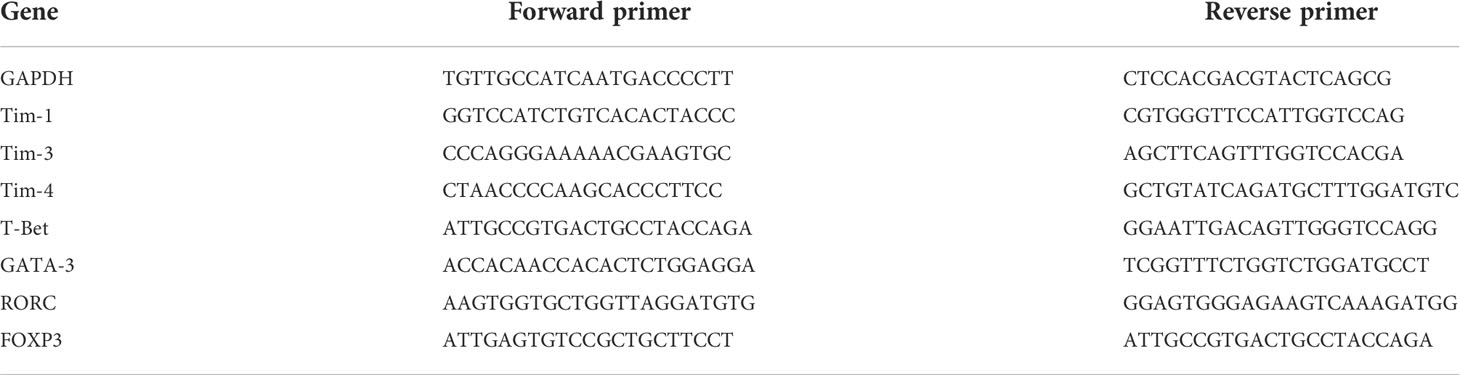
Table 2 Forward and reverse primers for the RT–PCR experiments in this study.
Flow cytometry analysis
To detect the expression of Tims in various T-cell subpopulations, PBMCs were surface stained with the following anti-human mAbs: CD3 Pacific Blue, CD4 FITC, CD8 PerCP-Cy5.5, Tim-1 PE and Tim-3 BB515 (BioLegend, San Diego, CA, USA). Dead cells were excluded from analysis by staining with the Fixable Viability Stain 780 (BD, Franklin lakes, NJ, USA) and analysed using FlowJo Software X (Tree Star, Ashland, OR, USA). The gating strategy used for T-cell subsets is shown in Figure S1.
Statistical analysis
The data are presented as the mean ± standard error unless otherwise stated. Multiple groups were compared by one-way analysis of variance (ANOVA) using the Statistical Package for the Social Sciences (SPSS) software version 18 (IBM Corp, Armonk, NY, USA). Correlations between mRNA expression and clinical parameters were analysed with Spearman’s or Pearson’s rank test, and P<0.05 was considered to indicate a significant difference.
Results
Demographic and clinical characteristics
The clinical characteristics of the subjects in each group are summarized in Table 1. There were no significant differences in sex among the three groups.
Differences in the mRNA expression levels of Tims and T-cell subset-specific transcription factors among T1D patients, T2D patients and HCs
We examined the Tim mRNA expression levels in T1D patients, T2D patients and HCs. As shown in Figure 1, compared to that in the HCs, the mRNA expression level of Tim-1 in the T1D patients was increased (0.81 ± 0.47 vs. 1.34 ± 1.01, P=0.0355), while the expression level of Tim-3 was decreased (1.55 ± 1.22 vs. 0.74 ± 0.41, P=0.0013). The mRNA expression levels of Tim-1 (1.89 ± 1.43 vs. 0.81 ± 0.47, P<0.0001) and Tim-4 (1.39 ± 1.02 vs. 0.84 ± 0.69, P=0.0454) in the T2D patients were significantly higher than those in the HCs. In addition, the expression level of Tim-3 in the T1D patients was significantly lower than that in the T2D patients (1.55 ± 1.22 vs. 1.96 ± 1.38, P<0.0001) (Figure 1A). We then explored the mRNA expression levels of T-cell subset-specific transcription factors. The results showed that the mRNA expression of RORC was elevated in the T1D patients compared to the HCs (1.18 ± 1.12 vs. 0.69 ± 1.05, P=0.0423), and the mRNA expression of T-bet (0.66 ± 0.40 vs. 1.53 ± 1.21, P=0.0001), GATA3 (0.93 ± 0.30 vs. 1.57 ± 0.91, P=0.0015) and RORC (0.69 ± 1.05 vs. 1.37 ± 1.52, P=0.0040) was increased in the T2D patients. Moreover, T-bet (1.53 ± 1.21 vs. 0.97 ± 0.49, P=0.0232) and GATA3 (1.57 ± 0.91 vs. 0.95 ± 0.59, P=0.0089) mRNA expression was decreased in the T1D patients compared to the T2D patients (Figure 1B).
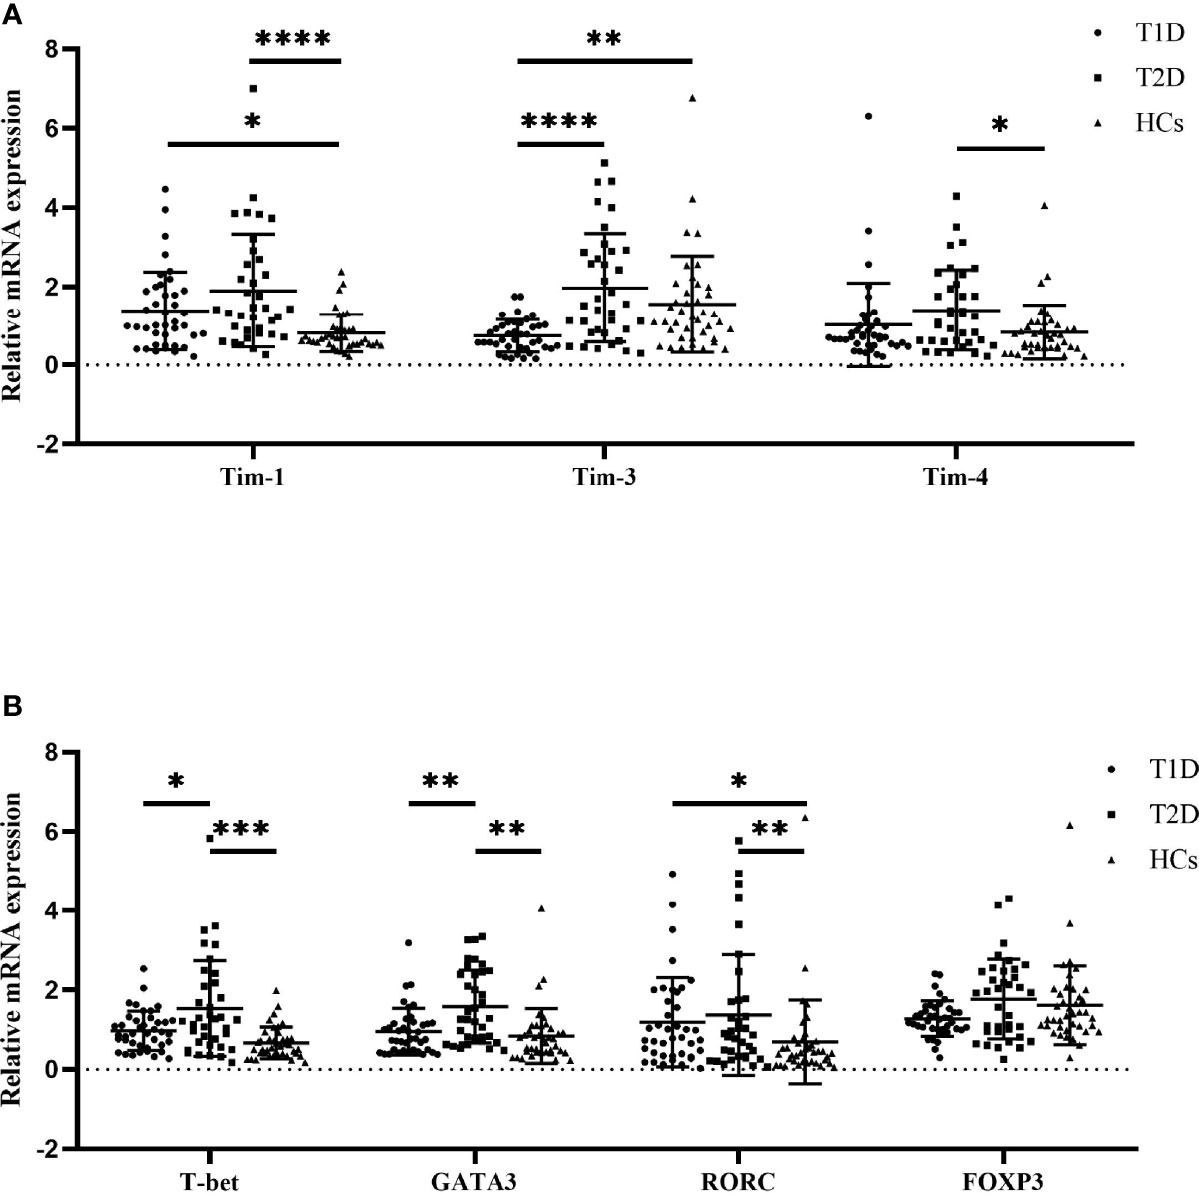
Figure 1 The mRNA expression levels among T1D patients (n=40), T2D patients (n=36) and HCs (n=40) as quantified by RT–qPCR. (A) Tims mRNA expression in PBMCs from T1D patients, T2D patients and HCs. (B) T-cell subset-specific transcription factor mRNA expression in PBMCs from T1D patients, T2D patients and HCs. The error bars represent the standard deviation of the mean. *P<0.05; **P<0.01; ***P<0.001; ****P<0.0001.
The balance of Tim molecules and T-cell subset-specific transcription factor expression among T1D patients, T2D patients and HCs
We also compared the balance of the expression of Tim molecules and T-cell subset-specific transcription factors in the diabetic patients and HCs. The results showed that the ratio of Tim-3 to Tim-1 expression in both the T1D (0.85 ± 0.89 vs. 2.13 ± 1.38, P<0.0001) and T2D patients (1.54 ± 1.48 vs. 2.13 ± 1.38, P=0.0387) was significantly lower than that in the HCs. In addition, the Tim-3 to Tim-1 expression ratio in the T1D patients was decreased compared to that in the T2D patients (0.85 ± 0.89 vs. 1.54 ± 1.48, P=0.0225) (Figure 2A). The T-Bet to GATA3 expression ratios of the T1D patients were increased compared to those of the HCs (0.78 ± 0.54 vs. 1.32 ± 0.88, P=0.0042). However, no statistically significant difference was observed between the T1D and T2D patients (Figure 2B). There was an elevated ratio of RORC to FOXP3 expression in the T1D patients compared with the HCs (0.45 ± 0.46 vs. 1.01 ± 1.05, P=0.0066). The ratio of RORC to FOXP3 expression in the T2D patients showed an increasing trend, but there was no significant difference between the T2D patients and HCs (P>0.05) (Figure 2C).
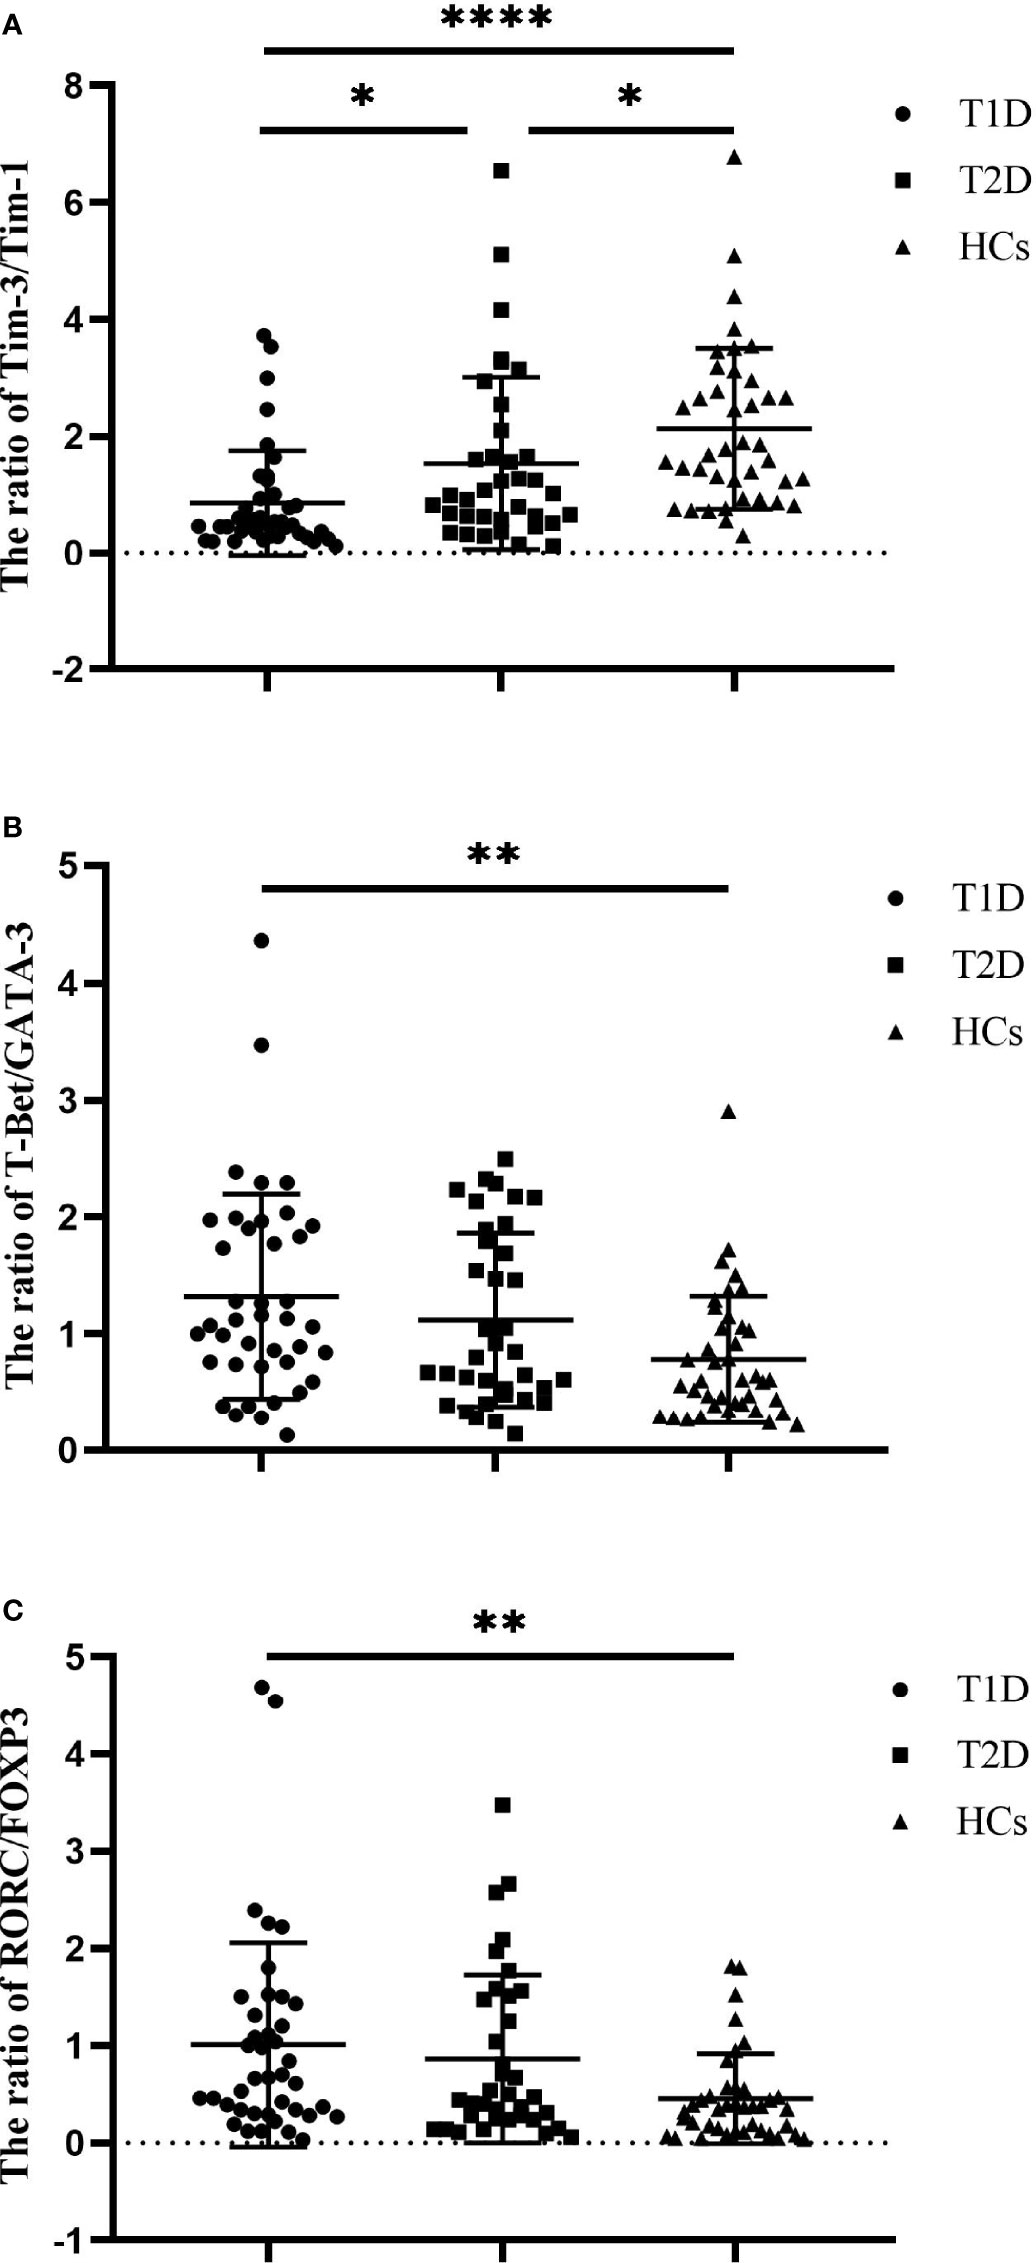
Figure 2 The ratios of Tim molecules and T-cell subset-specific transcription factor expression in T1D patients (n=40), T2D patients (n=36) and HCs (n=40). (A) The ratio of Tim-3 to Tim-1 expression in T1D patients, T2D patients and HCs. (B) The ratio of T-Bet to GATA3 expression in T1D patients, T2D patients and HCs. (C) The ratio of RORC to POXP3 expression in T1D patients, T2D patients and HCs. The error bars represent the standard deviation of the mean. *P<0.05; **P<0.01; ****P<0.0001.
The ratio of Tim molecules and T-cell subset-specific transcription factor expression in the T1D patient subgroups
To investigate the possible factors that influence the immune imbalance in T1D, We divided the T1D patients studied above into two subgroups based on their median FCP values. Nineteen T1D patients (10 males and 9 females) were defined as having preserved islet function, and their C-peptide values ranged from 102 to 365 pmol/L, with a median of 154 pmol/L. Twenty-one T1D patients (15 males and 6 females) were defined as having deficient islet function, and their C-peptide values ranged from 0 to 93 pmol/L, with a median of 55 pmol/L. We compared the expression ratios of Tim molecules and T-cell subset-specific transcription factors between these subgroups and HCs. The results show that compared with the HC group, the ratio of Tim-3/Tim-1 decreased in both the preserved islet function group (2.13 ± 1.38 vs. 0.98 ± 0.74, P=0.002) and the defective islet function group (2.13 ± 1.38 vs. 0.74 ± 0.76, P<0.0001) (Figure 3A). However, there was no significant difference between the two T1D subgroups (P>0.05). Second, the ratio of T-Bet/GATA3 expression was significantly increased in both T1D subgroups (0.78 ± 0.54 vs. 1.37 ± 1.10, P=0.014 and 0.78 ± 0.54 vs. 1.29 ± 0.63, P=0.039, respectively), and there was no significant difference between the two T1D subgroups (P>0.05) (Figure 3B). Finally, the RORC/FOXP3 ratio was reduced in the defective islet function group compared with the HC group (0.45 ± 0.46 vs. 1.24 ± 1.33, P=0.001). There was an increasing trend in the RORC/FOXP3 ratio in the preserved islet function group, but it did not reach statistical significance (P>0.05) (Figure 3C). The clinical characteristics of the T1D subgroups and HCs are shown in Table S1.
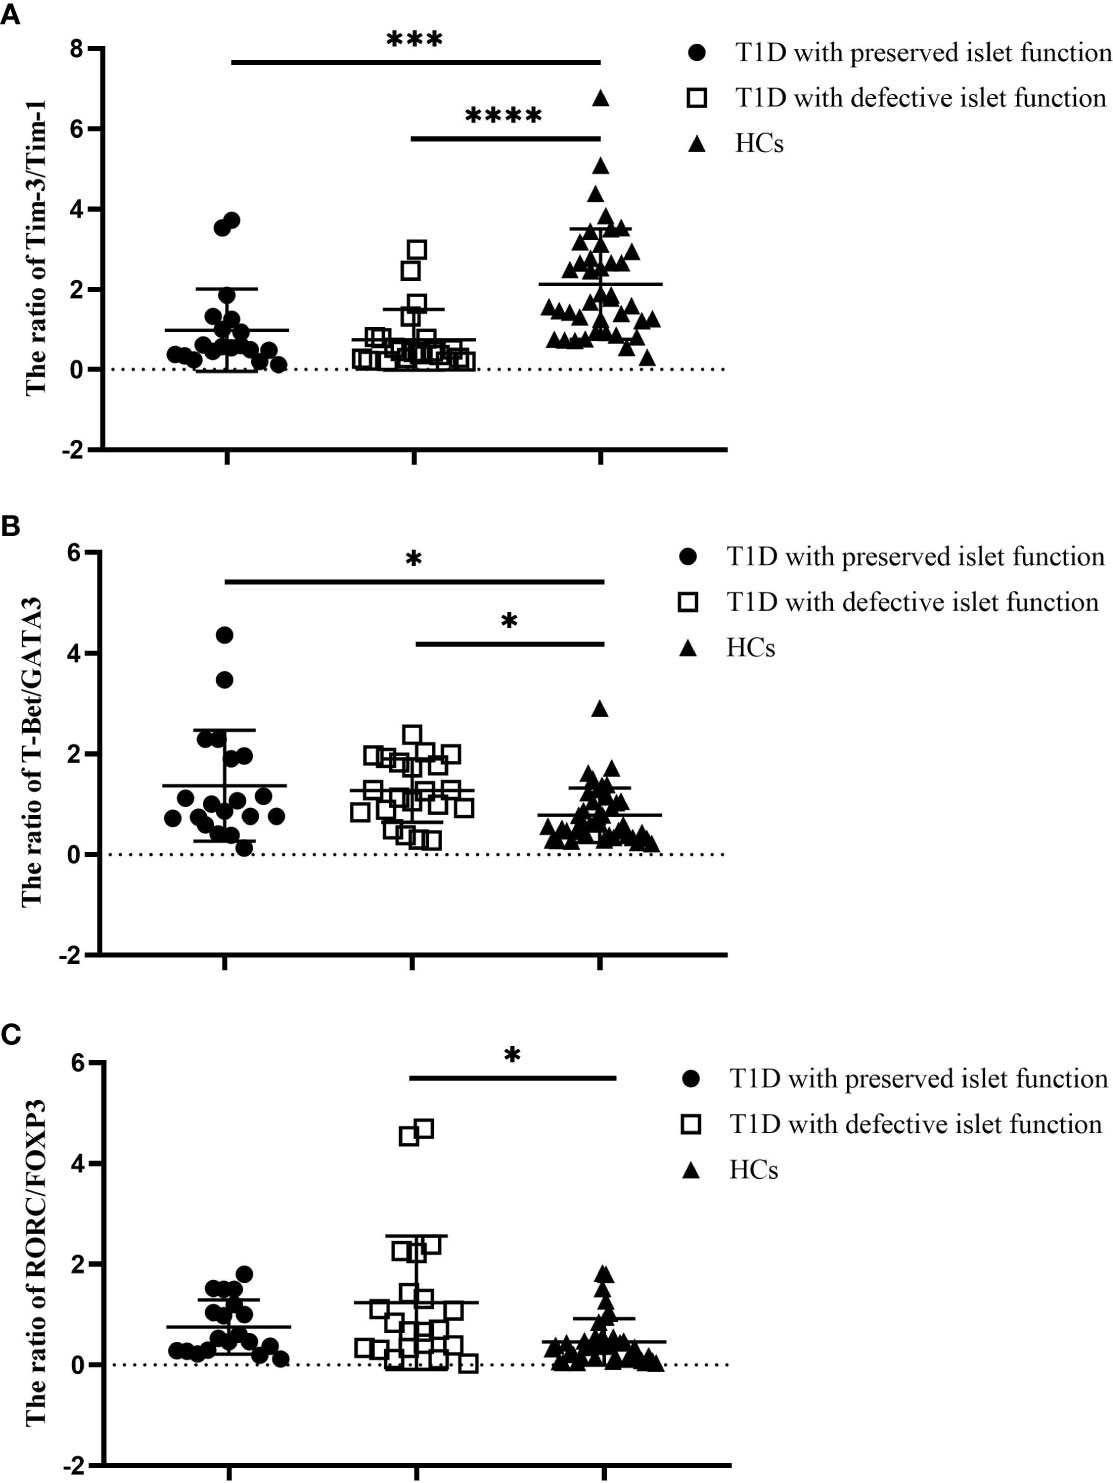
Figure 3 The ratios of Tim molecules and T-cell subset-specific transcription factor expression in the T1D subgroups (n=40) and HCs (n=40). (A) The ratio of Tim-3 to Tim-1 in different T1D subgroups and the HC group. (B) The ratio of T-Bet to GATA3 in different T1D patient subgroups and the HC group. (C) The ratio of RORC to POXP3 in different T1D subgroups and the HC group. Error bars represent the standard deviation of the mean. *P<0.05; ***P<0.001; ****P<0.0001.
Expression of Tim-1 and Tim-3 in T-cell subsets from T1D patients
We further analysed the expression of Tim-1 and Tim-3 in T-cell subsets from T1D patients (Figure 4A). The results showed no significant difference in Tim-1 levels on CD4+ T cells in T1D patients compared to CD8+ T cells (9.23 ± 5.19 vs. 10.52 ± 6.17, P=0.30) (Figure 4B). However, T1D patients had higher levels of Tim-3 on CD4+ T cells compared to those on CD8+ T cells (5.69 ± 2.10 vs. 4.22 ± 1.79, P=0.0003) (Figure 4C).
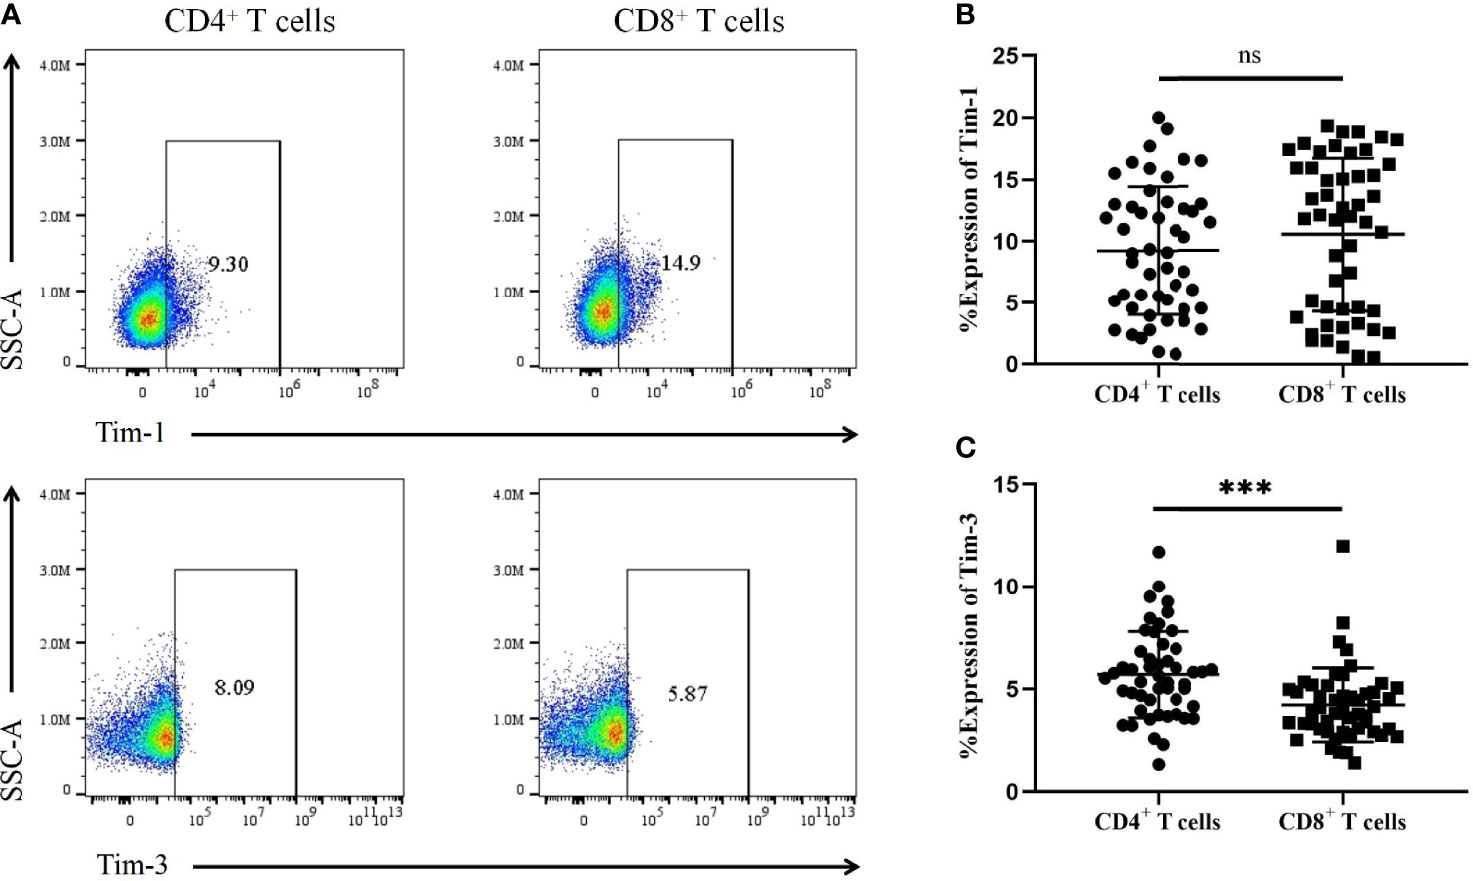
Figure 4 The expression of Tim-1 and Tim-3 in different T-cell subsets from T1D patients. (A) Representative plots showing the expression of Tim-1 and Tim-3 in different T-cell subsets. (B) The expression of Tim-1 on CD4+ and CD8+ T cells in T1D patients. (C) The expression of Tim-3 in CD4+ and CD8+ T cells in T1D patients. ns, no statistical difference; ***P<0.001.
Tim-1 and Tim-3 expression in T-cell subsets from T1D and T1D in the remission phase
We next compared the altered Tim-1 and Tim-3 expression in T1D and T1D in the remission phase. According to the preserved β-cell function, stimulated C-peptide above 300 pmol/L was defined as T1D in the remission phase, which is characterized by satisfactory glycaemic control and temporary recovery of islet β cells (20, 21). Our results showed that there was no significant difference in the expression of Tim-1 on CD4+ T cells between the two groups of T1D patients (7.56 ± 4.54 vs. 10.34 ± 5.37, P=0.063) (Figure 5A), whereas Tim-3 expression on CD4+ T cells from T1D in the remission phase was higher compared with T1D patients (6.43 ± 2.31 vs. 5.20 ± 1.82, P=0.043) (Figure 5B). In addition, there was no statistical difference in Tim-1 or Tim-3 expression in CD8+ T cells between both T1D patient groups (P>0.05 for both) (Figures 5C, D). The clinical characteristics of patients with T1D in both groups are summarized in Table S2.
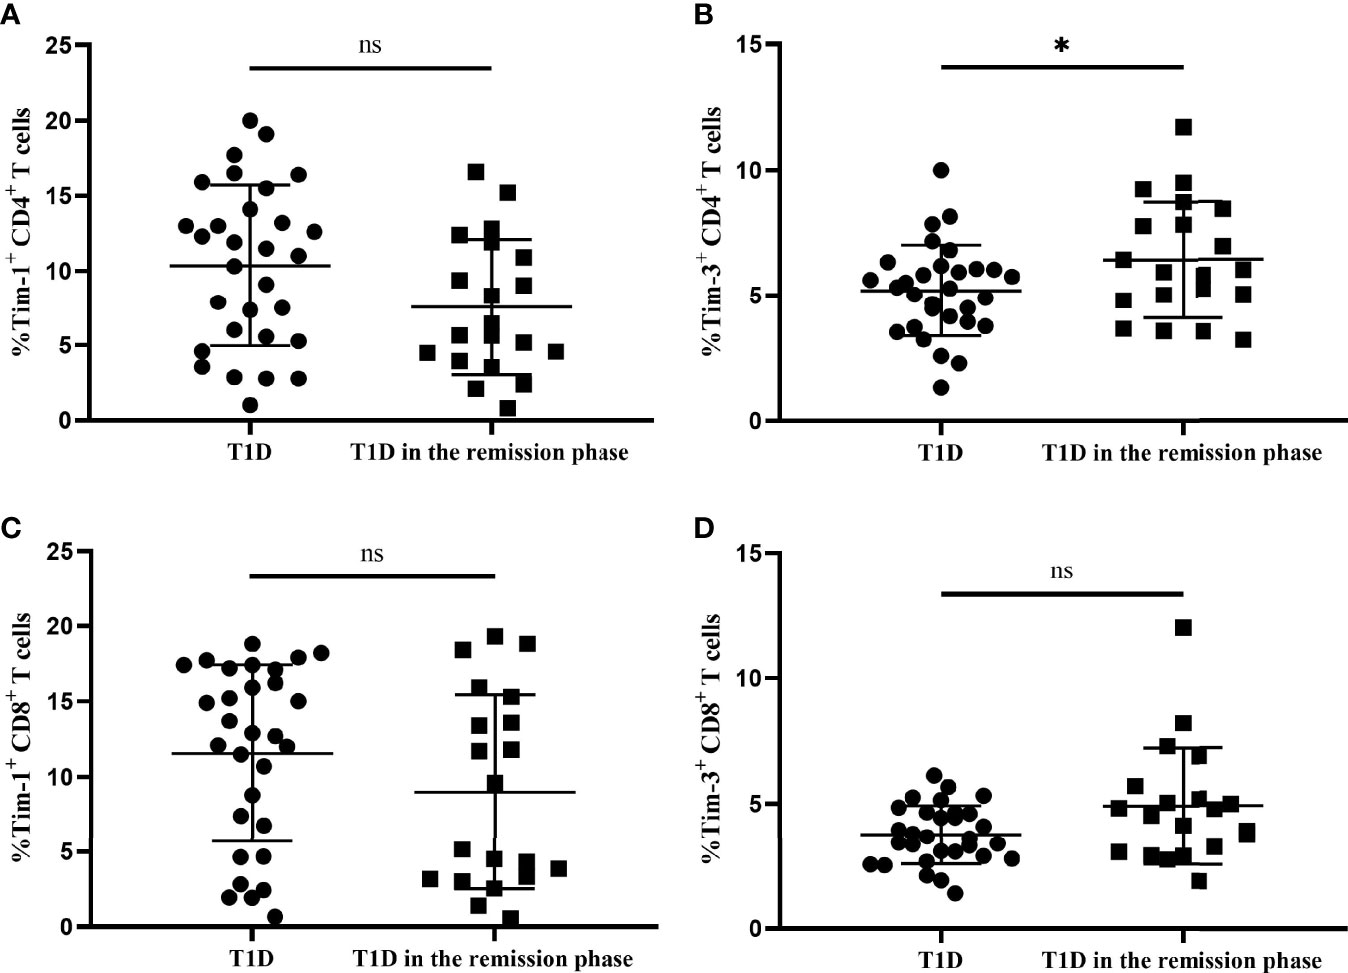
Figure 5 The Tim-1 and Tim-3 expression in T-cell subsets from T1D and T1D in the remission phase. (A) Alterations in the expression of Tim-1+ CD4+ T cells from T1D in the remission phase compared with T1D. (B) Alterations in the expression of Tim-3+ CD4+ T cells from T1D in the remission phase compared with T1D. (C) Alterations in the expression of Tim-1+ CD8+ T cells from T1D in the remission phase compared with T1D. (D) Alterations in the expression of Tim-3+ CD8+ T cells from T1D in the remission phase compared with T1D. ns, no statistical difference; *P<0.05.
The Tim-3 to Tim-1 ratio from T1D and T1D in the remission phase
We finally explored the balance of Tim molecules on the different T-cell subsets from T1D and T1D in the remission phase. As is shown in Figure 6, the Tim-3 to Tim-1 ratio on CD4+ T cells from T1D in the remission phase was significantly increased compared to that in T1D (1.39 ± 1.43 vs. 0.92 ± 1.28, P=0.0087) (Figure 6A), while the ratio of Tim-3 to Tim-1 on CD8+ T cells was also increased in T1D during remission (1.10 ± 1.17 vs. 0.67 ± 1.06, P=0.0292) (Figure 6B).
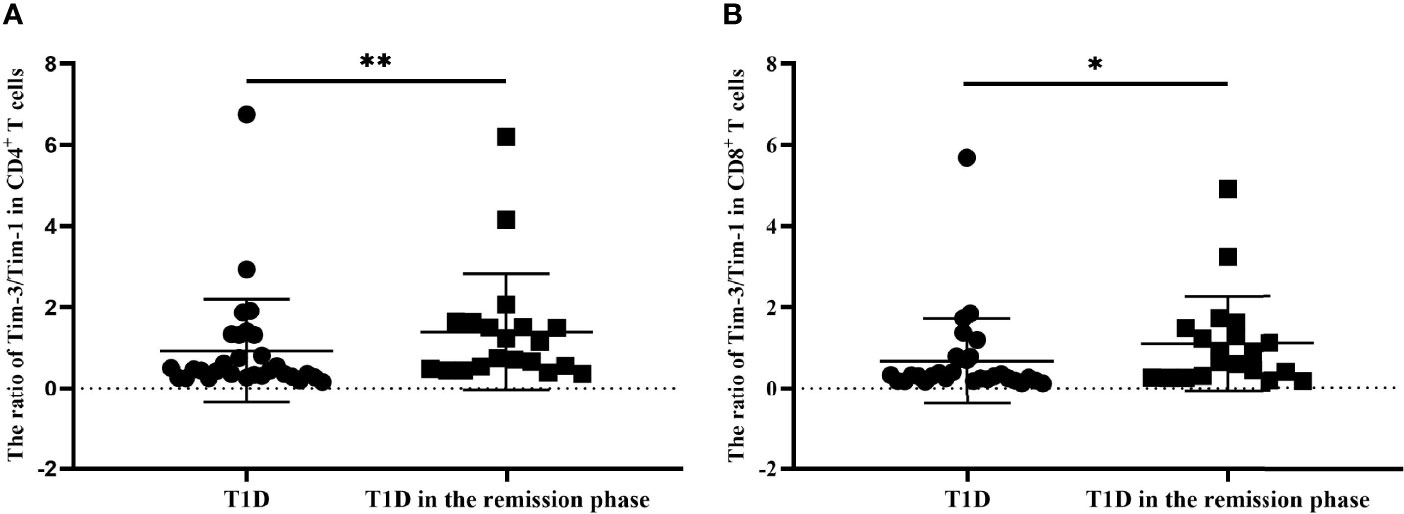
Figure 6 The ratio of Tim-3 to Tim-1 in different T-cell subsets form T1D and T1D in the remission phase. (A) The ratio of Tim-3 to Tim-1 in CD4+ T cells from T1D and T1D in the remission phase. (B) The ratio of Tim-3 to Tim-1 in CD8+ T cells from T1D and T1D in the remission phase. *P<0.05.;**P<0.01.
Discussion
Tim family molecules are involved in the regulation of the immune response, and they mainly regulate the proliferation of T cells (22). Currently, the pattern of Tim molecule expression in T1D patients is unknown. In our study, Tim and T-cell subset-specific transcription factor mRNA expression levels were altered in T1D and T2D patients compared with HCs. Imbalanced ratios of Tim-3/Tim-1, Th1/Th2 and Th17/Treg expression were identified in T1D patients. The imbalance in the ratio was more pronounced in T1D patients with defective islet function. Moreover, Tim-3 was mainly expressed on CD4+ T cells, and the expression of Tim-3+ CD4+ T cells in T1D in the remission phase was higher compared to that in T1D. In addition, there were differences in the ratio of Tim-3 to Tim-1 between T1D and T1D in the remission phase, suggesting that Tim molecules plays a role in the occurrence of T1D.
Wang et al. reported that Tim-1 expression was increased in SLE patients, especially in patients with active disease, indicating that Tim-1 expression may contribute to the degree of disease activity (23). Our published research found a decrease in Tim-1 expression in Breg cells in T1D patients (24). Another study showed that the frequency of Tim-1+ Tregs in both T1D patients and nonobese diabetic (NOD) mice was significantly decreased (25). Interestingly, Tim-1 mRNA expression was increased in the PBMCs from both T1D and T2D patients in this study. These discrepancies might result from the different patterns of Tim-1 expression in distinct cell types; PBMCs are heterogeneous, with the highest proportion of T cells, and Tim-1 plays an important role in T-cell activation (26). Unlike Tim-1, Tim-3 suppresses the Th1 immune response (27). We also examined Tim-3 expression in different T-cell subsets and found that Tim-3 was mainly expressed in CD4+ T cells. Interestingly, the frequency of Tim-3+ CD4+ T-cell expression was higher in T1D in the remission phase than in T1D. In general, CD8+ T cells primarily infiltrate islets in T1D, but their maturation and proliferation may require the promotion of CD4+ T cells (28). The reduced expression of Tim-3 in T1D patients indicates inadequate immune regulation, which may contribute to the pathogenesis of T1D. With respect to Tim-4, Zhao et al. found that the expression of Tim-4 in T2D patients was higher than that in healthy control, which is consistent with our findings (29). Although Tim-4 expression exhibited an increased trend in T1D patients, it is not statistically different compared with HCs.
The Th1/Th2 and Th17/Treg imbalance has been reported to be involved in the pathogenesis and progression of autoimmune diseases, including RA, MS and SLE (30–32). In this study, we evaluated the ratios of T-cell-specific transcription factor mRNA expression in all participants. As expected, we observed a significantly increased ratio of T-bet to GATA3 expression in T1D patients compared to HCs. In addition, the ratio of RORC to FOXP3 expression in T1D patients was also significantly higher than that in HCs. Our study suggested that T1D patients, especially those with defective islet function, exhibit an obvious imbalance in the RORC to FOXP3 ratio. However, the ratios of T-bet/GATA3 and RORC/FOXP3 in T2D patients were not significantly different compared with those of HCs, This discrepancy may be explained by the fact that the pathogeneses of these two types of diabetes are not quite consistent: T1D pathogenesis is mainly caused by immune imbalance, whereas T2D is a disease mediated by metabolic disorders (33).Notably, in a published study, Tim-3 on CD4+ T cells was negatively associated with Th1/Th2 imbalance: blockade of Tim-3 enhanced the production of Th1 responses such as IFN-γ and TNF-α, while it decreased Th2 responses (34). This finding suggests that Tim-3 expression in T1D patients may affect the Th1/Th2 balance and participate in the progression of T1D.
A relationship between Tim-3 and Tim-1 has been reported in autoimmune diseases (35, 36). Tim-1 is mainly expressed in Th2 cells and regulates the activation of T cells. In contrast, Tim-3 mainly inhibits Th1 cells thus acting as an anti-inflammatory molecule. The ratio of Tim-3 to Tim-1 expression was also investigated in the present study. We observed that the Tim-3 to Tim-1 ratio in PBMCs from T1D patients was significantly decreased, and this decrease was especially notable in the defective islet function group. In addition, the ratio of Tim-3 to Tim-1 in different T-cell subsets was increased in T1D in the remission phase compared with T1D, indicating an imbalance between pro- and anti-inflammatory properties in T1D patients. Hence, improving the balance between Tim-1 and Tim-3 might be a potential therapeutic approach for T1D.
There are several limitations of our study. First, some of the diabetes patients included had a long disease duration. Therefore, these results may be affected by factors specific to the included population and the medications used for treatment. Moreover, this study was a cross-sectional study without medical follow-up. Collectively, our study suggests that the expression of Tim family molecules is altered and may be involved in the pathogenesis of T1D.
Data availability statement
The raw data supporting the conclusions of this article will be made available by the authors, without undue reservation.
Ethics statement
The studies involving human participants were reviewed and approved by Ethics Committee of Second Xiangya Hospital, Central South University. The patients/participants provided their written informed consent to participate in this study. Written informed consent was obtained from the individual(s) for the publication of any potentially identifiable images or data included in this article.
Author contributions
YL searched the references, wrote the first draft of the paper and revised the text. ZC and YX critically revised the text and provided substantial scientific contributions. ZZ and HC proposed the project and revised the manuscript. All the authors approved the final version of the manuscript.
Funding
This study was supported by the National Key Research and Development Project (2018YFE0114500), National Science Foundation of China (81820108007, 81970746 and 31571244), Hunan Provincial Natural Sciences Foundation (2022JJ30797) and the Natural Science Foundation of China (82000748).
Conflict of interest
The authors declare that the research was conducted in the absence of any commercial or financial relationships that could be construed as a potential conflict of interest.
Publisher’s note
All claims expressed in this article are solely those of the authors and do not necessarily represent those of their affiliated organizations, or those of the publisher, the editors and the reviewers. Any product that may be evaluated in this article, or claim that may be made by its manufacturer, is not guaranteed or endorsed by the publisher.
Supplementary material
The Supplementary Material for this article can be found online at: https://www.frontiersin.org/articles/10.3389/fendo.2022.937109/full#supplementary-material
Supplementary Figure 1 | Representative plots and gating strategy for T-cell subsets from the flow cytometry analysis. (A) T-cell subsets were sequentially gated on lymphocytes, single cells, live cells and CD3+ T cells, and the expression of CD4 and CD8 markers on CD3+ T cells was further analysed. FSC-A, forward scatter area; FSC-H, forward scatter height; SSC-A, side scatter area.
Supplementary Table 1 | Clinical characteristics of the T1D subgroups and the HC group. The data are expressed as the mean ± standard deviation or as the median of the 25th-75th percentile in parentheses. NA: not applicable. ##P<0.01, compared with T1D with defective islet function. ####P<0.0001, compared with T1D with defective islet function. **P<0.01, compared with HCs. ***P<0.001, compared with HCs. ****P<0.0001, compared with HCs.
Supplementary Table 2 | Clinical characteristics of T1D and T1D in the remission phase. The data are expressed as the mean ± standard deviation or as the median of the 25th-75th percentile in parentheses. **P<0.01, compared with T1D in the remission phase. ***P<0.001, compared with T1D in the remission phase.
References
2. Harding JL, Wander PL, Zhang X, Li X, Karuranga S, Chen H, et al. The incidence of adult-onset type 1 diabetes: A systematic review from 32 countries and regions. Diabetes Care (2022) 45(4):994–1006. doi: 10.2337/dc21-1752
3. Sun H, Saeedi P, Karuranga S, Pinkepank M, Ogurtsova K, Duncan BB, et al. IDF diabetes atlas: Global, regional and country-level diabetes prevalence estimates for 2021 and projections for 2045. Diabetes Res Clin Pract (2022) 183:109119. doi: 10.1016/j.diabres.2021.109119
4. Bluestone JA, Buckner JH, Herold KC. Immunotherapy: Building a bridge to a cure for type 1 diabetes. Sci (New York NY) (2021) 373(6554):510–6. doi: 10.1126/science.abh1654
5. Bakay M, Pandey R, Grant SFA, Hakonarson H. The genetic contribution to type 1 diabetes. Curr Diabetes Rep (2019) 19(11):116. doi: 10.1007/s11892-019-1235-1
6. Meyers JH, Sabatos CA, Chakravarti S, Kuchroo VK. The TIM gene family regulates autoimmune and allergic diseases. Trends Mol Med (2005) 11(8):362–9. doi: 10.1016/j.molmed.2005.06.008
7. Kuchroo VK, Dardalhon V, Xiao S, Anderson AC. New roles for TIM family members in immune regulation. Nat Rev Immunol (2008) 8(8):577–80. doi: 10.1038/nri2366
8. Kuchroo VK, Umetsu DT, DeKruyff RH, Freeman GJ. The TIM gene family: Emerging roles in immunity and disease. Nat Rev Immunol (2003) 3(6):454–62. doi: 10.1038/nri1111
9. Kane LP. TIM family proteins and autoimmunity. Autoimmunity (2007) 40(6):405–8. doi: 10.1080/08916930701464871
10. Umetsu SE, Lee WL, McIntire JJ, Downey L, Sanjanwala B, Akbari O, et al. TIM-1 induces T cell activation and inhibits the development of peripheral tolerance. Nat Immunol (2005) 6(5):447–54. doi: 10.1038/ni1186
11. Li CR, Mueller EE, Bradley LM. Islet antigen-specific Th17 cells can induce TNF-α-Dependent autoimmune diabetes. J Immunol (2014) 192(4):1425–32. doi: 10.4049/jimmunol.1301742
12. Mizui M, Shikina T, Arase H, Suzuki K, Yasui T, Rennert PD, et al. Bimodal regulation of T cell-mediated immune responses by TIM-4. Int Immunol (2008) 20(5):695–708. doi: 10.1093/intimm/dxn029
13. Liu W, Xu L, Liang X, Liu X, Zhao Y, Ma C, et al. Tim-4 in health and disease: Friend or foe? Front Immunol (2020) 11:537. doi: 10.3389/fimmu.2020.00537
14. Saravia J, Chapman NM, Chi H. Helper T cell differentiation. Cell Mol Immunol (2019) 16(7):634–43. doi: 10.1038/s41423-019-0220-6
15. Walker LS, von Herrath M. CD4 T cell differentiation in type 1 diabetes. Clin Exp Immunol (2016) 183(1):16–29. doi: 10.1111/cei.12672
16. Alberti KG, Zimmet PZ. Definition, diagnosis and classification of diabetes mellitus and its complications. part 1: Diagnosis and classification of diabetes mellitus provisional report of a WHO consultation. Diabetes Med (1998) 15(7):539–53. doi: 10.1002(SICI)1096-9136(199807)15:7<539::AID-DIA668>3.0.CO;2-S
17. Regnell SE, Lernmark Å. Early prediction of autoimmune (Type 1) diabetes. Diabetologia (2017) 60(8):1370–81. doi: 10.1007/s00125-017-4308-1
18. Huang G, Xiang Y, Pan L, Li X, Luo S, Zhou Z. Zinc transporter 8 autoantibody (ZnT8A) could help differentiate latent autoimmune diabetes in adults (LADA) from phenotypic type 2 diabetes mellitus. Diabetes/Metab Res Rev (2013) 29(5):363–8. doi: 10.1002/dmrr.2396
19. Livak KJ, Schmittgen TD. Analysis of relative gene expression data using real-time quantitative PCR and the 2(-delta delta C(T)) method. Methods (San Diego Calif) (2001) 25(4):402–8. doi: 10.1006/meth.2001.1262
20. Mortensen HB, Hougaard P, Swift P, Hansen L, Holl RW, Hoey H, et al. New definition for the partial remission period in children and adolescents with type 1 diabetes. Diabetes Care (2009) 32(8):1384–90. doi: 10.2337/dc08-1987
21. Zhong T, Tang R, Gong S, Li J, Li X, Zhou Z. The remission phase in type 1 diabetes: Changing epidemiology, definitions, and emerging immuno-metabolic mechanisms. Diabetes/Metab Res Rev (2020) 36(2):e3207. doi: 10.1002/dmrr.3207
22. Liu Y, Chen H, Chen Z, Qiu J, Pang H, Zhou Z. Novel roles of the Tim family in immune regulation and autoimmune diseases. Front Immunol (2021) 12:748787. doi: 10.3389/fimmu.2021.748787
23. Wang Y, Meng J, Wang X, Liu S, Shu Q, Gao L, et al. Expression of human TIM-1 and TIM-3 on lymphocytes from systemic lupus erythematosus patients. Scand J Immunol (2008) 67(1):63–70. doi: 10.1111/j.1365-3083.2007.02038.x
24. Liu Y, Chen Z, Qiu J, Chen H, Zhou Z. Altered Tim-1 and IL-10 expression in regulatory b cell subsets in type 1 diabetes. Front Immunol (2021) 12. doi: 10.3389/fimmu.2021.773896
25. Guo H, Shen Y, Kong YH, Li S, Jiang R, Liu C, et al. The expression of Tim-1 and Tim-4 molecules in regulatory T cells in type 1 diabetes. Endocrine (2020) 68(1):64–70. doi: 10.1007/s12020-019-02173-8
26. Meyers JH, Chakravarti S, Schlesinger D, Illes Z, Waldner H, Umetsu SE, et al. TIM-4 is the ligand for TIM-1, and the TIM-1-TIM-4 interaction regulates T cell proliferation. Nat Immunol (2005) 6(5):455–64. doi: 10.1038/ni1185
27. Zhao L, Cheng S, Fan L, Zhang B, Xu S. TIM-3: An update on immunotherapy. Int Immunopharmacol (2021) 99:107933. doi: 10.1016/j.intimp.2021.107933
28. Gomez-Tourino I, Arif S, Eichmann M, Peakman M. T Cells in type 1 diabetes: Instructors, regulators and effectors: A comprehensive review. J Autoimmun (2016) 66:7–16. doi: 10.1016/j.jaut.2015.08.012
29. Zhao P, Wang H, Li T, Lei C, Xu X, Wang W, et al. Increased T cell immunoglobulin and mucin domain containing 4 (TIM-4) is negatively correlated with serum concentrations of interleukin-1β in type 2 diabetes. J Diabetes (2016) 8(2):199–205. doi: 10.1111/1753-0407.12276
30. Zhao CN, Xu Z, Wu GC, Mao YM, Liu LN, Qian W, et al. Emerging role of air pollution in autoimmune diseases. Autoimmun Rev (2019) 18(6):607–14. doi: 10.1016/j.autrev.2018.12.010
31. Shan J, Jin H, Xu Y. T Cell metabolism: A new perspective on Th17/Treg cell imbalance in systemic lupus erythematosus. Front Immunol (2020) 11:1027. doi: 10.3389/fimmu.2020.01027
32. Paradowska-Gorycka A, Wajda A, Romanowska-Próchnicka K, Walczuk E, Kuca-Warnawin E, Kmiolek T, et al. Th17/Treg-related transcriptional factor expression and cytokine profile in patients with rheumatoid arthritis. Front Immunol (2020) 11:572858. doi: 10.3389/fimmu.2020.572858
33. Eizirik DL, Pasquali L, Cnop M. Pancreatic β-cells in type 1 and type 2 diabetes mellitus: Different pathways to failure. Nat Rev Endocrinol (2020) 16(7):349–62. doi: 10.1038/s41574-020-0355-7
34. Tang F, Wang F, An L, Wang X. Upregulation of Tim-3 on CD4(+) T cells is associated with Th1/Th2 imbalance in patients with allergic asthma. Int J Clin Exp Med (2015) 8(3):3809–16.
35. Khademi M, Illés Z, Gielen AW, Marta M, Takazawa N, Baecher-Allan C, et al. T Cell ig- and mucin-Domain-Containing molecule-3 (TIM-3) and TIM-1 molecules are differentially expressed on human Th1 and Th2 cells and in cerebrospinal fluid-derived mononuclear cells in multiple sclerosis. J Immunol (2004) 172(11):7169–76. doi: 10.4049/jimmunol.172.11.7169
Keywords: Tim-1, Tim-3, Tim-4, type 1 diabetes, T cell subset-specific transcription factors
Citation: Liu Y, Chen Z, Xiao Y, Chen H and Zhou Z (2022) Altered expression of Tim family molecules and an imbalanced ratio of Tim-3 to Tim-1 expression in patients with type 1 diabetes. Front. Endocrinol. 13:937109. doi: 10.3389/fendo.2022.937109
Received: 05 May 2022; Accepted: 27 June 2022;
Published: 28 July 2022.
Edited by:
Yanshan Dai, Bristol Myers Squibb, United StatesReviewed by:
Yinan Jiang, University of Pittsburgh, United StatesBo Liu, Institut Pasteur of Shanghai (CAS), China
Copyright © 2022 Liu, Chen, Xiao, Chen and Zhou. This is an open-access article distributed under the terms of the Creative Commons Attribution License (CC BY). The use, distribution or reproduction in other forums is permitted, provided the original author(s) and the copyright owner(s) are credited and that the original publication in this journal is cited, in accordance with accepted academic practice. No use, distribution or reproduction is permitted which does not comply with these terms.
*Correspondence: Zhiguang Zhou, emhvdXpoaWd1YW5nQGNzdS5lZHUuY24=; Hongzhi Chen, Y2hlbmhvbmd6aGkyMDEzQGNzdS5lZHUuY24=