 Andraž Stožer1
 Marko Šterk1,2
 Eva Paradiž Leitgeb1
 Rene Markovič2,3
 Maša Skelin Klemen1Cara E. Ellis4
 Lidija Križančić Bombek1
 Jurij Dolenšek1,2Patrick E. MacDonald4
 Marko Gosak1,2*
- 1Institute of Physiology, Faculty of Medicine, University of Maribor, Maribor, Slovenia
- 2Department of Physics, Faculty of Natural Sciences and Mathematics, University of Maribor, Maribor, Slovenia
- 3Institute of Mathematics and Physics, Faculty of Electrical Engineering and Computer Science, University of Maribor, Maribor, Slovenia
- 4Department of Pharmacology and Alberta Diabetes Institute, University of Alberta, Edmonton, AB, Canada
Islets of Langerhans are multicellular microorgans located in the pancreas that play a central role in whole-body energy homeostasis. Through secretion of insulin and other hormones they regulate postprandial storage and interprandial usage of energy-rich nutrients. In these clusters of hormone-secreting endocrine cells, intricate cell-cell communication is essential for proper function. Electrical coupling between the insulin-secreting beta cells through gap junctions composed of connexin36 is particularly important, as it provides the required, most important, basis for coordinated responses of the beta cell population. The increasing evidence that gap-junctional communication and its modulation are vital to well-regulated secretion of insulin has stimulated immense interest in how subpopulations of heterogeneous beta cells are functionally arranged throughout the islets and how they mediate intercellular signals. In the last decade, several novel techniques have been proposed to assess cooperation between cells in islets, including the prosperous combination of multicellular imaging and network science. In the present contribution, we review recent advances related to the application of complex network approaches to uncover the functional connectivity patterns among cells within the islets. We first provide an accessible introduction to the basic principles of network theory, enumerating the measures characterizing the intercellular interactions and quantifying the functional integration and segregation of a multicellular system. Then we describe methodological approaches to construct functional beta cell networks, point out possible pitfalls, and specify the functional implications of beta cell network examinations. We continue by highlighting the recent findings obtained through advanced multicellular imaging techniques supported by network-based analyses, giving special emphasis to the current developments in both mouse and human islets, as well as outlining challenges offered by the multilayer network formalism in exploring the collective activity of islet cell populations. Finally, we emphasize that the combination of these imaging techniques and network-based analyses does not only represent an innovative concept that can be used to describe and interpret the physiology of islets, but also provides fertile ground for delineating normal from pathological function and for quantifying the changes in islet communication networks associated with the development of diabetes mellitus.
Introduction
From Isles of Königsberg to Network Science
Graph theory has its roots in the 18th century. In 1735, Leonhard Euler became interested in a then popular brainteaser of Königsberg, today’s Kaliningrad. Kaliningrad´s center was built on four land masses, two isles on the river Pregel and two riverbanks. At that time, they were connected by seven bridges (Figure 1A). The problem was to cross all seven bridges in a continuous stroll, crossing each bridge exactly once. To solve the problem, Euler redrew the geographical situation of the city by constructing a graph with the land masses being represented as four nodes and the bridges being represented as seven links between them (Figure 1B). Euler analyzed the possibility of walking through a graph (city) using each edge (bridge) only once by considering the degree (number of edges connecting to each isle) of the vertices (isles). A path in a graph, which contains each edge only once, is called an Euler’s path. He realized that for such a walk to be feasible, there must be none or exactly two nodes with an odd number of links attached to them since any walker must both enter and leave all nodes, except the ones where the walk begins and ends1. All four nodes possessed an odd number of links; thus, the proposed walk was impossible (1). Interestingly, due to bombing, reconstruction, and construction of new bridges, today, there are altogether 9 bridges, one node has 3 links, two have 4 links, and the fourth has 7 links (Figure 1C). Therefore, a modern walk is possible in theory, but it must start on one and end on the other isle, making it hardly feasible in practice (Figure 1C). By solving the brainteaser in this way, Euler laid the foundation of graph theory and showed that functional implications of a particular structure can be understood and even predicted without working out all particularities.
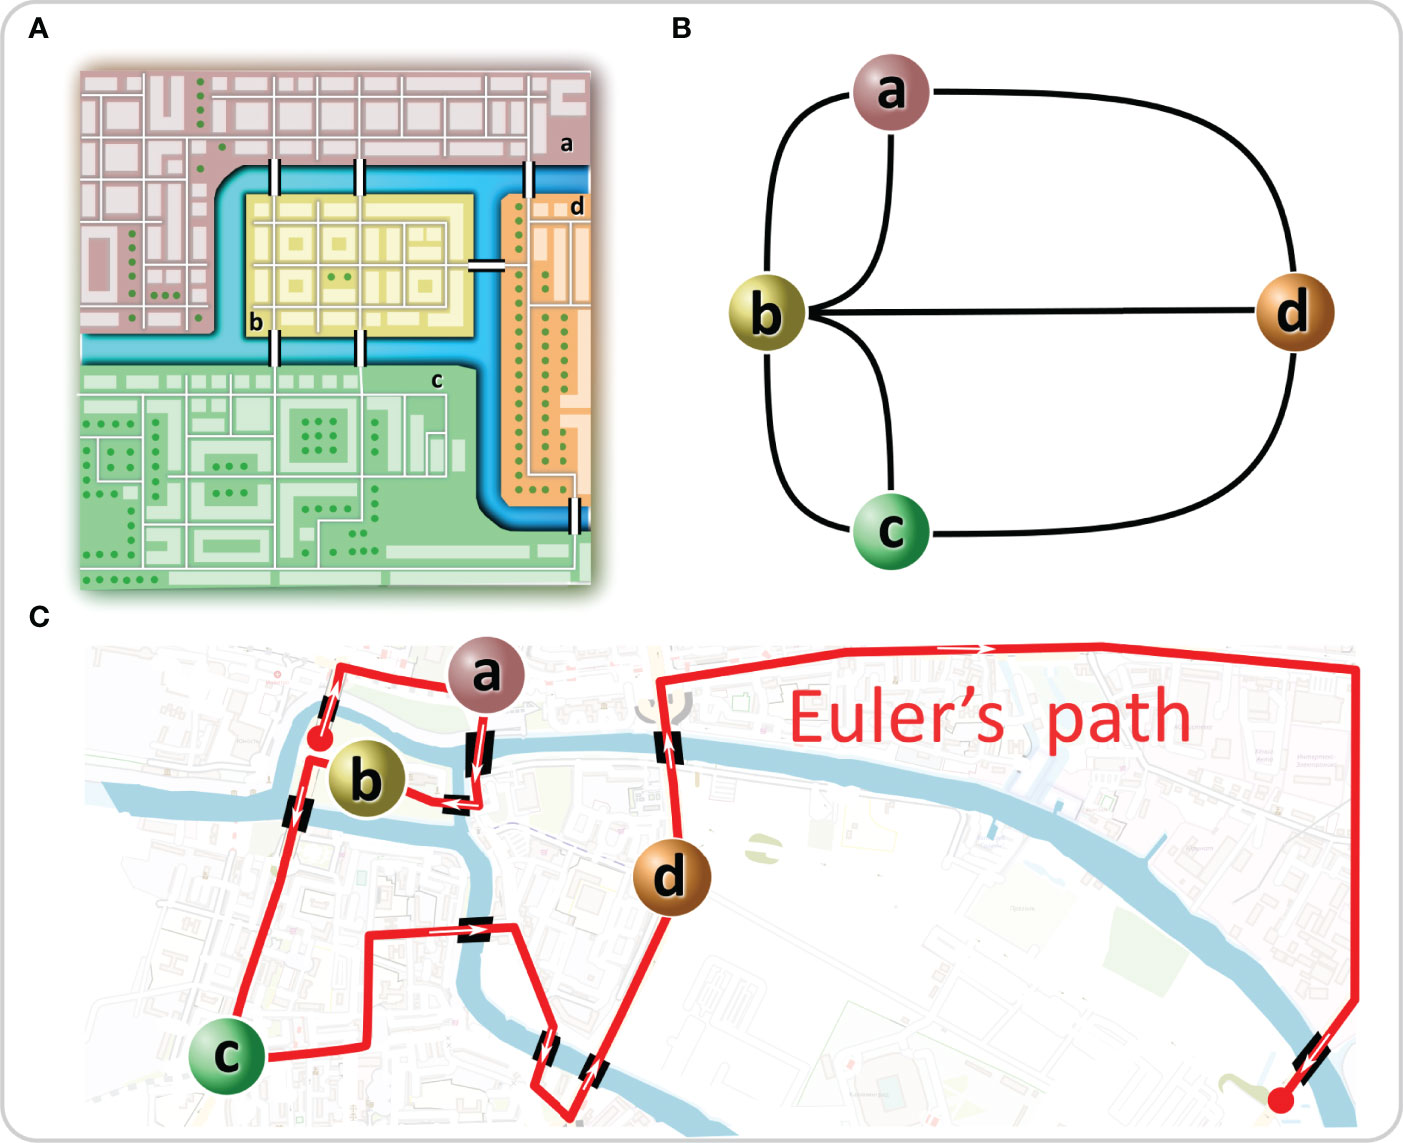
Figure 1 The “Königsberg bridge problem” as a graph. (A) In Euler’s time, one part of Königsberg (a) was connected with two bridges to the smaller isle (b) in the Pregel River and with one bridge to the larger isle (d). The same was true for the other part of the city (c). The problem was to create a path that would cross each bridge only once. (B) Euler solved the problem by representing the system as a graph in which the isles were represented as nodes and the bridges as links between them. (C) Euler´s path is shown on the current map of Kaliningrad.
Since its beginning, graph theory has occupied a place at the ‘pure’ end of pure mathematics. However, during the last century, analyses of social networks started gaining prominence apart from the developments in the field of mathematical graph theory (2, 3). These advances, along with a data deluge at the turn of the 21st century, have led to the birth of a new interdisciplinary field that has come to be known as network science (4, 5). This inherently multidisciplinary new discipline branch of study is now established as a backbone for describing various natural, social, and technological systems. It has catalyzed one of the most striking discoveries in complex systems research, i.e., that interactions of real-world networks follow some universal features. In a seminal paper (6), Watts and Strogatz pointed out the omnipresence of small world connectivity patterns that are highly clustered and exhibit small characteristic path lengths. Such topological structures were identified in electric power grids, neuronal and brain networks, protein-protein interactions, metabolic pathways, transportation, social networks, and food webs, to name only a few (7–10). The next decisive breakthrough was the growth and preferential attachment model that describes the universal scaling in degree distributions by Barabási and Albert (11), along with the notion that highly heterogeneous and scale-free-like networks likewise pervade biological, social, and technological systems (12–14). It is clear that the potential of graph theory to solve real-world problems is only beginning to be realized.
From Network Science to Islets of Langerhans
Complex networks are widely applicable because they can represent and study the relationships between individual components in virtually any discrete system. In the last two decades, along with the advances in high-throughput technologies, including increasing computational power, biometric data acquisition, imaging techniques, and bioinformatics, network concepts have become an indispensable tool in biomedical research (15–23). In biomedicine, network science allows us to analyze, integrate and interpret several types of data, as well as to link them together in novel ways. Therefore, it complements the reductionist approach of systems biology, which focuses on identifying the key elements and their role in isolation. In addition to studies of gene-gene interactions (24), network science is also being used to analyze interactions between individual molecules, proteins (25, 26), signaling pathways, and more recently, to study the underlying pathophysiology of various disease processes (27–29), both at the level of the individual organs and at the systemic level. Network analyses nowadays allow the study of complex signaling pathways in health and disease, with the integrative concept being especially valuable in complex diseases with different comorbidities and multiple phenotypes (30). By understanding the bigger picture, it allows, on the one hand, the detection of potential drug targets, while at the same time offering the possibility of a systems approach to diagnosis and therapy (21, 27, 31, 32). Furthermore, under the framework of the recently emerging field of network physiology, network approaches have proven valuable to describe the structural organization and functional interrelations between different physiological and organ systems on the whole-organism level (18, 22, 33–35). Noteworthy, in the last decade perhaps the most remarkable breakthroughs of complex network analysis were achieved in neuronal physiology, where these approaches are used to quantify the brain’s functional and anatomical organization and have reached the maturity to be translated into clinical practice (36–39).
Of most importance for our present review is the fact that in recent years, network theory has been used to assess intercellular interactions in multicellular systems where nodes represent individual cells, and their locations correspond to physical positions of cells in the tissue. Functional connections between cells are created based on the temporal similarity of the measured cellular dynamics, as evaluated through the calculation of the correlation coefficient or other metrics for statistical similarity of time series. Multicellular recordings of membrane potential or intracellular calcium concentration are typically used as input signals. Network principles have thus been used to elucidate the connectivity patterns in neurons (40–44), astrocytes (45), pituitary endocrine cells (46, 47), lens epithelium cells (48, 49), hepatocytes (50), mammary epithelium cells (51), endothelial cells (52), and pancreatic acinar cells (53). Network analyses were introduced to the islet community a decade ago and are increasingly seen as a valuable tool to examine and quantify collective activity patterns in the pancreatic islets of Langerhans (18, 54–69). In these microorgans, communication among a variety of cells with unique functions and characteristics must occur to ensure proper control of metabolic homeostasis (70–73). The most prevalent cell type are the insulin-secreting beta cells, which are electrically coupled through gap junctions composed of connexin36 (Cx36) to ensure mediation of intercellular signals (74, 75). Because beta cells are intrinsically highly heterogeneous and operate in a continuously changing environment, they exhibit complex yet coherent activity patterns, that are essential to tightly controlled insulin secretion. Inspired by and contributing to the increasing awareness that both synchronized islet activity and cell-to-cell communication are altered during the pathogenesis of diabetes (76–80), tools from the armamentarium of the complex network theory are now recognized as a powerful computational framework to assess the multicellular activity in islets and to study the progression of islet dysfunction in diabetes. Therefore, we review the recent advances related to the application of network theory to study islet physiology. We first provide a comprehensible introduction to the basic principles of network theory to introduce physiologists to this rather new theoretical paradigm. Then, we demonstrate how the complex network approaches can be used to uncover the functional connectivity patterns among cells within the islets and specify their functional implications. We conclude by pointing out some challenges and possible directions for future investigation of islets and the multicellular dynamics of endocrine cells in general.
Types of Networks and Network Metrics
The birth of modern network science began with the objective of characterizing the topology of real-world systems consisting of many interacting units. In its purest form, a graph or a network is an abstract mathematical object consisting of nodes (or vertices) which are connected by links (or edges or connections). Because of this rather simple definition, complex networks represent a general and very useful framework to describe a large variety of social (3, 8, 81), biological (17, 18, 82–85), and technological systems (86–88). Nodes and edges can be regarded as a manifestation of some properties of a system and the corresponding network is a simplified mathematical representation of the relationships (edges) between variables (nodes), that does not necessarily encompass all the details of the underlying system. For example, in online social platforms, people (nodes) are connected through friendships (links); studying these social networks can allow the study of how information spreads without knowing details about each specific person in the network. Similarly, protein-protein interaction networks, where nodes in networks represent proteins and links represent interactions between them, can lead to a systems level understanding of the cell. Furthermore, data abstraction in networks facilitates the identification of general topological characteristics in interaction patterns. The observation of small-world characteristics, universal scaling, and heterogeneity in the degree distributions, as well as the existence of community structure, are the most important features observed in a plethora of empirical networks (6, 11, 89–91).
Small-world networks can be divided into three structural classes: (i) single-scale networks, (ii) broad-scale networks, and (iii) scale-free networks (8). This classification relies on the computation of the degree distribution, meaning the proportion of nodes that have a certain degree or number of edges (8, 92). Figure 2 shows three different types of networks along with their degree distributions that were obtained from the SNAP database (93). Figure 2A represents the road network in California, which is a homogeneous single-scale network that is characterized by a degree distribution with a fast decay, i.e., there are no nodes with a very high degree, meaning there are no cities or towns with extremely high numbers of roads connecting to them. Figures 2B, C represent a disease network and the air transport network in the USA, respectively. Both of these networks are heterogeneous, as evidenced by the heavy-tailed degree distributions, indicating thereby that there are a few nodes with a very high number of connections, i.e., hub nodes. However, only the air transportation network exhibits a scale-free structure with a clear power-law degree distribution. In contrast, despite being heterogeneous, the disease network structure deviates from the pure power-law behavior. Therefore, it can be categorized as a broad-scale or a weakly scale-free network. Notably, such structures are much more common in real-world networks than rigorous scale-free networks. More specifically, due to different constraints and finite sizes, scale freeness of networks is not a ubiquitous phenomenon and therefore the term scale free network is in the literature sometimes loosely applied to different types of heterogeneous networks with heavy-tailed degree distributions (14). Nevertheless, from the functional point of view, when dealing with real-life networks, it is much more important to know whether a network´s degree distribution is heavy-tailed, so that we are aware of the existence of hub nodes, than whether it exactly follows a power-law (94, 95).
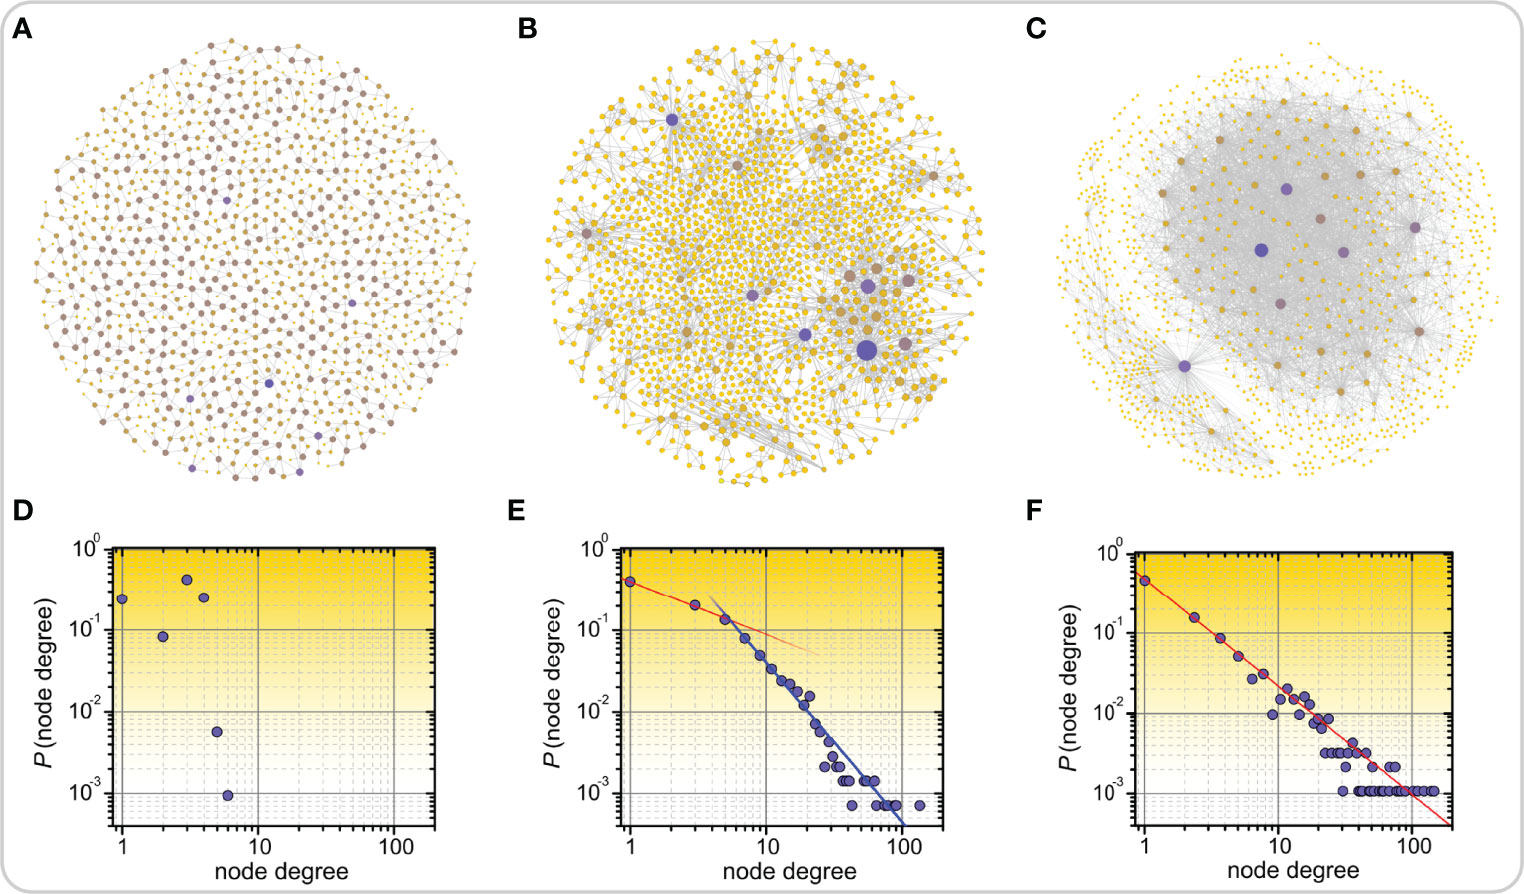
Figure 2 Examples of real-world networks along with their corresponding degree distributions. Road network in California (A), disease-disease network in which nodes represent inherited, developmental, or acquired diseases and links represent associations between them (B), and air transport network in the US (C). In panels (A-C) highly connected nodes, i.e., hubs, are colored purple, all other nodes are colored yellow. The lower panels feature the corresponding degree distributions of networks which are categorized as single-scale (D), broad-scale or weakly scale-free (E), and scale-free (F).
The most commonly used network metrics applicable to studying multicellular networks are schematically presented in Figure 3 (for more details see (18, 96)). By simply counting the number of links of a node, we define its degree ki, and by averaging the degrees of all nodes, we can calculate the average degree of the network. The degree of a node is an indicator of its importance. By drawing a degree distribution, we can then distinguish between different types of networks, as already outlined above. To estimate whether nodes in the network are connected in a more segregated or a more integrated way, we can calculate the so-called local clustering coefficient Ci, which is a measure of how well adjacent nodes are interconnected, while the average clustering coefficient is defined as the average of all local clustering coefficients and indicates the overall interconnectedness. From a functional point of view, high clustering imparts resilience to removal of nodes since a signal will reach all neighbors of a removed cell if they are connected with each other. A metric for evaluating the quality of integration is the global efficiency of the networks, which is defined as the inverse sum of all shortest path lengths between all accessible pairs of nodes. Higher values of global efficiency (i.e., shorter average path lengths) indicate better communication capability between nodes. Importantly, the trade-off between clustering coefficient and the global efficiency is also used to measure the degree of small-worldness in the network, small-world networks are expected to simultaneously display both high integration and segregation, i.e., high global efficiency and clustering (97). Moreover, it is sometimes important to find communities or subsets of nodes that are densely connected, and the extent to which the network is divided into communities can also be evaluated using the so-called modularity metric. A well-pronounced community structure in a network indicates a functional specialization of specific regions or subnetworks. In islets of Langerhans, this could indicate presence of islets within islets or islets that merged during ontogenesis. Lastly, network analysis can be used to identify connected components, defined as a subset of nodes that can reach any other node by traversing links with the goal of describing the reachability of the network structure and finding isolated subnetworks. Of particular importance is the network’s largest component Smax, i.e., the maximal set of mutually connected nodes, which reflects the degree of integration and resilience of the network. All network measures described here and in Figure 3 can easily be applied to intercellular interaction patterns within the pancreatic islets once multicellular networks are established from experimental data.
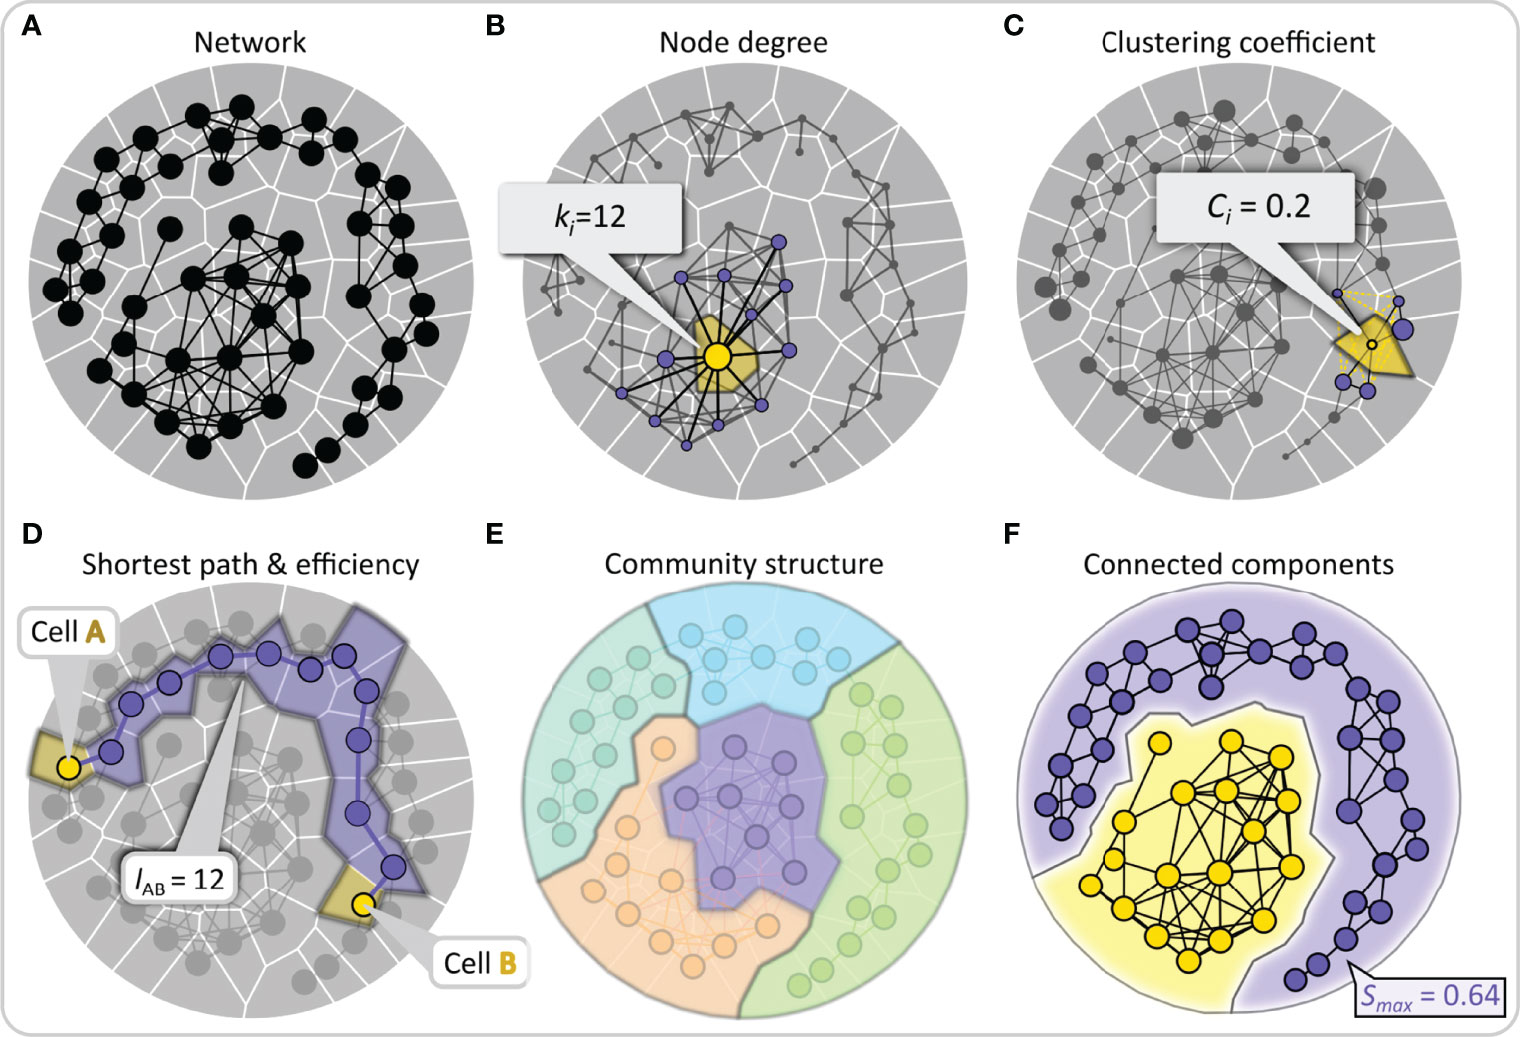
Figure 3 Quantifying intercellular connectivity patterns with conventional network metrics. (A) Schematic representation of a multicellular system as a network composed of nodes (cells) and edges (connections or functional associations between cells). (B) Nodes are scaled based on the number of the neighbors to which they are directly connected, i.e., their degree. This feature is shown schematically for the yellow node, with the direct neighbors colored purple. (C) The clustering coefficient describes the tendency of nodes to cluster together and is defined as the number of existing connections between the neighbors of that node divided by the number of all possible connections between them. This property is illustrated by the example of the yellow-colored node, to which non-existing yellow edges between the purple neighboring nodes have been added. (D) The shortest path length between any two nodes is the number of edges that form the shortest path between them. Lower average shortest paths of a network indicate more efficient communication abilities. This feature is highlighted by two yellow nodes representing the source and destination nodes and the purple-colored nodes forming the shortest path. (E) A community consists of a group of nodes that have a higher connection density compared to the whole network. A well-pronounced community structure implies an internal network organization into functional modules. In panel (E), nodes are color-coded according to their membership in a community. (F) A group of nodes that are directly or indirectly connected to each other forms a connected component and stands for reachability within the network. The relative largest connected component representing the fraction of nodes that are connected either directly or indirectly is denoted by Smax.
Designing Functional Beta Cell Networks
Networks are a convenient abstraction tool for exploring how relationships and interactions between individual components give rise to emergent dynamics. When mapping cellular associations, an important distinction must be drawn between how cells are physically connected and how the actual information transfer occurs, affecting the collective activity of cellular populations. Formally, we distinguish between structural and functional networks, even though it is known that the structure and function in networks are closely intertwined (98). Structural intercellular networks describe the patterns of cellular morphology arrangement and provide the mechanistic substrate for intercellular signal transfer. Structural network analysis has already been utilized to study the cytoarchitecture of the islets. Specifically, network-based methods have been used to assess the spatial organization of cells and their homo- and hetero-typic contacts (99–104), to elucidate the principles of beta cell arrangement in normal and diabetic islets (105), to infer the structural basis for paracrine regulation of delta cells (106), and to study the arrangement of endocrine cells regarding the vascular network in the islets (107). While structural network analysis represents a vibrant topic in the islet community, it is beyond the scope of this review.
Here, we focus exclusively on functional multicellular networks, which derive from the system’s dynamics. In functional connectivity maps, nodes represent individual beta cells and connections between them are established based on the temporal similarity of the measured cellular dynamics, as typically assessed by statistical similarity of calcium signals (18). The creation of functional beta cell networks has become feasible with the development of functional multicellular calcium imaging techniques. Two earliest adopters of these techniques in conjunction with network-based analysis were Hodson et al. (54) in isolated islets and our group in tissue slices (62), where we represented cells as network nodes and functional connections between cells as network edges. In both studies as well as in most studies that followed, a thresholding of the correlation matrix was used to construct functional networks, where two cells were deemed functionally connected if their correlation coefficient exceeded a preset threshold level. The procedure is schematically presented in Figure 4 and encompasses the processing of the recorded Ca2+ time series. In most of our previous works, we focused exclusively on the fast Ca2+ oscillations that propagate across the islets in the form of intercellular waves. To this aim, the signals were band-pass filtered and smoothed to remove noise and variations in basal Ca2+ levels. We will discuss how preprocessing of recorded traces affects the network characteristics in the next chapter.
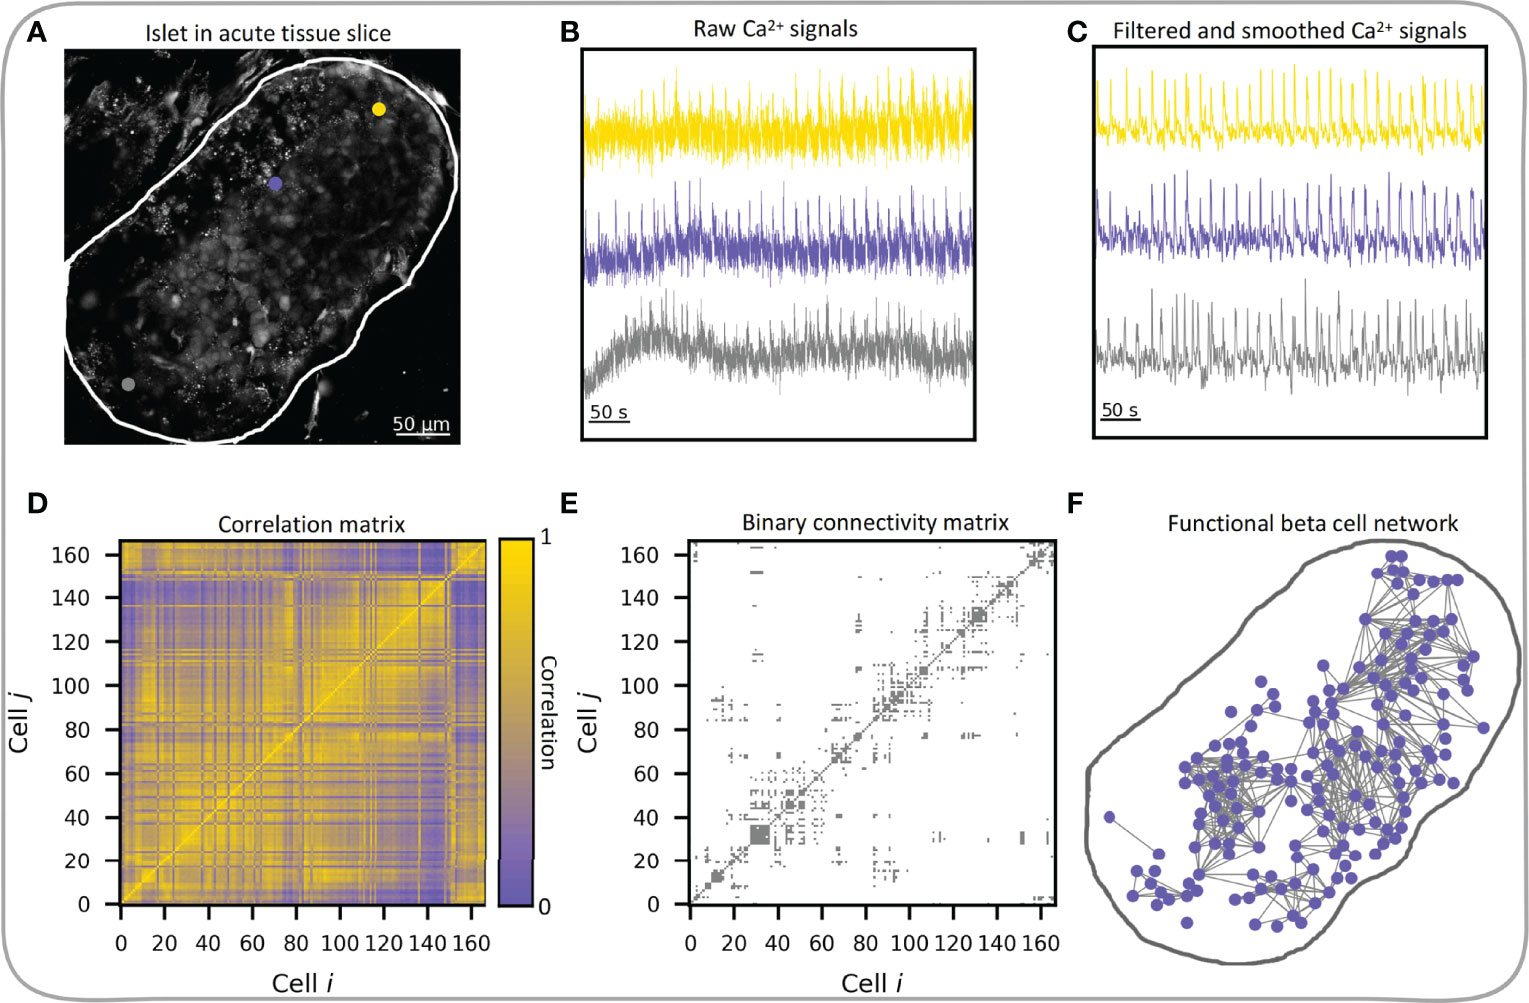
Figure 4 Workflow of functional beta cell network extraction. (A) Confocal image of islet of Langerhans in acute tissue slice with three indicated beta cells (gray, yellow and violet dots) and indicated islet outline (white curve), exported raw Ca2+ signals of the three beta cells (B) and processed Ca2+ signals (C) of the same three cells. (D) Pearson correlation coefficient matrix based on filtered and smoothed Ca2+ signals of all cell pairs in the islet. (E) Extracted binary connectivity matrix based on the thresholded correlation matrix; only cell pairs whose correlations exceeded Rth = 0.82 were considered connected. (F) The corresponding functional beta cell network. Blue dots denote individual beta cells and gray lines represent functional connections between highly synchronized cells.
The methodology to create such functional connectivity maps originates from neuroscience, where similar approaches have been used to study functional associations between brain regions or neurons (36, 108). However, a drawback of the method is that it relies on a somewhat arbitrary connectivity threshold selection (109–112). As one of the criteria it was suggested that the selected threshold value should be chosen at R>0.7, such that more than half of variance is explained by the correlation (R2>0.49). Alternatively, one can fix the average node degree, such that it reflects a physiologically relevant value (i.e., the expected number of connections in the observed tissue). By this means, the correlation threshold value for intercellular connectivity is iteratively adjusted until the resulting network has the desired edge density. In this context, the average node degree itself no longer has any descriptive meaning when comparing different networks, however, the underlying network parameters and degree distributions can differ greatly. If, for example, individual nodes of a network are poorly correlated, the resulting network will have more random-network-like attributes (high efficiency, very low clustering, high modularity), compared to highly correlated nodes which result in a more ordered network structure (high clustering, lower efficiency, and lower modularity). Therefore, this methodology should not be used when the signals in different islets differ substantially. As an alternative, the minimum spanning tree network can be used. This method represents an unbiased network construction method which relies on the fully connected, weighted and undirected graph of the system and extracts only the sub-network which contains N-1 strongest connections (N – total number of nodes) with no disconnected nodes or circular connections. It has been, for example, successfully applied in brain research (113) and in assessing the collective dynamics of cryptocurrencies (114) or energy consumption profiles (115). The lack of disconnected nodes and the simple, barebone representation are the main advantages of this method, since disconnected nodes can represent a problem for previously described approaches. The main drawback is the lack of circular connections, consequently zero clustering coefficient and an overall poorer description of the underlying system. Networks can also be constructed from binarized time series and in this case the so-called coactivity coefficient is used to evaluate synchronicity between cells (64, 66, 116). While this method does objectively capture the level of synchronicity between cell pairs, it should not be used when there are notable differences in the activities of individual cells, as it might lead to spurious results. Another approach, popular in neuroscience for inferring the connectivity between brain regions, is the Granger causality (117). As the name suggests, this method is not only used for determining functional connectivity between brain regions, but also for the direction (causality) of these connections and was also successfully utilized in beta cell research for identifying first responder cells in mouse islets following glucose stimulation (67). Finally, it should be noted that particularly in neuroscience more advanced methods to quantify statistical interdependencies between active nodes are gaining attention, such as the partial cross-correlation (114, 118, 119), dynamic time warping (120, 121), and minimum jump cost (122, 123).
Topological Analysis of Functional Beta Cell Networks
Beta cells respond to stimulation with tightly coupled oscillations in membrane potential and intracellular calcium concentration [Ca2+]IC leading to insulin secretion (124–128). At present, Ca2+ oscillations can be observed in two distinct time domains: i) fast Ca2+ oscillations under 20 s long, appearing with a frequency of about 5 min-1 and corresponding to beta cell bursting electrical activity (55, 124, 129, 130), and ii) the underlying slow oscillations with a frequency of around 0.1-0.2 min-1 (56, 131, 132). Gap junctional coupling of beta cells via Cx36 allows for the electrical linkage as well as the exchange of small molecules between neighboring cells and mediates principally the coherence of fast Ca2+ dynamics (133, 134). Correlations between slow Ca2+ oscillations can be driven by metabolic coupling of neighboring cells, via feedback onto the slow dynamics by the fast dynamics due to same electrical coupling (77, 135–139), as well as by intrinsic metabolic characteristics of beta cells (61). Since both fast and slow oscillations are synchronized among the cells in an islet, they both contribute to functional connectivity networks derived from Ca2+ signals (56, 133, 140, 141).
In our first study in which we employed network analysis to investigate functional connectivity we showed that beta cells are most synchronized and densely connected during the activation phase following the administration of stimulatory levels of glucose and during the deactivation phase after glucose stimulation has ceased. During these periods, the functional connections were mostly independent of the Euclidean distance between cells within the islet. This behavior may be because beta cells individually yet synchronously move from basal [Ca2+]IC to the much higher “plateau” level required to trigger insulin secretion upon stimulation, and back to baseline upon termination of stimulation, yielding highly correlated signals. Notably, similar observations were later also made in measurements on zebrafish islets in vivo (67). Furthermore, in the phase of sustained activity (plateau phase), an intermediate level of synchronization was observed, and the length of functional connections was considerably lower, suggesting that the cells are predominantly synchronized via calcium waves which spread across the islet (62). Moreover, initial studies of beta cell networks have revealed that functional beta cell connectivity patterns are small-world networks dominated by a small subset of cells with a high degree of functional connectivity, i.e., hub cells (62, 64). The high level of heterogeneity and the presence of long-range correlations were perhaps the most striking observations of the earliest studies. The existence of hub cells was also linked with metabolic profiles, which will be addressed in more detail in section 5. The presence of long-range connections that give rise to small-world characteristics was attributed to various reasons associated with a complex multicellular dynamics, whereby heterogeneity and a heterogeneous coupling were highlighted also in theoretical models (142, 143).
The structure of functional networks depends heavily on the type of the input signal. As explained above, the measured Ca2+ dynamics comprises different temporal domains (Figure 5A), whose activity is coordinated across the islets in a different manner. In other words, beta cells have fluctuations in intracellular calcium concentrations at both faster and slower oscillatory rates, and the networks constructed from these separate temporal domains have differing properties. Figure 5A shows a representative beta cell response, where the raw, unfiltered [Ca2+]IC dynamics is shown in gray and yellow and violet traces represent the filtered signal with only the slow and only the fast oscillatory component, respectively. In Figure 5B, the corresponding raster plots of the binarized fast and slow activity are presented and it can be noticed that both types of oscillatory dynamics display coordination across the islet. With these different input signals, three different functional networks can be constructed and characterized (Figure 5C). Metabolically driven slow dynamic component gives rise to substantially longer functional connections, due to global slow Ca2+ waves occurring on a broader temporal scale (56). The slow component gives rise to a higher average correlation (Ravg), while the fast component results in higher clustering (Cavg), pointing out a denser interconnectivity between neighboring cells. Moreover, the network built upon the fast Ca2+ component results in a lower global efficiency (Eglob) compared to both the slow and the unfiltered signal, denoting a longer characteristic path length between beta cells. Despite the higher clustering in the fast component, the lack of long-range connections leads to a decreased measure of small-worldness (SW). This indicates that the slow component importantly contributes to the level of small-worldness of the beta cell functional connectivity networks, which is an important aspect to consider when unprocessed signals are used for the analysis. Therefore, in addition to the insights gained by separating Ca2+ signals into various components (fast vs. slow vs. a combination of both), further methodological steps, i.e., signal filtration, affect the characteristics of functional networks and their implications in islet function. Finally, it should be emphasized that functional connectivity describes a statistical relationship between the measured signals and therefore long enough intervals should be used to obtain relevant results, particularly when slow oscillations are analyzed, which display a relatively low temporal density of events (typically on the order of magnitude of 0.1 min-1).
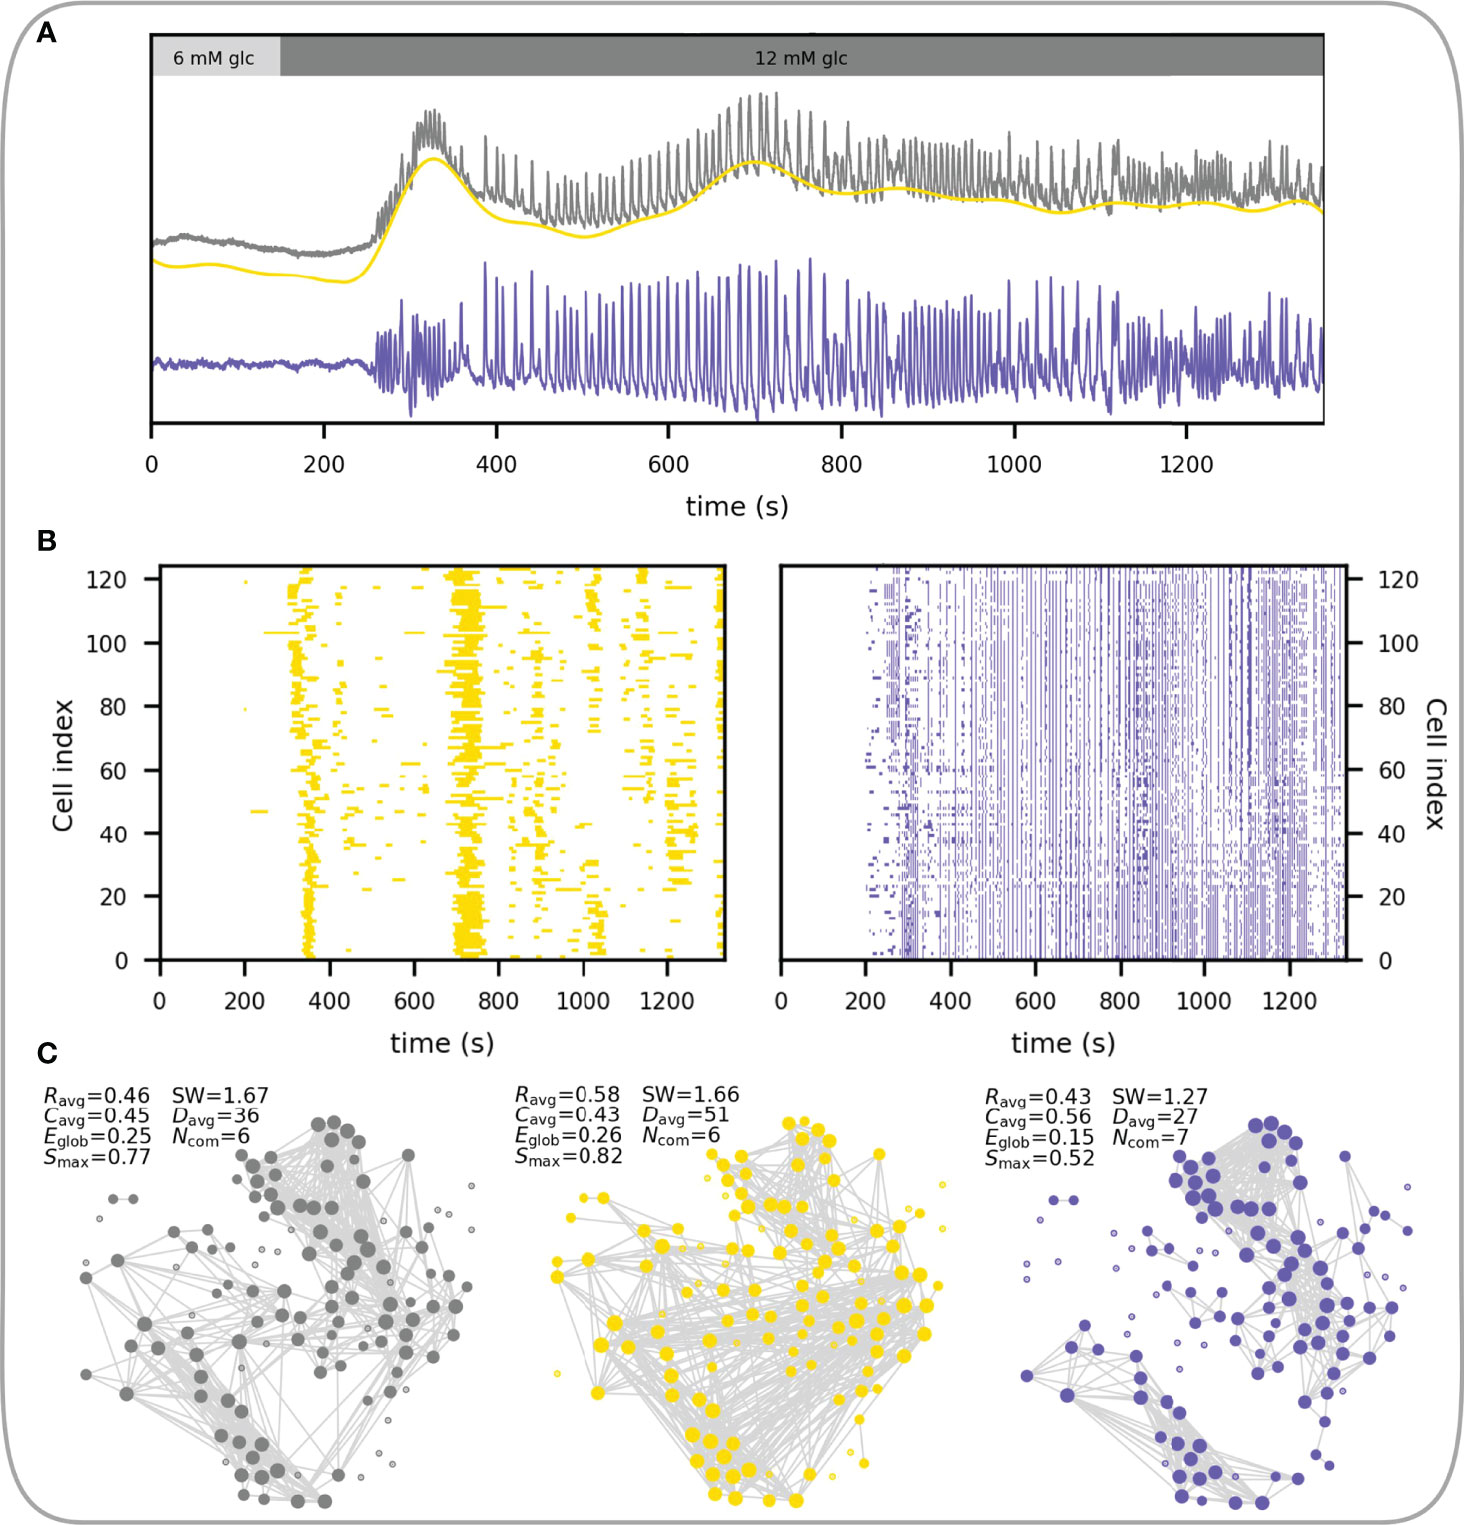
Figure 5 Constructing functional beta cell networks from different types of Ca2+ signals. (A) Raw average Ca2+ signal of a representative islet (gray line) with extracted slow (yellow line) and fast (blue line) signal components. (B) Raster plots showing the activity of the slow (left, yellow dots) and fast (right, blue dots) Ca2+ signals of all cells in the islet. (C) Correlation-based functional networks constructed from unprocessed (left), slow- (middle) and fast (right) Ca2+ signals. Networks were constructed with a fixed average network node degree kavg = 8.3. The following parameters for each functional network are provided: average correlation coefficient (Ravg), average clustering coefficient (Cavg), global efficiency (Eglob), largest connected component (Smax), small-world coefficient (SW), average physical length of functional connections (Davg) and the number of communities (Ncom).
In what follows we focus on the fast component of Ca2+ response. Beta cells respond to glucose stimulation in a biphasic manner (144–146). Following exposure to, there is an activation phase with a transient rise in [Ca2+]IC and fast Ca2+ oscillations, during which beta cells are progressively recruited and begin to operate more synchronously. Heterogeneous activation of beta cell clusters during activation is reflected in local Ca2+ waves that are heterogeneous in size (55, 145, 147). Activation is then followed by a stable plateau phase with synchronized, regular oscillations and islet-wide activation of beta cells, as indicated with the replacement of local Ca2+ waves with global Ca2+ waves (55, 147). This behavior is demonstrated in Figures 6A, B. The corresponding temporal evolution of functional networks throughout stimulation is reflected in its characteristics (Figure 6C), with a higher average node degree, clustering coefficient, largest component, and a smaller number of communities during the plateau phase. In other words, with the increase in activity and coordination cells become more connected, the network becomes denser and more integrated, with fewer and bigger communities.
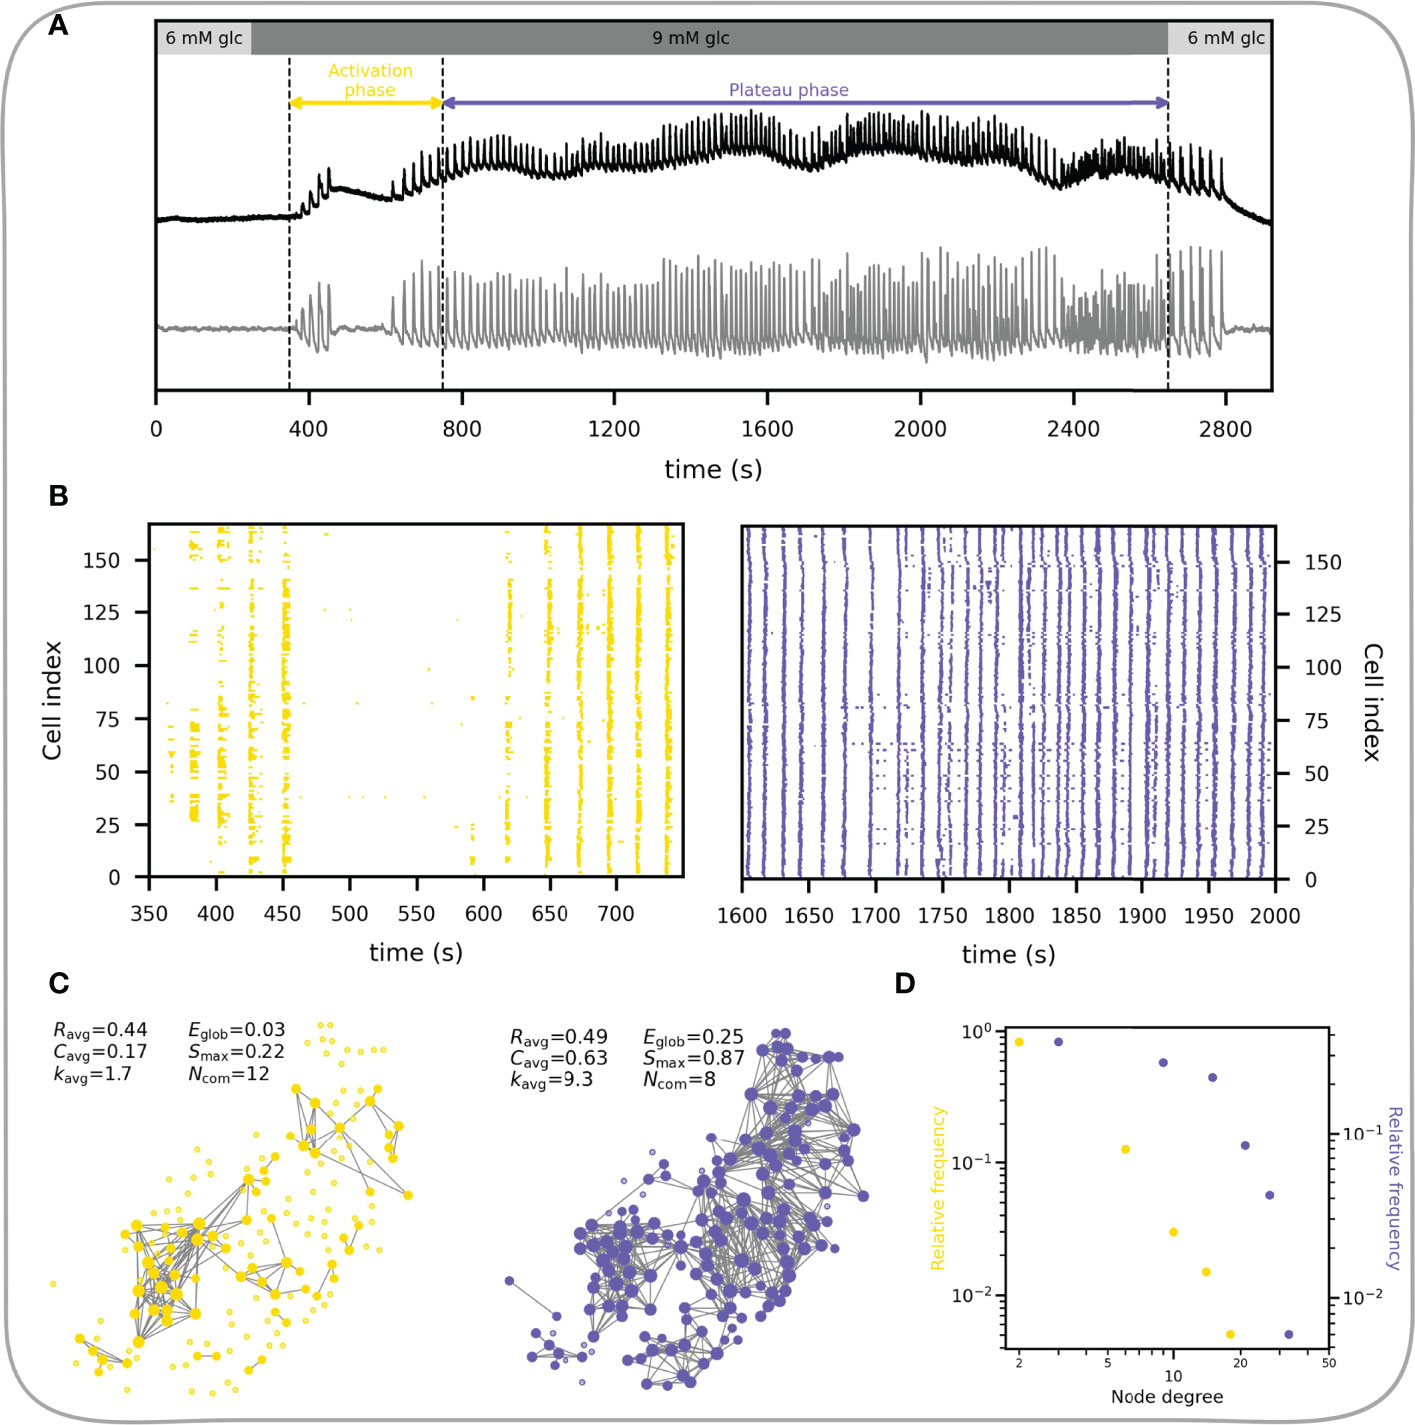
Figure 6 Characteristics of the functional beta cell network in response to stimulation. (A) Average Ca2+ signal of an islet subjected to a 6-9-6 mM glucose stimulation protocol. Black line represents the unprocessed Ca2+ signal and the gray line represents the extracted fast component of cellular activity. Colored horizontal arrows indicate the selected activation and plateau phases for further analysis. (B) Raster plots showing the binarized fast component of beta cell activity for the activation (left) and plateau (right) phase as indicated in panel (A). (C) Functional beta cell networks constructed for both phases (left, activation phase; right, plateau phase) based on fast signal components of all cells with a correlation coefficient threshold for connectivity Rth = 0.8. The following parameters for each functional network are provided: average correlation coefficient (Ravg), average clustering coefficient (Cavg), average network node degree (kavg), global efficiency (Eglob), largest connected component (Smax) and the number of communities (Ncom). (D) Node degree distributions for the networks extracted in the activation (yellow dots) and plateau phase (blue dots).
The node degree distribution during the plateau phase decreases roughly potentially with a cut-off in the tail, i.e., following an exponentially truncated power law signifying the broad-scale nature of functional networks (Figure 6D) (55, 62). We wish to point out that physical limitations prevent the emergence of truly scale-free networks, i.e., a cell cannot be functionally connected to more cells than there are in a tissue, and consequently, they are not as ubiquitous in real world as is often presumed (14). It is worth emphasizing that the noted heterogeneity in the degree distribution implies the existence of highly connected beta cells, i.e., hub cells that are in this islet connected to more than 20% of other cells. While some studies have demonstrated a particular importance of this highly connected subpopulation of beta cells in orchestrating collective beta cell activity in healthy islets (148), as well as their crucial role in pathogenesis of diabetes (54, 58, 64), the evidence is not unanimous and many details about their characteristics and the part they play in islet coordination remain to be elucidated (55, 149–151).
Functional Implications of Beta Cell Network Analysis
From Classical Physiological Parameters to Functional Connectivity
Collective activity of beta cells achieved through tightly regulated electrical coupling of neighboring beta cells (and perhaps also other cell types) via Cx36 is vital to well-regulated insulin secretion (152). Functional multicellular imaging has allowed deeper insight into the importance of multicellular cooperation and functional connectivity of beta cells within an islet (73, 153–155). The response of islets to glucose depends on the level of stimulation. With increasing glucose concentration from substimulatory (< 6 mM) to supraphysiological glucose concentrations (> 10mM), the delays to activation of cells shorten (advancement), and the fraction of beta cell population involved in the response increases (recruitment) (55, 145, 156–159). Also, the delay between the activation of cells that respond first (called first responders) and beta cells in the same islet that activate later is shortened (55, 156, 160). Compared with dissociated or uncoupled cells, the probability density of cell activation in coupled beta cells in islets is narrower and thus the dose response curve is much steeper. Importantly, all of these features of the activation phase agree with model predictions, as excellently reviewed recently by Peercy and Sherman (60). In the plateau phase, the glucose dependency or the dose response is evident as an increase in active time or so-called duty cycle, which is in good agreement with insulin secretion (55, 160–164). During deactivation, the delay before cells turn off is longer for higher preceding glucose stimulation, however, the heterogeneity between cells is less than during activation (55, 156, 160). Importantly, a coordinated cessation of activity is important, as it prevents hypoglycemia. Data suggest that this last phase of response may be disrupted in uncoupled beta cells and under diabetogenic conditions (66, 152). Looking at the functional connectivity of beta cells, a clear transition from more segregated to more integrated networks can be observed with increasing glucose concentrations (55, 63). These changes in activity and functional connectivity are accompanied by a switch from more local to more global [Ca2+]IC waves (58, 147). However, despite the highly integrated functional connectivity in high glucose, an islet cannot be regarded as a uniform supercell sharing identical activity in all its parts. Rather, based on differences in activation times, activity during the plateau phase, the origin of [Ca2+]IC waves, and the number of connections in functional networks, distinct beta cell subpopulations presumed to have distinct impacts on islet activity have been defined (54, 55, 59, 62, 64, 67, 165).
Beta Cell Subpopulations and Functional Heterogeneity
Beta cells with a high number of links in functional networks have been termed hub cells. They were suggested to govern the functioning of islet networks by initiating [Ca2+]IC waves (64, 67). According to this view, non-hub cells are believed to only follow metabolic, electrical, and other signaling cues from the hub cells (166). Advanced optogenetic and photopharmacological investigations indicated that hub cells are metabolically highly active, exhibit hyperpolarized mitochondria and have a lower insulin content, thus resembling a transcriptionally immature phenotype due to the low expression levels of signature beta cell transcription factors. Notably, energetic demands of the functionally most connected cells can also be estimated by analyzing details of [Ca2+]IC dynamics. More specifically, we employed methods of nonlinear time series analysis to reconstruct the phase space and to compute the dissipative characteristics of individual cells within the network (167). Hub cells exhibit the highest energy dissipation rates, which was also predicted theoretically. This concept is demonstrated in Figure 7, where we show an exemplary islet with color-coded energy dissipation rates of individual beta cells. In addition, the coordinated collective response of beta cells to elevated glucose was blunted after silencing the hubs, and restored after specific stimulation, thus suggesting that they may be necessary for coordinated islet [Ca2+]IC dynamics (64, 67). At present, these findings cannot be completely reconciled with electrophysiological and modelling findings, for reasons that arguably originate in different methodological approaches [for a recent review see (60)]. Our current understanding suggests that in a system of coupled cells of which all are intrinsically able to oscillate, silencing a small proportion of cells with the highest number of functional connections cannot prevent or importantly change the activity of the remaining cells, except close to the threshold for stimulation where the majority of cells would otherwise not be active by themselves (60, 143, 148, 149). Further experiments in a near-threshold glucose milieu with ablation of hub cells rather than their silencing may further aid to our understanding of the role of hub cells in the islet syncytium. Importantly, similar strategies could be used in future studies to assess the importance of other subpopulations of cells discussed below.
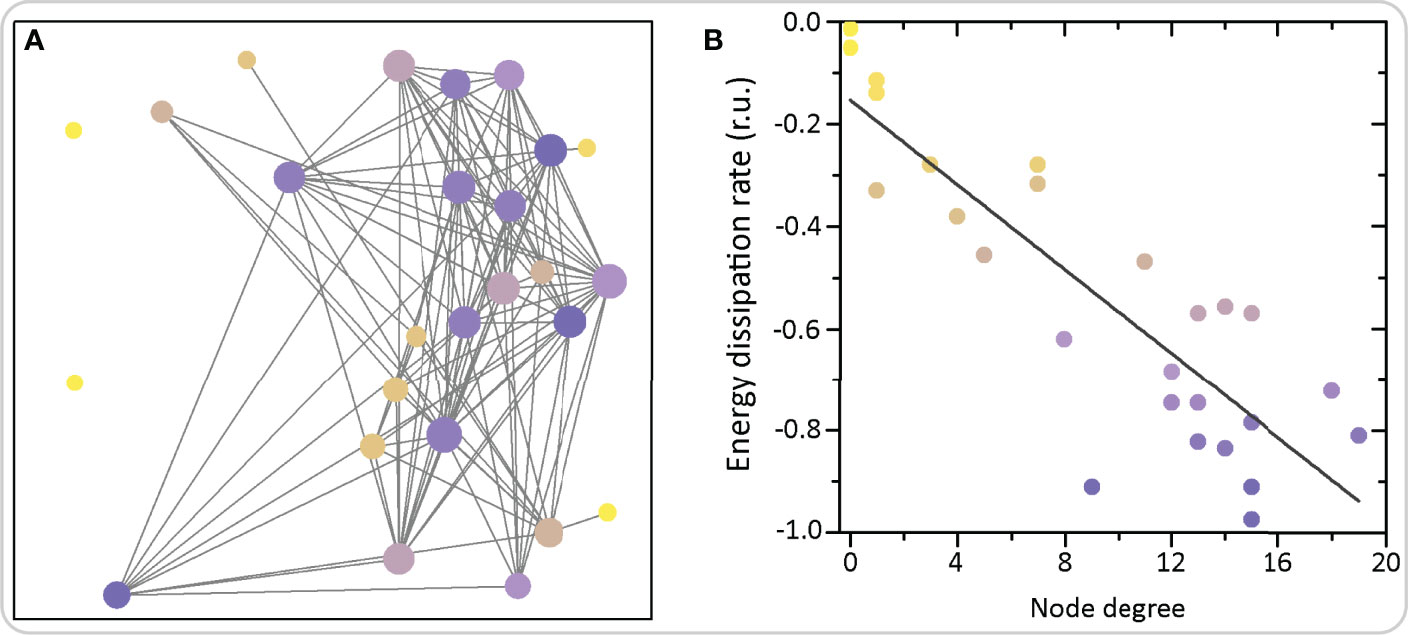
Figure 7 Functional network architecture of beta cells and the corresponding energy dissipation rates. (A) Each circle represents the physical position of a cell inside the islet and the connections signify functional connections. Colors of circles denote the average dissipation rates calculated as the sum of Lyapunov exponents (see Ref (167). for further details). (B) The average dissipation rate reflecting the rate of energy consumption of individual cells as a function of the node degree, i.e., number of functional connections. The grey line denotes the linearly decreasing trend showing that highly connected nodes exhibit higher dissipation and energy consumption rates.
Second, a large degree of beta cell heterogeneity is also evident from coordinated [Ca2+]IC waves that propagate across islets and seem to consistently emerge from specific subpopulations of beta cells named wave initiators or pacemakers. These cells could correspond to highly glucose responsive beta cells that have increased glucokinase activity (165, 168, 169). Interestingly, depending on the model employed, they can also exhibit a lower NAD(P)H response and a faster natural oscillation frequency than other cells in the islet, including hub cells. Therefore, they are more likely to depolarize first in response to stimulating glucose concentrations and send depolarizing currents to neighboring cells (165, 170). At present, it is undisputable that the great majority of [Ca2+]IC waves are initiated in a limited number of cells or regions, which do not necessarily overlap with the regions with most functional connections (58, 170). Also, it remains to be shown, whether their removal critically impacts the islet as a whole and which mechanistic substrates make them initiate the waves.
Third, analyzing with single cell resolution also the activation phase enables a comparison of behavior during this phase with the one on the plateau. Recent data suggest that the so-called leaders or first responders tend to cluster in groups that become larger in higher glucose and that tend to be more active, i.e., have longer active times, also during the plateau phase (55). Their removal seems to be able to delay the onset and diminish the amplitude of subsequent oscillations (67), but they are dispensable in the sense that if they are ablated another cell will become a first responder (68). Similarly, in human islets, during the first phase of glucose response, small clusters of beta cells with high activity govern the response, whereas during the second phase, the electrical coupling becomes more important to synchronize large multicellular functional clusters (146). Moreover, from the network point of view, cells with the most functional connections tend to activate sooner (55), but not necessarily be the first responders (68). Interestingly, the ability of cells to activate first in response to glucose seems to depend less on glucokinase activity than on the resting KATP and junctional conductance, which may in addition to intra-islet differences between cells (60, 68) also explain some inter-strain differences in activation (152, 160). At present, there is not enough consistent evidence for a significant overlap between hubs, first responders, and wave initiators. However, one feature which is consistently present in both experimental and modeling studies in hub cells is their higher-than-average active time or duty cycle. This may be due to the fact that the hub cells participate in the great majority of [Ca2+]IC waves and that their [Ca2+]IC oscillations may be a bit longer and perhaps more stable than the ones in other cells, which is also able to explain why their signals are similar to signals from many other cells and thus their functional connectivity is high (55, 58, 60, 68, 170).
Finally, functional differences between beta cell subpopulations may change with time and experimental conditions. For instance, heretofore, the described functional roles have not been tracked over long periods of time and are thus not necessarily stable properties. Additionally, the cells that are first responders to glucose may not necessarily be first responders to some other secretagogue, and the same holds true for the role of pacemakers and hubs. Moreover, it is reasonable to assume that to some extent some traits may be shared between different subpopulations, e.g., some of the first responders to glucose may be among the first responders to GLP-1 or among the hub cells. This may again depend on the experimenter’s definition of the size of subpopulation, with larger subpopulations possibly generating more overlap than more narrowly defined subpopulations. In other words, some of the first responders will with large probability be among the hubs if one sixth or even one third of the fastest responding cells and cells with the highest degree are defined as first responders and hubs, respectively, compared with a lower probability for overlap if the cut-off is set at one tenth. On the other hand, the overlap may have to do with genuine biological properties of beta cells. In the case of different or the same cells being first responders for different secretagogues, a cell´s role as a first responder may be determined by the relative importance of a given component in the stimulus-secretion coupling cascade in this cell. In addition to resolving the controversies regarding the importance of specific subpopulations for normal and pathological islet functioning, future studies shall therefore also shed light on the temporal persistence of these roles and their sensitivity to experimental conditions, such as different secretagogues. Moreover, they shall pinpoint additional subpopulations of cells and dissect into more detail their molecular, structural, and additional functional signatures. Additionally, a consensus among different research groups would be welcome on the nomenclature and cut-off values for determining subpopulation sizes. For additional details on the role of subpopulations in human islets, please see Human Islets and Coordinated Beta Cell Activity in Health and Disease, and for some suggestions on how mathematical modelling and multilayer networks may help address the issue of different subpopulations, please see Computational Models of Beta Cell Networks and Islets as Multilayer Networks below. Finally, for more details on the role of heterogeneity and different beta cell subpopulations in islets, as well as some suggestions for future studies, we wish to refer the reader to some other recent articles addressing this topic in detail (55, 58–60).
Altered Connectivity in Beta Cell Networks and Its Relevance in Diabetes
Adequate intercellular electrical coupling through gap junctions is essential for synchronized beta cell activity. In basal glucose, insulin release is low since the less active beta cells keep the intrinsically more active beta cells quiescent through junctional hyperpolarization or clamping (152, 171). In contrast, during increasing stimulation, more and more cells become active and intercellular coupling may facilitate recruitment of the least active cells. In Cx36 knock-out (Cx36 KO) mice, the response of beta cells to glucose resembles that of dispersed cells in culture including increased basal and lower stimulated insulin secretion, thereby confirming the theoretically predicted role of gap-junctional coupling for the coordinated collective response (60, 77, 78).
Importantly, prolonged exposure to high concentrations of glucose and fatty acids, as expected in diabetes, was found to downregulate Cx36 in mice, rats and humans, and may disrupt the pattern of intercellular synchronization (172–174). Similarly, studies on Cx36 KO mouse models have also shown an impairment of normal oscillatory patterns of insulin secretion elicited by glucose and a diabetic phenotype (77, 78, 152, 175). Moreover, a decrease in Cx36 protein and a smaller size of gap junction plaques were also observed in prediabetic C57BL/6 mice fed a high-fat-diet for 60 days (176). Similarly, in diabetic ob/ob mice the Cx36 protein level is significantly reduced despite a preserved Cx36 mRNA level, pointing to a decrease in protein synthesis and/or inappropriate gap junction organization, leading to deficient electrical coupling between cells (172). Also the synchronicity of Ca2+ oscillations in ob/ob mice is disturbed, disrupting the normal insulin secretion pattern (172, 177). From a mechanistic point of view, in (pre-)diabetes, a decrease in Cx36 coupling could be a consequence of increased concentrations of pro-inflammatory cytokines. Interestingly, in both mouse and human islets a cytokine-mediated decrease in coupling can be prevented with pharmacological interventions which increase intracellular cAMP. In this case, in mouse islets the glucose-stimulated calcium signaling was preserved by increasing the levels of gap junction protein Cx36 on the plasma membrane using exendin-4, a glucagon-like peptide (GLP-1) receptor agonist (178).
To protect islets from high-fat-diet induced impairment of beta cell gap junction coupling and to preserve proper Ca2+ signaling, including Ca2+ oscillation coordination and amplitude, a relatively simple intervention, namely a 40% caloric restriction, seems to be very efficient, mirroring similar beneficial effects of caloric restriction in human patients (179). Additionally, trying to decipher the effects of vertical sleeve gastrectomy (VSG) on beta cell function in obese mice, Akalestou et al. have shown that Ca2+ dynamics as well as the number and strength of connections between beta cells increase within 8-10 weeks post-surgery, which could be attributed to the strong influence of GLP-1 on islet functioning (57). GLP-1 in physiological picomolar concentrations augments postprandial insulin secretion. However, it significantly enhances beta cell cluster activity, coupling, and coordination only in the second phase of insulin secretion as shown using a microfluidic system with multielectrode arrays (146). As evident from the above findings, an important impact on Ca2+ oscillations is mediated by cAMP acting downstream through at least two different pathways, namely the guanine nucleotide exchange factor Epac2A and the protein kinase A (PKA) pathway (178). We wish to point out that in addition to physiological or pharmacological stimulation of cAMP production by neurohormonal secretagogues, glucose itself induces cAMP signaling in beta cells. This effect is most probably mediated by a Ca2+-dependent arm through Ca2+-dependent adenylate cyclase isoforms and by a Ca2+-independent arm through direct ATP availability or since the concentration of ATP is possibly saturating for adenylate cyclases even in basal glucose, through a decrease in inhibitory AMP. Moreover, cAMP oscillates in beta cells in response to stimulation by both glucose and extracellular primary messengers with the same period as electrical activity and [Ca2+]IC. The mechanism underlying these oscillations may differ depending on the experimental protocol. As [Ca2+]IC can influence cAMP production and degradation, oscillations in cAMP may at least partly be due to oscillations in [Ca2+]IC. This seems to be supported by the observation that oscillations in [Ca2+]IC and cAMP are typically in phase or occur with a slight shift. Pharmacological activation of GLP-1 receptors and/or direct activation of adenylate cyclase by forskolin are unable to stimulate beta cells in low glucose but can significantly enhance glucose-stimulated Ca2+ oscillations (180–182). Indeed, by constructing functional connectivity networks we have recently shown that increasing cAMP levels using forskolin increases beta cell activity as well as enhances synchronicity and coordination of intercellular signaling, evident as denser and more integral networks (180, 183). While both slow and fast Ca2+ oscillations rely on periodic entry of Ca2+ from extracellular space into the beta cells through voltage-activated Ca2+ channels, the fast Ca2+ oscillations may also depend on mobilization of intracellular Ca2+ stores from the endoplasmic reticulum. Therefore, pharmacological agents that increase cAMP may promote the appearance of fast Ca2+ waves (184, 185).
Many other pharmacological substances and drug candidates for diabetes treatment can affect beta cell connectivity patterns by targeting different signaling pathways, but to the best of our knowledge, apart from the cAMP-elevating agents only a few have been investigated using network measures. In this regard, glutamate signaling via N-Methyl-D-Aspartate receptors (NMDARs) has been demonstrated to play an important role in beta cell function by shortening the duration of bursts of electrical activity and therefore fast [Ca2+]IC oscillations, with NMDAR antagonists being able to prolong the duty cycle by prolonging these bursts (186, 187). More specifically, following glucose metabolism, increased ATP inhibits KATP channels and causes plasma membrane depolarization, resulting in activation of voltage-dependent Ca2+ channels, increase in [Ca2+]IC, and insulin secretion. A negative regulation of this pathway is mediated by NMDARs. Under physiological conditions, these receptors are probably fully saturated with glutamate originating from glutamate in blood, from glutamate secreted by alpha cells, or from glutamate exported by beta cells through excitatory amino acid transporters. Membrane depolarization is therefore able to activate NMDARs, which in turn activate KATP channels and Ca2+- dependent K+ channels (SK4 channels) through a not fully understood functional interaction, thus hyperpolarizing the membrane, terminating the bursts of membrane depolarization and shortening Ca2+ oscillations. NMDAR inhibition interferes with this negative feedback loop and prolongs bursts and Ca2+ oscillations (69, 186–188). Representing the spreading [Ca2+]IC waves as network layers, we have recently shown that the inhibition of NMDARs not only increases beta cell activity but also stabilizes and synchronizes intercellular connectivity patterns. Within consecutive [Ca2+]IC waves, NMDAR inhibition also stabilizes the course of [Ca2+]IC waves and the role of wave initiators (69). Given the importance of connectivity for normal and pathological functioning of islets and the fact that the network analyses are able to detect effects of non-pharmacological and pharmacological interventions beyond the classical physiological measures of beta cell activity, they are a promising tool to detect early changes during progression to diabetes and non-classical effects of new therapeutic approaches (188).
Human Islets and Coordinated Beta Cell Activity in Health and Disease
During the response to glucose, human beta cells have been described to display a more regional coordination between cell clusters compared with responses in mice (189, 190), which could reflect differences in islet architecture and gap junction coupling among beta cells in different species (191–193), but at least partly also due to differences in donor age and health, mode of preparation, as well culture duration and conditions (191, 192, 194–197). In human islets, diabetes results in disrupted cytoarchitecture with altered homotypic and heterotypic communication between different cell types within an islet (105, 198). The coordinated responses of islets to stimulation with glucose, glucagon-like peptide 1 (GLP1), and glucose-dependent insulinotropic polypeptide are also altered possibly due to a reduction in Cx36 expression. Moreover, perturbed beta-cell coupling and dysregulation of Cx36-dependent [Ca2+]IC signaling were observed in islets from donors with a high BMI, suggesting that lipotoxicity may result in lowered insulin secretion and progression to diabetes (54). Furthermore, during ageing, which is associated with increased risk of diabetes, a significant decline was found in gap junctional coupling. This was accompanied by reduced overall coordination of [Ca2+]IC activity, which became restricted to islet subregions, and diminished insulin secretion. However, activating gap junctional communication using modafinil, a pharmacologic activator of Cx36 electrical coupling, successfully reversed the age-related decline in synchronization of [Ca2+]IC signals (190). Supporting these observations, advanced optogenetic methods in combination with complex computational tools, confirmed differences in the coordinated responses to glucose between mouse and human beta cells. In human islets, [Ca2+]IC waves seem to be initiated from specific subregions called pacemaker or leader regions with specific metabolic profile and local excitability (54, 64, 71, 165). The synchronization patterns are more clustered compared to mice and the collective behavior of beta cells becomes altered in diabetes (67, 145). Our own research indicates that in type 2 diabetic islets glucose-dependence is still present, but beta cell activity seems to be reduced, mostly due to a reduced oscillation frequency. Furthermore, human beta cell networks are more segregated than mouse networks and in diabetic islets more than in islets from control donors. This is accompanied by smaller and more locally restricted [Ca2+]IC waves. Importantly, the hub regions seem to lose a disproportionately large fraction of connections, especially the long-range ones (58). Figure 8 summarizes how differences in structural connectivity between control and Cx36 KO islets, as well as between mouse and human islets from normal and diabetic donors, translate to differences in functional connectivity. Loss of gap junction connectivity in Cx36 KO mouse islets desynchronizes beta cell [Ca2+]IC responses, resulting in poor cell-cell correlation and sparse functional networks (Figure 8B). The changes in intercellular coupling are reflected in key network parameters, e.g., a lower average correlation (Ravg), scarcely connected beta cells, and an overall decrease in local connectedness, as well as in global efficiency compared to the control islet (Figures 8A, B). Conversely, despite having a comparable average correlation as Cx36 KO islets, human islets have better connected beta cells, are more locally integrated, and have a significantly higher number of communities. Their global integration, reflected in Eglob, however, is comparable to Cx36 KO mice islets, indicating a lack of long-range functional connections between subregions of the islet due to the relative lack of global [Ca2+]IC waves compared with mice (Figure 8C). Clusters of beta cells in human islets form communities (while Cx36 KO islets do not), these different communities are also connected, but much less than in islets in control mice, where global [Ca2+]IC waves and thus globally synchronized [Ca2+]IC oscillations are the rule rather than the exception. In human islets, [Ca2+]IC waves are heterogeneous in size and mostly encompass only smaller regions of the islet, in contrast to global, islet-wide [Ca2+]IC waves in mice (58, 147). Both can be at least partly contributed to structural differences, particularly a higher proportion of alpha cells and a more lobular structure in human islets, promoting a higher number of heterologous contacts between alpha and beta cells and possibly introducing bottlenecks for spreading of global [Ca2+]IC waves between the more segregated subregions (189, 192, 193). We wish to point out that despite this larger degree of segregation, human islets still seem to be able to produce [Ca2+]IC waves that involve the great majority of islet beta cells but do so much less often compared with mouse islets where globally synchronized oscillations are the rule rather than an exception (58, 197). Due to the abovementioned structural and functional differences, human islets may even be more prone to losing the ability to produce globally synchronized [Ca2+]IC with decreases in intercellular coupling under pathological conditions. Along this line, the functional connectivity patterns in islets from diabetic human donors (Figure 8D) are indeed much sparser and more segregated compared with islets from healthy controls, indicating thereby a higher fraction of inactive regions and a lack of larger and coherent [Ca2+]IC waves (58). Finally, while much of the evidence on the role played by decreased intercellular coupling in development of diabetes presented in the last two chapters may be circumstantial, we wish to point out that when taken together, some excellent recent studies nevertheless suggest that decreased Cx36 coupling is at least partly causative. More specifically, knockout of Cx36 leads to a diabetic phenotype (78), some degree of decrease in Cx36 is present in diabetic islets and improving this by pharmacological (178, 190) or dietary interventions (178) is sufficient to improve islet function. However, more studies in this direction are needed to quantify the contribution of decreased coupling and determine whether improving coupling is a viable treatment option for diabetes.
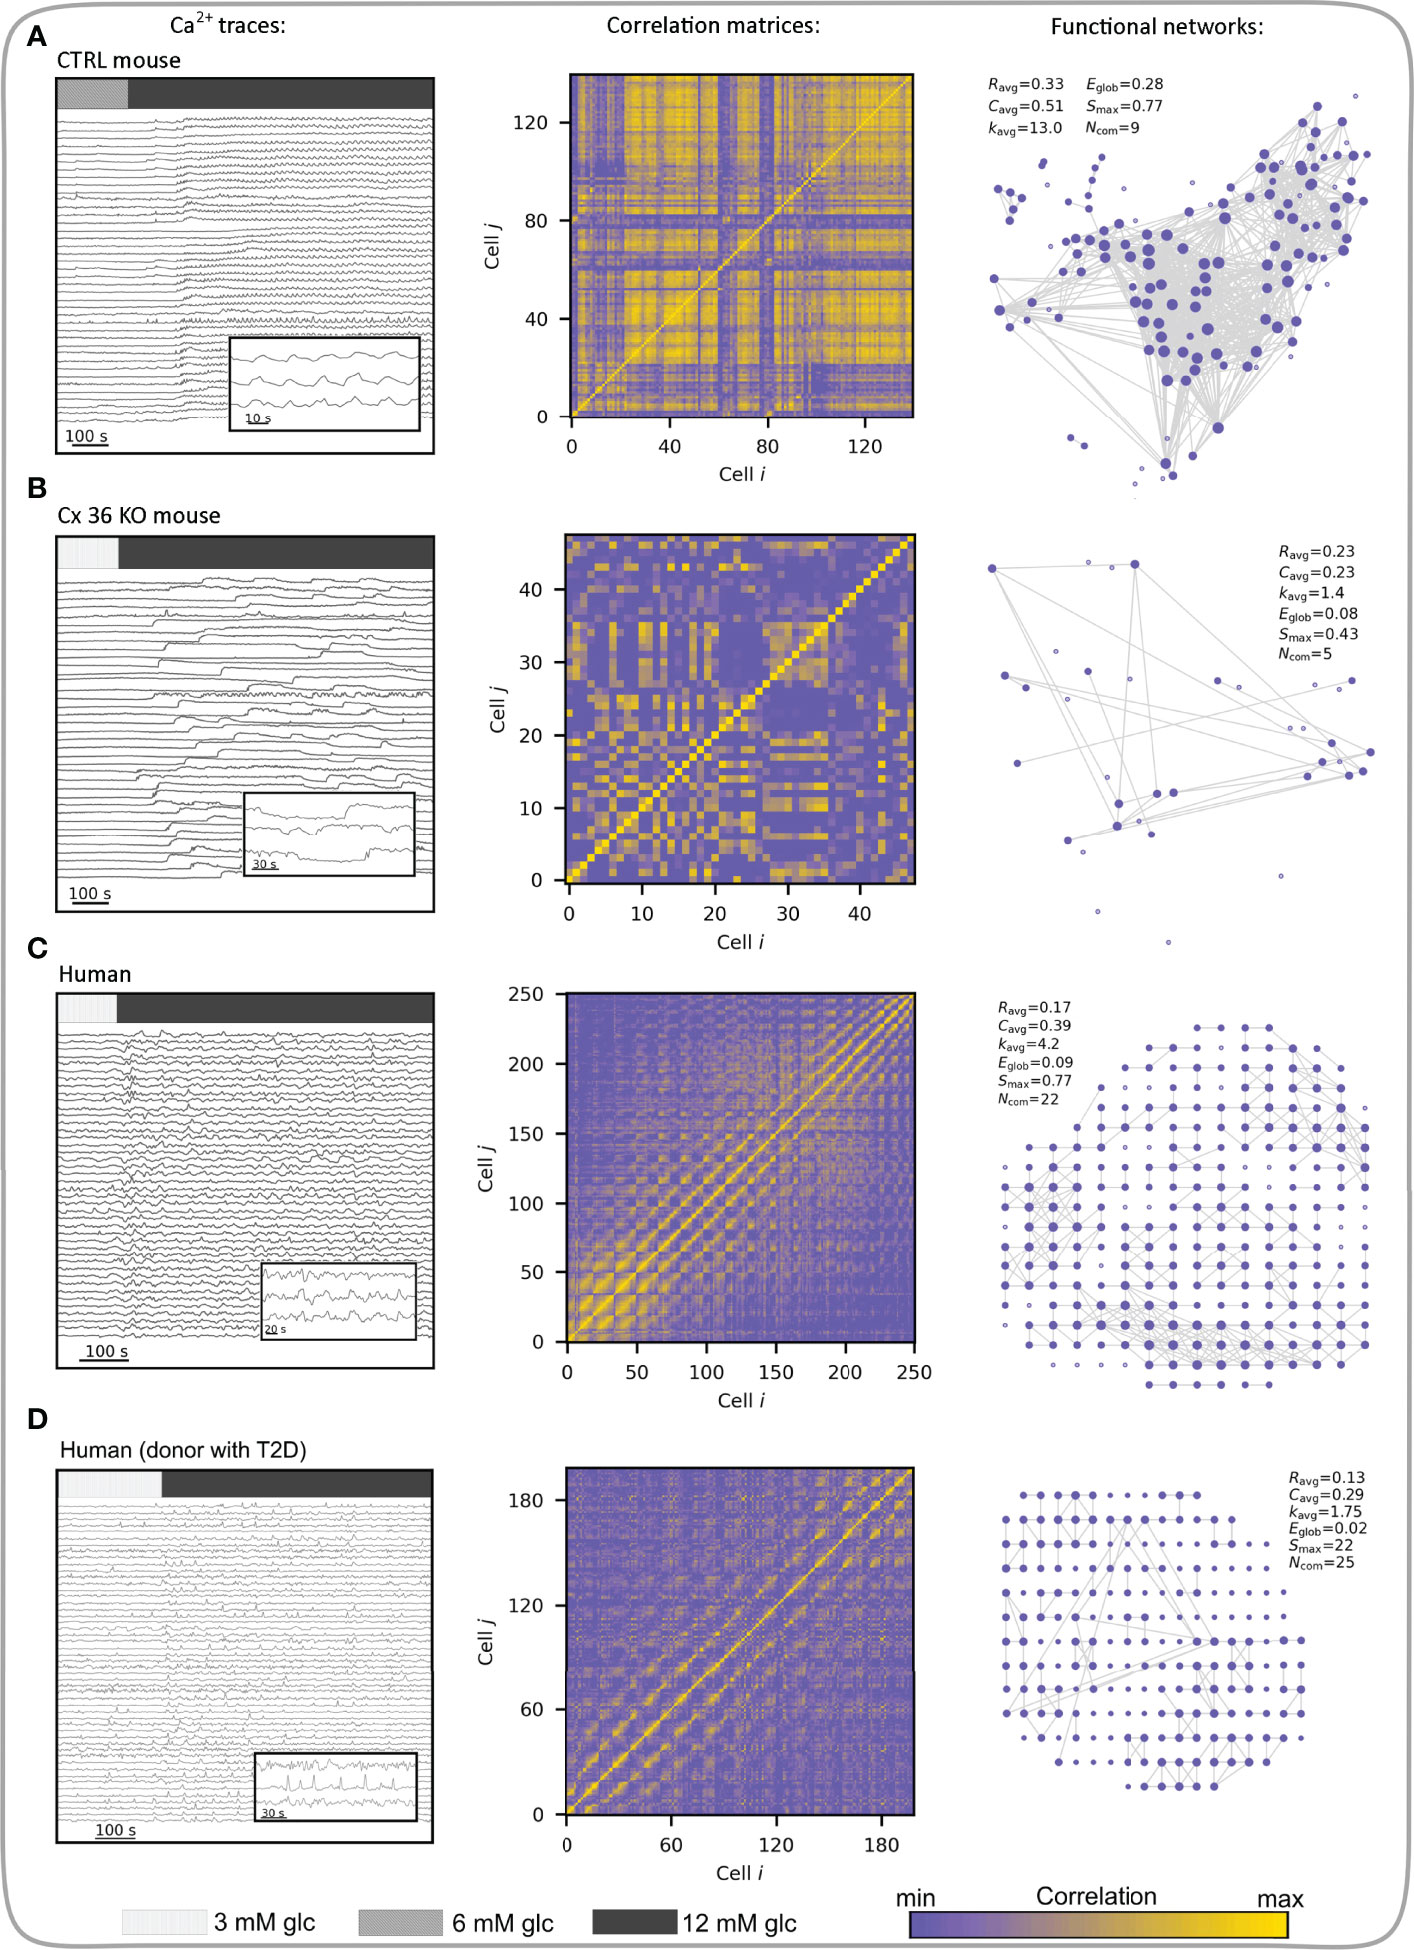
Figure 8 Multicellular activity and functional connectivity maps in a control (wild type) mouse islet (A), an uncoupled (Cx36 KO) mouse islet (B), human islet from a normal donor (C), and human islet from a donor with T2D (D). Left column visualizes Ca2+ activity with indicated stimulation intervals. Bars indicate 3- (light gray), 6- (gray) and 12- (dim gray) mM glucose stimulation. Note that 3 mM glucose was used as the substimulatory concentration in (B-D), as 6 mM can already evoke activity in these islets (unlike in control mouse islets). Inserts show short intervals of selected cellular signals. Middle column features the correlation matrices extracted from Ca2+ signals. Correlation levels between cell pairs are color-coded as indicated with the color bar (the same scale refers to all four panels). In the right column the corresponding functional networks are presented, which were obtained by thresholding the correlation matrices (Rth = 0.7). Along with networks, the key parameters are provided: average correlation (Ravg), average clustering coefficient (Cavg), average network node degree (kavg), global efficiency (Eglob), largest connected component (Smax), and the number of communities (Ncom).
Computational Models of Beta Cell Networks
The new findings by network science about the complex nature of intercellular activity patterns and the specific roles played by certain cells were recognized as theoretically very appealing and have inspired the development of multicellular beta cell models. Mathematical modelling approaches have a long tradition in islet research and have also served as a paradigmatic case study for emergent networks [for excellent reviews see (60, 125, 199–201)], but the interest for the design of multicellular models has increased over the last few years. This is in part due to growing computational resources, which facilitate multiscale simulations of beta cell populations, but also due to advances in experimental techniques, which have provided valuable new data on microarchitecture and intercellular dynamics. Several studies have utilized computational models to investigate how intercellular coupling facilitates beta cell synchronization (138, 202–206) and the propagation of [Ca2+]IC waves (74, 207, 208). In recent years, specific attention has been given to cellular heterogeneity and to how the collective activity emerges from functionally heterogeneous beta cell subpopulations (71, 143, 145, 147, 148, 165, 169, 209). In the context of complex beta cell networks, it has been demonstrated that the coupling scheme between the beta cells represents the basis for the functional connectivity patterns, but the relation relies heavily on various physiological determinants, such as the level of stimulation, cellular noise, and the coupling parameters (210). Multicellular models have also been employed to study the occurrence of long-range connections in functional beta cell networks. Importantly, it has been demonstrated that long-range synchronicity can in principle be established solely by the propagation of excitation waves through nearest-neighbor-coupled networks, if the cells and the coupling strengths are heterogeneous (142, 143, 211). In recent years, particular emphasis has also been given to the role of functional subpopulations, such as hubs and pacemaker cells, although their exact roles remain somewhat debatable. This is in part also due to the inconsistent use of terminology in the literature, but with some more recent papers this aspect is improving (55, 59, 60). It has been shown by numerical simulations that the inclusion of specialized hub cells importantly affects the collective activity on different temporal scales (212). Furthermore, by silencing a few hub cells within the islet it was possible in principle to abolish whole-islet [Ca2+]IC activity in simulations, similarly to what was noted experimentally, but as mentioned before, only close to the threshold glucose stimulation (148). Later studies incorporating in-depth numerical analyses alleviated these findings a bit by showing that removing the metabolically most active and heavily connected cells or cells with the highest intrinsic frequencies does not diminish whole-islet activity (60, 143, 170). These results suggest that the whole-islet [Ca2+]IC activity is probably not driven by a very small (<10%) subpopulation of extraordinary cells and that the islets are robust to loss of small groups of cells, even if they have special attributes, as would be expected for evolutionary robust assemblies of intrinsic oscillators (60, 213). To sum up, the recent theoretical works have partly confirmed some of the recent experimental findings and thereby contributed to our understanding of the complex signaling mechanisms within the islets. However, there is still a long road to drive before we will fully understand how functionally heterogeneous beta cell populations interact among each other, with other cells, and with the dynamical environment by means which may involve paracrine and other modes of intra-islet signaling (214–216), the effect of incretins (217), as well as long feedback loops, for instance between the liver and the pancreas (137). We firmly believe that the tools developed in the field of computational physiology and network science will help us to address these issues and will provide us further insights into functional properties, as well as the underlying mechanisms that guide the multicellular dynamics of endocrine cells.
Frontiers of Islet Network Science: Assessing Multicellular Activity by Multilayer Networks and Going Beyond Calcium
The Many Layers of Multicellular Networks
Pancreatic islets are non-stationary complex systems governed by different oscillatory subsystems, they are characterized by different types of interactions, and their function can be captured with different measures and parameters. Therefore, the standard network approach focusing on single networks in isolation might be insufficient to unveil the functional regulatory patterns originating from complex interactions across multiple layers of physiological relationships and processes. In the last few years, the multilayer network (MLN) formalism has emerged as a new research direction to engage with such multi-dimensional systems (19, 218–221), including in the area of biomedical research (18, 222–224). By means of the MLN formalism, it is possible to track the evolution of interactions among entities over prolonged periods of time, evaluate precisely the changes caused by altered experimental conditions, such as addition of pharmacological substances or the development of a disease, explore the associations between different temporal and spatial scales, and characterize different types of interactions. In this way, a much more precise insight into the architecture and dynamics of biological systems can be acquired, compared to single-layer analyses only. While standard networks can be represented by adjacency matrices (see Figures 4, 8), for MLNs higher-order matrices, i.e., tensors, are required. Formally, to represent connectivity within and between network layers, a supra-adjacency with a block structure matrix is used, in which diagonal blocks encode intra-layer connectivity and off-diagonal blocks encode inter-layer connectivity (Figures 9A, B). This framework allows for expansion of the traditional network analysis by examining interlayer similarity, overlapping (weighted) degrees and other measures, detection of modular super-units, identification of most central units, etc. (225, 226). In the context of beta cell networks, these MLN metrics can be used for example to assess the spatio-temporal beta cell network persistency, to quantify the effects of pharmacological interventions or to identify signal-specific functional subpopulations, as well as to determine how they change with time, as specified in more detail below.
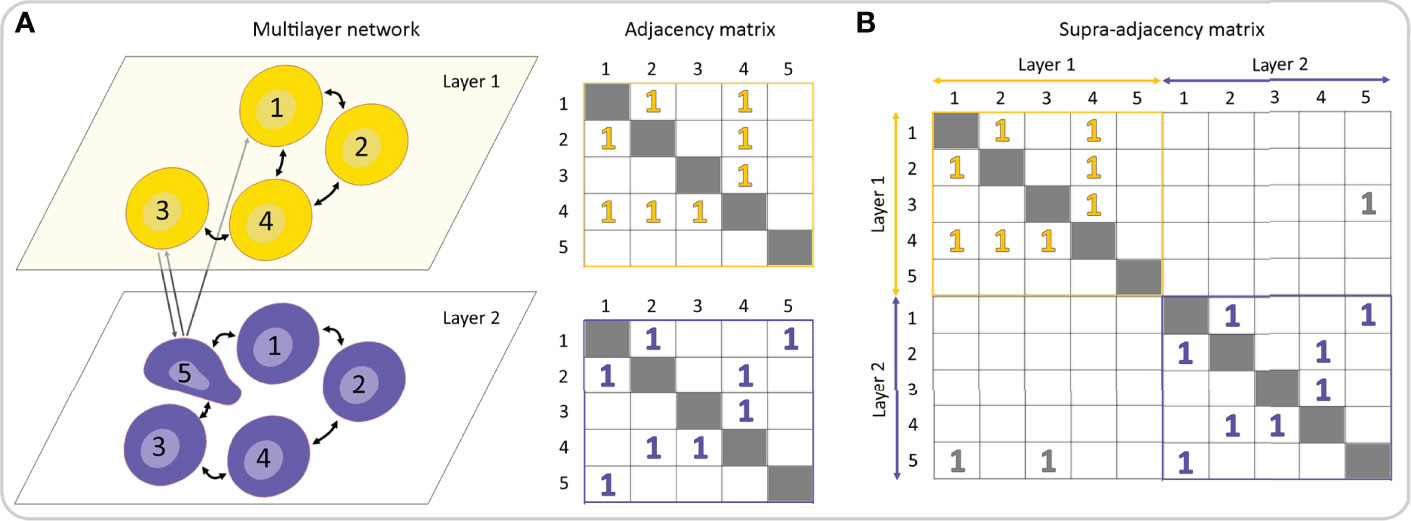
Figure 9 Multilayer representation of a multicellular network. (A) A multilayer network consists of different network layers, each one represented by an adjacency matrix. (B) A rank-2 tensor, generally known as the supra-adjacency matrix, can be used to describe and analyze both intra- and inter-layer connectivity.
To date, biomedical endeavors employing the MLN concepts have been mostly limited to molecular and brain networks. In the former, the MLN formalism is predominantly used to assess the interdependent biochemical networks extracted from linked genomic, proteomic, and metabolomic data (227–230), whereas in the latter, these methods are used to address the temporal evolution of brain networks and rewiring dynamics (231–234), associations among different frequency bands (235–238), and to explore the longstanding issue about the interplay between brain structure and dynamics (36, 239, 240). On the level of tissues and intercellular interactions, the MLN methodological directions are still rather unexplored, even though the number of potential applications is large, particularly in pancreatic islets. We therefore present here some specific examples on how the MLN theory has been and could be further integrated into islet research (Figure 10). They are explained in continuation and encompass the assessment of different temporal scales of oscillatory activity, tracking the network evolution during prolonged stimulations or pharmacological interventions, following the course of the intercellular signals, characterization of heterologous interactions between different cell types, and the evaluation of the multicellular beta cell function by simultaneously acquiring multiple measured variables.
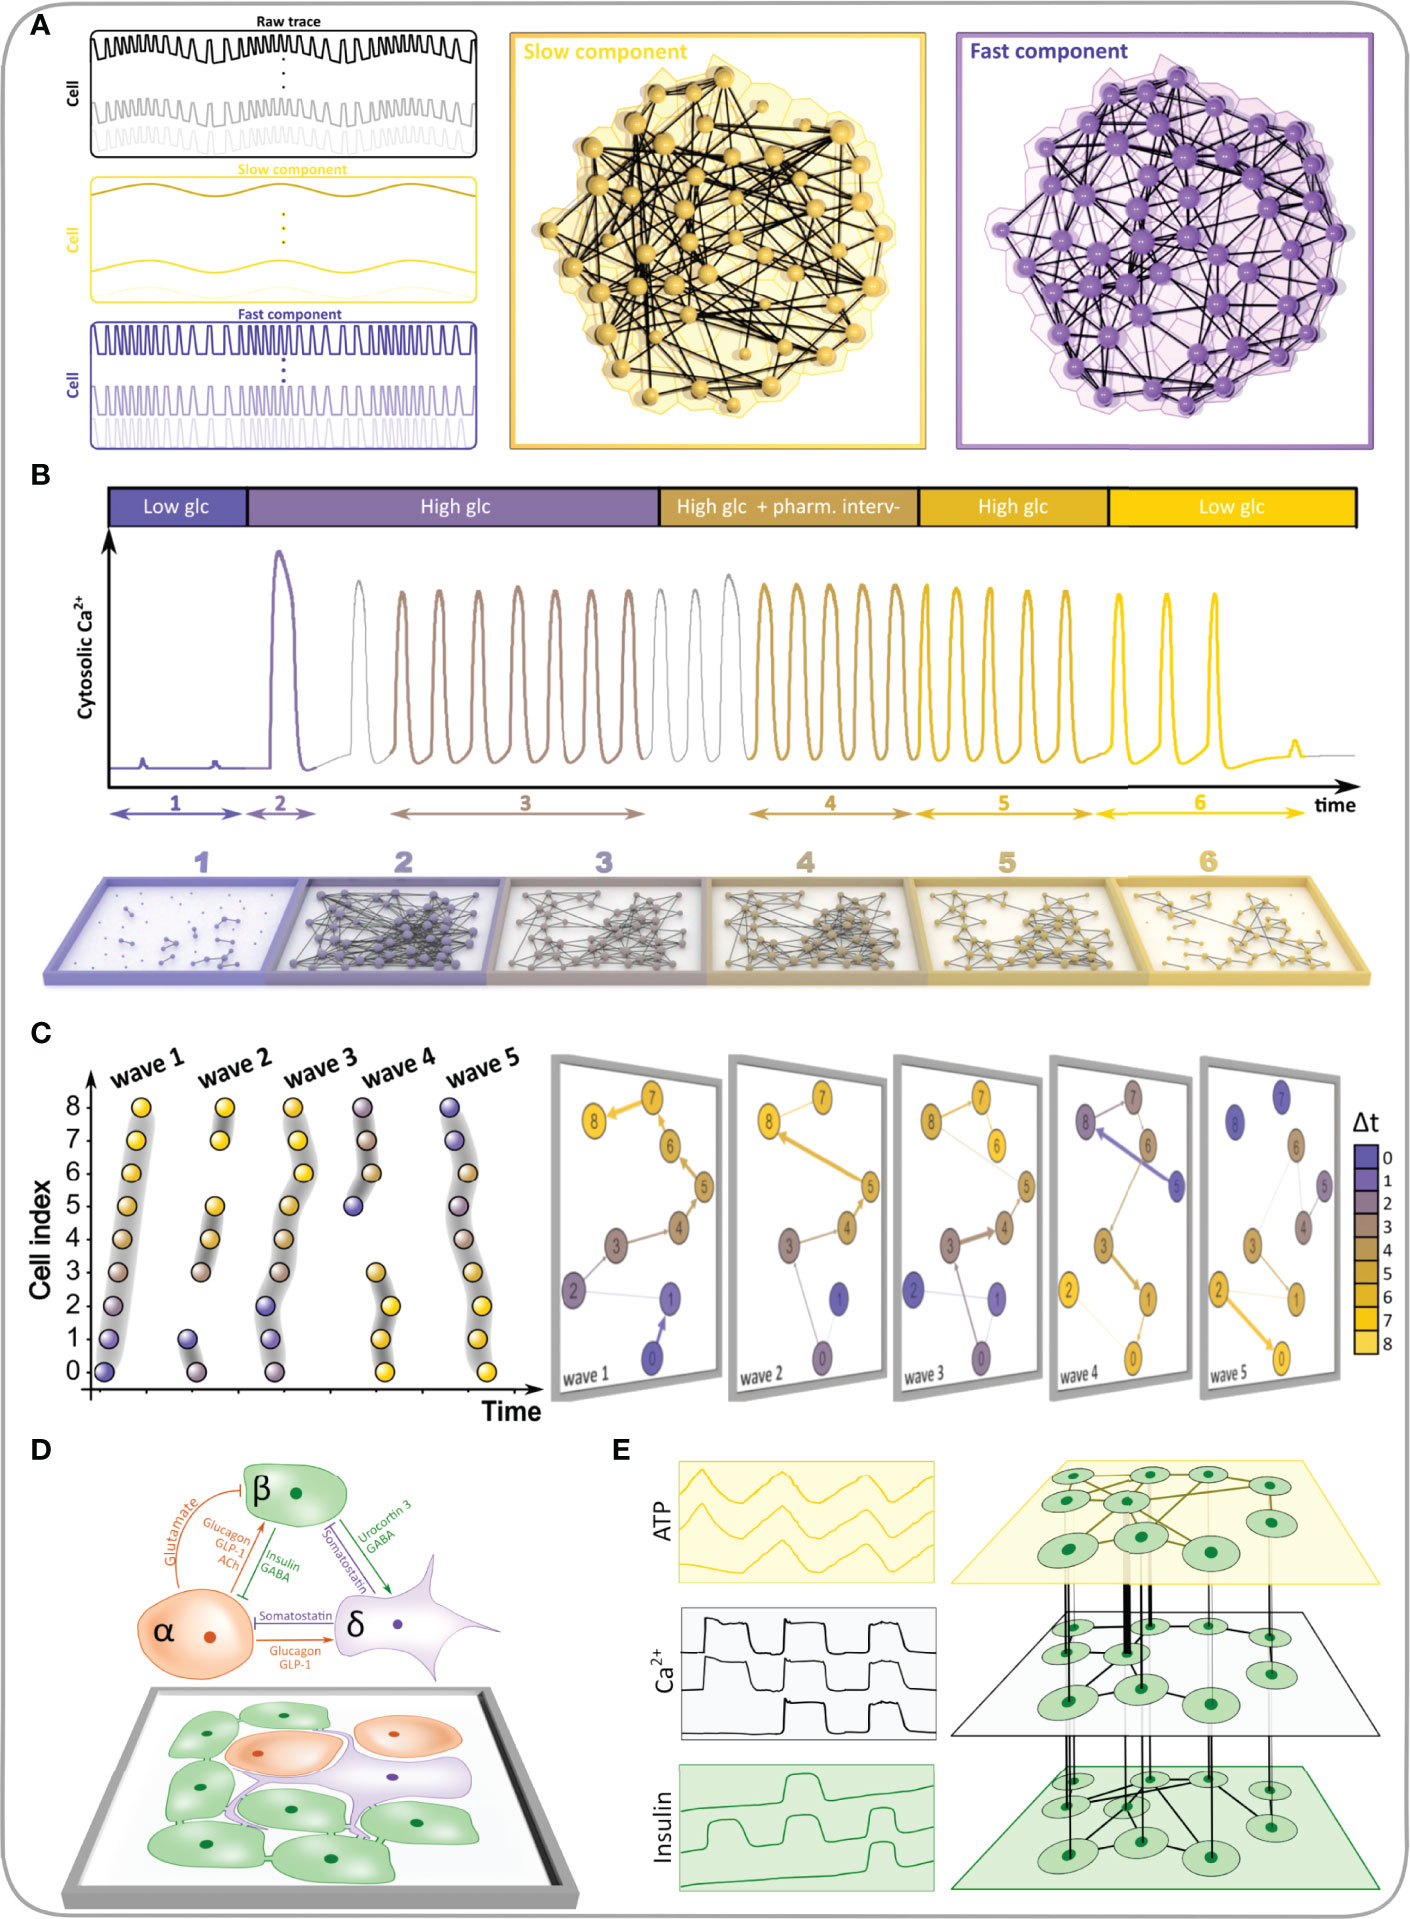
Figure 10 The MLN formalism can be used to study various aspects of collective dynamics and cellular activity patterns within the pancreatic islets. (A) A hypothetical raw [Ca2+]IC signal and the extracted slow and fast components (left panel). The two different oscillatory components are then used to construct a two-layered multiplex functional beta cell network (right panel). (B) Typical [Ca2+]IC activity in a pancreatic islet subjected to a hypothetical protocol (upper panel) and the corresponding temporal functional network layers extracted from specific time intervals (lower panel). (C) A schematic presentation of how network layers are designed from individual intercellular [Ca2+]IC waves. The left panel features a raster plot indicating the onsets of oscillations of cells within specific waves and the right panel visualizes the corresponding network layers. The direction and weights of connections within each layer denote the course and the temporal lag between subsequent oscillation onsets, respectively. (D) Heterologous and homologous interactions within the islets visualized as a multilayer network. (E) Hypothetical simultaneously measured dynamics of [Ca2+]IC, intracellular ATP, and insulin release along with the corresponding functional network layers. Intralayer connections represent functional connections between time series of the same variables, whereas the interlayer connections stand for associations between different measured variables.
Islets as Multilayer Networks
As explained above, mouse beta cells in isolated islets and in pancreatic tissue slices oscillate at different temporal scales when exposed to stimulatory glucose concentrations (56, 130, 241, 242). The slow oscillatory component with a period of several minutes is believed to reflect metabolic activity and drives the oscillatory ATP production (243, 244). Superimposed on the slow and sometimes occurring without them are so-called fast [Ca2+]IC oscillations with a glucose-dependent frequency of around 5 min-1 and duration of around 2-15 s (55, 131, 159, 160), which reflect the bursting pattern of electrical activity. Both slow and fast oscillations are synchronized between different beta cells of the same islet and contribute to proper secretion patterns (133, 137, 140, 141, 245). To quantify how the multimodal oscillatory pattern manifests itself on the multicellular level, a multiplex network representation can be used (56). More specifically, using a band-pass filter, the slow and fast oscillatory component can be extracted separately from the [Ca2+]IC recordings, and these signals can be used to construct individual network layers, as demonstrated in Figure 10A. Previous analyses have shown that the slow oscillations are more global, resulting in several long-range connections and networks extracted from them have a more cohesive structure compared to the networks based on fast oscillations. Moreover, there was only a weak relation between the fast and slow network layer characteristics, which suggests that different synchronization mechanisms shape the collective cellular activity in islets (56). Of note, a conceptually similar approach is commonly applied in neuroscience to construct frequency band-specific multi-layered functional brain networks (236, 237). Within this new framework, each region of the brain is mapped into a network node and replicated across all layers encoding frequency bands. Such representation of functional connectivity is better able to distinguish between brain functional connectivity patterns in health and disease (246).
The second conceivable frontier of network analyses is the investigation of network dynamics. The so-called temporal networks offer mathematically principled models of evolving networks. as well as a battery of statistical variables to characterize their evolution (19, 218). Layers are to that purpose typically generated on the basis of a series of (possibly overlapping) time windows and the nodes are linked only across sequential replicas to indicate identity. Mapping the temporal changes in connectivity patterns is meaningful in biomedical sciences as well (231, 247, 248) and could be very beneficial for the description of information flow and dynamic interaction patterns within the islets. More specifically, the activity patterns in these mini-organs are remarkably complex already under constant stimulation (147), and even more in a dynamic in vivo environment (67, 249, 250). In this vein, the multilayer model for time-varying networks could be used to explore fluctuations in functional connectivity during prolonged or variable stimulation of cells, as well as to assess the functional adaptation and plasticity after repeated stimulations (48, 63). Moreover, from the viewpoint of the recent developments in the field, MLN could represent a viable approach to track the network evolution after targeting specific cells via optogenetic and photopharmacological strategies (59, 64). In addition, with this approach one could track the changes in islets during diet-induced pathogenesis by monitoring the activity in islets transplanted into the anterior chamber of the eye (67, 249). In Figure 10B, a hypothetical scenario is presented, illustrating how the average temporal activity and the corresponding functional connectivity maps evolve when islets are subjected to stimulation by candidate drugs.
Third, [Ca2+]IC waves are the main synchronizing mechanism between beta cells and their course depends heavily on cellular heterogeneity and intercellular interaction patterns. Because of the rich information encoded in individual waves, they represent the perfect candidates for being studied via MLN analysis. By this means, each individual wave can be regarded as an individual layer in which the connections are weighted and directed. We wish to point out that this is in stark contrast with the traditional way of constructing networks based on longer time series that include many waves and are based on similarity measures. The directionality of connections indicates the path of the intercellular signal, and the weights reflect the temporal delay between cell pairs that are subsequently activated along the course (69). We schematically present this approach in Figure 10C. On the left panel the activation sequence of 9 cells in 5 waves is shown in the form of a raster plot, and on the right panel the corresponding directed and weighted networks of waves are shown in their temporal order. Notably, we leveraged this approach in a recent study where we quantified the differences in collective beta cell activity between prolonged glucose stimulation only and stimulation by glucose and the NMDA receptor inhibitor MK-801 (69), which was previously shown to increase beta cell activity and synchronicity (186, 187). In our study, we focused on the velocity of intercellular [Ca2+]IC waves and their temporal stability. Since each layer encodes the exact path of the wave (direction of connections) and the time delays between cells (weights of connections), one can compute the exact wave propagation velocity based on the geodesic path length between wave initiator cells and the last cells that activated as the sum of the weights of this path. Our analysis revealed that the propagation velocity did not change either under prolonged stimulation with glucose or under the action of NMDA receptor inhibitor. However, when quantifying the inter-layer similarity, we found that the wave initiator regions and the stability of wave paths increased dramatically when the NMDA receptors were inhibited. In this manner, we were able to identify the key factor underlying the more synchronous behavior. As such, the proposed methodology can help quantitatively evaluate the impact of pharmacological interventions on multicellular dynamics beyond classical physiological or network parameters and is applicable to other secretagogues and multicellular systems as well.
Fourth, the pancreatic islets are multicellular micro-organs that comprise predominantly alpha, beta, delta cells and communication among them is essential for proper function (73, 214, 251, 252). While direct electrical coupling through gap-junctions is the key determinant ensuring synchronous beta cell activity (76, 77) and was also found to be present between beta and delta cells (253, 254), islet cells also communicate by paracrine, autocrine, and other juxtacrine signaling pathways (73, 215, 252). It is well known that this variety of intercellular signal mechanisms is essential for a synergistic cooperation between islet cells and this represents one of the most vibrant issues in islet cell biology. With the recent advances in multicellular imaging of islet networks, our ability to dissect individual components of cell-cell communication has much improved (73). In this regard, the MLN formalism could be advantageous by providing the means to decipher the complexity of islet communication. In Figure 10D we illustrate a MLN representation of the endocrine cell crosstalk within the islets with some of their paracrine interactions. Within the framework of the MLN paradigm, networks of different types of cells could be constructed based on their [Ca2+]IC signals and compared with networks based on the physical positions of cells and their paracrine or other interactions. Additionally, the relative contributions of different local signals could be dissected using the MLN approach through application of different agonists and antagonists as described in the second paragraph above. Interestingly, in a similar context, the MLN approaches have already been used to study the neural network of C. elegans by using multiple layers to represent different types of connections between neurons, which has led to novel findings about the functional organization of this famous neuronal network (255, 256). Very recently, muscle cells and further modes of interactions between cells have been incorporated as additional layers to this scheme, providing thereby an even deeper knowledge of the C. elegans connectome (257). Along similar lines, Virkar et al. proposed a multilayer network to study diffusive transport of metabolic resources among the glial network and to the synapses in the neuronal network layer (258).
Finally, as illustrated at length above, intracellular [Ca2+]IC responses of islet beta cells represent an accessible and well-characterized approach to assess islet activity, with tremendous insight to be gained about islet behavior. However, stimulus-secretion coupling involves several steps from receptor binding or metabolism of a secretagogue to membrane depolarization and secretion of insulin granules (133, 259–261). These intracellular signaling steps interact with each other and are finely tuned by additional physiological, pathological, and pharmacological triggering and amplifying factors (133, 141, 262, 263). The [Ca2+]IC signal itself is determined by a number of upstream processes that include glucose entry, cellular and mitochondrial metabolism, and electrical responses leading to action potential-dependent Ca2+ entry and an interplay with intracellular buffering and storage mechanisms (216, 261, 264). It is important to note that Ca2+ is not just an indicator of cellular activity but is indeed a key mediator for downstream processes required for insulin secretion itself (265), where a glucose-stimulated uptake of Ca2+ (266) triggers the fusion of insulin granules with the cell plasma membrane to elicit insulin release by exocytosis (267–269). Thus, while Ca2+ is generally a good indicator of islet cell activity, it is not reporting all relevant cell physiological processes, and indeed may not always be directly concordant with insulin secretory function. As one example, glucose stimulation can stimulate insulin secretion even when [Ca2+]IC is clamped (270). Moreover, in (pre)diabetes increased efficacy of Ca2+ on the secretory apparatus can directly enhance insulin secretion (174, 271). Thus, to what extent multi-modal profiling of islet network activity should be undertaken to better understand islet behavior and dysfunction in disease? The most obvious methodological approaches to provide additional layers of data would involve simultaneous imaging of physiological processes either up- or down-stream of [Ca2+]IC dynamics. Although the candidates described below are certainly not an exhaustive list, several measures may be considered when adding additional layers of information to these networks. More specifically, individual steps of the stimulus-secretion coupling cascade could form individual layers of MLNs and the interactions between the steps would constitute inter-layer connectivity. To date, several candidates for individual layers meet the criterion of being experimentally measurable and having an adequate spatial and temporal resolution, as well as ranging from the most proximal to the most distal steps. We wish to point out that genetically encoded sensors (including for Ca2+) may allow greater specificity in measurements when targeted to the cell cytosol, mitochondria, or other relevant intracellular organelles or sub-cellular locations, and greater cell specificity when expressed under the control of relevant promotors (for example the insulin promoter) in engineered model animals, such as mice or zebrafish, or when delivered to human islet cells, typically by adenoviral vectors (181).
If we follow the stimulus-secretion coupling cascade, although cellular glucose uptake can be measured using a fluorescent probe (272), and this can be combined with [Ca2+]IC responses in islet cells (273), additional information on the metabolic activity of islet cells can also be gained using approaches that more directly assess relevant metabolic signals. In this regard, sensors reporting glycolysis (the most proximal signaling step) have provided insight into the regulation of oscillatory metabolic activity and can be characterized by oscillations in phosphofructokinase-1 (PFK1) activity and its product fructose-1,6-bisphosphate (FBP) (274), and pyruvate kinase activity (244, 275). Moreover, several approaches to monitor mitochondrial or cellular metabolic function have been adopted for use in pancreatic islets over the last decades. NAD(P)H autofluorescence is a long-used indicator of islet cell metabolic function (276–278), the signal which is generally dominated by mitochondrial activity (279). Chemical probes reporting mitochondrial membrane potential have been used to monitor mitochondrial activity within islets coincident with [Ca2+]IC responses (244, 280, 281). Additionally, mitochondrial oscillations can be optically monitored by measuring the signals from mitochondrial flavins (244). Furthermore, sensors for NADPH (282) or H2O2 (283) have provided insight into redox-dependent control of islet function. Genetically encoded probes for ATP have revealed signaling microdomains (284) and the relationship between mitochondrial Ca2+ and cytosolic ATP/ADP ratios (285). Combined imaging of these and other relevant metabolic signals and mitochondrial function (including lactate, glutamate, and mitochondrial pH) have recently provided important insight into the metabolic control of insulin secretion and prompted a reconsideration of the consensus model for stimulus-secretion coupling (286). New and improved genetically-encoded probes for key signaling molecules, for example recent new probes for citrate (287) and lactate (288), may also provide for improved imaging to allow collection of additional layers of data relating metabolic and [Ca2+]IC networks in islets.
Although the abovementioned approaches can all be combined with Ca2+ signaling networks, it is worth noting that other relevant signals can be assessed. Imaging of islet cell membrane potential has been accomplished using small molecule voltage-sensitive probes (289), and may perhaps be more robustly measured using newer genetically encoded voltage indicators (290). Moreover, optogenetic control of islet function is also feasible in transgenic models (291). Further, as already mentioned, signaling by G-protein coupled receptors via second messengers, such as cAMP, is important in both physiology and diabetes treatment (292), and such second messengers are even important for the maintenance of beta-cell activity at a baseline level (293). Genetically encoded probes for cAMP demonstrate glucose-dependent cAMP responses (182) and intra-islet signaling (294). Finally, approaches to monitor the downstream process of insulin secretion from islet cells of intact islets typically involve the visualization of extracellular probes at a cellular resolution. This can include the visualization of zinc ions (Zn2+) released into the extracellular space concomitantly with insulin (295). Indeed, many Zn2+-binding dyes suitable for this purpose are available (296). Markers of the extracellular volume, such as sulphorhodamine B, have also been used to monitor insulin secretion from individual cells within islets (297), including evaluation of the spatiotemporal control of individual insulin exocytosis event (298). Thus, in the context of intact islet cellular network activity as measured by [Ca2+]IC responses, abundant opportunity exists to add additional layers assessing upstream (metabolism, cAMP), coincident (voltage responses), and downstream (exocytosis) physiological processes. Figure 10E shows an example of an MLN that comprises oscillations in [Ca2+]IC (upper panel), out-of-phase oscillations in [ATP]IC (middle panel), and in-phase oscillations in secreted insulin (lower panel). Along the same line, the MLN approach has already been used to elucidate the relationship between functional connectivity patterns based on membrane potential and [Ca2+]IC signals (299). In perspective, such approach may be for instance instrumental in dissecting the properties of first responders, wave initiators, hubs, and other cells in terms of their biochemical properties, their sensitivity to glucose, and their secretory potential. In other words, MLNs may help address the question whether a cell that seems to be important in one layer also has any special roles in other layers.
Network-based analyses of islets of Langerhans are typically studied in islets isolated from the pancreas and therefore lacking in the extracellular matrix, vascularization, and innervation that play important roles in signal transduction (300). However, other models may allow the observation and construction of islet cell networks during development, after transplantation into a live animal, and in the context of disease. The tissue slice approach can be regarded as a first in the series of possible upgrades to conditions that are closer to the in vivo situation (301–303). Further, the zebrafish Danio rerio is transparent during development and thus has islet tissue that can be readily visualized (304). By introducing stable fluorescent probes, zebrafish can therefore be a model for studying glucose-stimulated [Ca2+]IC dynamics in islet cells within the local microenvironment. A similarly transparent site is the anterior chamber of the eye of rodents, where islets can be transplanted, become highly vascularized, and [Ca2+]IC dynamics can be visualized (249). This site can be used to study not only human or mouse islet networks in an environment closer to the native pancreas, but also the characteristics of networks and cell-cell signaling in developing stem cell-derived islet-like clusters (305). Moreover, this approach can be employed in the context of a model for type 1 diabetes, wherein beta cells are attacked by the immune system (306), and in the context of type 2 diabetes using high fat diet or other rodent models (271), or donor islets from people who lived with the disease (249). Combining and comparing network properties from isolated islets and islets analyzed in situ will continue to offer insights into islet communication, both in non-diabetic and diabetic states.
Conclusion
Since the end of the 20th century, complex networks have become a common and irreplaceable language in interdisciplinary studies and over the last two decades, the field of network science has experienced an explosive growth (98, 307). The research interests have evolved in several directions, from social and economic systems (3, 308, 309), to a wide range of engineered and technological systems (86, 87, 310), and to the more recently developing field of multilayered networks (19, 219). Guided by the advances in high-throughput data-collection and imaging techniques, network analyses are also becoming an indispensable tool in biomedical sciences across multiple disciplines and levels of organization (15, 36, 82, 85), including in studies of intercellular interactions in tissues (18, 59). Understanding how heterogeneous populations of interconnected cells in a dynamic and noisy environment operate to ensure proper function is very appealing and challenging to investigate. In the present contribution, we focused on how the network approaches have been and can be used to study the pancreatic islets of Langerhans. Work in this field has stimulated research collaborations across different disciplines, from experimental to advanced modelling and computational approaches (58–60, 124, 141, 242, 263). For such collaborations to be even more fruitful in the future, experimentalists need to have a good basic understanding of network science and network scientists need to have a detailed understanding of islet biology. In our view, this is today even more important than it was at the birth of islet networks a decade ago, since the number of experimental and analytical options is increasing at an unprecedented pace. Our wish for the present review is to serve as an information hub for islet biologists and network scientists, helping them navigate through the complex network of existing knowledge and future options and finding the way to each other.
Author Contributions
All authors listed have made a substantial, direct, and intellectual contribution to the work, and approved it for publication.
Funding
The work presented in this study was financially supported by the Slovenian Research Agency (research core funding Nos. P3-0396, P1-0055 and I0-0029, as well as research projects Nos. J3-3077, J1-2457, J3-9289, N3-0048, N3-0170, and N3-0133). PM holds the Canada Research Chair in Islet Biology.
Conflict of Interest
The authors declare that the research was conducted in the absence of any commercial or financial relationships that could be construed as a potential conflict of interest.
Publisher’s Note
All claims expressed in this article are solely those of the authors and do not necessarily represent those of their affiliated organizations, or those of the publisher, the editors and the reviewers. Any product that may be evaluated in this article, or claim that may be made by its manufacturer, is not guaranteed or endorsed by the publisher.
Acknowledgments
We thank Maruša Rošer, Rudi Mlakar, and Maša Čater for excellent technical assistance.
Footnotes
- ^ In the case of points with only even numbers of lines attached to them, it does not matter where the walk starts. In the case with two points with odd numbers of lines attached to them, the walk must start in one of them.
References
3. Jusup M, Holme P, Kanazawa K, Takayasu M, Romić I, Wang Z, et al. Social Physics. Phys Rep (2022) 948:1–148. doi: 10.1016/J.PHYSREP.2021.10.005
5. Barabási A-L, Pósfai M. Network Science. Cambridge: Cambridge University Press (2016). Available at: http://barabasi.com/networksciencebook/.
6. Watts DJ, Strogatz SH. Collective Dynamics of ‘Small-World’ Networks. Nature (1998) 393:440–2. doi: 10.1038/30918
7. Newman MEJ. The Structure and Function of Complex Networks. SIAM Rev (2003) 45:167–256. doi: 10.1137/S003614450342480
8. Amaral LAN, Scala A, Barthélémy M, Stanley HE. Classes of Small-World Networks. Proc Natl Acad Sci (2000) 97:11149–52. doi: 10.1073/PNAS.200327197
9. Havlin S, Kenett DY, Ben-Jacob E, Bunde A, Cohen R, Hermann H, et al. Challenges in Network Science: Applications to Infrastructures, Climate, Social Systems and Economics. Eur Phys J Spec Top (2012) 214:273–93. doi: 10.1140/epjst/e2012-01695-x
10. Costa LDF, Oliveira ON, Travieso G, Rodrigues FA, Villas Boas PR, Antiqueira L, et al. Analyzing and Modeling Real-World Phenomena With Complex Networks: A Survey of Applications. Adv Phys (2011) 60:329–412. doi: 10.1080/00018732.2011.572452
11. Barabási AL, Albert R. Emergence of Scaling in Random Networks. Science (1999) 286:509–12. doi: 10.1126/science.286.5439.509
12. Goh K, Oh E, Jeong H, Kahng B, Kim D. Classification of Scale-Free Networks. Proc Natl Acad Sci U S A (2002) 99:12583–8. doi: 10.1073/PNAS.202301299
13. Barabási AL. Scale-Free Networks: A Decade and Beyond. Science (2009) 325:412–3. doi: 10.1126/science.1173299
14. Broido AD, Clauset A. Scale-Free Networks are Rare. Nat Commun (2019) 10:1017. doi: 10.1038/s41467-019-08746-5
15. Barabási AL, Gulbahce N, Loscalzo J. Network Medicine: A Network-Based Approach to Human Disease. Nat Rev Genet (2011) 12:56–68. doi: 10.1038/nrg2918
16. Mason O, Verwoerd M. Graph Theory and Networks in Biology. IET Syst Biol (2007) 1:89–119. doi: 10.1049/iet-syb:20060038
17. Bullmore E, Sporns O. Complex Brain Networks: Graph Theoretical Analysis of Structural and Functional Systems. Nat Rev Neurosci (2009) 10:186–98. doi: 10.1038/nrn2575
18. Gosak M, Markovič R, Dolenšek J, Slak Rupnik M, Marhl M, Stožer A, et al. Network Science of Biological Systems at Different Scales: A Review. Phys Life Rev (2018) 24:118–35. doi: 10.1016/j.plrev.2017.11.003
19. Kivelä M, Arenas A, Barthelemy M, Gleeson JP, Moreno Y, Porter MA, et al. Multilayer Networks. J Complex Networks (2014) 2:203–71. doi: 10.1093/comnet/cnu016
20. Korcsmaros T, Schneider MV, Superti-Furga G. Next Generation of Network Medicine: Interdisciplinary Signaling Approaches. Integr Biol (2017) 9:97–108. doi: 10.1039/C6IB00215C
21. Conte F, Fiscon G, Licursi V, Bizzarri D, D’Antò T, Farina L, et al. A Paradigm Shift in Medicine: A Comprehensive Review of Network-Based Approaches. Biochim Biophys Acta - Gene Regul Mech (2020) 1863:194416. doi: 10.1016/j.bbagrm.2019.194416
22. Bashan A, Bartsch RP, Kantelhardt JW, Havlin S, Ivanov PC. Network Physiology Reveals Relations Between Network Topology and Physiological Function. Nat Commun (2012) 3:1–9. doi: 10.1038/ncomms1705
23. Fu F, Christakis NA, Fowler JH. Dueling Biological and Social Contagions. Sci Rep (2017) 7:43634. doi: 10.1038/srep43634
24. Maniatis T, Reed R. An Extensive Network of Coupling Among Gene Expression Machines. Nature (2002) 416:499–506. doi: 10.1038/416499a
25. Uetz P, Giot L, Cagney G, Mansfield TA, Judson RS, Knight JR, et al. A Comprehensive Analysis of Protein–Protein Interactions in Saccharomyces Cerevisiae. Nature (2000) 403:623–7. doi: 10.1038/35001009
26. Maslov S, Sneppen K. Specificity and Stability in Topology of Protein Networks. Science (2002) 296:910–3. doi: 10.1126/science.1065103
27. Csermely P, Korcsmáros T, Kiss HJM, London G, Nussinov R. Structure and Dynamics of Molecular Networks: A Novel Paradigm of Drug Discovery: A Comprehensive Review. Pharmacol Ther (2013) 138:333–408. doi: 10.1016/J.PHARMTHERA.2013.01.016
28. Van Diessen E, Diederen SJH, Braun KPJ, Jansen FE, Stam CJ. Functional and Structural Brain Networks in Epilepsy: What Have We Learned? Epilepsia (2013) 54:1855–65. doi: 10.1111/epi.12350
29. Menche J, Sharma A, Kitsak M, Ghiassian SD, Vidal M, Loscalzo J, et al. Uncovering Disease-Disease Relationships Through the Incomplete Interactome. Science (2015) 347:1257601. doi: 10.1126/science.1257601
30. Pawson T, Linding R. Network Medicine. FEBS Lett (2008) 582:1266–70. doi: 10.1016/J.FEBSLET.2008.02.011
31. Araujo RP, Liotta LA, Petricoin EF. Proteins, Drug Targets and the Mechanisms They Control: The Simple Truth About Complex Networks. Nat Rev Drug Discov (2007) 6:871–80. doi: 10.1038/nrd2381
32. Ebrahimi A, Nowzari-Dalini A, Jalili M, Masoudi-Nejad A. Target Controllability With Minimal Mediators in Complex Biological Networks. Genomics (2020) 112:4938–44. doi: 10.1016/j.ygeno.2020.09.003
33. Lehnertz K, Bröhl T, Rings T. The Human Organism as an Integrated Interaction Network: Recent Conceptual and Methodological Challenges. Front Physiol (2020) 11:598694. doi: 10.3389/fphys.2020.598694
34. Ivanov PCH, Liu KKL, Bartsch RP. Focus on the Emerging New Fields of Network Physiology and Network Medicine. New J Phys (2016) 18:100201. doi: 10.1088/1367-2630/18/10/100201
35. Ivanov PC. The New Field of Network Physiology: Building the Human Physiolome. Front Netw Physiol (2021) 1:711778. doi: 10.3389/fnetp.2021.711778
37. Douw L, van Dellen E, Gouw AA, Griffa A, de Haan W, van den Heuvel M, et al. The Road Ahead in Clinical Network Neuroscience. Netw Neurosci (2019) 3:969–93. doi: 10.1162/NETN_A_00103
38. Lin A, Liu KKL, Bartsch RP, Ivanov PC. Dynamic Network Interactions Among Distinct Brain Rhythms as a Hallmark of Physiologic State and Function. Commun Biol (2020) 3:197. doi: 10.1038/s42003-020-0878-4
39. Radmanesh M, Jalili M, Kozlowska K. Activation of Functional Brain Networks in Children With Psychogenic Non-Epileptic Seizures. Front Hum Neurosci (2020) 14:339. doi: 10.3389/fnhum.2020.00339
40. Perin R, Berger TK, Markram H. A Synaptic Organizing Principle for Cortical Neuronal Groups. Proc Natl Acad Sci (2011) 108:5419–24. doi: 10.1073/pnas.1016051108
41. Feldt Muldoon S, Soltesz I, Cossart R. Spatially Clustered Neuronal Assemblies Comprise the Microstructure of Synchrony in Chronically Epileptic Networks. Proc Natl Acad Sci (2013) 110:3567–72. doi: 10.1073/pnas.1216958110
42. Malmersjö S, Rebellato P, Smedler E, Planert H, Kanatani S, Liste I, et al. Neural Progenitors Organize in Small-World Networks to Promote Cell Proliferation. Proc Natl Acad Sci (2013) 110:E1524–32. doi: 10.1073/pnas.1220179110
43. Abel JH, Meeker K, Granados-Fuentes D, St. John PC, Wang TJ, Bales BB, et al. Functional Network Inference of the Suprachiasmatic Nucleus. Proc Natl Acad Sci (2016) 113:4512–7. doi: 10.1073/pnas.1521178113
44. Spencer C, Tripp E, Fu F, Pauls S. Evolutionary Constraints on Connectivity Patterns in the Mammalian Suprachiasmatic Nucleus. Front Netw Physiol (2021) 1:716883. doi: 10.3389/fnetp.2021.716883
45. Pires M, Raischel F, Vaz SH, Cruz-Silva A, Sebastião AM, Lind PG. Modeling the Functional Network of Primary Intercellular Ca2+ Wave Propagation in Astrocytes and its Application to Study Drug Effects. J Theor Biol (2014) 356:201–12. doi: 10.1016/J.JTBI.2014.04.024
46. Hodson DJ, Molino F, Fontanaud P, Bonnefont X, Mollard P. Investigating and Modelling Pituitary Endocrine Network Function. J Neuroendocrinol (2010) 22:1217–25. doi: 10.1111/j.1365-2826.2010.02052.x
47. Hodson DJ, Romanò N, Schaeffer M, Fontanaud P, Lafont C, Fiordelisio T, et al. Coordination of Calcium Signals by Pituitary Endocrine Cells in Situ. Cell Calcium (2012) 51:222–30. doi: 10.1016/J.CECA.2011.11.007
48. Gosak M, Markovič R, Fajmut A, Marhl M, Hawlina M, Andjelić S. The Analysis of Intracellular and Intercellular Calcium Signaling in Human Anterior Lens Capsule Epithelial Cells With Regard to Different Types and Stages of the Cataract. PLoS One (2015) 10:e0143781. doi: 10.1371/journal.pone.0143781
49. Gosak M, Gojić D, Spasovska E, Hawlina M, Andjelic S. Cataract Progression Associated With Modifications in Calcium Signaling in Human Lens Epithelia as Studied by Mechanical Stimulation. Life (2021) 11:369. doi: 10.3390/life11050369
50. Verma A, Antony AN, Ogunnaike BA, Hoek JB, Vadigepalli R. Causality Analysis and Cell Network Modeling of Spatial Calcium Signaling Patterns in Liver Lobules. Front Physiol (2018) 9:1377. doi: 10.3389/FPHYS.2018.01377
51. Stevenson AJ, Vanwalleghem G, Stewart TA, Condon ND, Lloyd-Lewis B, Marino N, et al. Multiscale Imaging of Basal Cell Dynamics in the Functionally Mature Mammary Gland. Proc Natl Acad Sci (2020) 117:26822–32. doi: 10.1073/PNAS.2016905117/
52. Wilson C, Zhang X, Lee MD, MacDonald M, Heathcote HR, Alorfi NMN, et al. Disrupted Endothelial Cell Heterogeneity and Network Organization Impair Vascular Function in Prediabetic Obesity. Metabolism (2020) 111:154340. doi: 10.1016/J.METABOL.2020.154340
53. Marolt U, Pohorec V, Lipovšek S, Venglovecz V, Gál E, Ébert A, et al. Calcium Imaging in Intact Mouse Acinar Cells in Acute Pancreas Tissue Slices. PLoS One (2022). doi: 10.1371/journal.pone.0268644
54. Hodson DJ, Mitchell RK, Bellomo EA, Sun G, Vinet L, Meda P, et al. Lipotoxicity Disrupts Incretin-Regulated Human β Cell Connectivity. J Clin Invest (2013) 123:4182–94. doi: 10.1172/JCI68459
55. Stožer A, Klemen MS, Gosak M, Bombek LK, Pohorec V, Rupnik MS, et al. Glucose-Dependent Activation, Activity, and Deactivation of Beta Cell Networks in Acute Mouse Pancreas Tissue Slices. Am J Physiol - Endocrinol Metab (2021) 321:E305–23. doi: 10.1152/AJPENDO.00043.2021
56. Zmazek J, Klemen MS, Markovič R, Dolenšek J, Marhl M, Stožer A, et al. Assessing Different Temporal Scales of Calcium Dynamics in Networks of Beta Cell Populations. Front Physiol (2021) 12:612233. doi: 10.3389/FPHYS.2021.612233
57. Akalestou E, Suba K, Lopez-Noriega L, Georgiadou E, Chabosseau P, Gallie A, et al. Intravital Imaging of Islet Ca2+ Dynamics Reveals Enhanced β Cell Connectivity After Bariatric Surgery in Mice. Nat Commun (2021) 12:5165. doi: 10.1038/s41467-021-25423-8
58. Gosak M, Yan-Do R, Lin H, MacDonald PE, Stožer A. Ca2+ Oscillations, Waves, and Networks in Islets From Human Donors With and Without Type 2 Diabetes. bioRxiv (2021), 471749. doi: 10.1101/2021.12.08.471749
59. Benninger RKP, Kravets V. The Physiological Role of β-Cell Heterogeneity in Pancreatic Islet Function. Nat Rev Endocrinl (2022) 18:9–22. doi: 10.1038/s41574-021-00568-0
60. Peercy BE, Sherman AS. Do Oscillations in Pancreatic Islets Require Pacemaker Cells? J Biosci (2022) 47:14. doi: 10.1007/s12038-021-00251-6
61. Briggs JK, Kravets V, Dwulet JM, Benninger RKP. What do Functional Synchronization Networks Indicate About Underlying Structure and System Dynamics? A Network Theory Study in the Islet. bioRxiv (2022) 479331. doi: 10.1101/2022.02.06.479331
62. Stožer A, Gosak M, Dolenšek J, Perc M, Marhl M, Rupnik MS, et al. Functional Connectivity in Islets of Langerhans From Mouse Pancreas Tissue Slices. PLoS Comput Biol (2013) 9:e1002923. doi: 10.1371/journal.pcbi.1002923
63. Markovič R, Stožer A, Gosak M, Dolenšek J, Marhl M, Rupnik MS. Progressive Glucose Stimulation of Islet Beta Cells Reveals a Transition From Segregated to Integrated Modular Functional Connectivity Patterns. Sci Rep (2015) 5:7845. doi: 10.1038/srep07845
64. Johnston NR, Mitchell RK, Haythorne E, Pessoa MP, Semplici F, Ferrer J, et al. Beta Cell Hubs Dictate Pancreatic Islet Responses to Glucose. Cell Metab (2016) 24:389–401. doi: 10.1016/j.cmet.2016.06.020
65. Rutter GA, Hodson DJ, Chabosseau P, Haythorne E, Pullen TJ, Leclerc I. Local and Regional Control of Calcium Dynamics in the Pancreatic Islet. Diabetes Obes Metab (2017) 19:30–41. doi: 10.1111/dom.12990
66. Daraio T, Bombek LK, Gosak M, Valladolid-Acebes I, Klemen MS, Refai E, et al. SNAP-25b-Deficiency Increases Insulin Secretion and Changes Spatiotemporal Profile of Ca2+ Oscillations in β Cell Networks. Sci Rep (2017) 7:7744. doi: 10.1038/s41598-017-08082-y
67. Salem V, Silva LD, Suba K, Georgiadou E, Neda Mousavy Gharavy S, Akhtar N, et al. Leader β-Cells Coordinate Ca2+ Dynamics Across Pancreatic Islets In Vivo. Nat Metab (2019) 1:615–29. doi: 10.1038/s42255-019-0075-2
68. Kravets V, Dwulet JAM, Schleicher WE, Hodson DJ, Davis AM, Piscopio RA, et al. Functional Architecture of the Pancreatic Islets: First Responder Cells Drive the First-Phase [Ca2+] Response. bioRxiv (2020). doi: 10.1101/2020.12.22.424082
69. Šterk M, Bombek LK, Klemen MS, Rupnik MS, Marhl M, Stožer A, et al. NMDA Receptor Inhibition Increases, Synchronizes, and Stabilizes the Collective Pancreatic Beta Cell Activity: Insights Through Multilayer Network Analysis. PLoS Comput Biol (2021) 17:e1009002. doi: 10.1371/JOURNAL.PCBI.1009002
70. Dolenšek J, Stožer A, Skelin Klemen M, Miller EW, Slak Rupnik M. The Relationship Between Membrane Potential and Calcium Dynamics in Glucose-Stimulated Beta Cell Syncytium in Acute Mouse Pancreas Tissue Slices. PLoS One (2013) 8:e82374. doi: 10.1371/journal.pone.0082374
71. Benninger RKP, Hutchens T, Head WS, McCaughey MJ, Zhang M, Le Marchand SJ, et al. Intrinsic Islet Heterogeneity and Gap Junction Coupling Determine Spatiotemporal Ca2+ Wave Dynamics. Biophys J (2014) 107:2723–33. doi: 10.1016/j.bpj.2014.10.048
72. Benninger RKP, Hodson DJ. New Understanding of β-Cell Heterogeneity and in Situ Islet Function. Diabetes (2018) 67:537–47. doi: 10.2337/dbi17-0040
73. Weitz J, Menegaz D, Caicedo A. Deciphering the Complex Communication Networks That Orchestrate Pancreatic Islet Function. Diabetes (2021) 70:17–26. doi: 10.2337/DBI19-0033
74. Benninger RKP, Zhang M, Steven Head W, Satin LS, Piston DW. Gap Junction Coupling and Calcium Waves in the Pancreatic Islet. Biophys J (2008) 95:5048–61. doi: 10.1529/biophysj.108.140863
75. Bosco D, Haefliger JA, Meda P. Connexins: Key Mediators of Endocrine Function. Physiol Rev (2011) 91:1393–445. doi: 10.1152/physrev.00027.2010
76. Benninger RKP, Piston DW. Cellular Communication and Heterogeneity in Pancreatic Islet Insulin Secretion Dynamics. Trends Endocrinol Metab (2014) 25:399–406. doi: 10.1016/j.tem.2014.02.005
77. Ravier MA, Güldenagel M, Charollais A, Gjinovci A, Caille D, Söhl G, et al. Loss of Connexin36 Channels Alters β-Cell Coupling, Islet Synchronization of Glucose-Induced Ca2+ and Insulin Oscillations, and Basal Insulin Release. Diabetes (2005) 54:1798–807. doi: 10.2337/DIABETES.54.6.1798
78. Head WS, Orseth ML, Nunemaker CS, Satin LS, Piston DW, Benninger RKP. Connexin-36 Gap Junctions Regulate In Vivo First- and Second-Phase Insulin Secretion Dynamics and Glucose Tolerance in the Conscious Mouse. Diabetes (2012) 61:1700–7. doi: 10.2337/db11-1312
79. Farnsworth NL, Hemmati A, Pozzoli M, Benninger RKP. Fluorescence Recovery After Photobleaching Reveals Regulation and Distribution of Connexin36 Gap Junction Coupling Within Mouse Islets of Langerhans. J Physiol (2014) 592:4431–46. doi: 10.1113/jphysiol.2014.276733
80. Rutter GA, Hodson DJ. Beta Cell Connectivity in Pancreatic Islets: A Type 2 Diabetes Target? Cell Mol Life Sci (2015) 72:453–67. doi: 10.1007/s00018-014-1755-4
81. Otte E, Rousseau R. Social Network Analysis: A Powerful Strategy, Also for the Information Sciences. J Inf Sci (2002) 28:441–53. doi: 10.1177/016555150202800601
82. Barabási A-L, Oltvai ZN. Network Biology: Understanding the Cell’s Functional Organization. Nat Rev Genet (2004) 5:101–13. doi: 10.1038/nrg1272
83. Huttlin EL, Bruckner RJ, Paulo JA, Cannon JR, Ting L, Baltier K, et al. Architecture of the Human Interactome Defines Protein Communities and Disease Networks. Nature (2017) 545:505–9. doi: 10.1038/nature22366
84. Pilosof S, Porter MA, Pascual M, Kéfi S. The Multilayer Nature of Ecological Networks. Nat Ecol Evol (2017) 1:101. doi: 10.1038/s41559-017-0101
85. Gosak M, Milojević M, Duh M, Skok K, Perc M. Networks Behind the Morphology and Structural Design of Living Systems. Phys Life Rev (2022) 41:1–21. doi: 10.1016/j.plrev.2022.03.001
86. Barbosa H, Barthelemy M, Ghoshal G, James CR, Lenormand M, Louail T, et al. Human Mobility: Models and Applications. Phys Rep (2018) 734:1–74. doi: 10.1016/J.PHYSREP.2018.01.001
87. Cimini G, Squartini T, Saracco F, Garlaschelli D, Gabrielli A, Caldarelli G. The Statistical Physics of Real-World Networks. Nat Rev Phys (2019) 1:58–71. doi: 10.1038/s42254-018-0002-6
88. Yazdani A, Jeffrey P. Complex Network Analysis of Water Distribution Systems. Chaos Interdiscip J Nonlinear Sci (2011) 21:016111. doi: 10.1063/1.3540339
89. Girvan M, Newman MEJ. Community Structure in Social and Biological Networks. Proc Natl Acad Sci (2002) 99:7821–6. doi: 10.1073/pnas.122653799
90. Estrada E. The Structure of Complex Networks. Oxford: Oxford University Press (2012). doi: 10.1093/acprof:oso/9780199591756.001.0001
92. Amaral LAN, Ottino JM. Complex Networks. Eur Phys J B - Condens Matter (2004) 38:147–62. doi: 10.1140/epjb/e2004-00110-5
93. Leskovec J, Krevl A. SNAP Datasets: Stanford Large Network Dataset Collection (2014). Available at: https://snap.stanford.edu/data/.
94. Stumpf MPH, Porter MA. Critical Truths About Power Laws. Science (2012) 335:665–6. doi: 10.1126/SCIENCE.1216142
95. Holme P. Rare and Everywhere: Perspectives on Scale-Free Networks. Nat Commun (2019) 10:1016. doi: 10.1038/s41467-019-09038-8
96. Boccaletti S, Latora V, Moreno Y, Chavez M, Hwang D. Complex Networks: Structure and Dynamics. Phys Rep (2006) 424:175–308. doi: 10.1016/j.physrep.2005.10.009
97. Humphries MD, Gurney K. Network ‘Small-World-Ness’: A Quantitative Method for Determining Canonical Network Equivalence. PLoS One (2008) 3:e0002051. doi: 10.1371/JOURNAL.PONE.0002051
98. Turnbull L, Hütt M-T, Ioannides AA, Kininmonth S, Poeppl R, Tockner K, et al. Connectivity and Complex Systems: Learning From a Multi-Disciplinary Perspective. Appl Netw Sci (2018) 3:11. doi: 10.1007/s41109-018-0067-2
99. Hoang DT, Matsunari H, Nagaya M, Nagashima H, Millis JM, Witkowski P, et al. A Conserved Rule for Pancreatic Islet Organization. PLoS One (2014) 9:e110384. doi: 10.1371/JOURNAL.PONE.0110384
100. Kilimnik G, Jo J, Periwal V, Zielinski MC, Hara M. Quantification of Islet Size and Architecture. Islets (2012) 4:167–72. doi: 10.4161/ISL.19256
101. Tran Thi Nhu H, Arrojo E, Drigo R, Berggren P-O, Boudier T. A Novel Toolbox to Investigate Tissue Spatial Organization Applied to the Study of the Islets of Langerhans. Sci Rep (2017) 7:44261. doi: 10.1038/srep44261
102. Félix-Martínez GJ, Godínez-Fernández JR. Comparative Analysis of Reconstructed Architectures From Mice and Human Islets. Islets (2022) 14:23–35. doi: 10.1080/19382014.2021.1987827
103. Félix-Martínez GJ N, Mata A, Godínez-Fernández JR. Reconstructing Human Pancreatic Islet Architectures Using Computational Optimization. Islets (2020) 12:121–33. doi: 10.1080/19382014.2020.1823178
104. Félix-Martínez GJ, Nicolás-Mata A, Godínez-Fernández JR. Computational Reconstruction of Pancreatic Islets as a Tool for Structural and Functional Analysis. J Vis Exp (2022) 181:e63351. doi: 10.3791/63351
105. Striegel DA, Hara M, Periwal V. The Beta Cell in Its Cluster: Stochastic Graphs of Beta Cell Connectivity in the Islets of Langerhans. PloS Comput Biol (2015) 11:e1004423. doi: 10.1371/journal.pcbi.1004423
106. Arrojo e Drigo R, Jacob S, García-Prieto CF, Zheng X, Fukuda M, Nhu HTT, et al. Structural Basis for Delta Cell Paracrine Regulation in Pancreatic Islets. Nat Commun (2019) 10:3700. doi: 10.1038/s41467-019-11517-x
107. Cohrs CM, Chen C, Jahn SR, Stertmann J, Chmelova H, Weitz J, et al. Vessel Network Architecture of Adult Human Islets Promotes Distinct Cell-Cell Interactions In Situ and Is Altered After Transplantation. Endocrinology (2017) 158:1373–85. doi: 10.1210/EN.2016-1184
108. van den Heuvel MP, Hulshoff Pol HE. Exploring the Brain Network: A Review on Resting-State fMRI Functional Connectivity. Eur Neuropsychopharmacol (2010) 20:519–34. doi: 10.1016/j.euroneuro.2010.03.008
109. Garrison KA, Scheinost D, Finn ES, Shen X, Constable RT. The (in)Stability of Functional Brain Network Measures Across Thresholds. Neuroimage (2015) 118:651–61. doi: 10.1016/J.NEUROIMAGE.2015.05.046
110. De Domenico M. Multilayer Network Modeling of Integrated Biological Systems. Phys Life Rev (2018) 24:149–52. doi: 10.1016/j.plrev.2017.12.006
111. Jalili M. Network Biology: Describing Biological Systems by Complex Networks. Phys Life Rev (2018) 24:159–61. doi: 10.1016/j.plrev.2017.12.003
112. Pedersen MG. Biological Mechanisms Beyond Network Analysis via Mathematical Modeling. Phys Life Rev (2018) 24:156–8. doi: 10.1016/j.plrev.2017.12.001
113. Stam CJ, Tewarie P, Van Dellen E, van Straaten ECW, Hillebrand A, Van Mieghem P. The Trees and the Forest: Characterization of Complex Brain Networks With Minimum Spanning Trees. Int J Psychophysiol (2014) 92:129–38. doi: 10.1016/j.ijpsycho.2014.04.001
114. Stosic D, Stosic D, Ludermir TB, Stosic T. Collective Behavior of Cryptocurrency Price Changes. Phys A Stat Mech Appl (2018) 507:499–509. doi: 10.1016/j.physa.2018.05.050
115. Markovič R, Gosak M, Grubelnik V, Marhl M, Virtič P. Data-Driven Classification of Residential Energy Consumption Patterns by Means of Functional Connectivity Networks. Appl Energy (2019) 242:506–15. doi: 10.1016/J.APENERGY.2019.03.134
116. Hodson DJ, Schaeffer M, Romanò N, Fontanaud P, Lafont C, Birkenstock J, et al. Existence of Long-Lasting Experience-Dependent Plasticity in Endocrine Cell Networks. Nat Commun (2012) 3:605. doi: 10.1038/ncomms1612
117. Chen C, Maybhate A, Israel D, Thakor NV, Jia X. Assessing Thalamocortical Functional Connectivity With Granger Causality. IEEE Trans Neural Syst Rehabil Eng (2013) 21:725–33. doi: 10.1109/TNSRE.2013.2271246
118. Jalili M, Knyazeva MG. Constructing Brain Functional Networks From EEG:: Partial and Unpartial Correlations. J Integr Neurosci (2011) 10:213–32. doi: 10.1142/S0219635211002725
119. Poli D, Pastore VP, Martinoia S, Massobrio P. From Functional to Structural Connectivity Using Partial Correlation in Neuronal Assemblies. J Neural Eng (2016) 13:26023. doi: 10.1088/1741-2560/13/2/026023
120. Zhao F, Gao Y, Li X, An Z, Ge S, Zhang C. A Similarity Measurement for Time Series and its Application to the Stock Market. Expert Syst Appl (2021) 182:115217. doi: 10.1016/J.ESWA.2021.115217
121. Jin D, Li R, Xu J. Multiscale Community Detection in Functional Brain Networks Constructed Using Dynamic Time Warping. IEEE Trans Neural Syst Rehabil Eng (2020) 28:52–61. doi: 10.1109/TNSRE.2019.2948055
122. Serrà J, Arcos JL. A Competitive Measure to Assess the Similarity Between Two Time Series. In: Lecture Notes in Computer Science (Including Subseries Lecture Notes in Artificial Intelligence and Lecture Notes in Bioinformatics. Berlin, Heidelberg: Springer (2012). p. 414–27. doi: 10.1007/978-3-642-32986-9_31
123. Serrà J, Arcos JL. An Empirical Evaluation of Similarity Measures for Time Series Classification. Knowledge-Based Syst (2014) 67:305–14. doi: 10.1016/J.KNOSYS.2014.04.035
124. Dolenšek J, Špelič D, Klemen M, Žalik B, Gosak M, Rupnik M, et al. Membrane Potential and Calcium Dynamics in Beta Cells From Mouse Pancreas Tissue Slices: Theory, Experimentation, and Analysis. Sensors (2015) 15:27393–419. doi: 10.3390/s151127393
125. Bertram R, Sherman A, Satin LS. Electrical Bursting, Calcium Oscillations, and Synchronization of Pancreatic Islets. Adv Exp Med Biol (2010) 654:261–79. doi: 10.1007/978-90-481-3271-3_12
126. Beauvois MC, Merezak C, Jonas J-C, Ravier MA, Henquin J-C, Gilon P. Glucose-Induced Mixed [Ca2+] C Oscillations in Mouse β-Cells are Controlled by the Membrane Potential and the SERCA3 Ca2+ -ATPase of the Endoplasmic Reticulum. Am J Physiol Physiol (2006) 290:C1503–11. doi: 10.1152/ajpcell.00400.2005
127. Gilon P, Henquin JC. Influence of Membrane Potential Changes on Cytoplasmic Ca2+ Concentration in an Electrically Excitable Cell, the Insulin-Secreting Pancreatic B-Cell. J Biol Chem (1992) 267:20713–20. doi: 10.1016/S0021-9258(19)36744-4
128. Nunemaker CS, Zhang M, Wasserman DH, McGuinness OP, Powers AC, Bertram R, et al. Individual Mice can be Distinguished by the Period of Their Islet Calcium Oscillations: Is There an Intrinsic Islet Period That is Imprinted. Vivo? Diabetes (2005) 54:3517–22. doi: 10.2337/DIABETES.54.12.3517
129. Fridlyand LE, Tamarina N, Philipson LH. Bursting and Calcium Oscillations in Pancreatic β-Cells: Specific Pacemakers for Specific Mechanisms. Am J Physiol Metab (2010) 299:E517–32. doi: 10.1152/ajpendo.00177.2010
130. Santos RM, Rosario LM, Nadal A, Garcia-Sancho J, Soria B, Valdeolmillos M. Widespread Synchronous [Ca2+]i Oscillations Due to Bursting Electrical Activity in Single Pancreatic Islets. Pflügers Arch Eur J Physiol (1991) 418:417–22. doi: 10.1007/BF00550880
131. Nunemaker CS, Bertram R, Sherman A, Tsaneva-Atanasova K, Daniel CR, Satin LS. Glucose Modulates [Ca2+]i Oscillations in Pancreatic Islets via Ionic and Glycolytic Mechanisms. Biophys J (2006) 91:2082–96. doi: 10.1529/biophysj.106.087296
132. Idevall-Hagren O, Tengholm A. Metabolic Regulation of Calcium Signaling in Beta Cells. Semin Cell Dev Biol (2020) 103:20–30. doi: 10.1016/J.SEMCDB.2020.01.008
133. Skelin Klemen M, Dolenšek J, Slak Rupnik M, Stožer A. The Triggering Pathway to Insulin Secretion: Functional Similarities and Differences Between the Human and the Mouse β Cells and Their Translational Relevance. Islets (2017) 9:109–39. doi: 10.1080/19382014.2017.1342022
134. Meda P. Gap Junction Proteins are Key Drivers of Endocrine Function. Biochim Biophys Acta - Biomembr (2018) 1860:124–40. doi: 10.1016/j.bbamem.2017.03.005
135. Bertram R, Satin L, Zhang M, Smolen P, Sherman A. Calcium and Glycolysis Mediate Multiple Bursting Modes in Pancreatic Islets. Biophys J (2004) 87:3074–87. doi: 10.1529/BIOPHYSJ.104.049262
136. McKenna JP, Bertram R. Fast-Slow Analysis of the Integrated Oscillator Model for Pancreatic β-Cells. J Theor Biol (2018) 457:152–62. doi: 10.1016/J.JTBI.2018.08.029
137. Pedersen MG, Bertram R, Sherman A. Intra- and Inter-Islet Synchronization of Metabolically Driven Insulin Secretion. Biophys J (2005) 89:107–19. doi: 10.1529/biophysj.104.055681
138. Tsaneva-Atanasova K, Zimliki CL, Bertram R, Sherman A. Diffusion of Calcium and Metabolites in Pancreatic Islets: Killing Oscillations With a Pitchfork. Biophys J (2006) 90:3434–46. doi: 10.1529/BIOPHYSJ.105.078360
139. Loppini A, Braun M, Filippi S, Pedersen MG. Mathematical Modeling of Gap Junction Coupling and Electrical Activity in Human β-Cells. Phys Biol (2015) 12:66002. doi: 10.1088/1478-3975/12/6/066002
140. Satin LS, Butler PC, Ha J, Sherman AS. Pulsatile Insulin Secretion, Impaired Glucose Tolerance and Type 2 Diabetes. Mol Aspects Med (2015) 42:61–77. doi: 10.1016/j.mam.2015.01.003
141. Bertram R, Satin LS, Sherman AS. Closing in on the Mechanisms of Pulsatile Insulin Secretion. Diabetes (2018) 67:351–9. doi: 10.2337/dbi17-0004
142. Cappon G, Pedersen MG. Heterogeneity and Nearest-Neighbor Coupling can Explain Small-Worldness and Wave Properties in Pancreatic Islets. Chaos Interdiscip J Nonlinear Sci (2016) 26:053103. doi: 10.1063/1.4949020
143. Hogan JP, Peercy BE. Flipping the Switch on the Hub Cell: Islet Desynchronization Through Cell Silencing. PLoS One (2021) 16:e0248974. doi: 10.1371/JOURNAL.PONE.0248974
144. Bergsten P, Grapengiesser E, Gylfe E, Tengholm A, Hellman B. Synchronous Oscillations of Cytoplasmic Ca2+ and Insulin Release in Glucose-Stimulated Pancreatic Islets. J Biol Chem (1994) 269:8749–53. doi: 10.1016/S0021-9258(17)37032-1
145. Stožer A, Markovič R, Dolenšek J, Perc M, Marhl M, Rupnik MS, et al. Heterogeneity and Delayed Activation as Hallmarks of Self-Organization and Criticality in Excitable Tissue. Front Physiol (2019) 10:869. doi: 10.3389/fphys.2019.00869
146. Jaffredo M, Bertin E, Pirog A, Puginier E, Gaitan J, Oucherif S, et al. Dynamic Uni- and Multicellular Patterns Encode Biphasic Activity in Pancreatic Islets. Diabetes (2021) 70:878–88. doi: 10.2337/db20-0214
147. Gosak M, Stožer A, Markovic R, Dolenšek J, Perc M, Rupnik MS, et al. Critical and Supercritical Spatiotemporal Calcium Dynamics in Beta Cells. Front Physiol (2017) 8:1106. doi: 10.3389/FPHYS.2017.01106
148. Lei CL, Kellard JA, Hara M, Johnson JD, Rodriguez B, Briant LJB. Beta-Cell Hubs Maintain Ca2+ Oscillations in Human and Mouse Islet Simulations. Islets (2018) 10:151–67. doi: 10.1080/19382014.2018.1493316
149. Satin LS, Zhang Q, Rorsman P. Take Me To Your Leader”: An Electrophysiological Appraisal of the Role of Hub Cells in Pancreatic Islets. Diabetes (2020) 69:830–6. doi: 10.2337/dbi19-0012
150. Rutter GA, Ninov N, Salem V, Hodson DJ. Comment on Satin Et al. “Take Me To Your Leader”: An Electrophysiological Appraisal of the Role of Hub Cells in Pancreatic Islets. Diabetes (2020) 69:830–6. doi: 10.2337/db20-0501
151. Satin LS, Rorsman P. Response to Comment on Satin Et al. “Take Me To Your Leader”: An Electrophysiological Appraisal of the Role of Hub Cells in Pancreatic Islets. Diabetes (2020) 69:830–6. doi: 10.2337/dbi20-0027
152. Speier S, Gjinovci A, Charollais A, Meda P, Rupnik M. Cx36-Mediated Coupling Reduces β-Cell Heterogeneity, Confines the Stimulating Glucose Concentration Range, and Affects Insulin Release Kinetics. Diabetes (2007) 56:1078–86. doi: 10.2337/db06-0232
153. Stožer A, Dolenšek J, Križančić Bombek L, Gosak M, Skelin Klemen M. Calcium Imaging. In: Imaging Modalities for Biological and Preclinical Research: A Compendium, vol. Volume 1. Bristol, UK: IOP Publishing (2021). p. 2053–563. doi: 10.1088/978-0-7503-3059-6ch5
154. Arrojo E Drigo R. Probing β-Cell Biology in Space and Time. Diabetes (2021) 70:2163–73. doi: 10.2337/DBI21-0008
155. Lammert E, Thorn P. The Role of the Islet Niche on Beta Cell Structure and Function. J Mol Biol (2020) 432:1407–18. doi: 10.1016/j.jmb.2019.10.032
156. Stožer A, Dolenšek J, Rupnik MS. Glucose-Stimulated Calcium Dynamics in Islets of Langerhans in Acute Mouse Pancreas Tissue Slices. PLoS One (2013) 8:e54638. doi: 10.1371/journal.pone.0054638
157. Pipeleers D, Kiekens R, Ling Z, Wilikens A, Schuit F. Physiologic Relevance of Heterogeneity in the Pancreatic Beta-Cell Population. Diabetologia (1994) 37:S57–64. doi: 10.1007/BF00400827
158. Jonkers FC, Henquin JC. Measurements of Cytoplasmic Ca2+ in Islet Cell Clusters Show That Glucose Rapidly Recruits β-Cells and Gradually Increases the Individual Cell Response. Diabetes (2001) 50:540–50. doi: 10.2337/DIABETES.50.3.540
159. Scarl RT, Corbin KL, Vann NW, Smith HM, Satin LS, Sherman A, et al. Intact Pancreatic Islets and Dispersed Beta-Cells Both Generate Intracellular Calcium Oscillations But Differ in Their Responsiveness to Glucose. Cell Calcium (2019) 83:102081. doi: 10.1016/J.CECA.2019.102081
160. Pohorec V, Križančić Bombek L, Skelin Klemen M, Dolenšek J, Stožer A. Glucose-Stimulated Calcium Dynamics in Beta Cells From Male C57BL/6J, C57BL/6N, and NMRI Mice: A Comparison of Activation, Activity, and Deactivation Properties in Tissue Slices. Front Endocrinol (2022) 13:867663. doi: 10.3389/FENDO.2022.867663
161. Meissner HP, Schmelz H. Membrane Potential of Beta-Cells in Pancreatic Islets. Pflügers Arch Eur J Physiol (1974) 351:195–206. doi: 10.1007/BF00586918
162. Henquin JC. Adenosine Triphosphate-Sensitive K+ Channels may Not be the Sole Regulators of Glucose-Induced Electrical Activity in Pancreatic B-Cells. Endocrinology (1992) 131:127–31. doi: 10.1210/EN.131.1.127
163. Antunes CM, Salgado AP, Rosário LM, Santos RM. Differential Patterns of Glucose-Induced Electrical Activity and Intracellular Calcium Responses in Single Mouse and Rat Pancreatic Islets. Diabetes (2000) 49:2028–38. doi: 10.2337/DIABETES.49.12.2028
164. Lebreton F, Pirog A, Belouah I, Bosco D, Berney T, Meda P, et al. Slow Potentials Encode Intercellular Coupling and Insulin Demand in Pancreatic Beta Cells. Diabetologia (2015) 58:1291–9. doi: 10.1007/S00125-015-3558-Z
165. Westacott MJ, Ludin NWF, Benninger RKP. Spatially Organized β-Cell Subpopulations Control Electrical Dynamics Across Islets of Langerhans. Biophys J (2017) 113:1093–108. doi: 10.1016/J.BPJ.2017.07.021
166. Nasteska D, Hodson DJ. The Role of Beta Cell Heterogeneity in Islet Function and Insulin Release. J Mol Endocrinol (2018) 61:R43–60. doi: 10.1530/JME-18-0011
167. Gosak M, Stožer A, Markovič R, Dolenšek J, Marhl M, Rupnik MS, et al. The Relationship Between Node Degree and Dissipation Rate in Networks of Diffusively Coupled Oscillators and its Significance for Pancreatic Beta Cells. Chaos (2015) 25:073115. doi: 10.1063/1.4926673
168. Heimberg H, De Vos A, Vandercammen A, Van Schaftingen E, Pipeleers D, Schuit F. Heterogeneity in Glucose Sensitivity Among Pancreatic Beta-Cells is Correlated to Differences in Glucose Phosphorylation Rather Than Glucose Transport. EMBO J (1993) 12:2873–9. doi: 10.1002/J.1460-2075.1993.TB05949.X
169. Dwulet JM, Ludin NWF, Piscopio RA, Schleicher WE, Moua O, Westacott MJ. How Heterogeneity in Glucokinase and Gap Junction Coupling Determines the Islet Electrical Response. Biophys J (2019) 117:2188–203. doi: 10.1016/j.bpj.2019.10.037
170. Dwulet JM, Briggs JK, Benninger RKP. Small Subpopulations of β-Cells do Not Drive Islet Oscillatory [Ca2+] Dynamics via Gap Junction Communication. PloS Comput Biol (2021) 17:e1008948. doi: 10.1371/journal.pcbi.1008948
171. Benninger RKP, Head WS, Zhang M, Satin LS, Piston DW. Gap Junctions and Other Mechanisms of Cell-Cell Communication Regulate Basal Insulin Secretion in the Pancreatic Islet. J Physiol (2011) 589:5453–66. doi: 10.1113/jphysiol.2011.218909
172. Irles E, Ñeco P, Lluesma M, Villar-Pazos S, Santos-Silva JC, Vettorazzi JF, et al. Enhanced Glucose-Induced Intracellular Signaling Promotes Insulin Hypersecretion: Pancreatic Beta-Cell Functional Adaptations in a Model of Genetic Obesity and Prediabetes. Mol Cell Endocrinol (2015) 404:46–55. doi: 10.1016/j.mce.2015.01.033
173. Allagnat F, Martin D, Condorelli DF, Waeber G, Haefliger JA. Glucose Represses Connexin36 in Insulin-Secreting Cells. J Cell Sci (2005) 118:5335–44. doi: 10.1242/jcs.02600
174. Stožer A, Hojs R, Dolenšek J. Beta Cell Functional Adaptation and Dysfunction in Insulin Resistance and the Role of Chronic Kidney Disease. Nephron (2019) 143:33–7. doi: 10.1159/000495665
175. Cigliola V, Chellakudam V, Arabieter W, Meda P. Connexins and β-Cell Functions. Diabetes Res Clin Pract (2013) 99:250–9. doi: 10.1016/J.DIABRES.2012.10.016
176. Carvalho CPF, Oliveira RB, Britan A, Santos-Silva JC, Boschero AC, Meda P, et al. Impaired β-Cell-β-Cell Coupling Mediated by Cx36 Gap Junctions in Prediabetic Mice. Am J Physiol - Endocrinol Metab (2012) 303:144–51. doi: 10.1152/AJPENDO.00489.2011
177. Ravier MA, Sehlin J, Henquin JC. Disorganization of Cytoplasmic Ca2+ Oscillations and Pulsatile Insulin Secretion in Islets From Ob/Ob Mice. Diabetologia (2002) 45:1154–63. doi: 10.1007/s00125-002-0883-9
178. Farnsworth NL, Walter R, Piscopio RA, Schleicher WE, Benninger RKP. Exendin-4 Overcomes Cytokine-Induced Decreases in Gap Junction Coupling via Protein Kinase A and Epac2 in Mouse and Human Islets. J Physiol (2019) 597:431–47. doi: 10.1113/JP276106
179. do Amaral MEC, Kravets V, Dwulet JAM, Farnsworth NL, Piscopio R, Schleicher WE, et al. Caloric Restriction Recovers Impaired β-Cell-β-Cell Gap Junction Coupling, Calcium Oscillation Coordination, and Insulin Secretion in Prediabetic Mice. Am J Physiol - Endocrinol Metab (2020) 319:E709–20. doi: 10.1152/AJPENDO.00132.2020
180. Stožer A, Paradiž Leitgeb E, Pohorec V, Dolenšek J, Križančić Bombek L, Gosak M, et al. The Role of cAMP in Beta Cell Stimulus–Secretion and Intercellular Coupling. Cells (2021) 10:1658. doi: 10.3390/cells10071658
181. Shuai H, Xu Y, Yu Q, Gylfe E, Tengholm A. Fluorescent Protein Vectors for Pancreatic Islet Cell Identification in Live-Cell Imaging. Pflugers Arch (2016) 468:1765–77. doi: 10.1007/s00424-016-1864-z
182. Kim JW, Roberts CD, Berg SA, Caicedo A, Roper SD, Chaudhari N. Imaging Cyclic AMP Changes in Pancreatic Islets of Transgenic Reporter Mice. PLoS One (2008) 3:e2127. doi: 10.1371/journal.pone.0002127
183. Klemen MS, Dolenšek J, Križančić Bombek L, Pohorec V, Gosak M, Rupnik MS, et al. The Effect of cAMP and the Role of Epac2A During Activation, Activity, and Deactivation of Beta Cell Networks. Preprints (2021). doi: 10.20944/preprints202105.0064.v1
184. Postić S, Sarikas S, Pfabe J, Pohorec V, Križančić L, Bombek K, et al. Intracellular Ca2+ Channels Initiate Physiological Glucose Signaling in Beta Cells Examined in Situ. bioRxiv (2021), 439796. doi: 10.1101/2021.04.14.439796
185. Liu Y-J, Tengholm A, Grapengiesser E, Hellman B, Gylfe E. Origin of Slow and Fast Oscillations of Ca 2+ in Mouse Pancreatic Islets. J Physiol (1998) 508:471–81. doi: 10.1111/j.1469-7793.1998.471bq.x
186. Marquard J, Otter S, Welters A, Stirban A, Fischer A, Eglinger J, et al. Characterization of Pancreatic NMDA Receptors as Possible Drug Targets for Diabetes Treatment. Nat Med (2015) 21:363–76. doi: 10.1038/nm.3822
187. Scholz O, Otter S, Welters A, Wörmeyer L, Dolenšek J, Klemen MS, et al. Peripherally Active Dextromethorphan Derivatives Lower Blood Glucose Levels by Targeting Pancreatic Islets. Cell Chem Biol (2021) 28:1474–88.e7. doi: 10.1016/J.CHEMBIOL.2021.05.011
188. Otter S, Lammert E. Exciting Times for Pancreatic Islets: Glutamate Signaling in Endocrine Cells. Trends Endocrinol Metab (2016) 27:177–88. doi: 10.1016/J.TEM.2015.12.004
189. Cabrera O, Berman DM, Kenyon NS, Ricordi C, Berggren PO, Caicedo A. The Unique Cytoarchitecture of Human Pancreatic Islets has Implications for Islet Cell Function. Proc Natl Acad Sci (2006) 103:2334–9. doi: 10.1073/pnas.0510790103
190. Westacott MJ, Farnsworth NL, St Clair JR, Poffenberger G, Heintz A, Ludin NW, et al. Age-Dependent Decline in the Coordinated [Ca2+] and Insulin Secretory Dynamics in Human Pancreatic Islets. Diabetes (2017) 66:2436–45. doi: 10.2337/db17-0137
191. Steiner DJ, Kim A, Miller K, Hara M. Pancreatic Islet Plasticity: Interspecies Comparison of Islet Architecture and Composition. Islets (2010) 2:135–45. doi: 10.4161/isl.2.3.11815
192. Bosco D, Armanet M, Morel P, Niclauss N, Sgroi A, Muller YD, et al. Unique Arrangement of α- and β-Cells in Human Islets of Langerhans. Diabetes (2010) 59:1202–10. doi: 10.2337/DB09-1177
193. Dolenšek J, Rupnik MS, Stožer A. Structural Similarities and Differences Between the Human and the Mouse Pancreas. Islets (2015) 7:e1024405. doi: 10.1080/19382014.2015.1024405
194. Bonner-Weir S, Sullivan BA, Weir GC. Human Islet Morphology Revisited. J Histochem Cytochem (2015) 63:604–12. doi: 10.1369/0022155415570969
195. Kharouta M, Miller K, Kim A, Wojcik P, Kilimnik G, Dey A, et al. No Mantle Formation in Rodent Islets-The Prototype of Islet Revisited. Diabetes Res Clin Pract (2009) 85:252–7. doi: 10.1016/j.diabres.2009.06.021
196. Gilon P, Jonas JC, Henquin JC. Culture Duration and Conditions Affect the Oscillations of Cytoplasmic Calcium Concentration Induced by Glucose in Mouse Pancreatic Islets. Diabetologia (1994) 37:1007–14. doi: 10.1007/BF00400464
197. Martín F, Soria B. Glucose-Induced [Ca2+] Oscillations in Single Human Pancreatic Islets. Cell Calcium (1996) 20:409–14. doi: 10.1016/S0143-4160(96)90003-2
198. Kilimnik G, Zhao B, Jo J, Periwal V, Witkowski P, Misawa R, et al. Altered Islet Composition and Disproportionate Loss of Large Islets in Patients With Type 2 Diabetes. PLoS One (2011) 6:e27445. doi: 10.1371/journal.pone.0027445
199. Pedersen MG. Contributions of Mathematical Modeling of Beta Cells to the Understanding of Beta-Cell Oscillations and Insulin Secretion. J Diabetes Sci Technol (2009) 3:16–20. doi: 10.1177/193229680900300103
200. Félix-Martínez GJ, Godínez-Fernández JR. Mathematical Models of Electrical Activity of the Pancreatic β-Cell: A Physiological Review. Islets (2014) 6:e949195. doi: 10.4161/19382014.2014.949195
201. Zavala E, Wedgwood KCA, Voliotis M, Tabak J, Spiga F, Lightman SL, et al. Mathematical Modelling of Endocrine Systems. Trends Endocrinol Metab (2019) 30:244–57. doi: 10.1016/j.tem.2019.01.008
202. Sherman A, Rinzel J. Model for Synchronization of Pancreatic Beta-Cells by Gap Junction Coupling. Biophys J (1991) 59:547–59. doi: 10.1016/S0006-3495(91)82271-8
203. Nittala A, Ghosh S, Wang X. Investigating the Role of Islet Cytoarchitecture in its Oscillation Using a New β-Cell Cluster Model. PLoS One (2007) 2(19):e983. doi: 10.1371/journal.pone.0000983
204. Loppini A, Capolupo A, Cherubini C, Gizzi A, Bertolaso M, Filippi S, et al. On the Coherent Behavior of Pancreatic Beta Cell Clusters. Phys Lett Sect A Gen At Solid State Phys (2014) 378:3210–7. doi: 10.1016/j.physleta.2014.09.041
205. Saadati M, Jamali Y. The Effects of Beta-Cell Mass and Function, Intercellular Coupling, and Islet Synchrony on Ca2+ Dynamics. Sci Rep (2021) 11:10268. doi: 10.1038/s41598-021-89333-x
206. Loppini A, Pedersen MG, Braun M, Filippi S. Gap-Junction Coupling and ATP-Sensitive Potassium Channels in Human β -Cell Clusters: Effects on Emergent Dynamics. Phys Rev E (2017) 96:32403. doi: 10.1103/PHYSREVE.96.032403
207. Aslanidi OV, Mornev OA, Skyggebjerg O, Arkhammar P, Thastrup O, Sørensen MP, et al. Excitation Wave Propagation as a Possible Mechanism for Signal Transmission in Pancreatic Islets of Langerhans. Biophys J (2001) 80:1195–209. doi: 10.1016/S0006-3495(01)76096-1
208. Šterk M, Dolenšek J, Bombek LK, Markovič R, Zakelšek D, Perc M, et al. Assessing the Origin and Velocity of Ca2+ Waves in Three-Dimensional Tissue: Insights From a Mathematical Model and Confocal Imaging in Mouse Pancreas Tissue Slices. Commun Nonlinear Sci Numer Simul (2021) 93:105495. doi: 10.1016/j.cnsns.2020.105495
209. Scialla S, Loppini A, Patriarca M, Heinsalu E. Hubs, Diversity, and Synchronization in FitzHugh-Nagumo Oscillator Networks: Resonance Effects and Biophysical Implications. Phys Rev E (2021) 103:52211. doi: 10.1103/PhysRevE.103.052211
210. Cherubini C, Filippi S, Gizzi A, Loppini A. Role of Topology in Complex Functional Networks of Beta Cells. Phys Rev E - Stat Nonlinear Soft Matter Phys (2015) 92:42702. doi: 10.1103/PHYSREVE.92.042702
211. Barua AK, Goel P. Isles Within Islets: The Lattice Origin of Small-World Networks in Pancreatic Tissues. Phys D Nonlinear Phenom (2016) 315:49–57. doi: 10.1016/J.PHYSD.2015.07.009
212. Loppini A, Chiodo L. Biophysical Modeling of β-Cells Networks: Realistic Architectures and Heterogeneity Effects. Biophys Chem (2019) 254:106247. doi: 10.1016/J.BPC.2019.106247
213. Korošak D, Jusup M, Podobnik B, Stožer A, Dolenšek J, Holme P, et al. Autopoietic Influence Hierarchies in Pancreatic Cells. Phys Rev Lett (2021) 127:168101. doi: 10.1103/PHYSREVLETT.127.168101
214. Ng XW, Chung YH, Piston DW. Intercellular Communication in the Islet of Langerhans in Health and Disease. Compr Physiol (2021) 11:2191–225. doi: 10.1002/cphy.c200026
215. Gao R, Yang T, Zhang Q. δ-Cells: The Neighborhood Watch in the Islet Community. Biol (Basel) (2021) 10:74. doi: 10.3390/biology10020074
216. Morriseau TS, Doucette C, Dolinsky VW. More Than Meets the Islet: Aligning Nutrient and Paracrine Inputs With Hormone Secretion in Health and Disease. Am J Physiol Metab (2022) 322(5):E446–63. doi: 10.1152/ajpendo.00411.2021
217. Grespan E, Giorgino T, Arslanian S, Natali A, Ferrannini E, Mari A. Defective Amplifying Pathway of β-Cell Secretory Response to Glucose in Type 2 Diabetes: Integrated Modeling of In Vitro and In Vivo Evidence. Diabetes (2018) 67:496–506. doi: 10.2337/DB17-1039
218. Holme P, Saramäki J. Temporal Networks. Phys Rep (2012) 519:97–125. doi: 10.1016/J.PHYSREP.2012.03.001
219. Boccaletti S, Bianconi G, Criado R, del Genio CI, Gómez-Gardeñes J, Romance M, et al. The Structure and Dynamics of Multilayer Networks. Phys Rep (2014) 544:1–122. doi: 10.1016/j.physrep.2014.07.001
220. Battiston F, Cencetti G, Iacopini I, Latora V, Lucas M, Patania A, et al. Networks Beyond Pairwise Interactions: Structure and Dynamics. Phys Rep (2020) 874:1–92. doi: 10.1016/J.PHYSREP.2020.05.004
221. Torres L, Blevins AS, Bassett D, Eliassi-Rad T. The Why, How, and When of Representations for Complex Systems. SIAM Rev (2021) 63:435–85. doi: 10.1137/20M1355896
222. Halu A, De Domenico M, Arenas A, Sharma A. The Multiplex Network of Human Diseases. NPJ Syst Biol Appl (2019) 5:15. doi: 10.1038/s41540-019-0092-5
223. Hammoud Z, Kramer F. Multilayer Networks: Aspects, Implementations, and Application in Biomedicine. Big Data Anal (2020) 5:2. doi: 10.1186/s41044-020-00046-0
224. Silverman EK, Schmidt HHHW, Anastasiadou E, Altucci L, Angelini M, Badimon L, et al. Molecular Networks in Network Medicine: Development and Applications. Wiley Interdiscip Rev Syst Biol Med (2020) 12:e1489. doi: 10.1002/WSBM.1489
225. De Domenico M, Nicosia V, Arenas A, Latora V. Structural Reducibility of Multilayer Networks. Nat Commun (2015) 6:6864. doi: 10.1038/ncomms7864
226. Aleta A, Moreno Y. Multilayer Networks in a Nutshell. Annu Rev Condens Matter Phys (2019) 10:45–62. doi: 10.1146/annurev-conmatphys-031218-013259
227. Klosik DF, Grimbs A, Bornholdt S, Hütt M-T. The Interdependent Network of Gene Regulation and Metabolism is Robust Where it Needs to be. Nat Commun (2017) 8:534. doi: 10.1038/s41467-017-00587-4
228. Liu X, Maiorino E, Halu A, Glass K, Prasad RB, Loscalzo J, et al. Robustness and Lethality in Multilayer Biological Molecular Networks. Nat Commun (2020) 11:6043. doi: 10.1038/s41467-020-19841-3
229. Uversky VN, Giuliani A. Networks of Networks: An Essay on Multi-Level Biological Organization. Front Genet (2021) 12:706260. doi: 10.3389/FGENE.2021.706260
230. Jin H, Zhang CX, Ma M, Gong Q, Yu L, Guo X, et al. Inferring Essential Proteins From Centrality in Interconnected Multilayer Networks. Phys A Stat Mech Appl (2020) 557:124853. doi: 10.1016/J.PHYSA.2020.124853
231. Calhoun VD, Miller R, Pearlson G, Adali T. The Chronnectome: Time-Varying Connectivity Networks as the Next Frontier in fMRI Data Discovery. Neuron (2014) 84:262–74. doi: 10.1016/J.NEURON.2014.10.015
232. Preti MG, Bolton TA, Van De Ville D. The Dynamic Functional Connectome: State-Of-the-Art and Perspectives. Neuroimage (2017) 160:41–54. doi: 10.1016/J.NEUROIMAGE.2016.12.061
233. Paradiž LE, Šterk M, Petrijan T, Gradišnik P, Gosak M. The Brain as a Complex Network: Assessment of EEG-Based Functional Connectivity Patterns in Patients With Childhood Absence Epilepsy. Epileptic Disord (2020) 22:1–12. doi: 10.1684/epd.2020.1203
234. Lurie DJ, Kessler D, Bassett DS, Betzel RF, Breakspear M, Kheilholz S, et al. Questions and Controversies in the Study of Time-Varying Functional Connectivity in Resting fMRI. Netw Neurosci (2020) 4:30–69. doi: 10.1162/NETN_A_00116
235. Tewarie P, Hillebrand A, van Dijk BW, Stam CJ, O’Neill GC, Van Mieghem P, et al. Integrating Cross-Frequency and Within Band Functional Networks in Resting-State MEG: A Multi-Layer Network Approach. Neuroimage (2016) 142:324–36. doi: 10.1016/j.neuroimage.2016.07.057
236. De Domenico M. Multilayer Modeling and Analysis of Human Brain Networks. Gigascience (2017) 6:1–8. doi: 10.1093/GIGASCIENCE/GIX004
237. Buldú JM, Porter MA. Frequency-Based Brain Networks: From a Multiplex Framework to a Full Multilayer Description. Netw Neurosci (2018) 2:418–41. doi: 10.1162/NETN_A_00033
238. Naro A, Maggio MG, Leo A, Calabrò RS. Multiplex and Multilayer Network EEG Analyses: A Novel Strategy in the Differential Diagnosis of Patients With Chronic Disorders of Consciousness. Int J Neural Syst (2021) 31:2050052. doi: 10.1142/S0129065720500525
239. Crofts JJ, Forrester M, O’Dea RD. Structure-Function Clustering in Multiplex Brain Networks. Europhys Lett (2016) 116:18003. doi: 10.1209/0295-5075/116/18003
240. Cabral J, Kringelbach ML, Deco G. Functional Connectivity Dynamically Evolves on Multiple Time-Scales Over a Static Structural Connectome: Models and Mechanisms. Neuroimage (2017) 160:84–96. doi: 10.1016/J.NEUROIMAGE.2017.03.045
241. Jacob S, Köhler M, Tröster P, Visa M, García-Prieto CF, Alanentalo T, et al. In Vivo Ca2+ Dynamics in Single Pancreatic β Cells. FASEB J (2020) 34:945–59. doi: 10.1096/FJ.201901302RR
242. Marinelli I, Fletcher PA, Sherman AS, Satin LS, Bertram R. Symbiosis of Electrical and Metabolic Oscillations in Pancreatic β-Cells. Front Physiol (2021) 12:781581. doi: 10.3389/fphys.2021.781581
243. Nilsson T, Schultz V, Berggren PO, Corkey BE, Tornheim K. Temporal Patterns of Changes in ATP/ADP Ratio, Glucose 6-Phosphate and Cytoplasmic Free Ca2+ in Glucose-Stimulated Pancreatic β-Cells. Biochem J (1996) 314:91–4. doi: 10.1042/BJ3140091
244. Merrins MJ, Poudel C, McKenna JP, Ha J, Sherman A, Bertram R, et al. Phase Analysis of Metabolic Oscillations and Membrane Potential in Pancreatic Islet β-Cells. Biophys J (2016) 110:691–9. doi: 10.1016/J.BPJ.2015.12.029
245. Rorsman P, Ashcroft FM. Pancreatic β-Cell Electrical Activity and Insulin Secretion: Of Mice and Men. Physiol Rev (2018) 98:117–214. doi: 10.1152/PHYSREV.00008.2017
246. De Domenico M, Sasai S, Arenas A. Mapping Multiplex Hubs in Human Functional Brain Networks. Front Neurosci (2016) 10:326. doi: 10.3389/FNINS.2016.00326
247. Li A, Cornelius SP, Liu YY, Wang L, Barabási AL. The Fundamental Advantages of Temporal Networks. Science (2017) 358:1042–6. doi: 10.1126/SCIENCE.AAI7488
248. Fisher DN, Pinter-Wollman N, Zhi-Yun J. Using Multilayer Network Analysis to Explore the Temporal Dynamics of Collective Behavior. Curr Zool (2021) 67:71–80. doi: 10.1093/CZ/ZOAA050
249. Speier S, Nyqvist D, Cabrera O, Yu J, Molano RD, Pileggi A, et al. Noninvasive In Vivo Imaging of Pancreatic Islet Cell Biology. Nat Med (2008) 14:574–8. doi: 10.1038/nm1701
250. Weitz JR, Makhmutova M, Almaça J, Stertmann J, Aamodt K, Brissova M, et al. Mouse Pancreatic Islet Macrophages Use Locally Released ATP to Monitor Beta Cell Activity. Diabetologia (2018) 61:182–92. doi: 10.1007/S00125-017-4416-Y
251. Meda P. The In Vivo Beta-to-Beta-Cell Chat Room: Connexin Connections Matter. Diabetes (2012) 61:1656–8. doi: 10.2337/db12-0336
252. Jain R, Lammert E. Cell-Cell Interactions in the Endocrine Pancreas. Diabetes Obes Metab (2009) 11:159–67. doi: 10.1111/j.1463-1326.2009.01102.x
253. Briant LJB, Reinbothe TM, Spiliotis I, Miranda C, Rodriguez B, Rorsman P. δ-Cells and β-Cells are Electrically Coupled and Regulate α-Cell Activity via Somatostatin. J Physiol (2018) 596:197–215. doi: 10.1113/JP274581
254. Miranda C, Begum M, Vergari E, Briant LJB. Gap Junction Coupling and Islet Delta-Cell Function in Health and Disease. Peptides (2022) 147:170704. doi: 10.1016/j.peptides.2021.170704
255. Nicosia V, Latora V. Measuring and Modeling Correlations in Multiplex Networks. Phys Rev E Stat Nonlin Soft Matter Phys (2015) 92:32805. doi: 10.1103/PhysRevE.92.032805
256. Bentley B, Branicky R, Barnes CL, Chew YL, Yemini E, Bullmore ET, et al. The Multilayer Connectome of Caenorhabditis Elegans. PloS Comput Biol (2016) 12:e1005283. doi: 10.1371/JOURNAL.PCBI.1005283
257. Maertens T, Schöll E, Ruiz J, Hövel P. Multilayer Network Analysis of C. Elegans: Looking Into the Locomotory Circuitry. Neurocomputing (2021) 427:238–61. doi: 10.1016/J.NEUCOM.2020.11.015
258. Virkar YS, Shew WL, Restrepo JG, Ott E. Feedback Control Stabilization of Critical Dynamics via Resource Transport on Multilayer Networks: How Glia Enable Learning Dynamics in the Brain. Phys Rev E (2016) 94:42310. doi: 10.1103/PHYSREVE.94.042310
259. Seino S, Sugawara K, Yokoi N, Takahashi H. β-Cell Signalling and Insulin Secretagogues: A Path for Improved Diabetes Therapy. Diabetes Obes Metab (2017) 19:22–9. doi: 10.1111/DOM.12995
260. Henquin J-C. Paracrine and Autocrine Control of Insulin Secretion in Human Islets: Evidence and Pending Questions. Am J Physiol Metab (2020) 320:E78–86. doi: 10.1152/ajpendo.00485.2020
261. Tokarz VL, MacDonald PE, Klip A. The Cell Biology of Systemic Insulin Function. J Cell Biol (2018) 217:2273–89. doi: 10.1083/JCB.201802095
262. Henquin J-C. The Dual Control of Insulin Secretion by Glucose Involves Triggering and Amplifying Pathways in β-Cells. Diabetes Res Clin Pract (2011) 93:S27–31. doi: 10.1016/S0168-8227(11)70010-9
263. Pedersen MG, Tagliavini A, Henquin JC. Calcium Signaling and Secretory Granule Pool Dynamics Underlie Biphasic Insulin Secretion and its Amplification by Glucose: Experiments and Modeling. Am J Physiol - Endocrinol Metab (2019) 316:E475–86. doi: 10.1152/AJPENDO.00380.2018
264. Rohli KE, Boyer CK, Blom SE, Stephens SB. Nutrient Regulation of Pancreatic Islet β-Cell Secretory Capacity and Insulin Production. Biomolecules (2022) 12(2):335–59. doi: 10.3390/BIOM12020335
265. Curry DL, Bennett LL, Grodsky GM. Requirement for Calcium Ion in Insulin Secretion by the Perfused Rat Pancreas. Am J Physiol (1968) 214:174–8. doi: 10.1152/AJPLEGACY.1968.214.1.174
266. Malaisse-Lagae F, Malaisse WJ. The Stimulus-Secretion Coupling of Glucose-Induced Insulin Release. III. Uptake of 45 Calcium by Isolated Islets of Langerhans. Endocrinology (1971) 88:72–80. doi: 10.1210/ENDO-88-1-72
267. Yau B, Hocking S, Andrikopoulos S, Kebede MA. Targeting the Insulin Granule for Modulation of Insulin Exocytosis. Biochem Pharmacol (2021) 194:114821. doi: 10.1016/j.bcp.2021.114821
268. Thurmond DC, Gaisano HY. Recent Insights Into Beta-Cell Exocytosis in Type 2 Diabetes. J Mol Biol (2020) 432:1310–25. doi: 10.1016/j.jmb.2019.12.012
269. Hastoy B, Clark A, Rorsman P, Lang J. Fusion Pore in Exocytosis: More Than an Exit Gate? A β-Cell Perspective. Cell Calcium (2017) 68:45–61. doi: 10.1016/j.ceca.2017.10.005
270. Gembal M, Gilon P, Henquin JC. Evidence That Glucose can Control Insulin Release Independently From Its Action on ATP-Sensitive K+ Channels in Mouse B Cells. J Clin Invest (1992) 89:1288–95. doi: 10.1172/JCI115714
271. Chen C, Chmelova H, Cohrs CM, Chouinard JA, Jahn SR, Stertmann J, et al. Alterations in β-Cell Calcium Dynamics and Efficacy Outweigh Islet Mass Adaptation in Compensation of Insulin Resistance and Prediabetes Onset. Diabetes (2016) 65:2676–85. doi: 10.2337/db15-1718
272. Yoshioka K, Takahashi H, Homma T, Saito M, Oh K-B, Nemoto Y, et al. A Novel Fluorescent Derivative of Glucose Applicable to the Assessment of Glucose Uptake Activity of Escherichia Coli. Biochim Biophys Acta - Gen Subj (1996) 1289:5–9. doi: 10.1016/0304-4165(95)00153-0
273. Yamada K, Saito M, Matsuoka H, Inagaki N. A Real-Time Method of Imaging Glucose Uptake in Single, Living Mammalian Cells. Nat Protoc (2007) 2:753–62. doi: 10.1038/nprot.2007.76
274. Tornheim K. Are Metabolic Oscillations Responsible for Normal Oscillatory Insulin Secretion? Diabetes (1997) 46:1375–80. doi: 10.2337/DIAB.46.9.1375
275. Merrins MJ, Van Dyke AR, Mapp AK, Rizzo MA, Satin LS. Direct Measurements of Oscillatory Glycolysis in Pancreatic Islet β-Cells Using Novel Fluorescence Resonance Energy Transfer (FRET) Biosensors for Pyruvate Kinase M2 Activity. J Biol Chem (2013) 288:33312–22. doi: 10.1074/jbc.M113.508127
276. Pralong WF, Bartley C, Wollheim CB. Single Islet Beta-Cell Stimulation by Nutrients: Relationship Between Pyridine Nucleotides, Cytosolic Ca2+ and Secretion. EMBO J (1990) 9:53–60. doi: 10.1002/j.1460-2075.1990.tb08079.x
277. Bertram R, Satin LS, Pedersen MG, Luciani DS, Sherman A. Interaction of Glycolysis and Mitochondrial Respiration in Metabolic Oscillations of Pancreatic Islets. Biophys J (2007) 92:1544–55. doi: 10.1529/biophysj.106.097154
278. Pedersen MG, Mosekilde E, Polonsky KS, Luciani DS. Complex Patterns of Metabolic and Ca2+ Entrainment in Pancreatic Islets by Oscillatory Glucose. Biophys J (2013) 105:29–39. doi: 10.1016/j.bpj.2013.05.036
279. Patterson GH, Knobel SM, Arkhammar P, Thastrup O, Piston DW. Separation of the Glucose-Stimulated Cytoplasmic and Mitochondrial NAD(P)H Responses in Pancreatic Islet Beta Cells. Proc Natl Acad Sci (2000) 97:5203–7. doi: 10.1073/pnas.090098797
280. Kindmark H, Köhler M, Brown G, Bränström R, Larsson O, Berggren PO. Glucose-Induced Oscillations in Cytoplasmic Free Ca2+ Concentration Precede Oscillations in Mitochondrial Membrane Potential in the Pancreatic Beta-Cell. J Biol Chem (2001) 276:34530–6. doi: 10.1074/jbc.M102492200
281. Krippeit-Drews P, Düfer M, Drews G. Parallel Oscillations of Intracellular Calcium Activity and Mitochondrial Membrane Potential in Mouse Pancreatic B-Cells. Biochem Biophys Res Commun (2000) 267:179–83. doi: 10.1006/bbrc.1999.1921
282. Cameron WD, Bui CV, Hutchinson A, Loppnau P, Gräslund S, Rocheleau JV. Apollo-NADP(+): A Spectrally Tunable Family of Genetically Encoded Sensors for NADP(+). Nat Methods (2016) 13:352–8. doi: 10.1038/nmeth.3764
283. Deglasse J-P, Roma LP, Pastor-Flores D, Gilon P, Dick TP, Jonas J-C. Glucose Acutely Reduces Cytosolic and Mitochondrial H2O2 in Rat Pancreatic Beta Cells. Antioxid Redox Signal (2019) 30:297–313. doi: 10.1089/ars.2017.7287
284. Kennedy HJ, Pouli AE, Ainscow EK, Jouaville LS, Rizzuto R, Rutter GA. Glucose Generates Sub-Plasma Membrane ATP Microdomains in Single Islet Beta-Cells. Potential Role for Strategically Located Mitochondria. J Biol Chem (1999) 274:13281–91. doi: 10.1074/jbc.274.19.13281
285. Tarasov AI, Semplici F, Li D, Rizzuto R, Ravier MA, Gilon P, et al. Frequency-Dependent Mitochondrial Ca2+ Accumulation Regulates ATP Synthesis in Pancreatic β Cells. Pflugers Arch (2013) 465:543–54. doi: 10.1007/s00424-012-1177-9
286. Lewandowski SL, Cardone RL, Foster HR, Ho T, Potapenko E, Poudel C, et al. Pyruvate Kinase Controls Signal Strength in the Insulin Secretory Pathway. Cell Metab (2020) 32:736–50. doi: 10.1016/j.cmet.2020.10.007
287. Zhao Y, Shen Y, Wen Y, Campbell RE. High-Performance Intensiometric Direct- and Inverse-Response Genetically Encoded Biosensors for Citrate. ACS Cent Sci (2020) 6:1441–50. doi: 10.1021/acscentsci.0c00518
288. Nasu Y, Murphy-Royal C, Wen Y, Haidey JN, Molina RS, Aggarwal A, et al. A Genetically Encoded Fluorescent Biosensor for Extracellular L-Lactate. Nat Commun (2021) 12:7058. doi: 10.1038/s41467-021-27332-2
289. Kuznetsov A, Bindokas VP, Marks JD, Philipson LH. FRET-Based Voltage Probes for Confocal Imaging: Membrane Potential Oscillations Throughout Pancreatic Islets. Am J Physiol Cell Physiol (2005) 289:C224–9. doi: 10.1152/ajpcell.00004.2005
290. Mollinedo-Gajate I, Song C, Knöpfel T. Genetically Encoded Voltage Indicators. Adv Exp Med Biol (2021) 1293:209–24. doi: 10.1007/978-981-15-8763-4_12
291. Reinbothe TM, Mollet IG. Optogenetic Control of Pancreatic Islets. In: Kianianmomeni A. (eds) Optogenetics. Methods in Molecular Biology, vol 1408, New York, NY: Humana Press. doi: 10.1007/978-1-4939-5512-3_8
292. Drucker DJ. Mechanisms of Action and Therapeutic Application of Glucagon-Like Peptide-1. Cell Metab (2018) 27:740–56. doi: 10.1016/j.cmet.2018.03.001
293. Capozzi ME, Svendsen B, Encisco SE, Lewandowski SL, Martin MD, Lin H, et al. β Cell Tone Is Defined by Proglucagon Peptides Through cAMP Signaling. JCI Insight (2019) 4(5):e126742. doi: 10.1172/jci.insight.126742
294. El K, Gray SM, Capozzi ME, Knuth ER, Jin E, Svendsen B, et al. GIP Mediates the Incretin Effect and Glucose Tolerance by Dual Actions on α Cells and β Cells. Sci Adv (2021) 7:eabf1948. doi: 10.1126/sciadv.abf1948
295. Li D, Chen S, Bellomo EA, Tarasov AI, Kaut C, Rutter GA, et al. Imaging Dynamic Insulin Release Using a Fluorescent Zinc Indicator for Monitoring Induced Exocytotic Release (ZIMIR). Proc Natl Acad Sci (2011) 108:21063–8. doi: 10.1073/pnas.1109773109
296. Huey J, Keutler K, Schultz C. Chemical Biology Toolbox for Studying Pancreatic Islet Function – A Perspective. Cell Chem Biol (2020) 27:1015–31. doi: 10.1016/j.chembiol.2020.07.023
297. Takahashi N, Kishimoto T, Nemoto T, Kadowaki T, Kasai H. Fusion Pore Dynamics and Insulin Granule Exocytosis in the Pancreatic Islet. Science (2002) 297:1349–52. doi: 10.1126/science.1073806
298. Gan WJ, Do OH, Cottle L, Ma W, Kosobrodova E, Cooper-White J, et al. Local Integrin Activation in Pancreatic β Cells Targets Insulin Secretion to the Vasculature. Cell Rep (2018) 24:2819–26. doi: 10.1016/j.celrep.2018.08.035
299. Gosak M, Dolenšek J, Markovič R, Slak Rupnik M, Marhl M, Stožer A. Multilayer Network Representation of Membrane Potential and Cytosolic Calcium Concentration Dynamics in Beta Cells. Chaos Solitons Fractals (2015) 80:76–82. doi: 10.1016/j.chaos.2015.06.009
300. Stendahl JC, Kaufman DB, Stupp SI. Extracellular Matrix in Pancreatic Islets: Relevance to Scaffold Design and Transplantation. Cell Transplant (2009) 18:1–12. doi: 10.3727/096368909788237195
301. Marciniak A, Cohrs CM, Tsata V, Chouinard JA, Selck C, Stertmann J, et al. Using Pancreas Tissue Slices for In Situ Studies of Islet of Langerhans and Acinar Cell Biology. Nat Protoc (2014) 9:2809–22. doi: 10.1038/nprot.2014.195
302. Qadir MMF, Álvarez-Cubela S, Weitz J, Panzer JK, Klein D, Moreno-Hernández Y, et al. Long-Term Culture of Human Pancreatic Slices as a Model to Study Real-Time Islet Regeneration. Nat Commun (2020) 11:3265. doi: 10.1038/s41467-020-17040-8
303. Stožer A, Dolenšek J, Križančić Bombek L, Pohorec V, Slak Rupnik M, Klemen MS. Confocal Laser Scanning Microscopy of Calcium Dynamics in Acute Mouse Pancreatic Tissue Slices. J Vis Exp (2021) 170:e62293. doi: 10.3791/62293
304. Prince VE, Anderson RM, Dalgin G. Zebrafish Pancreas Development and Regeneration. Curr Top Dev Biol (2017) 124:235–76. doi: 10.1016/bs.ctdb.2016.10.005
305. Ilegems E, Berggren PO. The Eye as a Transplantation Site to Monitor Pancreatic Islet Cell Plasticity. Front Endocrinol (Lausanne) (2021) 12:652853. doi: 10.3389/FENDO.2021.652853
306. Mojibian M, Harder B, Hurlburt A, Bruin JE, Asadi A, Kieffer TJ. Implanted Islets in the Anterior Chamber of the Eye Are Prone to Autoimmune Attack in a Mouse Model of Diabetes. Diabetologia (2013) 56:2213–21. doi: 10.1007/s00125-013-3004-z
308. Kenett DY, Havlin S. Network Science: A Useful Tool in Economics and Finance. Mind Soc (2015) 14:155–67. doi: 10.1007/s11299-015-0167-y
309. Wang X, Sirianni AD, Tang S, Zheng Z, Fu F. Public Discourse and Social Network Echo Chambers Driven by Socio-Cognitive Biases. Phys Rev X (2020) 10:41042. doi: 10.1103/PhysRevX.10.041042
Keywords: pancreatic islets, beta cells, calcium imaging, intercellular communication, functional networks, multilayer networks
Citation: Stožer A, Šterk M, Paradiž Leitgeb E, Markovič R, Skelin Klemen M, Ellis CE, Križančić Bombek L, Dolenšek J, MacDonald PE and Gosak M (2022) From Isles of Königsberg to Islets of Langerhans: Examining the Function of the Endocrine Pancreas Through Network Science. Front. Endocrinol. 13:922640. doi: 10.3389/fendo.2022.922640
Received: 18 April 2022; Accepted: 16 May 2022;
Published: 15 June 2022.
Edited by:
Quan Zhang, University of Oxford, United KingdomReviewed by:
Kazuki Harada, The University of Tokyo, JapanXuelin Lou, Medical College of Wisconsin, United States
Copyright © 2022 Stožer, Šterk, Paradiž Leitgeb, Markovič, Skelin Klemen, Ellis, Križančić Bombek, Dolenšek, MacDonald and Gosak. This is an open-access article distributed under the terms of the Creative Commons Attribution License (CC BY). The use, distribution or reproduction in other forums is permitted, provided the original author(s) and the copyright owner(s) are credited and that the original publication in this journal is cited, in accordance with accepted academic practice. No use, distribution or reproduction is permitted which does not comply with these terms.
*Correspondence: Marko Gosak, bWFya28uZ29zYWtAdW0uc2k=