
94% of researchers rate our articles as excellent or good
Learn more about the work of our research integrity team to safeguard the quality of each article we publish.
Find out more
ORIGINAL RESEARCH article
Front. Endocrinol., 29 July 2022
Sec. Bone Research
Volume 13 - 2022 | https://doi.org/10.3389/fendo.2022.911893
This article is part of the Research TopicCartilage Assessment using Quantitative MRIView all 5 articles
 Enqi Chen1†
 Wenjing Hou1†Hu Wang2†Jing Li1Yangjing Lin3He Liu1Mingshan Du1Lian Li1Xianqi Wang1Jing Yang1Rui Yang1Changru Zhou1Pinzhen Chen1Meng Zeng1Qiandong Yao2*
 Wei Chen1*
Purpose: The aim of this study was to assess quantitatively articular cartilage volume, thickness, and T2 value alterations in meniscus tear patients.
Materials and methods: The study included 32 patients with meniscus tears (17 females, 15 males; mean age: 40.16 ± 11.85 years) and 24 healthy controls (12 females; 12 males; mean age: 36 ± 9.14 years). All subjects were examined by 3 T magnetic resonance imaging (MRI) with 3D dual-echo steady-state (DESS) and T2 mapping images. All patients underwent diagnostic arthroscopy and treatment. Cartilage thickness, cartilage volume and T2 values of 21 subregions of knee cartilage were measured using the prototype KneeCaP software (version 2.1; Siemens Healthcare, Erlangen, Germany). Mann-Whitney-U tests were utilized to determine if there were any significant differences among subregional articular cartilage volume, thickness and T2 value between patients with meniscus tear and the control group.
Results: The articular cartilage T2 values in all subregions of the femur and tibia in the meniscus tear group were significantly higher (p< 0.05) than in the healthy control group. The cartilage thickness of the femoral condyle medial, femur trochlea, femur condyle lateral central, tibia plateau medial anterior and patella facet medial inferior in the meniscus tear group were slightly higher than in the control group (p< 0.05). In the femur trochlea medial, patella facet medial inferior, tibia plateau lateral posterior and tibia plateau lateral central, there were significant differences in relative cartilage volume percentage between the meniscus tear group and the healthy control group (p< 0.05). Nineteen patients had no cartilage abnormalities (Grade 0) in the meniscus tear group, as confirmed by arthroscopic surgery, and their T2 values in most subregions were significantly higher (p< 0.05) than those of the healthy control group.
Conclusion: The difference in articular cartilage indexes between patients with meniscus tears and healthy people without such tears can be detected by using quantitative MRI. Quantitative T2 values enable early and sensitive detection of early cartilage lesions.
Articular cartilage plays an important role in reducing friction, balancing load and damping in joints. However, as hyaline cartilage, articular cartilage lacks the nutritional support of blood vessels, nerves and other tissues. It can only obtain nutrition through the synovial fluid secreted by the synovium, and therefore lacks intrinsic regenerative capabilities (1–3) . As an important part of the knee joint, the meniscus also plays an essential role in maintaining the stability of the joint. Meniscal tears will cause changes in the weight-bearing capacity of the knee joint, often secondary to the destruction of the integrity of the articular cartilage and subchondral bone disease, and eventually lead to knee osteoarthritis, joint dysfunction and even disability (1, 4). Therefore, early detection of articular cartilage lesions, and intervention, is especially critical for patients with meniscus tear. Arthroscopy is an important tool for detecting articular cartilage injury, but it is limited by its invasiveness and insensitivity to early cartilage lesions without morphological changes.
Magnetic resonance imaging (MRI) is the first modality of choice for noninvasive detection of articular cartilage lesions. 3D-DESS, 3D-FLASH and 3D-SPACE sequences can display articular cartilage with high resolution and obtain accurate morphological parameters. In recent years the functional sequences have been used extensively in cartilage and cartilage repair research, such as delayed gadolinium-enhanced MRI of cartilage (dGEMRIC), T2 Mapping, T1rho and Na-MRI; they can detect biochemical and microstructural changes in the cartilage extracellular matrix even before gross morphologic changes occur (5–7). These quantitative MRI techniques make a more sensitive analysis of articular cartilage by measuring morphological and biochemical changes quantitatively, and have high accuracy and excellent repeatability (8, 9). However, as yet there has been no detailed investigation of articular cartilage morphology changes in patients with meniscus tear. The purpose of this study is to use MRI to measure the volume, thickness and T2 value of articular cartilage in patients with meniscus tear, and compare them with normal articular cartilage.
From June 2021 to February 2022, 32 patients with meniscus tears (17 females, 15 males; mean age: 40.16 ± 11.85 years) were selected, including 16 patients with left knee involvement and 16 patients with right knee involvement. Clinically, all patients had different degrees of knee pain, and all of them underwent preoperative MRI examination. A healthy control group of 24 knees (12 females; 12 males; mean age: 36 ± 9.14 years) was used for comparison. All subjects refrained from participation in any strenuous exercise in the 2 hours before the MRI. This was a retrospective study approved by the Medical Ethics Committee of Southwest Hospital, and we obtained the written informed consent of all subjects.
The patients in the meniscus tear group were all examined and treated under arthroscopy. The surgeons carefully examined the cartilage in the patellofemoral compartment, medial compartment, and lateral compartment, using the Outerbridge classification (10) for grading chondral lesions: Grade 0, normal articular cartilage; Grade I, chondromalacia edema or surface bubbles; Grade II, fragmentation and fissuring of articular cartilage affecting an area > 0.5 inches; Grade III, fragmentation and fissuring of articular cartilage affecting an area > 0.5 inches and Grade IV, full-thickness cartilage defect, stripped, subchondral bone exposed.
All the subjects underwent MR examinations of the knee joint on a 3 T MR scanner MAGNETOM Spectra (Siemens Shenzhen Magnetic Resonance Ltd, Shenzhen, China). An eighteen-channel knee coil was used for all the MR knee scans with subjects in a supine position and feet first mode. The following MR sequences were performed: sagittal and coronal TSE T1WI (matrix 320 × 240, repetition time (TR) ms/echo time (TE) ms: 500/12, field of view (FOV) = 130*130 mm2, slice thickness = 3 mm, flip angle = 150°, total scan time = 96s); sagittal PDWI (matrix 384 × 288, TR ms/TE ms: 3000/12, FOV = 130*130 mm2, slice thickness = 3 mm, flip angle = 150°, total scan time = 131s); sagittal 3D dual echo steady state (DESS; matrix 256 × 238, TR ms/TE ms: 14.8/5.3, FOV = 150mm, slice thickness = 0.6 mm, flip angle = 25°, total scan time = 367s); T2 mapping (matrix: 384 x 288, TR/TE: 1925 ms/14 ms, FOV = 160 mm, slice thickness = 3 mm, flip angle = 180°, total scan time = 369s).
A post-processing prototype software, KneeCaP (version 2.1, Siemens Healthcare, Erlangen, Germany), whose segmentation algorithm is based on the process and algorithm proposed by Fripp (11), was used to perform automated cartilage segmentation and measurement. The KneeCaP software segmented the sagittal MR image of the 3D-DESS sequence, divided the cartilage into 21 subregions according to the International Cartilage Repair Society (ICRS; 12; see Table 1 and Figure 1), and obtained the volume and thickness results of each subregion. Then the 3D-DESS image was registered to the T2 mapping image to extract the T2 value (13). When the automatic segmentation was completed, we observed whether the segmentation result was accurate. If the result was accurate, the segmentation was considered acceptable. If not, further manual correction was needed. The relative percentage of cartilage volume was calculated as follows:
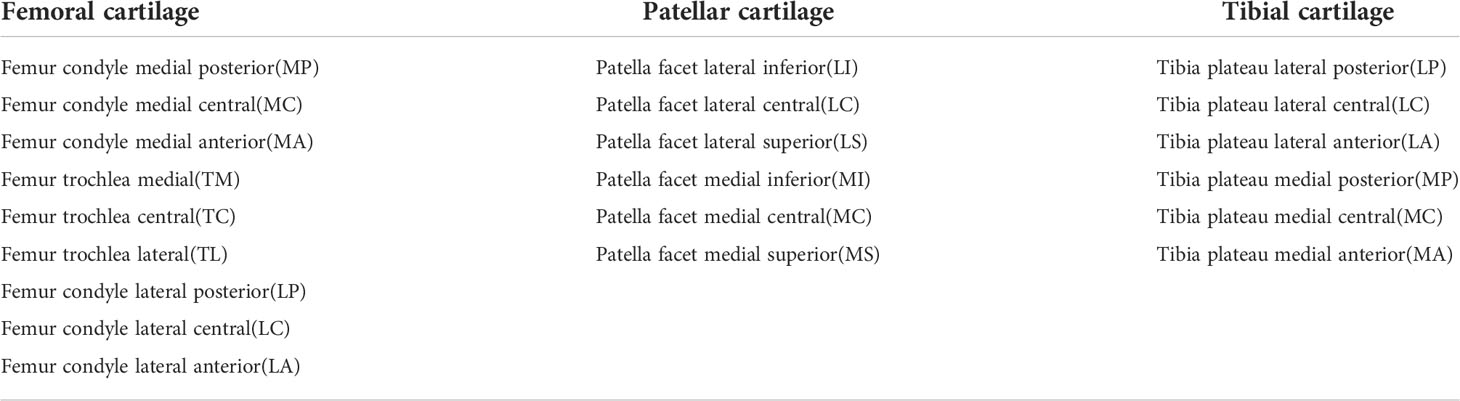
Table 1 21 subregions of knee articular cartilage automatically segmented by KneeCaP software.
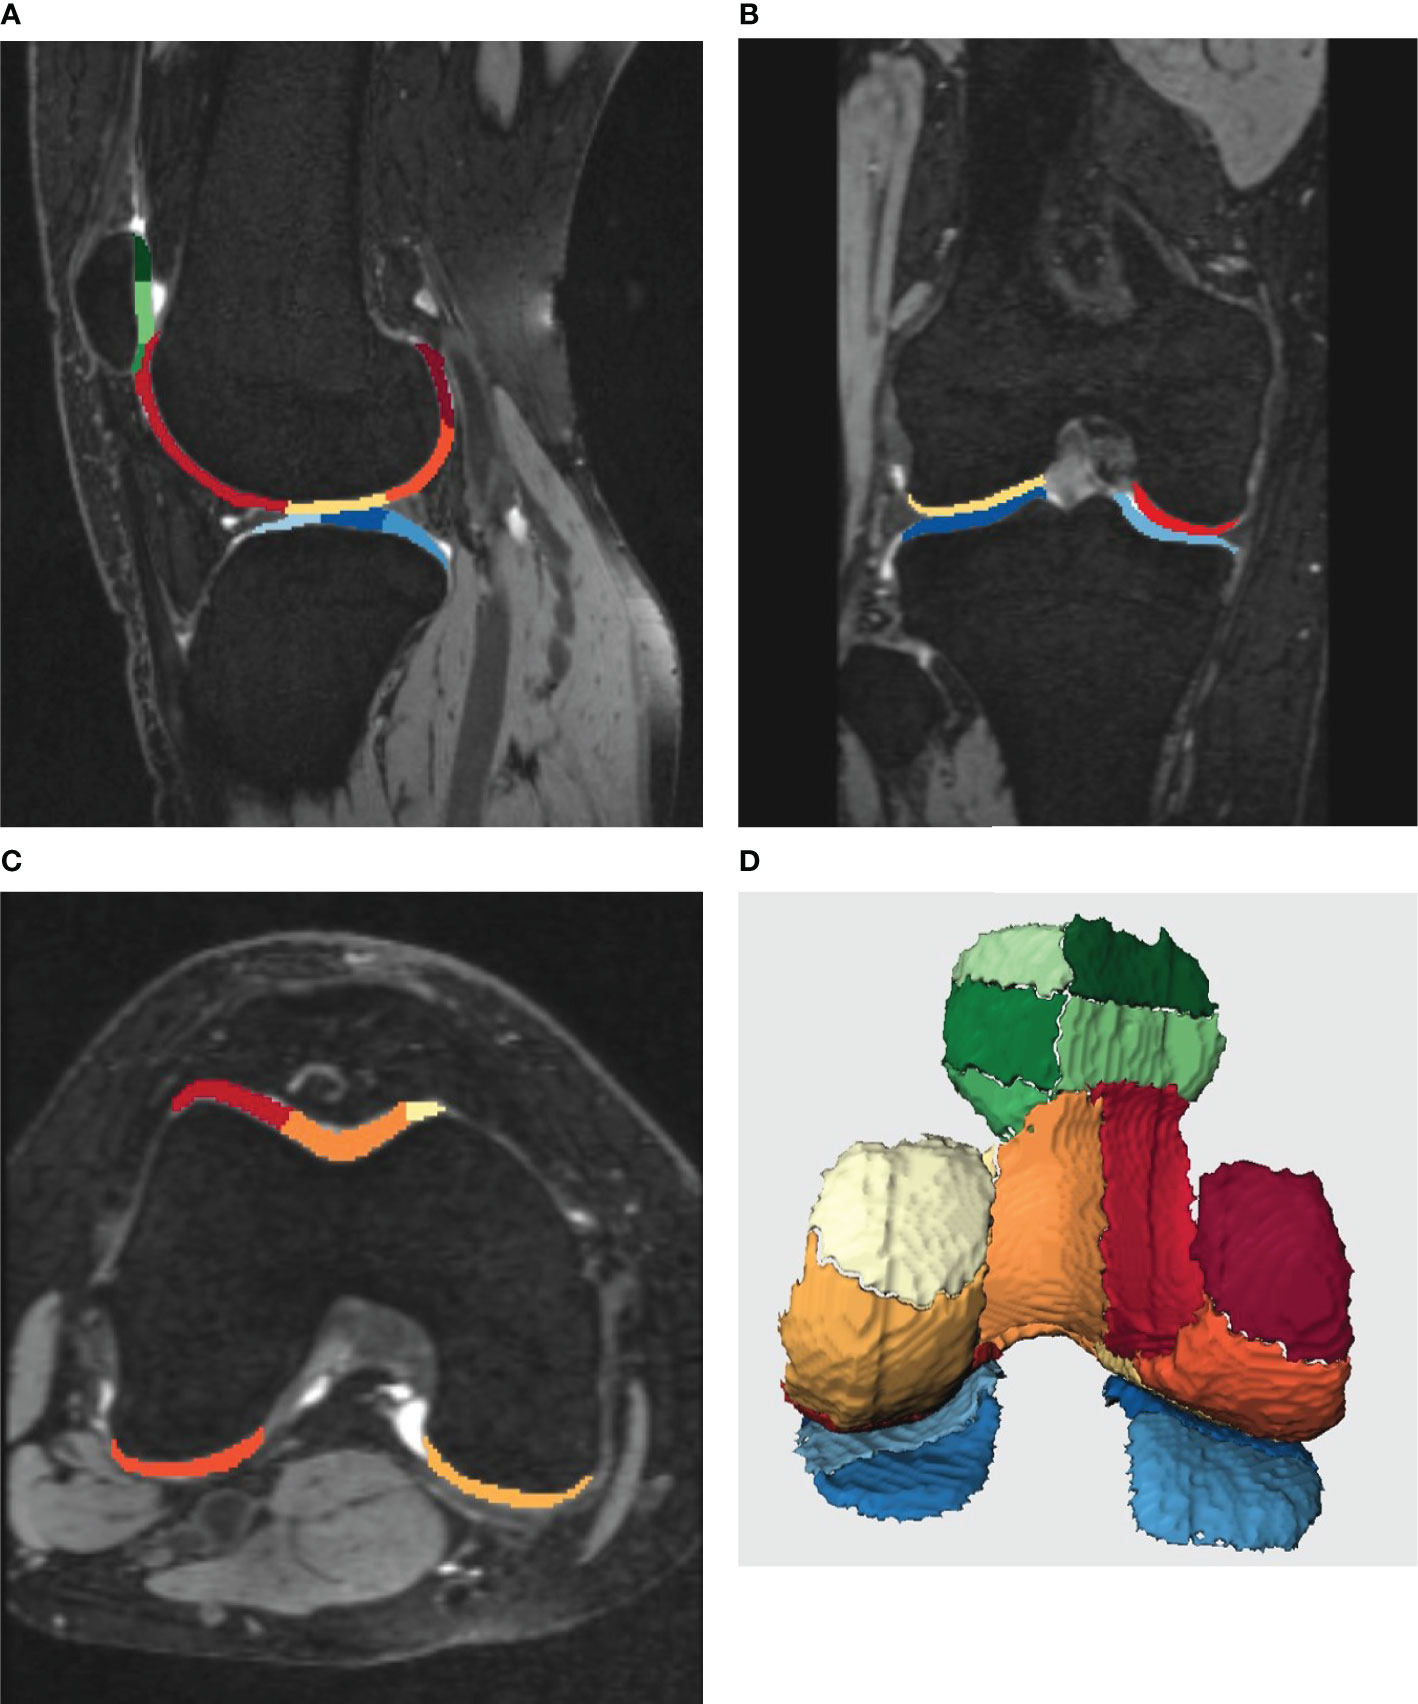
Figure 1 (A-D) shows the post-processing results of knee cartilage segmentation by Siemens KneeCaP software. Different colors represent different subregions of cartilage. (A-C), the image of cartilage segmentation with bone. (A), the sagittal image of the lateral tibiofemoral joint, (B), the coronal image of the tibiofemoral joint, (C), the cross-sectional image of the femur. (D), 3D image of cartilage segmentation after bone removal (posterior anterior position).
SPSS 21.0 software (SPSS, version 21.0, Chicago, IL, United States) was used for statistical analysis. Mann-Whitney-U tests were used to compare 1) the differences in relative cartilage volume percentage, cartilage thickness and T2 value between the meniscus tear group and the healthy control group; 2) the differences in relative cartilage volume percentage, cartilage thickness and T2 value between the Grade 0 subgroup in the meniscal tear group and the healthy control group. The test level α = 0.05 (p< 0.05) was considered statistically significant.
Arthroscopic results showed that in the meniscus tear group, there were 17 cases of medial meniscus tear (53.1%), 14 cases of lateral meniscus tear (43.8%), and 1 case of medial and lateral meniscus injury (3.1%). Cartilage lesions were evaluated according to arthroscopic Outerbridge Grade, including 19 cases of Grade 0 (59.4%), 7 cases of Grade 1 (21.9%), 3 cases of Grade 2 (9.4%), 3 cases of Grade 3 (9.4%) and 0 cases of Grade 4. The distribution of cartilage injury sites was as follows: 8 cases of medial compartment, 4 cases of lateral compartment, and 1 case of patellofemoral joint.
Table 2 shows the median T2 value of 21 subregions of knee cartilage in the meniscus tear and healthy control groups. The T2 values of 9 subregions of the femur and 6 subregions of the tibia in the meniscus tear group were higher than those in the control group (p< 0.05). Compared with the healthy control group, the relative articular cartilage volume percentage in the meniscus tear group was statistically significant only in the following subregions: femur (TM), tibia (LP, LC) and patella (MI; p< 0.05; Table 3), in which the relative articular cartilage volume percentage in the patella (LP, LC) decreased slightly compared with the healthy group, and that in the femur (TM) and patella (MI) increased slightly. Compared with the healthy control group, the thickness of cartilage in the meniscus tear group increased in the following subregions: femur (MP, MC, MA, TM, TC, TL, LC), tibia (MA) and patella (MI; p< 0.05; Table 4).
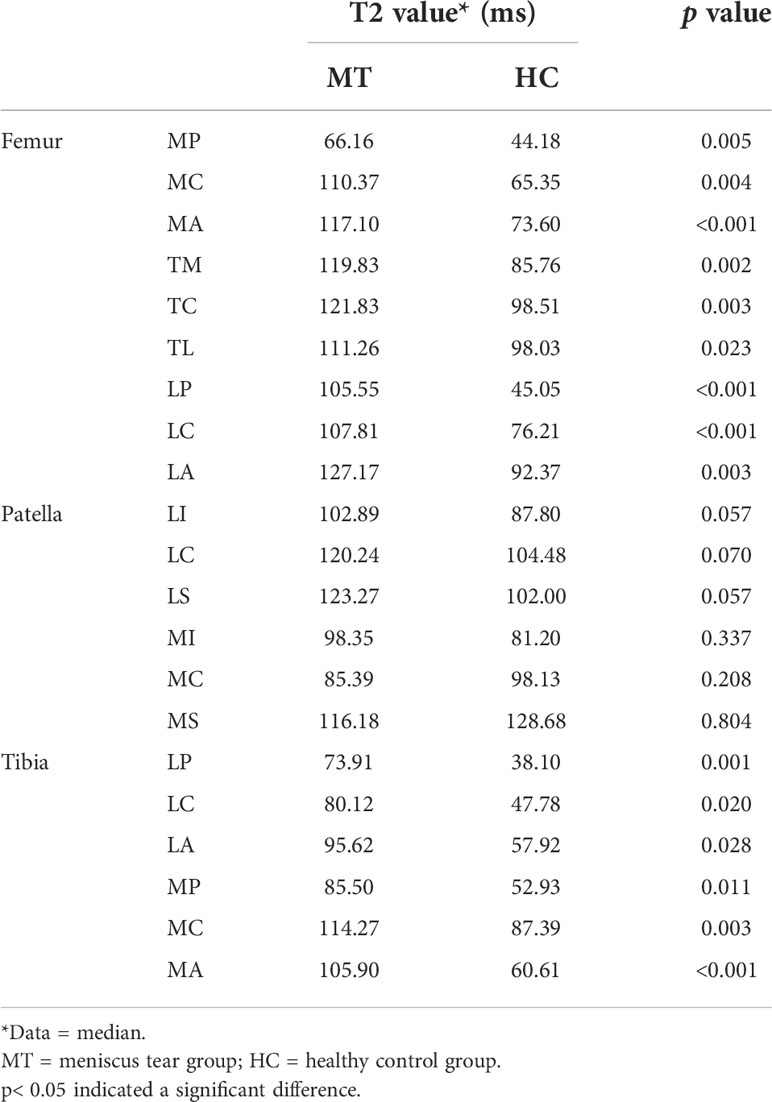
Table 2 Comparison of T2 values of the articular cartilage 21 subregions between the meniscus tear group and the healthy control group.
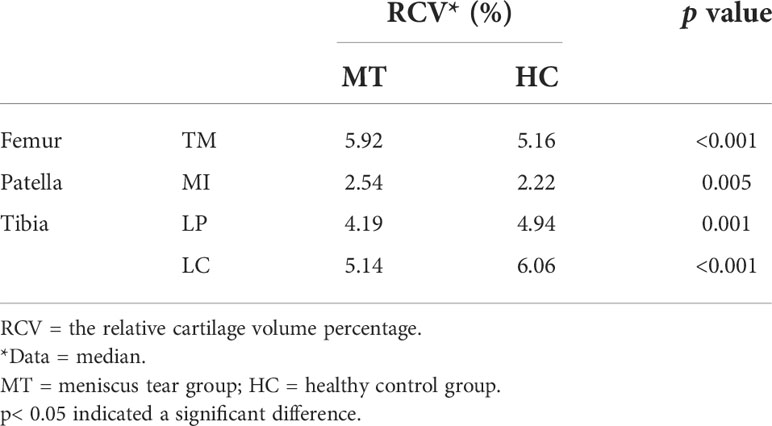
Table 3 Comparison of the relative cartilage volume percentage of the articular cartilage 21 subregions between the healthy control group and the meniscus tear group (only showing the subregions with significant differences).

Table 4 Comparison of thickness of the articular cartilage 21 subregion between the healthy control group and the meniscus tear group.
Table 5 shows that in the meniscus tear group, 19 patients had no cartilage abnormalities (Grade 0) confirmed by arthroscopic surgery, but the T2 values of Grade 0 cartilage in most subregions were higher than that in the healthy control group, including 9 subregions of the femur, tibia (LP, MP, MC, MA) and patella (LI, LS; p< 0.05). There was only a small difference in the relative cartilage volume percentage between the two groups. The relative cartilage volume percentage of the femur (TM) and patella (MI) in the Grade 0 subgroup were slightly higher than that in the healthy control group, and that of the tibia (LP, LC) was lower than that in the healthy control group (p< 0.05; Table 6). The cartilage thicknesses of the femur (MC, MA, TM, TC, TL, LC), patella (MS) and tibia (MA) in the Grade 0 subgroup were higher than those in the healthy control group (p< 0.05; Table 7).
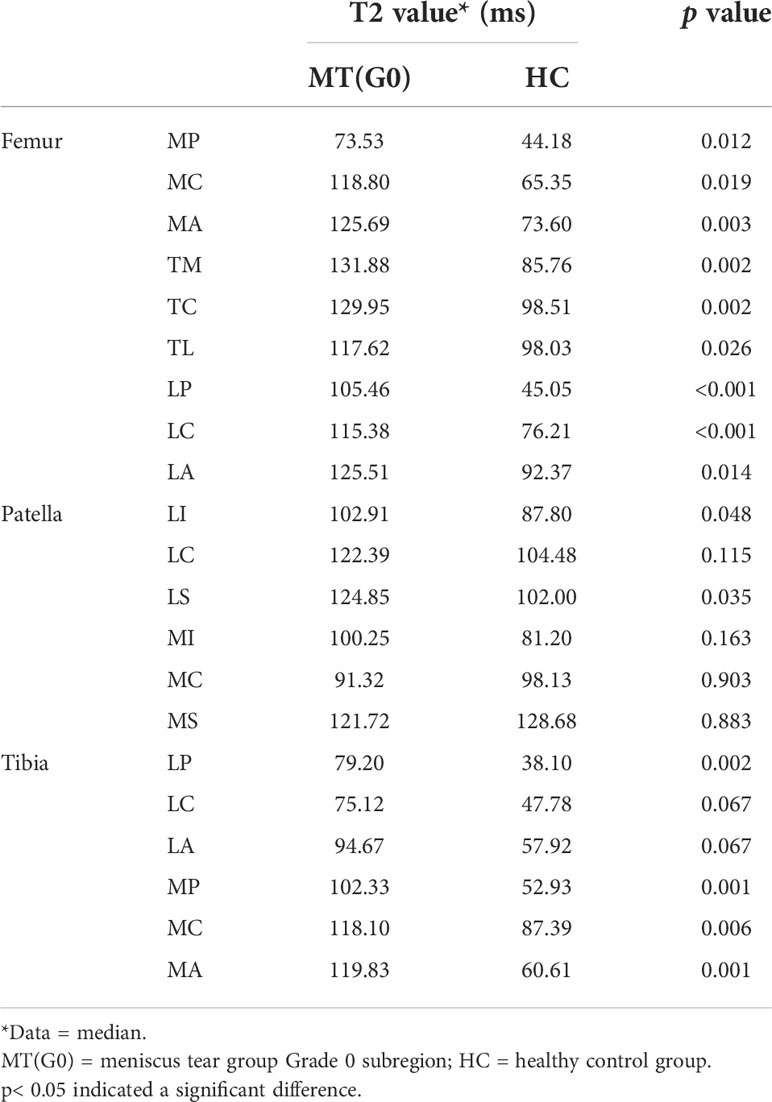
Table 5 Comparison of T2 values of the articular cartilage 21 subregion between the meniscus tear group Grade 0 subgroup and the healthy control group.

Table 6 Comparison of the relative cartilage volume percentage of the articular cartilage 21 subregion between the healthy control group and the meniscus tear group Grade 0 subgroup (only showing the subregions with significant differences).
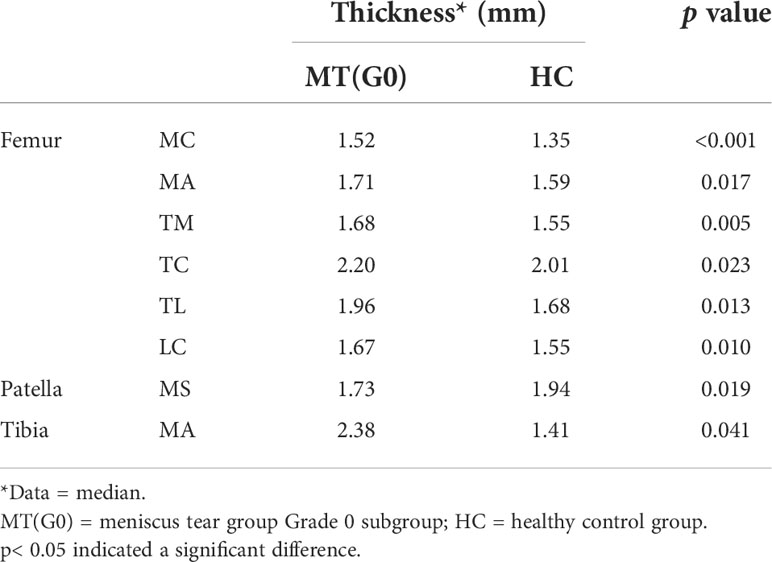
Table 7 Comparison of thickness of the articular cartilage 21 subregion between the healthy control group and the meniscus tear group Grade 0 subgroup (only showing the subregions with significant differences).
In our study, arthroscopy showed that most of the articular cartilage in the meniscus tear group was normal (59.4%), and 13 (40.6%) patients in the meniscus tear group had grade I-III cartilage lesions. The cartilage injuries accounted for 40.6%, of which the primary injury was 21.9%, and the injury site was mostly located in the medial compartment of the knee joint (61.5%). This finding is consistent with previous studies that cartilage volume is reduced in the meniscal tear group compared to those without an absence of tears, especially in the medial compartment of the knee, as suggested by Berthiaume et al. (14). The T2 values of all subregions of the femur and tibia in the meniscus tear group were higher than those in the healthy control group, which could reflect the relationship between meniscus tear and cartilage lesion. The meniscus and articular cartilage of the knee joint are highly correlated in embryology, anatomy and function, which explains why the pathological changes in one also affect the other. The disorder of meniscus structure will influence the distribution of strength, and the pressure load on articular cartilage will increase, resulting in cartilage lesion (15, 16). This close relationship is also confirmed by the effect of meniscus lesion on articular cartilage (14, 17, 18). The individual differences in cartilage volume of the knee joint were affected by many factors, the volume being positively correlated with body weight, height, leg length, and foot size (19, 20). In this study, the relative cartilage volume percentage in each subregion of the knee was used to detect the differences in cartilage volume between patients with meniscus tear and healthy volunteers, which can reduce the somatotype difference in cartilage volume to a certain extent. The results showed that the relative cartilage percentage in the femur (TM) and patella (MI) subregions in the meniscus tear group were higher than that in the healthy control group, while in the tibia (LP, LC) subregion it decreased. This is inconsistent with Berthiaume’s findings (14). We speculate that the reasons could be: 1) The change in cartilage volume depends on the grade of cartilage lesion. Grade I cartilage lesion shows cartilage swelling, resulting in cartilage volume slightly increasing, while grade II-IV cartilage injury shows different degrees of cartilage defect, resulting in cartilage volume reduction. In our meniscus tear group, normal cartilage and grade I cartilage lesion accounted for the largest proportion; 2) The relative cartilage volume percentage could only reduce the influence of somatotype difference to a certain extent (21), but it could not completely eliminate other influencing factors. In the horizontal research, when the cartilage injury is mild, the relative cartilage volume percentage may not accurately reflect the change in cartilage volume. All these hypotheses need to be confirmed by further research; 3) Automatic segmentation with the prototype KneeCaP software on severely injured articular cartilage was not accurate enough. The automatic segmentation software mistakenly regarded the synovial tissue around the cartilage as cartilage tissue, resulting in a larger volume of cartilage segmentation than its actual volume (21). Our study showed that the thickness of cartilage in patients with meniscus tear was higher than that in healthy controls in most subregions of the femur and some subregions of the patella and tibia, and the difference was statistically significant. This result indirectly reflected the swelling of cartilage in patients with meniscus tear.
By comparing the differences in T2 value, cartilage volume percentage and cartilage thickness between patients with meniscus tear Grade 0 and the control group, we found that the T2 value of most subregions of cartilage in the former was higher than in the latter, which suggests that there were biochemical changes in articular cartilage at an earlier stage than morphological changes in patients with meniscus tear. However, it is difficult to observe this subtle change using arthroscopy. One advantage of cartilage MRI examination is that the T2 value of cartilage can indirectly reflect the changes in biochemical components. The value of T2 is mainly affected by the water content and collagen fibers. The increase in T2 value usually represents an increase in water content and a loss of collagen anisotropy (22, 23). Previous studies have confirmed that articular cartilage lesion will be accompanied by an increase in T2 value (24). In this study, we found that the T2 values of articular cartilage in patients with meniscus tears increased in most subregions, which also indirectly verifies the above conclusions.
In contrast to some previous studies, where the region of interest was sketched manually, we performed automatic segmentation in all subjects, which has excellent reproducibility and is not affected by inter-observer variation (21). It also leads to a reduction in the time and effort involved. However, the T2 value of articular cartilage we obtained is generally higher than in previous studies, mainly because of our different methods of measuring T2 value and registration algorithm (25, 26).There are several limitations to our study: 1) The sample size was small and the degree of cartilage lesion in the meniscus tear group was uneven, especially the large proportion of grade 0, which is why we did not further discuss the classification of cartilage lesion in the groups. Therefore, it is necessary to further expand the sample size in future research to improve its credibility. 2) In our study, various indexes of articular cartilage in the two groups were compared horizontally, which made it difficult to avoid the errors in T2 value caused by individual differences, such as age and BMI (27, 28). In the follow-up, we will longitudinally follow up the changes in cartilage in patients with meniscus tear after arthroscopic treatment.
To sum up, there are differences in various indexes of articular cartilage between patients with meniscus tear and healthy subjects, which can be detected by MRI quantitative techniques. Quantitative magnetic resonance T2 technology has a higher sensitivity to early cartilage lesion than arthroscopy. Morphological quantitative parameters such as cartilage volume and thickness are relatively less sensitive to mild cartilage lesion, and morphological quantitative parameters of cartilage are more suitable for longitudinal research.
The original contributions presented in the study are included in the article/supplementary material. Further inquiries can be directed to the corresponding authors.
The studies involving human participants were reviewed and approved by The Medical Ethics Committee of Southwest Hospital. The patients/participants provided their written informed consent to participate in this study. Written informed consent was obtained from the individual(s) for the publication of any potentially identifiable images or data included in this article.
EC, WH, HW and WC finished this article. EC, WH, JL and YL acquired the data together. EC, WH, QY and WC designed this study. All authors researched the literature and analyzed the results together.
The authors would like to thank Axel Newe from Methodpark, Erlangen, Germany for his work on the KneeCaP prototype and International Science Editing for editing this manuscript.
The authors declare that the research was conducted in the absence of any commercial or financial relationships that could be construed as a potential conflict of interest.
All claims expressed in this article are solely those of the authors and do not necessarily represent those of their affiliated organizations, or those of the publisher, the editors and the reviewers. Any product that may be evaluated in this article, or claim that may be made by its manufacturer, is not guaranteed or endorsed by the publisher.
1. Komarraju A, Goldberg-Stein S, Pederson R, McCrum C, Chhabra A. Spectrum of common and uncommon causes of knee joint hyaline cartilage degeneration and their key imaging features. Eur J Radiol (2020) 129:109097. doi: 10.1016/j.ejrad.2020.109097
2. Correa D, Lietman SA. Articular cartilage repair: Current needs, methods and research directions. Semin Cell Dev Biol (2017) 62:67–77. doi: 10.1016/j.semcdb.2016.07.013
3. Ulrich-Vinther M, Maloney MD, Schwarz EM, Rosier R, O'Keefe RJ. Articular cartilage biology. J Am Acad Orthopaedic Surgeons (2003) 11(6):421–30. doi: 10.5435/00124635-200311000-00006
4. Englund M. The role of the meniscus in osteoarthritis genesis. Med Clinics North America (2009) 93(1):37–43. doi: 10.1016/j.mcna.2008.08.005
5. Li X, Majumdar S. Quantitative MRI of articular cartilage and its clinical applications. J Magnetic Resonance Imaging (2013) 38(5):991–1008. doi: 10.1002/jmri.24313
6. Guermazi A, Roemer FW, Alizai H, Winalski CS, Welsch G, Brittberg M, et al. State of the art: MR imaging after knee cartilage repair surgery. Radiology (2015) 277(1):23–43. doi: 10.1148/radiol.2015141146
7. Guermazi A, Alizai H, Crema MD, Trattnig S, Regatte RR, Roemer FW. Compositional MRI techniques for evaluation of cartilage degeneration in osteoarthritis. Osteoarthritis Cartilage (2015) 23(10):1639–53. doi: 10.1016/j.joca.2015.05.026
8. Juras V, Szomolanyi P, Schreiner MM. Reproducibility of an automated quantitative MRI assessment of low-grade knee articular cartilage lesions. Cartilage (2021) 13(Suppl 1):646s–57s. doi: 10.1177/1947603520961165
9. Baum T, Joseph GB, Karampinos DC, Jungmann PM, Link TM, Bauer JS. Cartilage and meniscal T2 relaxation time as non-invasive biomarker for knee osteoarthritis and cartilage repair procedures. Osteoarthritis Cartilage (2013) 21(10):1474–84. doi: 10.1016/j.joca.2013.07.012
10. Slattery C, Kweon CY. Classifications in brief: Outerbridge classification of chondral lesions. Clin Orthopaedics Related Res (2018) 476(10):2101–4. doi: 10.1007/s11999.0000000000000255
11. Fripp J, Crozier S, Warfield SK, Ourselin S. Automatic segmentation and quantitative analysis of the articular cartilages from magnetic resonance images of the knee. IEEE Trans Med Imaging (2010) 29(1):55–64. doi: 10.1109/TMI.2009.2024743
12. Surowiec RK, Lucas EP, Fitzcharles EK, Petre BM, Dornan GJ, Giphart JE, et al. T2 values of articular cartilage in clinically relevant subregions of the asymptomatic knee. Knee Surg Sports Traumatol Arthrosc (2014) 22(6):1404–14. doi: 10.1007/s00167-013-2779-2
13. Newe A. Towards an easier creation of three-dimensional data for embedding into scholarly 3D PDF (Portable document format) files. PeerJ (2015) 3:e794. doi: 10.7717/peerj.794
14. Berthiaume M-J, Raynauld J-P, Martel-Pelletier J, Labonté F, Beaudoin G, Bloch DA, et al. Meniscal tear and extrusion are strongly associated with progression of symptomatic knee osteoarthritis as assessed by quantitative magnetic resonance imaging. Ann Rheum Dis (2005) 64(4):556–63. doi: 10.1136/ard.2004.023796
15. Kopf S, Sava MP, Stärke C, Becker R. The menisci and articular cartilage: a life-long fascination. EFORT Open Rev (2020) 5(10):652–62. doi: 10.1302/2058-5241.5.200016
16. Englund M, Roemer FW, Hayashi D, Crema MD, Guermazi A. Meniscus pathology, osteoarthritis and the treatment controversy. Nat Rev Rheumatol (2012) 8(7):412–9. doi: 10.1038/nrrheum.2012.69
17. Christoforakis J, Pradhan R, Sanchez-Ballester J, Hunt N, Strachan RK. Is there an association between articular cartilage changes and degenerative meniscus tears? Arthroscopy (2005) 21(11):1366–9. doi: 10.1016/j.arthro.2005.08.031
18. Crema MD, Hunter DJ, Burstein D, Roemer FW, Li L, Krishnan N, et al. Delayed gadolinium-enhanced magnetic resonance imaging of medial tibiofemoral cartilage and its relationship with meniscal pathology: a longitudinal study using 3.0T magnetic resonance imaging. Arthritis Rheumatol (Hoboken NJ) (2014) 66(6):1517–24. doi: 10.1002/art.38518
19. Eckstein F, Winzheimer M, Hohe J, Englmeier KH, Reiser M. Interindividual variability and correlation among morphological parameters of knee joint cartilage plates: analysis with three-dimensional MR imaging. Osteoarthritis Cartilage (2001) 9(2):101–11. doi: 10.1053/joca.2000.0365
20. Nishimura K, Tanabe T, Kimura M, Harasawa A, Karita K, Matsushita T. Measurement of articular cartilage volumes in the normal knee by magnetic resonance imaging: can cartilage volumes be estimated from physical characteristics? J Orthopaedic Sci (2005) 10(3):246–52. doi: 10.1007/s00776-005-0889-5
21. Hou W, Zhao J, He R, Li J, Ou Y, Du M, et al. Quantitative measurement of cartilage volume with automatic cartilage segmentation in knee osteoarthritis. Clinical Rheumatol (2021) 40(5):1997–2006. doi: 10.1007/s10067-020-05388-7
22. Le J, Peng Q, Sperling K. Biochemical magnetic resonance imaging of knee articular cartilage: T1rho and T2 mapping as cartilage degeneration biomarkers. Ann NY Acad Sci (2016) 1383(1):34–42. doi: 10.1111/nyas.13189
23. Martín Noguerol T, Raya JG, Wessell DE, Vilanova JC, Rossi I, Luna A. Functional MRI for evaluation of hyaline cartilage extracelullar matrix, a physiopathological-based approach. Br J Radiol (2019) 92(1103):20190443. doi: 10.1259/bjr.20190443
24. Nishioka H, Hirose J, Nakamura E, Okamoto N, Karasugi T, Taniwaki T, et al. Detecting ICRS grade 1 cartilage lesions in anterior cruciate ligament injury using T1ρ and T2 mapping. Eur J Radiol (2013) 82(9):1499–505. doi: 10.1016/j.ejrad.2013.04.038
25. Surowiec RK, Lucas EP, Ho CP. Quantitative MRI in the evaluation of articular cartilage health: reproducibility and variability with a focus on T2 mapping. Knee Surg Sports Traumatol Arthrosc (2014) 22(6):1385–95. doi: 10.1007/s00167-013-2714-6
26. Koff MF, Amrami KK, Felmlee JP, Kaufman KR. Bias of cartilage T2 values related to method of calculation. Magnetic Resonance Imaging (2008) 26(9):1236–43. doi: 10.1016/j.mri.2008.03.002
27. Joseph GB, McCulloch CE, Nevitt MC, Heilmeier U, Nardo L, Lynch JA, et al. A reference database of cartilage 3 T MRI T2 values in knees without diagnostic evidence of cartilage degeneration: data from the osteoarthritis initiative. Osteoarthritis Cartilage (2015) 23(6):897–905. doi: 10.1016/j.joca.2015.02.006
Keywords: articular cartilage, meniscus tear, quantitative, T2 mapping, cartilage thickness, MRI, cartilage volume
Citation: Chen E, Hou W, Wang H, Li J, Lin Y, Liu H, Du M, Li L, Wang X, Yang J, Yang R, Zhou C, Chen P, Zeng M, Yao Q and Chen W (2022) Quantitative MRI evaluation of articular cartilage in patients with meniscus tear. Front. Endocrinol. 13:911893. doi: 10.3389/fendo.2022.911893
Received: 03 April 2022; Accepted: 30 June 2022;
Published: 29 July 2022.
Edited by:
Saeed Jerban, University of California, San Diego, United StatesReviewed by:
Dina Moazamian, University of California, San Diego, United StatesCopyright © 2022 Chen, Hou, Wang, Li, Lin, Liu, Du, Li, Wang, Yang, Yang, Zhou, Chen, Zeng, Yao and Chen. This is an open-access article distributed under the terms of the Creative Commons Attribution License (CC BY). The use, distribution or reproduction in other forums is permitted, provided the original author(s) and the copyright owner(s) are credited and that the original publication in this journal is cited, in accordance with accepted academic practice. No use, distribution or reproduction is permitted which does not comply with these terms.
*Correspondence: Wei Chen, bGFuZGN3QGhvdG1haWwuY29t; Qiandong Yao, ZWFzdHN1bnlhb0AxMjYuY29t
†These authors have contributed equally to this work and share first authorship
Disclaimer: All claims expressed in this article are solely those of the authors and do not necessarily represent those of their affiliated organizations, or those of the publisher, the editors and the reviewers. Any product that may be evaluated in this article or claim that may be made by its manufacturer is not guaranteed or endorsed by the publisher.
Research integrity at Frontiers
Learn more about the work of our research integrity team to safeguard the quality of each article we publish.