
94% of researchers rate our articles as excellent or good
Learn more about the work of our research integrity team to safeguard the quality of each article we publish.
Find out more
ORIGINAL RESEARCH article
Front. Endocrinol., 03 June 2022
Sec. Thyroid Endocrinology
Volume 13 - 2022 | https://doi.org/10.3389/fendo.2022.893164
This article is part of the Research TopicHow Can Diet Impair Thyroid Function?View all 7 articles
 Ganghua Lu1†
 Xiaqing Yu1†Wen Jiang1†Qiong Luo1,2Junyu Tong1,2Suyun Fan1,2Li Chai1,2Dingwei Gao1Tingting Qiao1Ru Wang1Chengwen Deng1
 Zhongwei Lv1,2,3,4*Dan Li1,2,4*
Background: Currently, the high morbidity of individuals with thyroid cancer (TC) is an increasing health care burden worldwide. The aim of our study was to investigate the relationship among the gut microbiota community, metabolites, and the development of differentiated thyroid cancer.
Methods: 16S rRNA gene sequencing and an integrated LC–MS-based metabolomics approach were performed to obtain the components and characteristics of fecal microbiota and metabolites from 50 patients with TC and 58 healthy controls (HCs).
Results: The diversity and richness of the gut microbiota in the TC patients were markedly decreased. The composition of the gut microbiota was significantly altered, and the Bacteroides enterotype was the dominant enterotype in TC patients. Additionally, the diagnostic validity of the combined model (three genera and eight metabolites) and the metabolite model (six metabolites) were markedly higher than that of the microbial model (seven genera) for distinguishing TC patients from HCs. LEfSe analysis demonstrated that genera (g_Christensenellaceae_R-7_group, g_Eubacterium_coprostanoligenes_group) and metabolites [27-hydroxycholesterol (27HC), cholesterol] closely related to lipid metabolism were greatly reduced in the TC group. In addition, a clinical serum indicator (total cholesterol) and metabolites (27HC and cholesterol) had the strongest influence on the sample distribution. Furthermore, functional pathways related to steroid biosynthesis and lipid digestion were inhibited in the TC group. In the microbiota-metabolite network, 27HC was significantly related to metabolism-related microorganisms (g_Christensenellaceae_R-7_group).
Conclusions: Our research explored the characteristics of the gut microecology of patients with TC. The findings of this study will help to discover risk factors that affect the occurrence and development of TC in the intestinal microecology.
Thyroid cancer (TC) is one of the most common malignant tumors of the head and neck. The incidence rate of TC has gradually increased worldwide in the past several decades, which is potentially caused by excessive exposure of individuals to disease risk factors (1). Thus far, numerous studies have focused on diet and metabolism, especially obesity, as potential important risk factors for increased morbidity in individuals with TC (2–4). Previous studies have shown that as the body mass index (BMI) increases, the risk of thyroid cancer is subsequently greatly increased (3). Moreover, obesity is an independent risk factor for thyroid malignant tumors, and this association may be further aggravated by metabolic abnormalities (5). In fact, diet plays a decisive role in the human intestinal microecological environment and can, thereby, influence physiological mechanisms of the human body. These findings provide a novel perspective for the association between intestinal flora and thyroid cancer (6).
In recent years, multiple studies have collected small fecal samples to demonstrate that the composition of the gut microbiota in patients with TC is markedly altered compared with healthy controls (HCs). These studies further established an intestinal flora model and metabolite model to characterize thyroid cancer (7–9). Our previous study increased the sample size to verify the connection between TC and gut microbiota and predict a more convincing model of microbial diagnosis and functional pathways (10).
Although these studies have already revealed the underlying associations between the intestinal flora and metabolites in thyroid cancer, the synergistic mediation effects of the gut microbiota and its corresponding metabolites on lipid metabolism disorders in individuals with thyroid cancer were not thoroughly screened. The fecal flora has expansive interrelationships, and the elements that determine the overall microecological balance hinge on the importance instead of the abundance of certain species in the gut network system (11). However, it is still not completely clear which fecal genera and metabolites are of relative importance for thyroid cancer. Therefore, it is urgent to understand if or how lipid metabolism disorders induce thyroid carcinoma by establishing an internetwork model of microbiota and metabolites. This type of network model could not only characterize the crucial and central factors but also reveal potential relationships in multiomics analyses (12).
According to the evidence above, the aim of our study was to investigate the essential fecal genera and metabolites and validate the coexistence relationship between intestinal microbiota and metabolites in patients with TC and in HCs using 16S rRNA sequencing and liquid chromatography mass spectrometry analysis.
This study recruited 50 TC patients (22 males, 28 females, ages 16-69 years, median age 41) from the Department of Nuclear Medicine, Shanghai Tenth People’s Hospital between May 2017 and February 2019. The control group consisted of 58 healthy volunteers (22 males, 36 females, ages 22-71 years, median age 44) who visited this hospital for their routine physical examination. The diagnosis of TC was based on the following criteria: (i) clinically diagnosed with differentiated thyroid cancer within six months (13), (ii) age between 18 and 75 years, female (nonpregnant) or male without history of other malignancies, and (iii) receiving surgical treatment. The healthy volunteers were age-, sex- and BMI-matched with the TC patients. The following patients were also excluded: (i) patients confirmed not to have thyroid cancer on postoperative pathology, (ii) subjects suffering from a gastrointestinal disease or any other severe physical or mental disease, and (iii) subjects with a history of probiotics, orally ingested antibiotics, or any other similar drug within two months before fecal sampling. Fecal samples of the TC patients were collected prior to surgery. The following indices were obtained from the eight-hour fasting blood samples: (i) thyroid function indices, including serum free triiodothyronine (fT3), serum free thyroxine (fT4) and serum thyroid stimulating hormone (TSH); (ii) thyroid antibodies, including serum anti-thyroid peroxidase antibody (TPOAb) and serum anti-thyroid autoantibodies (TgAb); and (iii) serum biochemical indicators, including alanine transaminase (ALT), aspartate transaminase (AST), triglycerides (TGs), serum total cholesterol (TCHO), high-density lipoprotein cholesterol (HDL), and low-density lipoprotein cholesterol (LDL). The diagnosis of TC was determined by two independent pathologists in Shanghai Tenth People’s Hospital. All research subjects were of Han nationality and resided in the eastern and southeastern provinces of China. This study was conducted in accordance with the principles of the World Medical Association and the Declaration of Helsinki and was approved by the Shanghai Tenth People’s Hospital Ethics Committee (No. SHSY-IEC-KY-4.0/16-18/01). Written informed consent was obtained from the subjects.
Fecal samples were collected the morning after an overnight fast (more than 8 hours). Fecal samples were snap-frozen with liquid nitrogen following collection and stored at -80°C (Haier, DW-86L626, China) (14). Microbial genomic DNA was extracted using the E.Z.N.A. soil DNA Kit (Omega Bio-Tek, Norcross, GA, USA) in accordance with the manufacturer’s protocol. A Nanodrop 2000 (Thermo Scientific, USA) was used to measure the DNA concentration. Extracted DNA was stored at -80°C until experiments were conducted. The primers (338-F: 5’-ACTCCTACGGGAGGCAGCAG-3’) and (806-R: 5’-GGACTACHVGGGTWTCTAAT-3’) targeting the V3-V4 hypervariable region of the 16S rRNA were used to amplify the extracted DNA samples by the polymerase chain reaction system (ABI GeneAmp 9700, USA). The amplicons were subsequently purified by AxyPrep DNA Gel (Axygen, CA, USA) and quantified by QuantiFluor-ST (Promega, USA). Sequencing was performed on an Illumina MiSeq platform (Illumina, San Diego, CA) to combine the purified amplicons at equimolar concentrations and perform end pair sequencing analysis.
Fecal sample (50 mg) was weighted to an EP tube, and 400 µL extract solution (methanol: water = 4: 1) was added. Then they were homogenized by a Wonbio-96c high-throughput tissue crusher (Shanghai Wanbo Biotechnology Co., Ltd.) for 6 min at 50 Hz. Then, they were vortexed for half a minute and ultrasonicated for 30 min at 40 kHz (incubated in ice water). The mixture was incubated for 30 minutes at -20°C to precipitate proteins and then centrifuged at 13,000 g for 15 min at 4°C. The supernatant of the samples was transferred to fresh EP tubes and analyzed by ultra-performance liquid chromatography (UPLC) system coupled to a quadrupole-time-of-flight mass spectrometer (Triple TOFTM5600+, AB Sciex, USA) equipped with a electrospray ionization (ESI) source operating in both positive mode and negative ion mode. Additionally, 10 μL of supernatant from each sample was combined and mixed to serve as the quality control (QC) sample, which was injected randomly (every 8 samples) to screen the consistency of the analysis.
Nontargeted liquid chromatography-mass spectrometry (LC–MS/MS) analyses were performed for peak detection and comparison by importing the raw data into the Progenesis QI 2.3 software program (Nonlinear Dynamics, Waters, USA), and a data matrix composed of retention time (RT), peak intensity and mass-to-charge ratio (m/z) values was obtained. Additionally, qualitative and quantitative information for specific metabolites was acquired. Preprocessing was necessary before the multivariate statistical analysis, and the methods were as follows: (i) data were removed if missing values were more than 50% in the sample; (ii) based on one-half of the minimum metabolite value, the missing values were filled and the total peaks were normalized; and (iii) QC samples were eliminated if the relative standard deviation (RSD) was more than 30%. Finally, logarithmic transformation was performed for preprocessed datasets prior to further analysis. Principal component analysis (PCA) was used to analyze the cation and anion set data for QC analysis. Mass spectra of these metabolic features were identified by using the accurate mass, MS/MS fragments spectra and isotope ratio difference with searching in reliable biochemical databases as Human Metabolome Database (HMDB) and Kyoto Encyclopedia of Genes and Genomes (KEGG). Specifically, the mass tolerance between the measured m/z values and the exact mass of the target components was ± 5 ppm. For MS/MS-confirmed metabolites, only metabolites with MS/MS fragments scores above 30 were considered reliably identified. Otherwise, the metabolites had only tentative assignments.
The analysis of 16S rRNA gene sequencing data was performed in the Majorbio Cloud Platform (https://cloud.majorbio.com/). Paired-end reads were first assembled using FLASH (v1.2.11) (15). Then, the sequences were optimized by filtering and quality control using Fastp (v0.19.6) (16). We then used UPARSE (v 7.0.1090) to cluster sequences by a similarity of 97% into operational taxonomic units (OTUs) (17).
The annotation of each taxonomy was performed by the RDP Classifier (v2.11) and the Silva database (v132). To decrease the effect of spurious sequences, sequences of OTUs <0.005% were removed (18).
The alpha diversity was analyzed to determine the richness of species at the OTU level based on the Ace index. The beta diversity was analyzed using the unweighted UniFrac algorithm to compare the composition of bacterial communities among samples. On the Majorbio Cloud Platform, the analysis of principal coordinates and similarities were performed to determine whether the intergroup differences were significantly greater than the intragroup differences or not. The Partitioning Around Medoids algorithm was used to cluster individuals into two enterotypes. The differences at the phylum or genus levels between the two groups were assessed by the Kruskal–Wallis H test. Linear discriminant analysis effect size (LEfSe) analysis was applied to determine the significantly different genera between the TC and HC groups (19).
Novel microbial and metabolic predictors were explored using logistic regression by forward stepwise (likelihood ratio) methods (SPSS Statistics v22), lasso regression and random forest model analysis (R environment v.4.1.0) (19, 20). The diagnostic ability of the selected substances was characterized by receiver operator characteristic (ROC) curve analysis with comparisons of the areas under the curve (AUCs). Differences between two AUCs were evaluated by the Z test. The final predictive models were validated in an additional cohort, consisting of 20 patients with thyroid cancer and 20 healthy controls via measuring microbiota and metabolites. Canonical correspondence analysis (CCA) was performed to conduct correlation analysis of clinical and metabolic factors among samples. The Spearman correlation between the two groups was determined for each factor.
Differential metabolites between the two groups were screened by orthogonal partial least squares discrimination analysis (OPLS-DA) and Student t-test (data conformed to a normal distribution and satisfied the homogeneity of variance) in the SIMICA software program (v 16.0.2) (21). The analysis of functional pathways was performed in the Majorbio cloud and MetaboAnalyst platform (v5.0) (22). The network between changed genera and lipid metabolism was visualized by Cytoscape (v3.6) software (23). A difference of statistical significance was considered only when the value of p was less than 0.05.
Our research enrolled 50 patients with TC and 58 healthy volunteers. There were no significant differences in age and sex between the two groups. The baseline characteristics of the TC patients and HCs are summarized in Table 1. Then we analyzed fecal samples from TC and HC groups using 16S rRNA gene sequencing and untargeted metabonomic analyses of their gut microbiota and metabolites.

Table 1 Baseline characteristics of TC patients and HCs.
After quality filtering, a total of 5,666,615 sequences from 108 samples were distributed into 1695 OTUs. According to the rank-abundance curves at the OTU level, the Good’s coverage indices of both TC and HC groups were higher than 99.5%, suggesting a satisfactory sequencing depth of the intestinal flora (Figure 1A). The microbial diversity characteristics and their relationship with clinical parameters are shown in Figure 1B. The top four phyla were Firmicutes, Bacteroidetes, Actinobacteria, and Proteobacteria (Figure 1B). At the genus level, Bacteroides was the most abundant genus, with an average relative abundance of 10.5%. Meanwhile, Prevotella_9 and Megamonas showed bias distribution in our samples. We found that the enrichment of Prevotella_9 (sequences in OTUs > 100) was lower in TC patients (n = 10, 20.0%) than in HCs (n = 26, 44.8%; χ² = 7.448, p < 0.05). Conversely, the enrichment of Megamonas was higher in TCs (n = 9, 18.0%) than in HC patients (n = 3, 5.2%; χ² = 4.474, p < 0.05) (Figure 1B). The α-diversity of gut microbes in TC patients was significantly decreased compared with that in HCs (p < 0.0001), which suggests that the richness of the gut microbiota is reduced in TCs (Figure 1C). The β-diversity was shown on the overall microbial composition of the microbiota based on the results of principal coordinate analysis (PCoA), which revealed obvious differences between the TC patients and HCs (R = 0.1270, p = 0.001, Figure 1D).
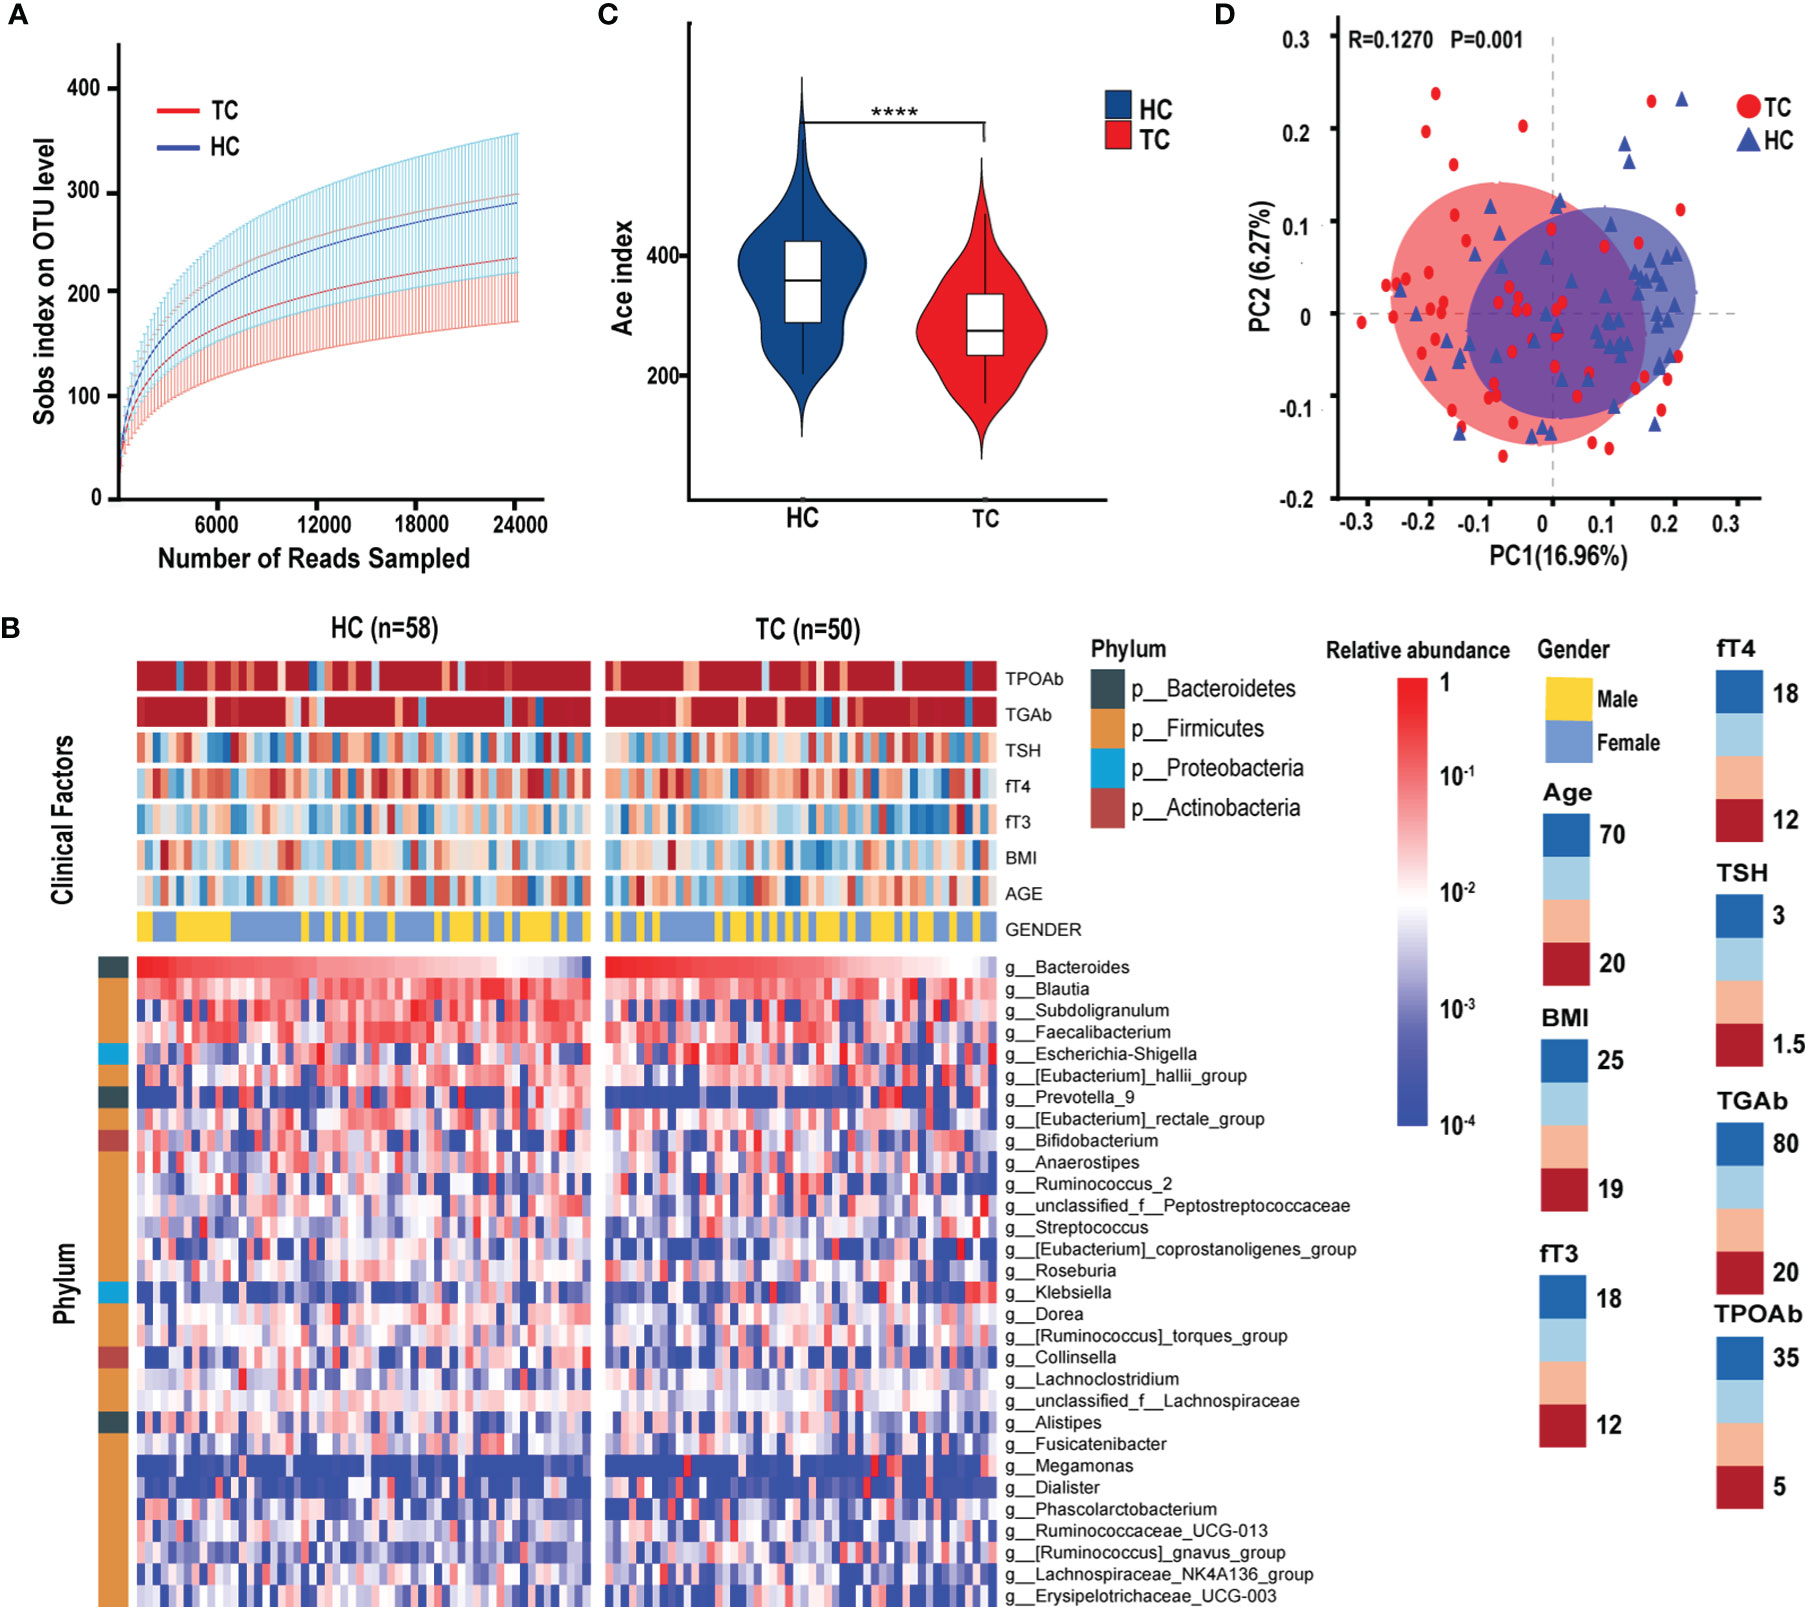
Figure 1 The diversity of gut microbiota in patients with TC (n = 50) and HC (n = 58) group. (A) The rarefaction curves between the number of read samples and the number of OTUs in Sobs index. (B) Annotated heatmap of clinical factors and gut microbial features of the top 30 genera based on Spearman distance and Ward hierarchical clustering. (C) The α-diversity of the bacterial communities based on the Ace index on the OTU level in TC and HC groups. (D) The PCoA based on unweighted UniFrac matrix on OTUs distribution showed that the composition of gut microbiota was significantly different between TC patients and HCs. ****p < 0.0001. TC, thyroid cancer; HC, healthy control; OTUs, operational taxonomic units; PCoA, principal coordinate analysis; BMI, body mass index; fT3, free triiodothyronine; fT4, free thyroxine; TSH, thyroid-stimulating hormone; TGAb, thyroglobulin antibody; TPOAb, thyroid peroxidase antibody.
According to the PCoA analysis in the previous section, although the difference between the samples was greater than that within the group, the R value in the group analysis was very small. By partitioning around medoids algorithm, individuals can be robustly clustered into two enterotypes (type 1, n=64; type 2, n=44) (Supplementary Figure 1A), and their distribution of sample differences is shown in Figure 2A. Type 1 comprised 74% of TC patients, but the ratio of the two types were almost equal in HCs (Figure 2B). Moreover, at the phylum level, significant differences were only observed in the abundance of Proteobacteria (higher in type 1, p < 0.001, Figure 2C). At the genus level, Bacteroides, Ruminococcus_2, Ruminococcaceae_UCG-013 were enriched in type 1, and Prevotella_9 and Ruminococcaceae_UCG-002 had greater enrichment in type 2 (p < 0.05, Figures 2D, E).
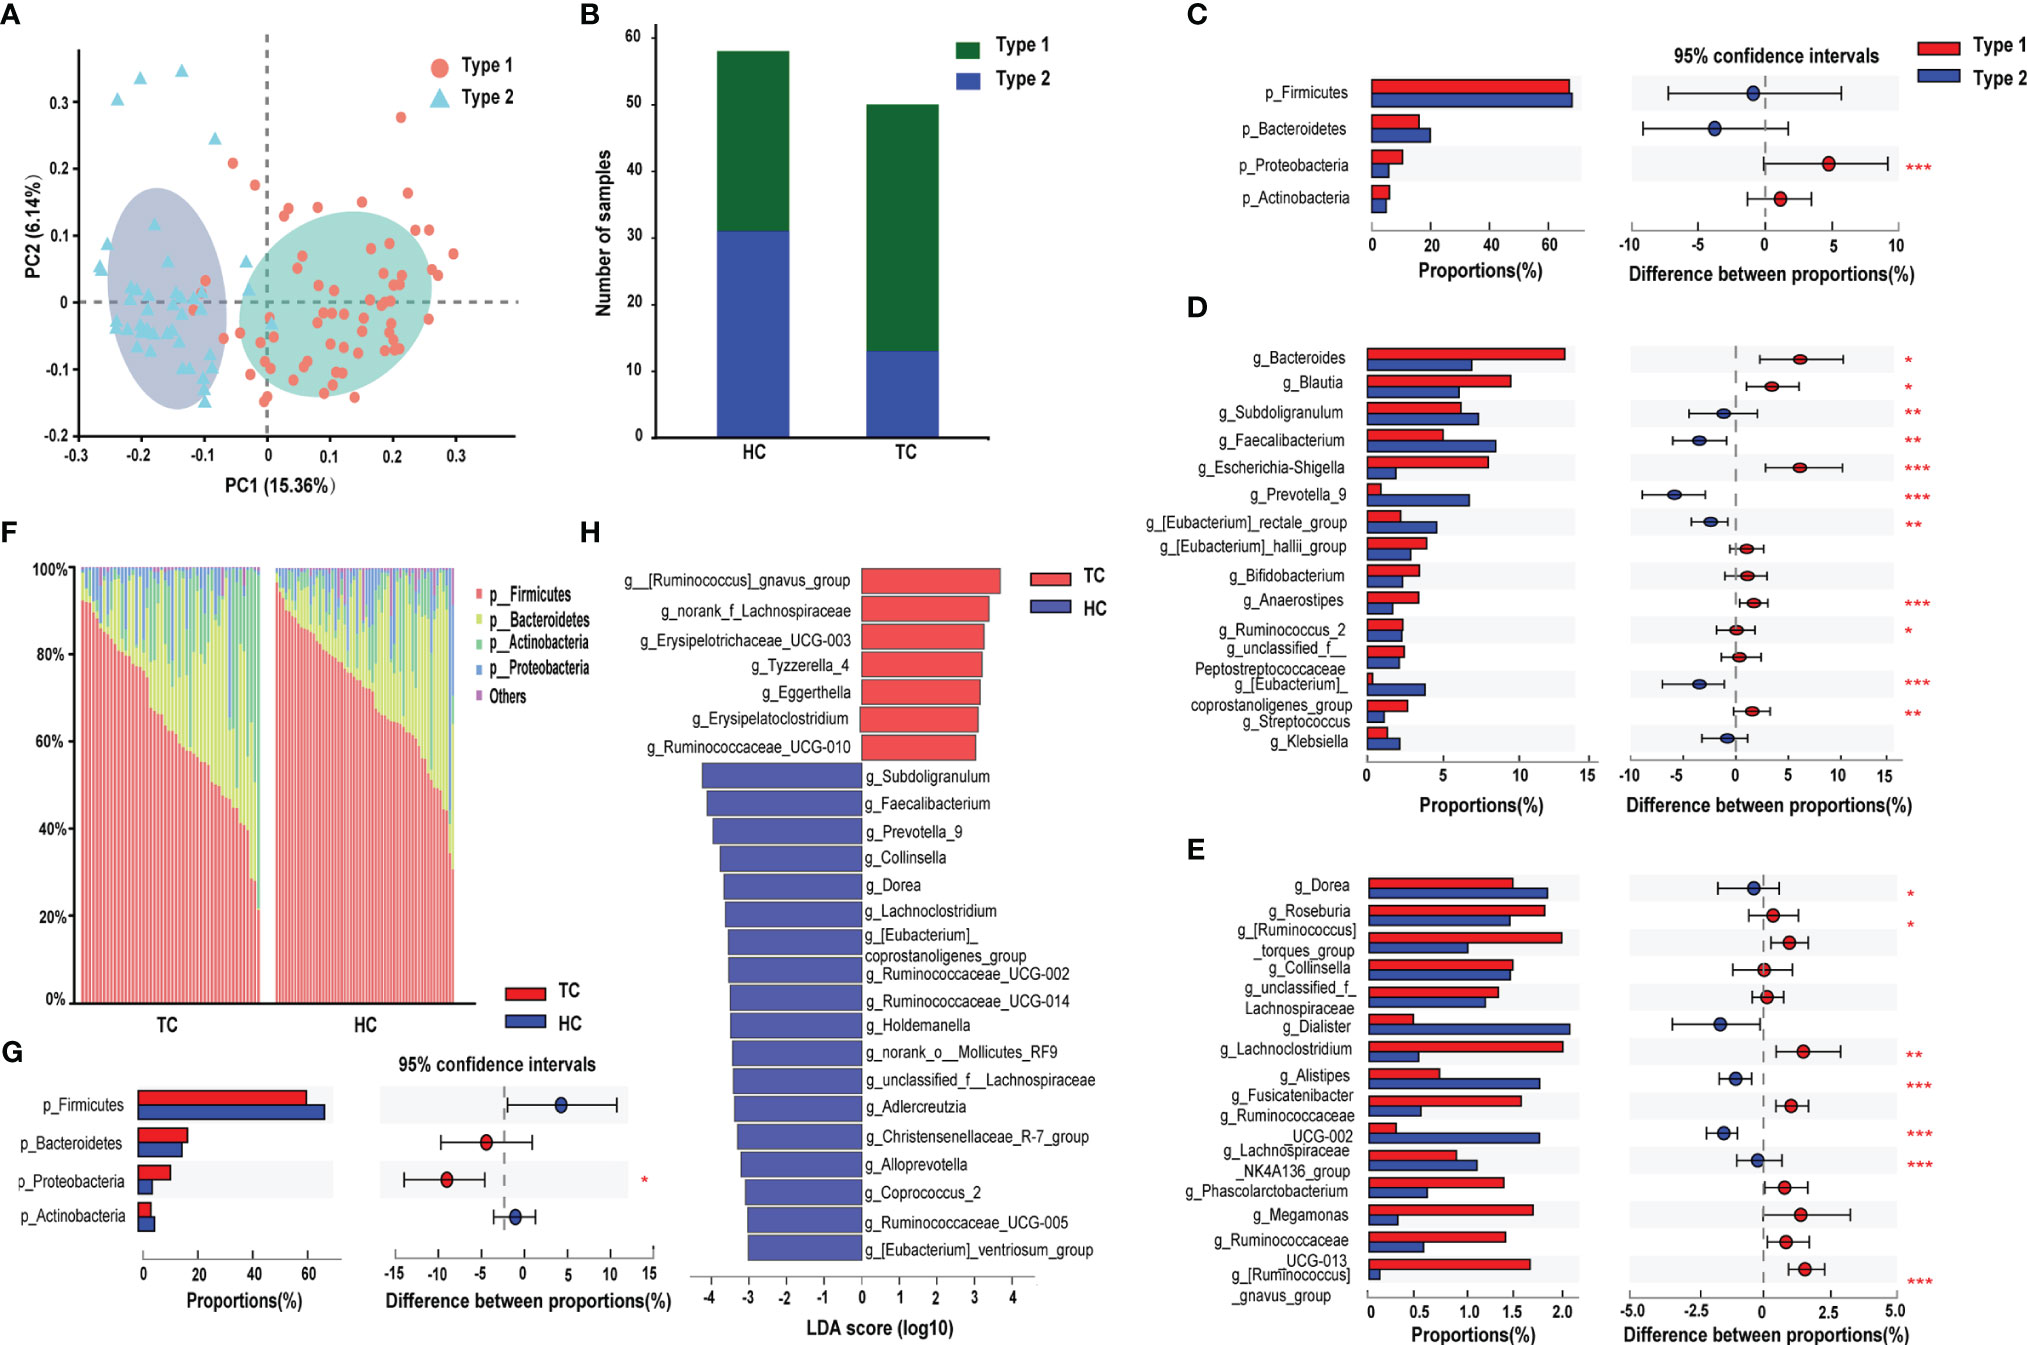
Figure 2 Enterotype analysis and alterations of gut microbiota composition in TC. (A) The PCoA based on unweighted UniFrac matrix on OTUs distribution showed that the composition of gut microbiota was significantly different between type 1 and type 2. (B) The proportion of the two enterotypes in TC and HC groups. The relative proportion and its difference of (C) the top 4 phyla and (D-E) top 30 genera between two enterotypes. (F) Relative proportion of bacteria on phylum level in TC patients and HCs. (G) Difference in the microbial proportion of the top 4 phyla between TC patients and HCs. (H) LEfSe analysis showed that the relative abundance of 25 genera was significantly different between TC patients and HCs (LDA score >3.0 or <-3.0, p < 0.05). *, p < 0.05; **p < 0.01; ***p < 0.001. TC, thyroid cancer; HC, healthy control; PCoA, principal coordinate analysis; OTU, operational taxonomic units; LDA, linear discriminant analysis; LEfSe, LDA effect size.
Next, we performed preliminary discriminant analysis on bacterial community structure at different taxonomic levels to identify the differentially abundant taxa in the TC group. At the phylum level, the abundance of Proteobacteria was higher in the TC group than in HCs (p < 0.05, Figures 2F, G). Then, we calculated the ratio of Firmicutes/Bacteroidetes, and there were no differences in the ratio between the two groups (Supplementary Figure 1B). Meanwhile, we did not find significant correlations between the ratio and age or BMI in either group (Supplementary Figures 1C, D). At the genus level, LEfSe analysis demonstrated that a total of 25 changed genera could be regarded as biomarkers to distinguish TC patients from HCs (seven dominant genera in TC; 18 in HC, Figure 2H). In addition, the LEfSe results demonstrated that the g_Christensenellaceae_R-7_group (LDA score = 3.3, p < 0.001) and g_[Eubacterium]_coprostanoligenes_group (LDA score = 3.5, p < 0.001) levels were significantly decreased in the TC group (Figure 2H).
According to the 25 altered genera identified by LEfSe analysis, we subsequently explored novel microbial predictors for noninvasive screening and diagnosis of TC. Lasso regression validated that 23 genera could be used as combined markers. Three genera were indicated in forward stepwise logistic regression, and seven genera were indicated in the random forest model (Supplementary Table 1, Supplementary Figures 2A–C). As we preferred to include relatively few floras to set up the prediction model, we did not include the results of the lasso regression in the following research. Then, we compared the composition of genera between the other two analyses (Figure 3A). Based on the ROC curve, the AUCs (95% CI) of the two models were 0.828 (0.75-0.91, random forest), 0.813 (0.73-0.90, logistic regression)(Figure 3B). However, there were no significant differences among the pairwise comparisons of the AUCs of each model (Z test, p > 0.05; Supplementary Table 2).
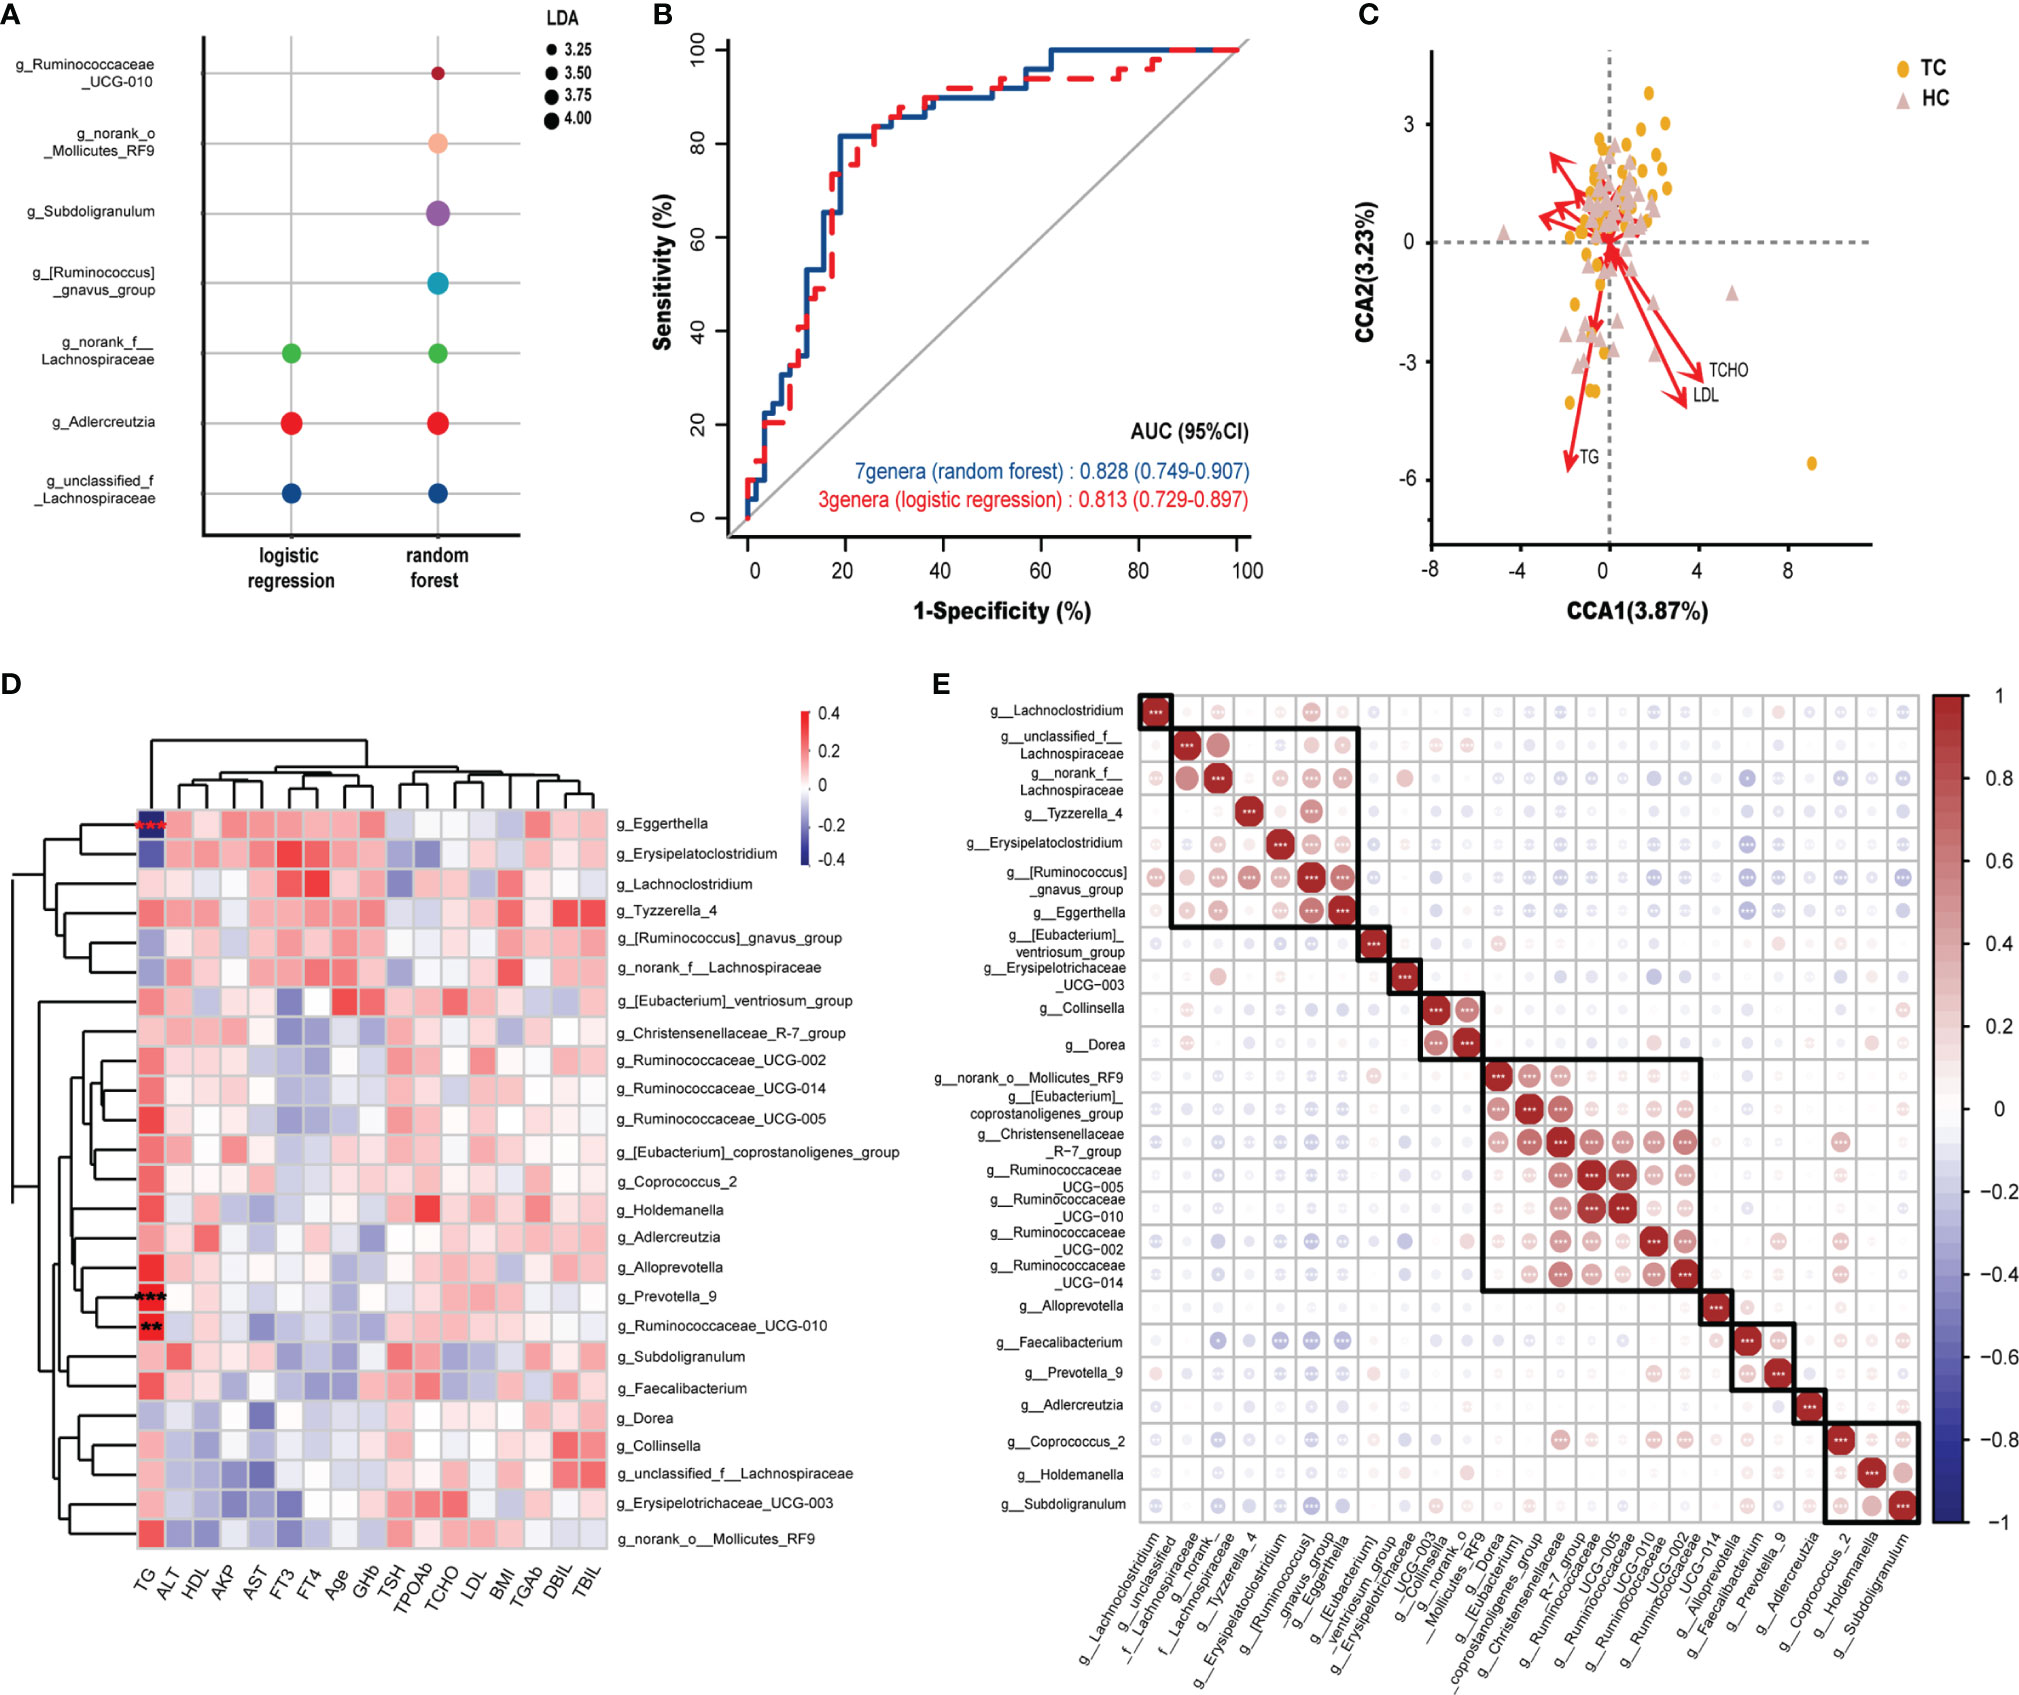
Figure 3 Potential diagnostic markers of gut microbiota in TC patients and Spearman correlation in environmental factors and microbiota. (A) The composition of genera according to the forward stepwise logistic regression and random forest model. (B) ROC curve analysis revealed the effect of the above two models by the AUCs. (C) CCA results of gut microbiota and clinical factors of patients with TC and HC group. (D) Spearman correlation between environmental factors and 25 genera based on LEfSe analysis results. (E) Spearman correlation and ward hierarchical clustering (n = 10) of 25 genera based on LEfSe analysis results. *, p < 0.05; **p < 0.01; ***p < 0.001. TC, thyroid cancer; HC, healthy control; ROC, receiver operator characteristic; AUC, areas under the curve; CCA, Canonical correspondence analysis; LDA, linear discriminant analysis; LEfSe, LDA effect size; BMI, body mass index; fT3, free triiodothyronine; fT4, free thyroxine; TSH, thyroid-stimulating hormone; TGAb, thyroglobulin antibody; TPOAb, thyroid peroxidase antibody; AKP, alkaline phosphatase; DBil, direct bilirubin; TBil, total bilirubin; ALT, alanine aminotransferase; AST, aspartate aminotransferase; GHb, glycated hemoglobin; TCHO, total cholesterol; TG, triglycerides; HDL, high density lipoprotein; LDL, low density lipoprotein.
To determine the influence of clinical factors on our sample distribution, CCA was performed. After filtering with variance inflation factor analysis, the CCA results shown in Figure 3C demonstrated that TGs, TCHO and LDL had the strongest contribution to the sample distribution (r2 > 0.176, p < 0.01, Supplementary Table 3). Furthermore, Spearman correlation analysis was performed between 25 differential genera (by LEfSe analysis) and 17 clinical characteristics. It was obvious that the relationships between serum TG levels and differential genera were completely different from other clinical indicators at the genus level (Figure 3D). TG was significantly positively correlated with Prevotella_9 (r = 0.33, p < 0.001) and Ruminococcaceae_UCG-010 (r = 0.31, p < 0.01) and significantly negatively correlated with Eggerthella Igolzaea (r = -0.40, p < 0.001).
All intestinal bacteria constitute a complex ecosystem, where microorganisms are influenced not only by the physiological activities of the host but also by other genera in the microecological environment. Therefore, Spearman correlation was analyzed on the 25 genera that were altered between TCs and HCs. We found 10 clusters of flora with similar expression patterns in our samples by clustering. Interestingly, Christensenellaceae_R-7_group, which was found in one of the clusters, had a strong correlation with [Eubacterium]_coprostanoligenes_group (r > 0.60, p < 0.001) and five other genera within the same cluster (Figure 3E), which indicated a strong coexistence among them.
To evaluate whether the profiles of metabolites were related to TC, we performed metabolic profiling in all fecal samples. In our study, 4385 cationic ions (363 metabolites identified) and 4453 anionic ions (161 metabolites identified) were obtained (Supplementary Material). As shown in Figures 4A, B, the differences in classification between TC patients and HCs were not obvious; there were few differences in composition between the two groups. Since evidence from this study indicated that the intestinal flora might affect the metabolism of fatty acids, we subsequently focused on fatty acid metabolites.
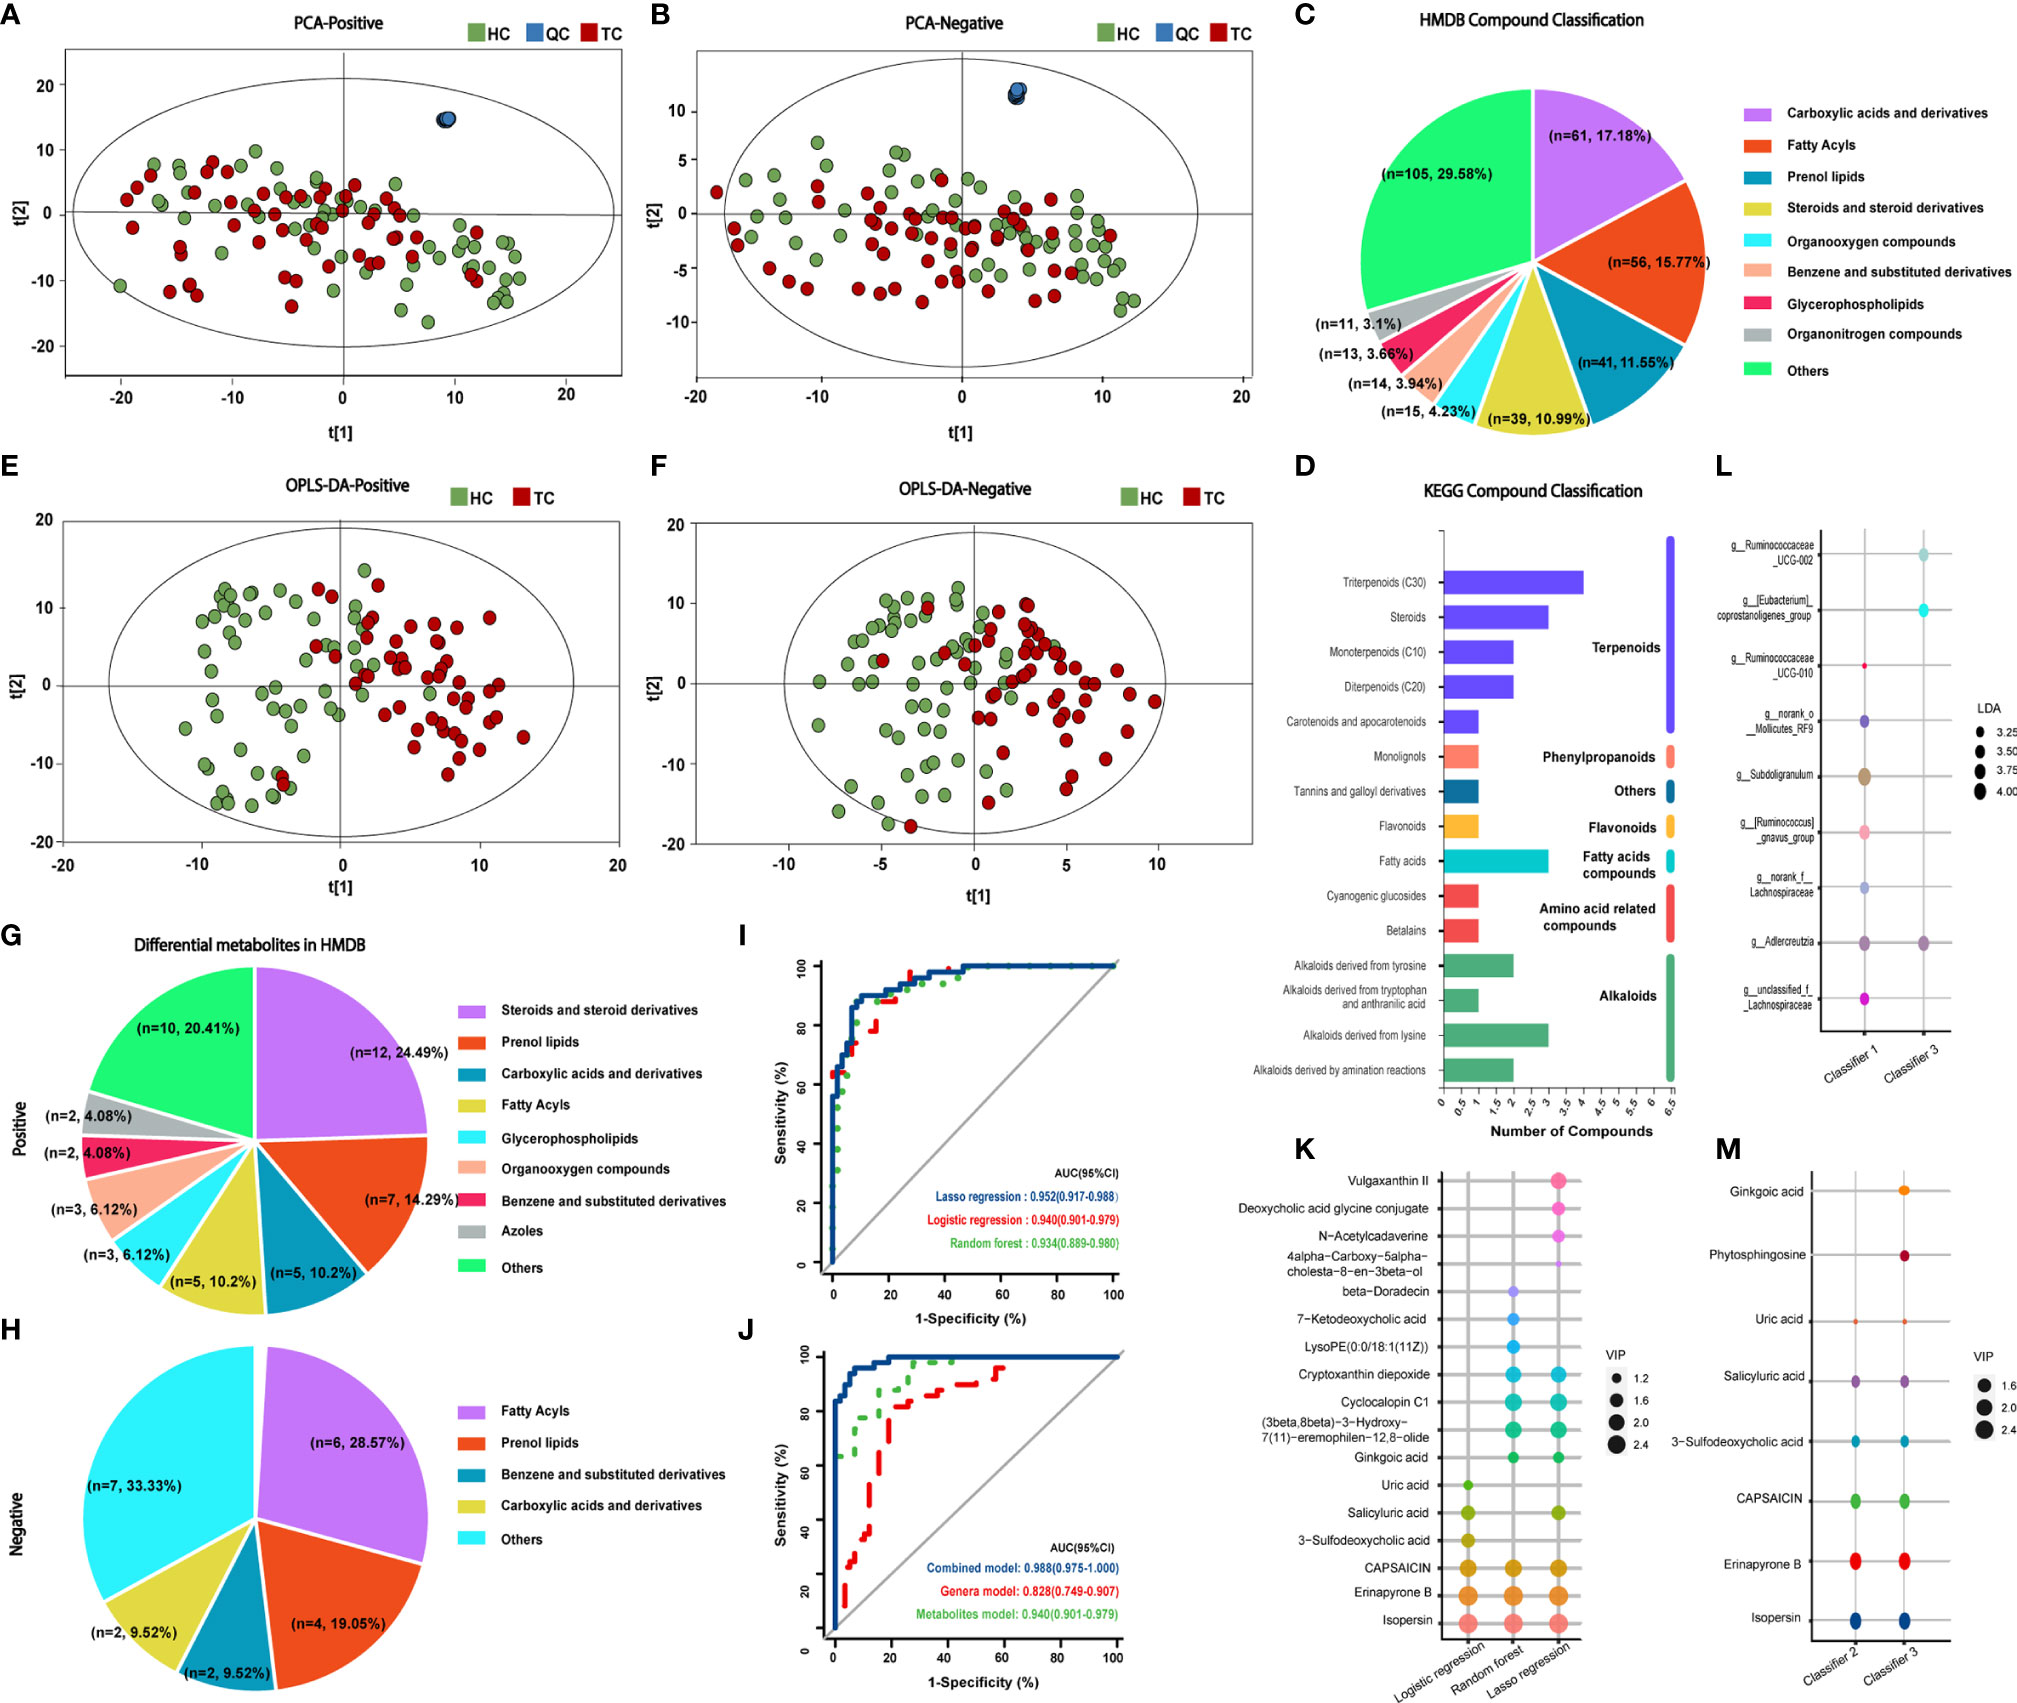
Figure 4 Classification of metabolites in TC patients and HCs and prognostic models of metabolites. PCA results of (A) positive and (B) negative compounds in TC and HC groups. Annotation and proportion of metabolites based on the (C) HMDB and (D) KEGG databases. OPLS-DA results of (E) positive and (F) negative compounds in TC and HC groups. Annotation and proportion of differential metabolites from OPLS-DA results in (G) HMDB and (H) KEGG databases. (I) ROC curve analysis revealed the effect of the three models correlated with metabolites by the AUCs. (J) ROC curve analysis revealed the effect of the genus model of random forest (classifier I, 7 genera), the metabolite model of logistic regression (classifier II, 6 metabolites) and combined model (classifier III, 3 genera and 8 metabolites) of logistic regression by the AUCs. (K) The composition of metabolites according to the forward stepwise logistic regression, lasso regression and random forest model. (L, M) The composition of genera and metabolites among classifier I, II and III. TC, thyroid cancer; HC, healthy control; QC, quality control; PCA, Principal Component analysis; HMDB, Human Metabolome Database; KEGG, Kyoto Encyclopedia of Genes and Genomes; OPLS-DA, orthogonal partial least squares discrimination analysis; ROC, receiver operator characteristic; AUC, areas under the curve; LDA, linear discriminant analysis; VIP, variable importance in projection.
HMDB annotation results identified 56 fatty acyl groups, 39 sterols and their derivatives (Figure 4C); KEGG annotation results identified three fatty acid compounds (Figure 4D). OPLS-DA analysis (Figures 4E, F, Supplementary Figures 3A, B) identified a total of 49 differential positive compounds involved in human metabolism between the TC and HC groups, and 21 negative compounds were identified (variable importance in projection (VIP) > 1.0, p < 0.05, Tables 2, 3). The dominant differential metabolites of positive and negative cations that were indicated by the HMDB database are shown in Figures 4G, H.
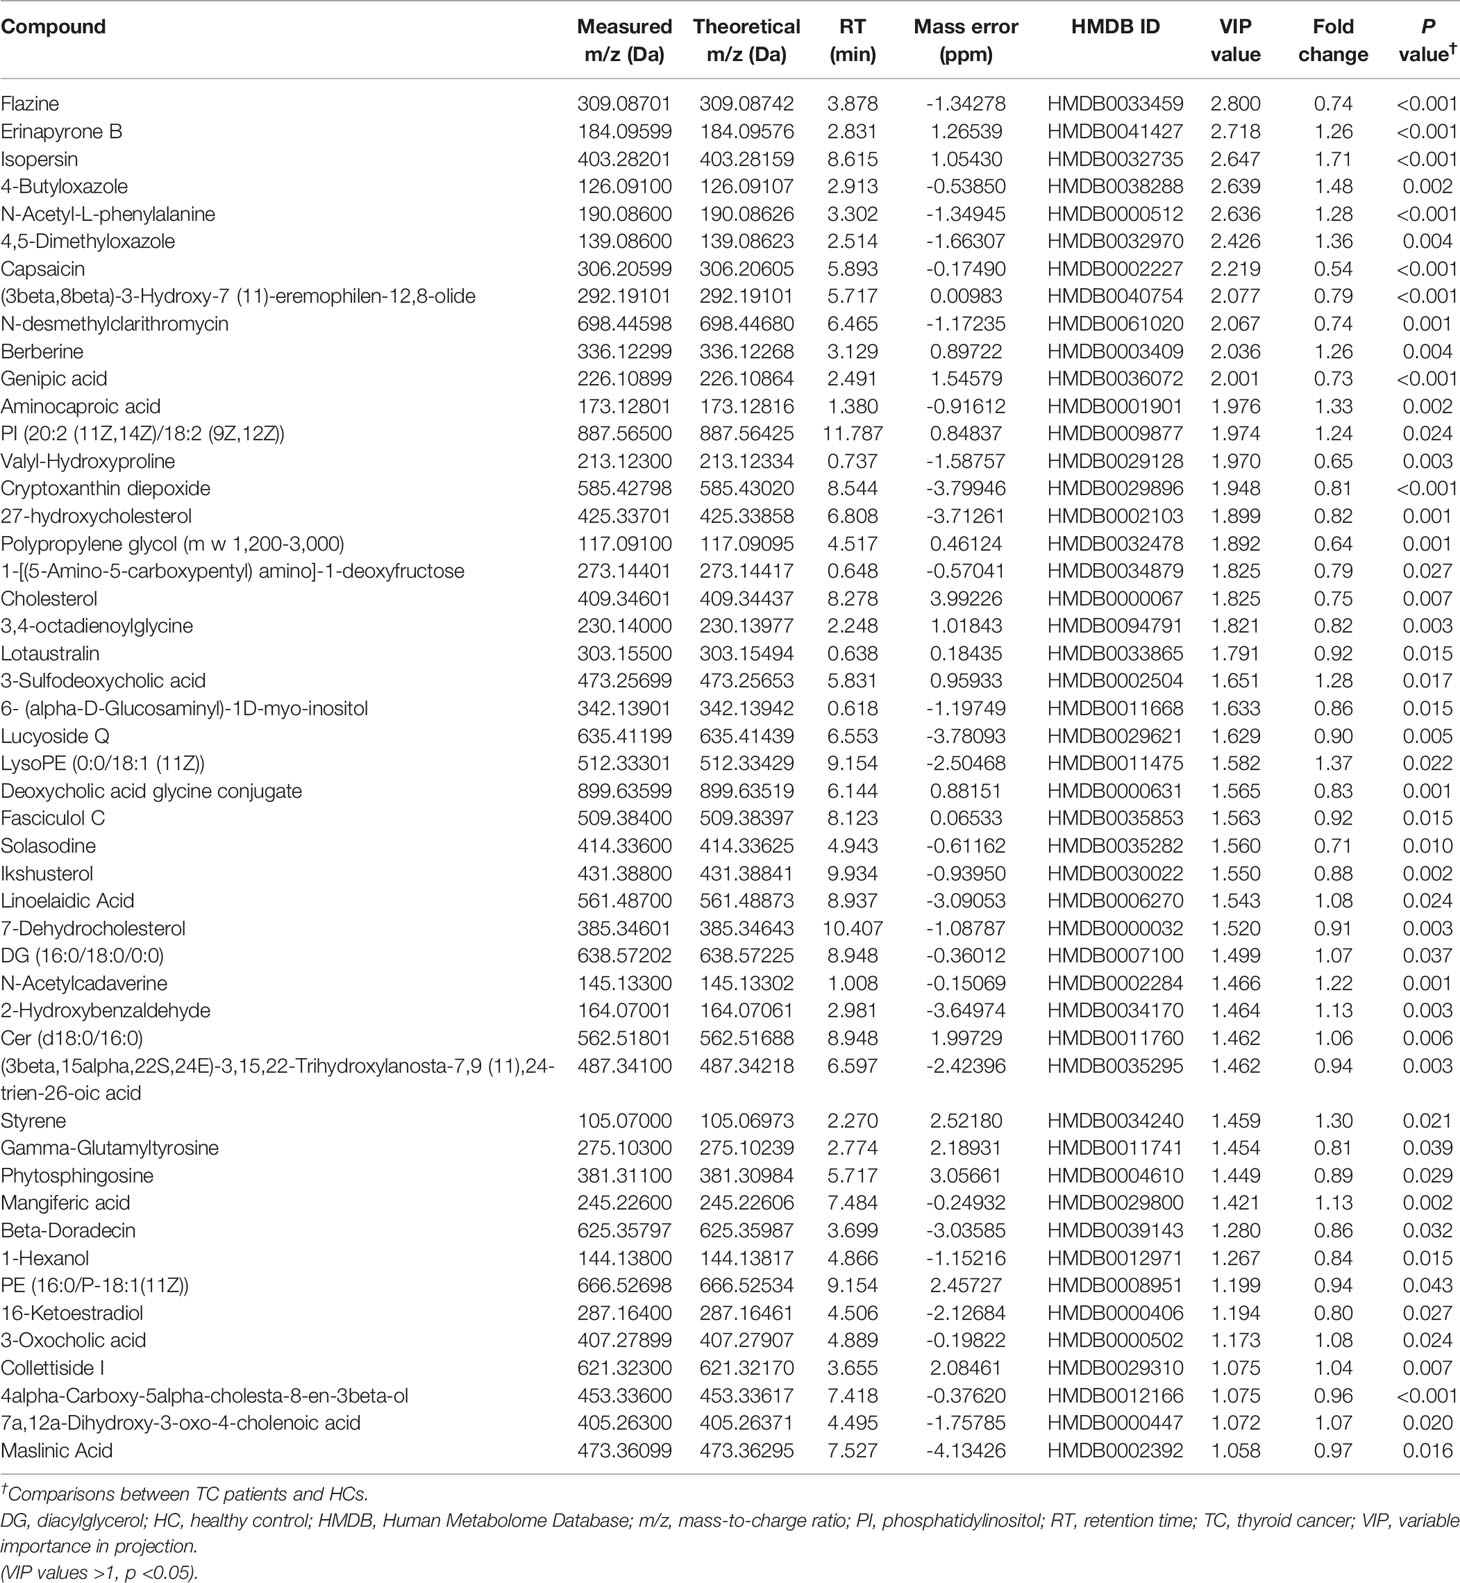
Table 2 Detailed information on differential cation metabolites.
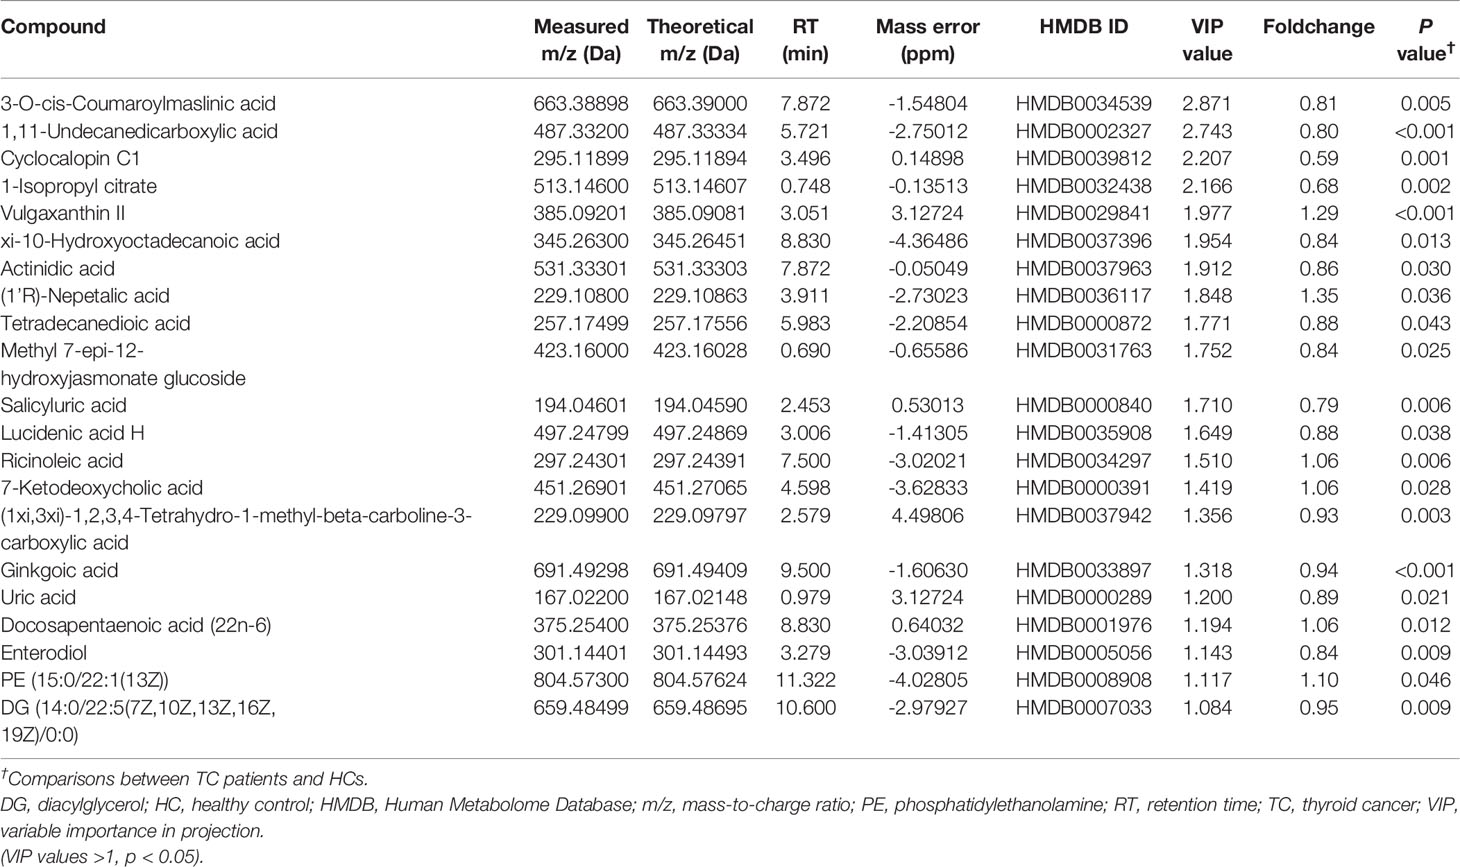
Table 3 Detailed information on differential anion metabolites.
On the basis of the 70 differential metabolites between the two groups that were identified in the previous section, three methods were employed to construct metabolite models for TC prediction (Supplementary Table 4 and Supplementary Figures 3C–E). The metabolites included in the three models and the diagnostic effectiveness of the three models are shown in Figures 4K, I. These results indicate that the stepwise logistic regression classifier shows great predictive ability with relatively few metabolites (classifier II).
Next, we entered all 25 genera and 70 metabolites with apparent distinction between the TC and HC groups into forward stepwise logistic regression (classifier III, combination of genus and metabolites, Supplementary Table 5). The distinguishing ability of the models among genera (classifier I, the composition of seven differential genera generated by random forest model analysis), metabolites (classifier II) and their combination (classifier III, Figures 4L, M) was compared. Adlercreutzia was the only same genus between classifiers I and III, and the common metabolites between classifiers II and III were isopersin, erinapyrone B, 3-sulfodeoxycholic acid, capsaicin, salicyluric acid and uric acid. Moreover, as shown in Figure 4J and Supplementary Table 6, the metabolite model (AUC = 0.940, 95% CI: 0.90-0.98) was significantly better than the microbial model (AUC = 0.828, 95% CI: 0.75-0.91, Z = 2.504, p = 0.012). Additionally, the combined model (AUC = 0.967, 95% CI: 0.93-1.00) was markedly better than the microbial model (Z = 3.198, p = 0.001). However, there was no greater distinction between the combined model and the metabolite model (Z = 1.029, p = 0.304). Subsequently, the above results were validated by an additional validation cohort (TC vs HC, n = 20 and n = 20, Supplementary Figure 4), indicating the accuracy of our predictive models.
Next, we aimed to explore the functional influence of these metabolites and characterize which metabolic pathways they might be related to. There were seven enriched metabolic pathways in the MetaboAnalyst platform with no statistical significance (p > 0.05 of all, Supplementary Table 7 and Figure 5A), and 66 networks in the Major Cloud platform were determined to be significantly different by the KEGG pathway enrichment analysis (p < 0.05, Supplementary Table 8 and Figure 5B). The pathways related to steroid synthesis enriched by the metabolite cholesterol were highly significant in both platforms. For example, cholesterol and 7-dehydrocholesterol were enriched in the steroid biosynthesis [M00101] pathway in the MetaboAnalyst platform (p = 0.184, corrected p > 0.05), and cholesterol and DG (16:0/18:0/0:0) showed strong enrichment in the pathway of fat digestion and absorption by the Major Cloud platform (corrected p = 0.028). Notably, the abundance of metabolic compounds (cholesterol, 7-dehydrocholesterol, DG (16:0/18:0/0:0) enriched in the above pathways was decreased in the TC group. These results suggest that functional pathways, such as steroid biosynthesis and lipid digestion, might be inhibited, which would further lead to the dysfunction in the TC group.
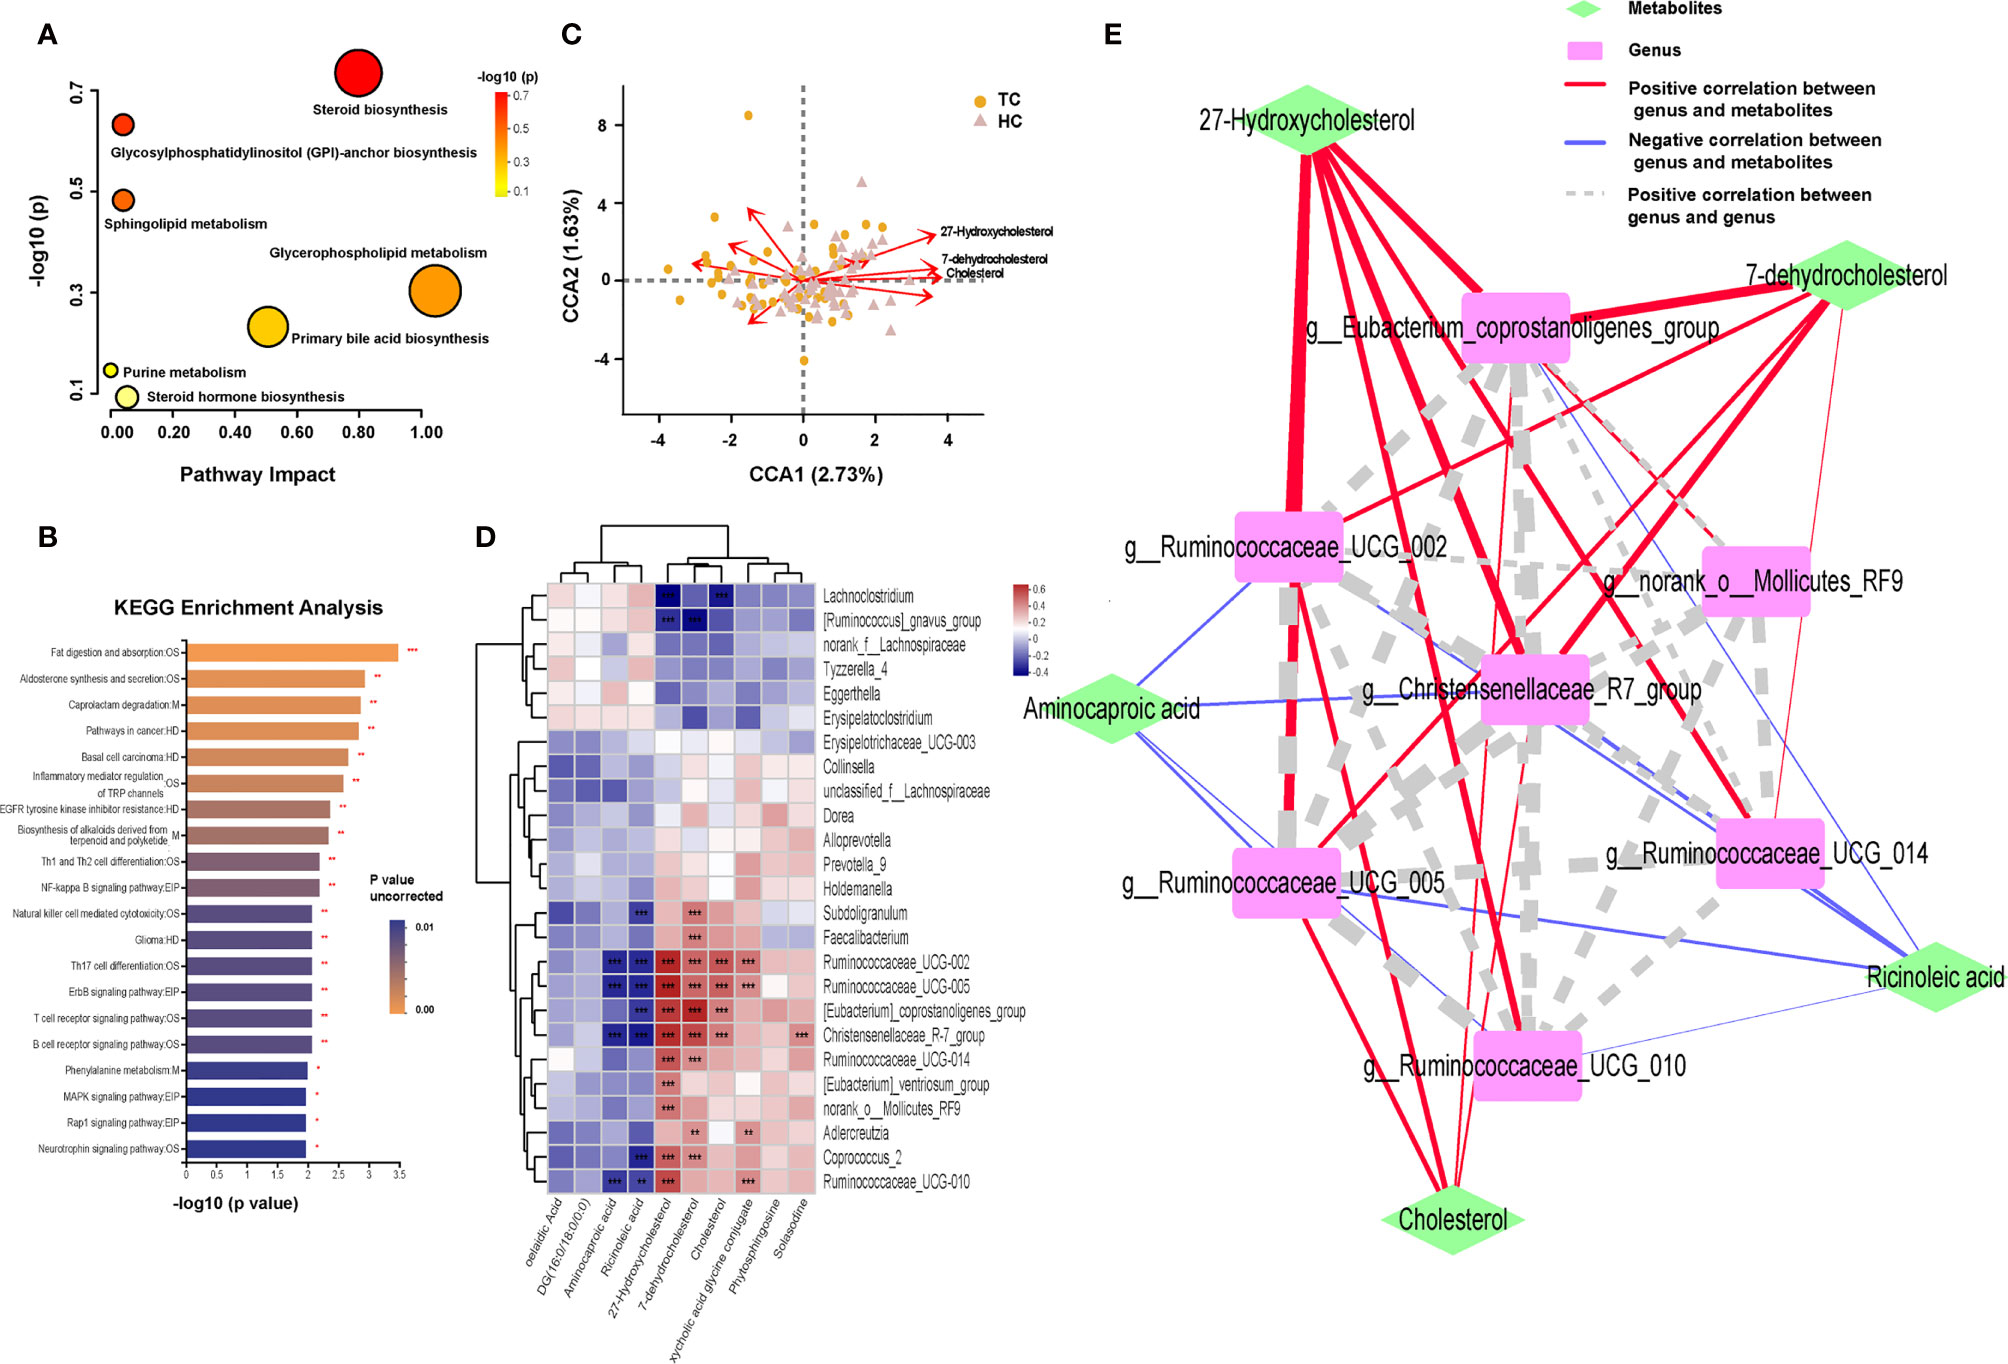
Figure 5 Enrichment of function pathway and correlation between metabolites and microbiota in TC patients and HCs. Metabolic pathways in (A) MetaboAnalyst platform (p > 0.05 of all) and (B) Major Cloud platform. (C) CCA results of gut microbiota and 10 differential lipid metabolites of patients with TC and HC group. (D) Spearman correlation between 10 differential lipid metabolites and 25 differential genera based on the LEfSe analysis results. (E) Network Diagram based on the Spearman correlation showed the relationship between 5 core differential lipid and 7 core differential genera. *, p < 0.05; **p < 0.01; ***p < 0.001. TC, thyroid cancer; HC, healthy control; CCA, canonical correspondence analysis; LEfSe, linear discriminant analysis effect size; DG, diacylglycerol; OS, organismal systems; M, metabolism; HD, human disease; EIP, environmental information processing.
Based on the above results, we subsequently analyzed the potential association between genera and metabolic compounds, especially lipid metabolites. There were a total of 10 lipid compounds among 70 differential metabolites that were identified using the KEGG pathway analysis of the Major Cloud platform (Supplementary Figures 5A–J). Aminocaproic acid, ricinoleic acid, linoelaidic acid, and DG (16:0/18:0/0:0) were more abundant in TC patients; however, 27-hydroxycholesterol (27HC), cholesterol, 7-dehydrocholesterol, deoxycholic acid glycine, conjugate, phytosphingosine, and solasodine were more abundant in HCs. After the filtering with variance inflation factor analysis, the CCA results (Figure 5C) demonstrated that more than 10 lipid compounds significantly impacted the distribution of flora in the samples, and 27HC had the most robust influence (r2 = 0.3838, p = 0.001), followed by cholesterol (r2 = 0.2637, p = 0.001) and 7-dehydrocholesterol (r2 = 0.2497, p = 0.001, Supplementary Table 9). Significant relationships between the TC and HC groups were uncovered by Spearman correlation analysis of 28 differential bacteria and 10 differential lipid compounds (Figure 5D). 27HC positively correlated with g_Christensenellaceae_R-7_group (r = 0.529, p < 0.001), g_Eubacterium_coprostanoligenes_group (r = 0.504, p < 0.001), g_Ruminococcaceae_UCG-002 (r = 0.544, p < 0.001), and g_Ruminococcaceae_UCG-005 (r = 0.557, p < 0.001). Then, based on the above correlations, the intestinal fecal genera and lipid compounds were further analyzed by the Spearman correlation network (Figure 5E). The core metabolites in both groups were 27HC and cholesterol, and the key bacteria were g_Christensenellaceae_R-7_group, g_Eubacterium_coprostanoligenes_group, g_Rumenococcus UCG-002, g_Rumenococcus UCG-005, and g_Rumenococcus UCG-014.
Disruptions of the normal intestinal microbiota have been validated in the pathogenesis of various chronic diseases, particularly obesity (24, 25). In our study, using multiomics analysis, the abundance and composition of the gut microbiota and metabolites in the TC group were noticeably altered compared with those in the controls, as demonstrated by dissimilarities in the enterotypes, predictive models and functional pathways. To further understand the network of microbial metabolites, two core genera, g_Christensenellaceae_R-7_group and g_Eubacterium_coprostanoligenes_group, were investigated. These genera were significantly correlated with disorders of lipid metabolism (27HC, cholesterol, 7-dehydrocholesterol) in TC patients.
In the diversity analysis, we found that the richness of the gut microbiota in TC patients was significantly lower than that in HCs. This outcome is consistent with a previous study in our center but is in contrast with other studies (8–10). Our subjects (50 TC, 58 HC) were from eastern and southeastern China, where the typical diet is more complex and includes vegetables, rice, beans, seafood and meat (26, 27). A study in 2015 showed that there are substantial differences in the intestinal flora among different regions and ethnic groups in China (28).
The results of the enterotype analysis indicated that g_Bacteroides was more abundant in type 1 in the TC group, and g_Prevotella_9 was evenly distributed in both type 1 and type 2 in the HC group. Based on enterotypes mentioned in 2011, the abundance of g_Bacteroides is associated with a carnivorous diet, and the abundance of g_Prevotella_9 is associated with a vegetarian diet. These findings are consistent with previous studies that reported that a high-fat diet was a risk factor for thyroid cancer (4, 29–31). Unfortunately, our study did not include the dietary conditions of the study subjects, and this speculation should be verified by further research. In addition, in the overview of the microbial taxonomy data, g_Prevotella_9 was uniquely distributed in the population. Its enrichment rate was high in the HC group and relatively low in the TC group, which can be explained, in part, by the differences among people with different enterotypes.
Compared with the microbial prediction model, the metabolism model demonstrated higher test efficiency, which was consistent with the fact that the intestinal metabolites were more closely related to thyroid cancer in this microenvironment (32). However, since research on the influence of gut microbiota and metabolism in thyroid cancer is rare, further studies are required to establish a complete microenvironment diagnosis model (11).
In our metabolic pathway analysis, lipid metabolism-related pathways, which were significantly enriched in differential compounds, were indicated to be dysregulated in the TC group. Cholesterol and 27HC were significantly reduced in the TC group, while ricinoleic acid and linoelaidic acid were significantly increased in the TC group. Cholesterol is an essential part of eukaryotic cell membranes and a precursor of bile acids and steroid hormones (33). Disorders of cholesterol metabolism involve many diseases, such as arteriosclerosis, cardiovascular diseases and cancers (33). Previous studies have shown that gut microbes are closely related to cholesterol metabolism (34). Linoelaidic acid is an omega-6 unsaturated fatty acid that is rich in vegetable oil. Some studies have indicated that the diet and consumption habits in China are gradually shifting to a Western model, which leads to an increase in the proportion of omega-6 and omega-3 unsaturated fatty acids and results in obesity and inflammation (35). However, it has also been suggested that the intestinal flora can metabolize linoelaidic acid into conjugated linoelaidic acid, which has anticancer and hypolipidemic effects (36). Therefore, in situations when cholesterol and linoelaidic acid are not consumed by intestinal microbes, such as the reduced microbial diversity of the TC group observed in our study, then excessive intake of linoelaidic acid might result in disadvantages that outweigh the advantages.
The following may explain the decrease in cholesterol levels in fecal samples of the TC group. From the LEfSe analysis, we observed that g_Christensenellaceae_R-7_group and g_Eubacterium_coprostanoligenes_group, highly related to cholesterol metabolism, were significantly reduced in the TC group. Goodrich et al. found that f_Christensenellaceae was enriched in individuals with a normal BMI (18.5-24.9) compared to obese individuals (BMI ≥ 30) (37). Furthermore, consistent with its connection with leanness, Alemán et al. showed that f_Christensenellaceae was increased after diet-induced weight loss (38). It is well known that metabolic disorders are often correlated with dietary patterns (39). Additionally, f_Christensenellaceae has been indicated to be responsive to diet; studies have associated f_Christensenellaceae with the healthy dietary habits of decreased refined sugar and improved consumption of fruits and vegetables (40–42). Interestingly, our results also showed that there was a significant coexistence relationship between the g_Christensenellaceae_R-7_group and the g_Eubacterium_coprostanoligenes_group. This relationship could inhibit the reabsorption of cholesterol in the intestines by converting cholesterol to fecal sterols, so the decreased abundance may increase the intestinal reabsorption of cholesterol (34). Recent studies have reported that g_Eubacterium_coprostanoligenes_group can mediate the effect of a high-fat diet on host blood lipids by regulating sphingosine (43). A decrease in intestinal bacteria may affect the excretion of intestinal cholesterol in the feces and result in a decrease in the level of cholesterol measured in the feces. In fact, animal experiments that use antibiotics to destroy the intestinal flora of mice have shown that the reabsorption of cholesterol was increased in these mice (34). Therefore, the decrease in cholesterol levels in the stool of patients with thyroid cancer may be related to an increase in cholesterol reabsorption caused by the decrease in overall gut microbial diversity.
We hypothesize that long-term unhealthy diets disrupt the balance of lipid metabolism in the gut microbes in TC patients and further increase the risk factors and development of thyroid tumors. Consequently, we constructed a network relationship between floras and lipid metabolites, where 27HC demonstrated the strongest relationship with the gut microbiota in the intestinal microecology of TC patients and HCs. 27HC is an endogenous oxidized cholesterol synthesized by the liver and discovered as a selective modulator of the estrogen receptors (ERs) (44). The ERs are a key regulator of myriad physiological functions, playing a recognized or suggestive role in cancer progression in various cancer types, such as the breast, colorectal cancer and thyorid cancer (45). A previous study showed that cholesterol and 27HC could increase the aggressiveness of thyroid cancer (46). Besides, thyroid tumor samples from progressive disease were identified to have lower Oxysterol 7α-hydroxylase expression (27HC degrading enzyme) and higher concentration of 27HC (46). Many studies have also verified the association between increased 27HC and high risks of breast cancer and colorectal cancer (47). Notably, the abundance of g_Christensenellaceae_R-7_group in colorectal cancer is also significantly decreased, and we suspect that its deficiency promotes tumor formation (48). Thus, 27HC probably promotes the proliferation of thyroid cancer driven by the estrogen receptor and more research is needed to clarify the relationship between the g_Christensenellaceae_R-7_group, 27HC and thyroid tumorigenesis.
However, there are still several limitations in this study that need to be improved in the future. First, our research is a single-center, cross-sectional study, which cannot provide relevant findings on the changes in the microbiota within an individual during the development of thyroid cancer. Multicenter and prospective studies should be performed to unearth the characteristics of the intestinal microecology related to alterations in the development of the disease. Second, the accuracy and relevance of 16S rRNA gene sequencing and untargeted metabonomic analyses are restricted, and whole genome shotgun sequencing and targeted metabonomic analyses are needed to reveal the precise correlation network between floras and metabolites in thyroid cancer. Finally, our results are based on bioinformatics analyses and lack evidence to support the secondary verification results. We believe that they can be clarified by fecal microbiota transplant experiments in a thyroid cancer mouse model, and the potential coexistence of microbes can be verified by experiments in large samples worldwide.
In conclusion, thyroid cancer remarkably influences the fecal microbiota and its metabolites. The g_Christensenellaceae_R-7_group and g_Eubacterium_coprostanoligenes_group were indicated as the two core genera in the microenvironment of individuals with thyroid cancer. The g_Christensenellaceae_R-7_group was a hub genus in the decreased genera cluster of thyroid cancer and plays an important role in maintaining the homeostasis of lipid metabolism through 27HC. In the future, further confirmation of the importance of the above core genera and metabolites in the progression of thyroid cancer is required.
The original contributions presented in the study are publicly available. This data can be found here: NCBI, PRJNA796956.
The studies involving human participants were reviewed and approved by Shanghai Tenth People’s Hospital Ethics Committee (No. SHSY-IEC-KY-4.0/16-18/01). The patients/participants provided their written informed consent to participate in this study.
All authors participated in the design of the study and/or patient enrolment, and meet criteria for authorship. DL and ZL contributed to the study design, study conduct and supervision, scientific overview, data analysis, and editing of the manuscript. SF, QL and LC were directly involved in the clinic diagnosis of patients. TQ, RW, and CD collected and analyzed clinical data of subjects. GL, XY, and WJ analyzed the microbial and LM-MS data and drafted the original manuscript. The manuscript was substantively revised by DL, ZL, and XY. GL, XY and WJ contributed equally to this work and shared the co-first authorship All authors have reviewed the manuscript and approved the final version for submission
This work was supported by the [National Natural Science Foundation of China] under Grant [number 82071964], [Shanghai Shenkang Three-year Action Project] under Grant [number SHDC2020CR2054B], [Shanghai Leading Talent Program sponsored by Shanghai Human Resources and Social Security Bureau] under Grant [number 03.05.19005], [Key discipline construction project of the three-year action plan of Shanghai public health system] under Grant [number GWV-10.1-XK9], and [Shanghai Natural Science Foundation] under Grant [number 21ZR1449600].
The authors declare that the research was conducted in the absence of any commercial or financial relationships that could be construed as a potential conflict of interest.
All claims expressed in this article are solely those of the authors and do not necessarily represent those of their affiliated organizations, or those of the publisher, the editors and the reviewers. Any product that may be evaluated in this article, or claim that may be made by its manufacturer, is not guaranteed or endorsed by the publisher.
The Supplementary Material for this article can be found online at: https://www.frontiersin.org/articles/10.3389/fendo.2022.893164/full#supplementary-material
Supplementary Fig. 1 | (A) When the number of clusters was 2, The CH index was the highest and the clustering effect was the best; (B) F/B radio in TC patients and HCs. The correlation between F/B radio and (C) age, (D) BMI. CH, Calinski-Harabasz; TC, thyroid cancer; HC, healthy control; F, Firmicutes; B, Bacteroidetes.
Supplementary Fig. 2 | (A) The importance of the 25 differential genera was obtained by random forest analysis and expressed by Mean Decrease Accuracy. The top 7 genera were marked in red. (B) By 5 repetitions of ten-fold cross-validation, the error rate of cross-validation no longer decreased when the top 7 genera were selected as the model. (C) The dashed line on the left indicated "λ.min", which was the best λ value; the dashed line on the right indicates "λ.1se", which referred to the λ value of the simplest model obtained within a standard deviation of "λ.min".
Supplementary Fig. 3 | OPLS-DA validate model and the result of random forest and lasso regression analysis in metabolites. (A) Validation of permutation test model in positive compounds. (n = 200). The slope of the regression line of R2 and Q2 was greater than 0, the intercept of R2 and Q2 was 0.521 and -0.360. (B) Validation of permutation test model in negative compounds. (n = 200). The slope of the regression line of R2 and Q2 was greater than 0, the intercept of R2 and Q2 was 0.437 and -0.353. (C) The importance of the 70 differential metabolites was obtained by random forest analysis and expressed by Mean Decrease Accuracy. The top 10 metabolites were marked in red. (D) By 5 repetitions of ten-fold cross-validation, the error rate of cross-validation no longer decreased when the top 10 metabolites were selected as the model. (E) The dashed line on the left indicated "λ.min", which was the best λ value; the dashed line on the right indicates "λ.1se", which referred to the λ value of the simplest model obtained within a standard deviation of "λ.min".
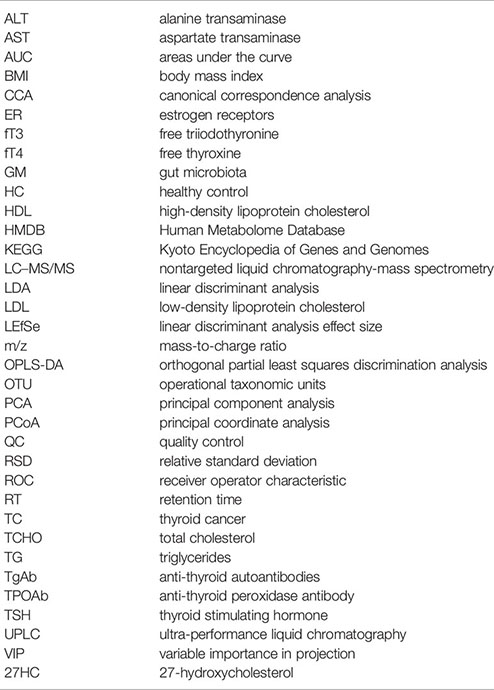
ALT, alanine transaminase; AST, aspartate transaminase; AUC, areas under the curve; BMI, body mass index; CCA, canonical correspondence analysis; ER, estrogen receptors; fT3, free triiodothyronine; fT4, free thyroxine; GM, gut microbiota; HC, healthy control; HDL, high-density lipoprotein cholesterol; HMDB, Human Metabolome Database; KEGG, Kyoto Encyclopedia of Genes and Genomes; LC–MS/MS, nontargeted liquid chromatography-mass spectrometry; LDA, linear discriminant analysis; LDL, low-density lipoprotein cholesterol; LEfSe, linear discriminant analysis effect size; m/z, mass-to-charge ratio; OPLS-DA, orthogonal partial least squares discrimination analysis; OTU, operational taxonomic units; PCA, principal component analysis; PCoA, principal coordinate analysis; QC, quality control; RSD, relative standard deviation; ROC, receiver operator characteristic; RT, retention time; TC, thyroid cancer; TCHO, total cholesterol; TG, triglycerides; TgAb, anti-thyroid autoantibodies; TPOAb, anti-thyroid peroxidase antibody; TSH, thyroid stimulating hormone; UPLC, ultra-performance liquid chromatography; VIP, variable importance in projection; 27HC, 27-hydroxycholesterol
1. Chen W, Zheng R, Baade PD, Zhang S, Zeng H, Bray F, et al. Cancer Statistics in China, 2015. CA Cancer J Clin (2016) 66(2):115–32. doi: 10.3322/caac.21338
2. Kitahara CM, Pfeiffer RM, Sosa JA and Shiels MS. Impact of Overweight and Obesity on US Papillary Thyroid Cancer Incidence Trends (1995-2015). J Natl Cancer Inst (2020) 112(8):810–7. doi: 10.1093/jnci/djz202
3. Son H, Lee H, Kang K and Lee I. The Risk of Thyroid Cancer and Obesity: A Nationwide Population-Based Study Using the Korea National Health Insurance Corporation Cohort Database. Surg Oncol (2018) 27(2):166–71. doi: 10.1016/j.suronc.2018.03.001
4. Fiore M, Cristaldi A, Okatyeva V, Lo Bianco S, Oliveri Conti G, Zuccarello P, et al. Dietary Habits and Thyroid Cancer Risk: A Hospital-Based Case-Control Study in Sicily (South Italy). Food Chem Toxicol (2020) 146:111778. doi: 10.1016/j.fct.2020.111778
5. Kwon H, Chang Y, Cho A, Ahn J, Park SE, Park CY, et al. Metabolic Obesity Phenotypes and Thyroid Cancer Risk: A Cohort Study. Thyroid (2019) 29(3):349–58. doi: 10.1089/thy.2018.0327
6. David LA, Maurice CF, Carmody RN, Gootenberg DB, Button JE, Wolfe BE, et al. Diet Rapidly and Reproducibly Alters the Human Gut Microbiome. Nature (2014) 505(7484):559–63. doi: 10.1038/nature12820
7. Shen CT, Zhang Y, Liu YM, Yin S, Zhang XY, Wei WJ, et al. A Distinct Serum Metabolic Signature of Distant Metastatic Papillary Thyroid Carcinoma. Clin Endocrinol (Oxf) (2017) 87(6):844–52. doi: 10.1111/cen.13437
8. Feng J, Zhao F, Sun J, Lin B, Zhao L, Liu Y, et al. Alterations in the Gut Microbiota and Metabolite Profiles of Thyroid Carcinoma Patients. Int J Cancer (2019) 144(11):2728–45. doi: 10.1002/ijc.32007
9. Zhang J, Zhang F, Zhao C, Xu Q, Liang C, Yang Y, et al. Dysbiosis of the Gut Microbiome is Associated With Thyroid Cancer and Thyroid Nodules and Correlated With Clinical Index of Thyroid Function. Endocrine (2019) 64(3):564–74. doi: 10.1007/s12020-018-1831-x
10. Yu X, Jiang W, Kosik RO, Song Y, Luo Q, Qiao T, et al. Gut Microbiota Changes and its Potential Relations With Thyroid Carcinoma. J Adv Res (2021) 8(35):61–70. doi: 10.1016/j.jare.2021.04.001
11. Knezevic J, Starchl C, Tmava Berisha A, Amrein K. Thyroid-Gut-Axis: How Does the Microbiota Influence Thyroid Function? Nutrients (2020) 12(6):1769. doi: 10.3390/nu12061769
12. Tilocca B, Pieroni L, Soggiu A, Britti D, Bonizzi L, Roncada P, et al. Gut-Brain Axis and Neurodegeneration: State-Of-the-Art of Meta-Omics Sciences for Microbiota Characterization. Int J Mol Sci (2020) 21(11):4045. doi: 10.3390/ijms21114045
13. Schlumberger M, Leboulleux S. Current Practice in Patients With Differentiated Thyroid Cancer. Nat Rev Endocrinol (2021) 17(3):176–88. doi: 10.1038/s41574-020-00448-z
14. Vandeputte D, Falony G, Vieira-Silva S, Tito RY, Joossens M, Raes J. Stool Consistency is Strongly Associated With Gut Microbiota Richness and Composition, Enterotypes and Bacterial Growth Rates. Gut (2016) 65(1):57–62. doi: 10.1136/gutjnl-2015-309618
15. Magoč T, Salzberg SL. FLASH: Fast Length Adjustment of Short Reads to Improve Genome Assemblies. Bioinformatics (2011) 27(21):2957–63. doi: 10.1093/bioinformatics/btr507
16. Chen S, Zhou Y, Chen Y, Gu J. Fastp: An Ultra-Fast All-in-One FASTQ Preprocessor. Bioinformatics (2018) 34(17):i884–i90. doi: 10.1093/bioinformatics/bty560
17. Edgar RC. UPARSE: Highly Accurate OTU Sequences From Microbial Amplicon Reads. Nat Methods (2013) 10(10):996–8. doi: 10.1038/nmeth.2604
18. Navas-Molina JA, Peralta-Sánchez JM, González A, McMurdie PJ, Vázquez-Baeza Y, Xu Z, et al. Advancing Our Understanding of the Human Microbiome Using QIIME. Methods Enzymol (2013) 531:371–444. doi: 10.1016/b978-0-12-407863-5.00019-8
19. Segata N, Izard J, Waldron L, Gevers D, Miropolsky L, Garrett WS, et al. Metagenomic Biomarker Discovery and Explanation. Genome Biol (2011) 12(6):R60. doi: 10.1186/gb-2011-12-6-r60
20. Xia J, Broadhurst DI, Wilson M, Wishart DS. Translational Biomarker Discovery in Clinical Metabolomics: An Introductory Tutorial. Metabolomics (2013) 9(2):280–99. doi: 10.1007/s11306-012-0482-9
21. Li X, Xu Z, Lu X, Yang X, Yin P, Kong H, et al. Comprehensive Two-Dimensional Gas Chromatography/Time-of-Flight Mass Spectrometry for Metabonomics: Biomarker Discovery for Diabetes Mellitus. Anal Chim Acta (2009) 633(2):257–62. doi: 10.1016/j.aca.2008.11.058
22. Xia J, Sinelnikov IV, Han B, Wishart DS. MetaboAnalyst 3.0–Making Metabolomics More Meaningful. Nucleic Acids Res (2015) 43(W1):W251–7. doi: 10.1093/nar/gkv380
23. Shannon P, Markiel A, Ozier O, Baliga NS, Wang JT, Ramage D, et al. Cytoscape: A Software Environment for Integrated Models of Biomolecular Interaction Networks. Genome Res (2003) 13(11):2498–504. doi: 10.1101/gr.1239303
24. Ley RE, Turnbaugh PJ, Klein S, Gordon JI. Microbial Ecology: Human Gut Microbes Associated With Obesity. Nature (2006) 444(7122):1022–3. doi: 10.1038/4441022a
25. Bajzer M, Seeley RJ. Physiology: Obesity and Gut Flora. Nature (2006) 444(7122):1009–10. doi: 10.1038/4441009a
26. Dong R, Zhou T, Zhao S, Zhang H, Zhang M, Chen J, et al. Food Consumption Survey of Shanghai Adults in 2012 and its Associations With Phthalate Metabolites in Urine. Environ Int (2017) 101:80–8. doi: 10.1016/j.envint.2017.01.008
27. Ma Y, Gao W, Wu K, Bao Y. Flavonoid Intake and the Risk of Age-Related Cataract in China’s Heilongjiang Province. Food Nutr Res (2015) 59:29564. doi: 10.3402/fnr.v59.29564
28. Zhang J, Guo Z, Xue Z, Sun Z, Zhang M, Wang L, et al. A Phylo-Functional Core of Gut Microbiota in Healthy Young Chinese Cohorts Across Lifestyles, Geography and Ethnicities. ISME J (2015) 9(9):1979–90. doi: 10.1038/ismej.2015.11
29. Wu GD, Chen J, Hoffmann C, Bittinger K, Chen YY, Keilbaugh SA, et al. Linking Long-Term Dietary Patterns With Gut Microbial Enterotypes. Science (2011) 334(6052):105–8. doi: 10.1126/science.1208344
30. Arumugam M, Raes J, Pelletier E, Le Paslier D, Yamada T, Mende DR, et al. Enterotypes of the Human Gut Microbiome. Nature (2011) 473(7346):174–80. doi: 10.1038/nature09944
31. Gálvez EJC, Iljazovic A, Amend L, Lesker TR, Renault T, Thiemann S, et al. Distinct Polysaccharide Utilization Determines Interspecies Competition Between Intestinal Prevotella Spp. Cell Host Microbe (2020) 28(6):838–52.e6. doi: 10.1016/j.chom.2020.09.012
32. Tong Y, Gao H, Qi Q, Liu X, Li J, Gao J, et al. High Fat Diet, Gut Microbiome and Gastrointestinal Cancer. Theranostics (2021) 11(12):5889–910. doi: 10.7150/thno.56157
33. Luo J, Yang H and Song BL. Mechanisms and Regulation of Cholesterol Homeostasis. Nat Rev Mol Cell Biol (2020) 21(4):225–45. doi: 10.1038/s41580-019-0190-7
34. Le Roy T, Lécuyer E, Chassaing B, Rhimi M, Lhomme M, Boudebbouze S, et al. The Intestinal Microbiota Regulates Host Cholesterol Homeostasis. BMC Biol (2019) 17(1):94. doi: 10.1186/s12915-019-0715-8
35. Naughton SS, Mathai ML, Hryciw DH, McAinch AJ. Linoleic Acid and the Pathogenesis of Obesity. Prostaglandins Other Lipid Mediat (2016) 125:90–9. doi: 10.1016/j.prostaglandins.2016.06.003
36. Fuke G, Nornberg JL. Systematic Evaluation on the Effectiveness of Conjugated Linoleic Acid in Human Health. Crit Rev Food Sci Nutr (2017) 57(1):1–7. doi: 10.1080/10408398.2012.716800
37. Goodrich JK, Waters JL, Poole AC, Sutter JL, Koren O, Blekhman R, et al. Human Genetics Shape the Gut Microbiome. Cell (2014) 159(4):789–99. doi: 10.1016/j.cell.2014.09.053
38. Alemán JO, Bokulich NA, Swann JR, Walker JM, De Rosa JC, Battaglia T, et al. Fecal Microbiota and Bile Acid Interactions With Systemic and Adipose Tissue Metabolism in Diet-Induced Weight Loss of Obese Postmenopausal Women. J Transl Med (2018) 16(1):244. doi: 10.1186/s12967-018-1619-z
39. Moszak M, Szulińska M, Bogdański P. You Are What You Eat-The Relationship Between Diet, Microbiota, and Metabolic Disorders-A Review. Nutrients (2020) 12(4):1096. doi: 10.3390/nu12041096
40. Bowyer RCE, Jackson MA, Pallister T, Skinner J, Spector TD, Welch AA, et al. Use of Dietary Indices to Control for Diet in Human Gut Microbiota Studies. Microbiome (2018) 6(1):77. doi: 10.1186/s40168-018-0455-y
41. Maskarinec G, Hullar MAJ, Monroe KR, Shepherd JA, Hunt J, Randolph TW, et al. Fecal Microbial Diversity and Structure Are Associated With Diet Quality in the Multiethnic Cohort Adiposity Phenotype Study. J Nutr (2019) 149(9):1575–84. doi: 10.1093/jn/nxz065
42. Klimenko NS, Tyakht AV, Popenko AS, Vasiliev AS, Altukhov IA, Ischenko DS, et al. Microbiome Responses to an Uncontrolled Short-Term Diet Intervention in the Frame of the Citizen Science Project. Nutrients (2018) 10(5):576. doi: 10.3390/nu10050576
43. Wei W, Jiang W, Tian Z, Wu H, Ning H, Yan G, et al. Fecal G. Streptococcus and G. Eubacterium_coprostanoligenes_group Combined With Sphingosine to Modulate the Serum Dyslipidemia in High-Fat Diet Mice. Clin Nutr (2021) 40(6):4234–45. doi: 10.1016/j.clnu.2021.01.031
44. He S, Nelson ER. 27-Hydroxycholesterol, an Endogenous Selective Estrogen Receptor Modulator. Maturitas (2017) 104:29–35. doi: 10.1016/j.maturitas.2017.07.014
45. Ma L, Cho W, Nelson ER. Our Evolving Understanding of How 27-Hydroxycholesterol Influences Cancer. Biochem Pharmacol (2022) 196:114621. doi: 10.1016/j.bcp.2021.114621
46. Revilla G, Pons MP, Baila-Rueda L, GarcÃa-León A, Santos D, Cenarro A, et al. Cholesterol and 27-Hydroxycholesterol Promote Thyroid Carcinoma Aggressiveness. Sci Rep (2019) 9(1):10260. doi: 10.1038/s41598-019-46727-2
47. Asghari A, Umetani M. Obesity and Cancer: 27-Hydroxycholesterol, the Missing Link. Int J Mol Sci (2020) 21(14):4822. doi: 10.3390/ijms21144822
Keywords: differentiated thyroid cancer, gut microbiota, metabolomics, lipid metabolism, diet
Citation: Lu G, Yu X, Jiang W, Luo Q, Tong J, Fan S, Chai L, Gao D, Qiao T, Wang R, Deng C, Lv Z and Li D (2022) Alterations of Gut Microbiome and Metabolite Profiles Associated With Anabatic Lipid Dysmetabolism in Thyroid Cancer. Front. Endocrinol. 13:893164. doi: 10.3389/fendo.2022.893164
Received: 10 March 2022; Accepted: 21 April 2022;
Published: 03 June 2022.
Edited by:
Caterina Mian, University of Padua, ItalyReviewed by:
Camilla Virili, Sapienza University of Rome, ItalyCopyright © 2022 Lu, Yu, Jiang, Luo, Tong, Fan, Chai, Gao, Qiao, Wang, Deng, Lv and Li. This is an open-access article distributed under the terms of the Creative Commons Attribution License (CC BY). The use, distribution or reproduction in other forums is permitted, provided the original author(s) and the copyright owner(s) are credited and that the original publication in this journal is cited, in accordance with accepted academic practice. No use, distribution or reproduction is permitted which does not comply with these terms.
*Correspondence: Dan Li, cGx1bXJlZGxpbmRhQDE2My5jb20=; Zhongwei Lv, THZ6d2pzMjAyMEAxNjMuY29t
†These authors have contributed equally to this work
Disclaimer: All claims expressed in this article are solely those of the authors and do not necessarily represent those of their affiliated organizations, or those of the publisher, the editors and the reviewers. Any product that may be evaluated in this article or claim that may be made by its manufacturer is not guaranteed or endorsed by the publisher.
Research integrity at Frontiers
Learn more about the work of our research integrity team to safeguard the quality of each article we publish.