
94% of researchers rate our articles as excellent or good
Learn more about the work of our research integrity team to safeguard the quality of each article we publish.
Find out more
REVIEW article
Front. Endocrinol., 26 May 2022
Sec. Bone Research
Volume 13 - 2022 | https://doi.org/10.3389/fendo.2022.892961
This article is part of the Research TopicCartilage Assessment using Quantitative MRIView all 5 articles
 Amir Masoud Afsahi1,2
 Sam Sedaghat1
 Dina Moazamian1,2
 Ghazaleh Afsahi3
 Jiyo S. Athertya1
 Hyungseok Jang1
 Ya-Jun Ma1*
Articular cartilage is a major component of the human knee joint which may be affected by a variety of degenerative mechanisms associated with joint pathologies and/or the aging process. Ultrashort echo time (UTE) sequences with a TE less than 100 µs are capable of detecting signals from both fast- and slow-relaxing water protons in cartilage. This allows comprehensive evaluation of all the cartilage layers, especially for the short T2 layers which include the deep and calcified zones. Several ultrashort echo time (UTE) techniques have recently been developed for both morphological imaging and quantitative cartilage assessment. This review article summarizes the current catalog techniques based on UTE Magnetic Resonance Imaging (MRI) that have been utilized for such purposes in the human knee joint, such as T1, , T1ρ, magnetization transfer (MT), double echo steady state (DESS), quantitative susceptibility mapping (QSM) and inversion recovery (IR). The contrast mechanisms as well as the advantages and disadvantages of these techniques are discussed.
Articular cartilage is one of the most important components of the human knee joint, distributing compressive loads and enabling low-friction motion (1). Medical imaging is of critical role in cartilage assessment for screening and treatment purposes (2, 3).
Magnetic resonance imaging (MRI) has long been a useful modality in the investigation of musculoskeletal (MSK) components, particularly in the case of evaluating articular cartilage in the human knee joint. Collagenous matrix is one of the primary components of cartilage, which has a higher structural order at the deeper layers of cartilage. Part of the water components in cartilage are tightly bound to the collagenous matrix (i.e., bound water). This bound water component typically has a much shorter T2 relative to the free water component due to its limited mobility. Deeper layers of cartilage consist of more bound water because of the denser collagen structures in these regions. As a result, cartilage has a relatively short T2 relaxation, especially when the collagen fiber orientates in parallel to the B0 field due to the magic angle effect (4). In general, T2 in tissues can be categorized into the four following groups: “super-short” (T2 <0.1 ms), “ultrashort” (0.1<T2<1 ms), “short” (1<T2<10 ms), and “long” (T2>10 ms) (5). While conventional MRI is oftentimes able to provide accurate morphological assessment of many musculoskeletal tissues throughout the body with high spatial resolution, in the case of articular cartilage, conventional MRI techniques such as the fast spin echo (FSE) sequence are, in fact, incapable of capturing this tissue’s short T2 signals due to the MRI sequences’ relatively long echo times (TEs) (>5 ms).
During the last two decades, a specific MRI approach termed ultrashort echo time (UTE) MRI has gained traction in the research sphere as a technique that is able to visualize otherwise difficult-to-image tissue structures such as those with short T2 and values and/or low water and proton content (4, 6). Since UTE MRI’s very first introduction in the 1980s (7) as an in vivo application for lung parenchymal imaging (8), the technique has been further developed to visualize an array of other short T2 species such as menisci and tendons (9). By using UTE MRI, rapidly decaying signals that would typically be lost in conventional MRI can be acquired after short radiofrequency (RF) excitation, as quickly as is possible by the hardware (TE < 100μs), before any major T2/ decay (10). Basic UTE, dual echo UTE with echo subtraction (11), inversion recovery UTE (IR-UTE) (12), dual-inversion recovery UTE (Dual-IR-UTE) (13, 14), UTE (15), UTE-T1ρ (16, 17), UTE with magnetization transfer (MT) (18–20), UTE with double echo steady state (DESS) (21, 22), and UTE with quantitative susceptibility mapping (QSM) (23) are among the primary UTE MRI techniques which have been developed for qualitative and quantitative imaging of articular cartilage.
Articular cartilage consists of four different layers, namely the superficial, middle, deep, and calcified layers (see Figure 1). These layers are of increasing radiological significance as it has become known that they may play a role in the early pathogenesis of osteoarthritis (OA) (25). However, because of their short transverse relaxation times, these cartilaginous structures are not properly visualized when using conventional MR sequences (4). UTE MRI’s ability to capture these short transverse relaxation time tissues means that all the layers of cartilage, including both the short and long T2 layers, can be more accurately and comprehensively imaged and quantified for improved assessment of diseases such as osteoarthritis compared to conventional MRI sequences which can only image the long T2 layers of cartilage (26–28).
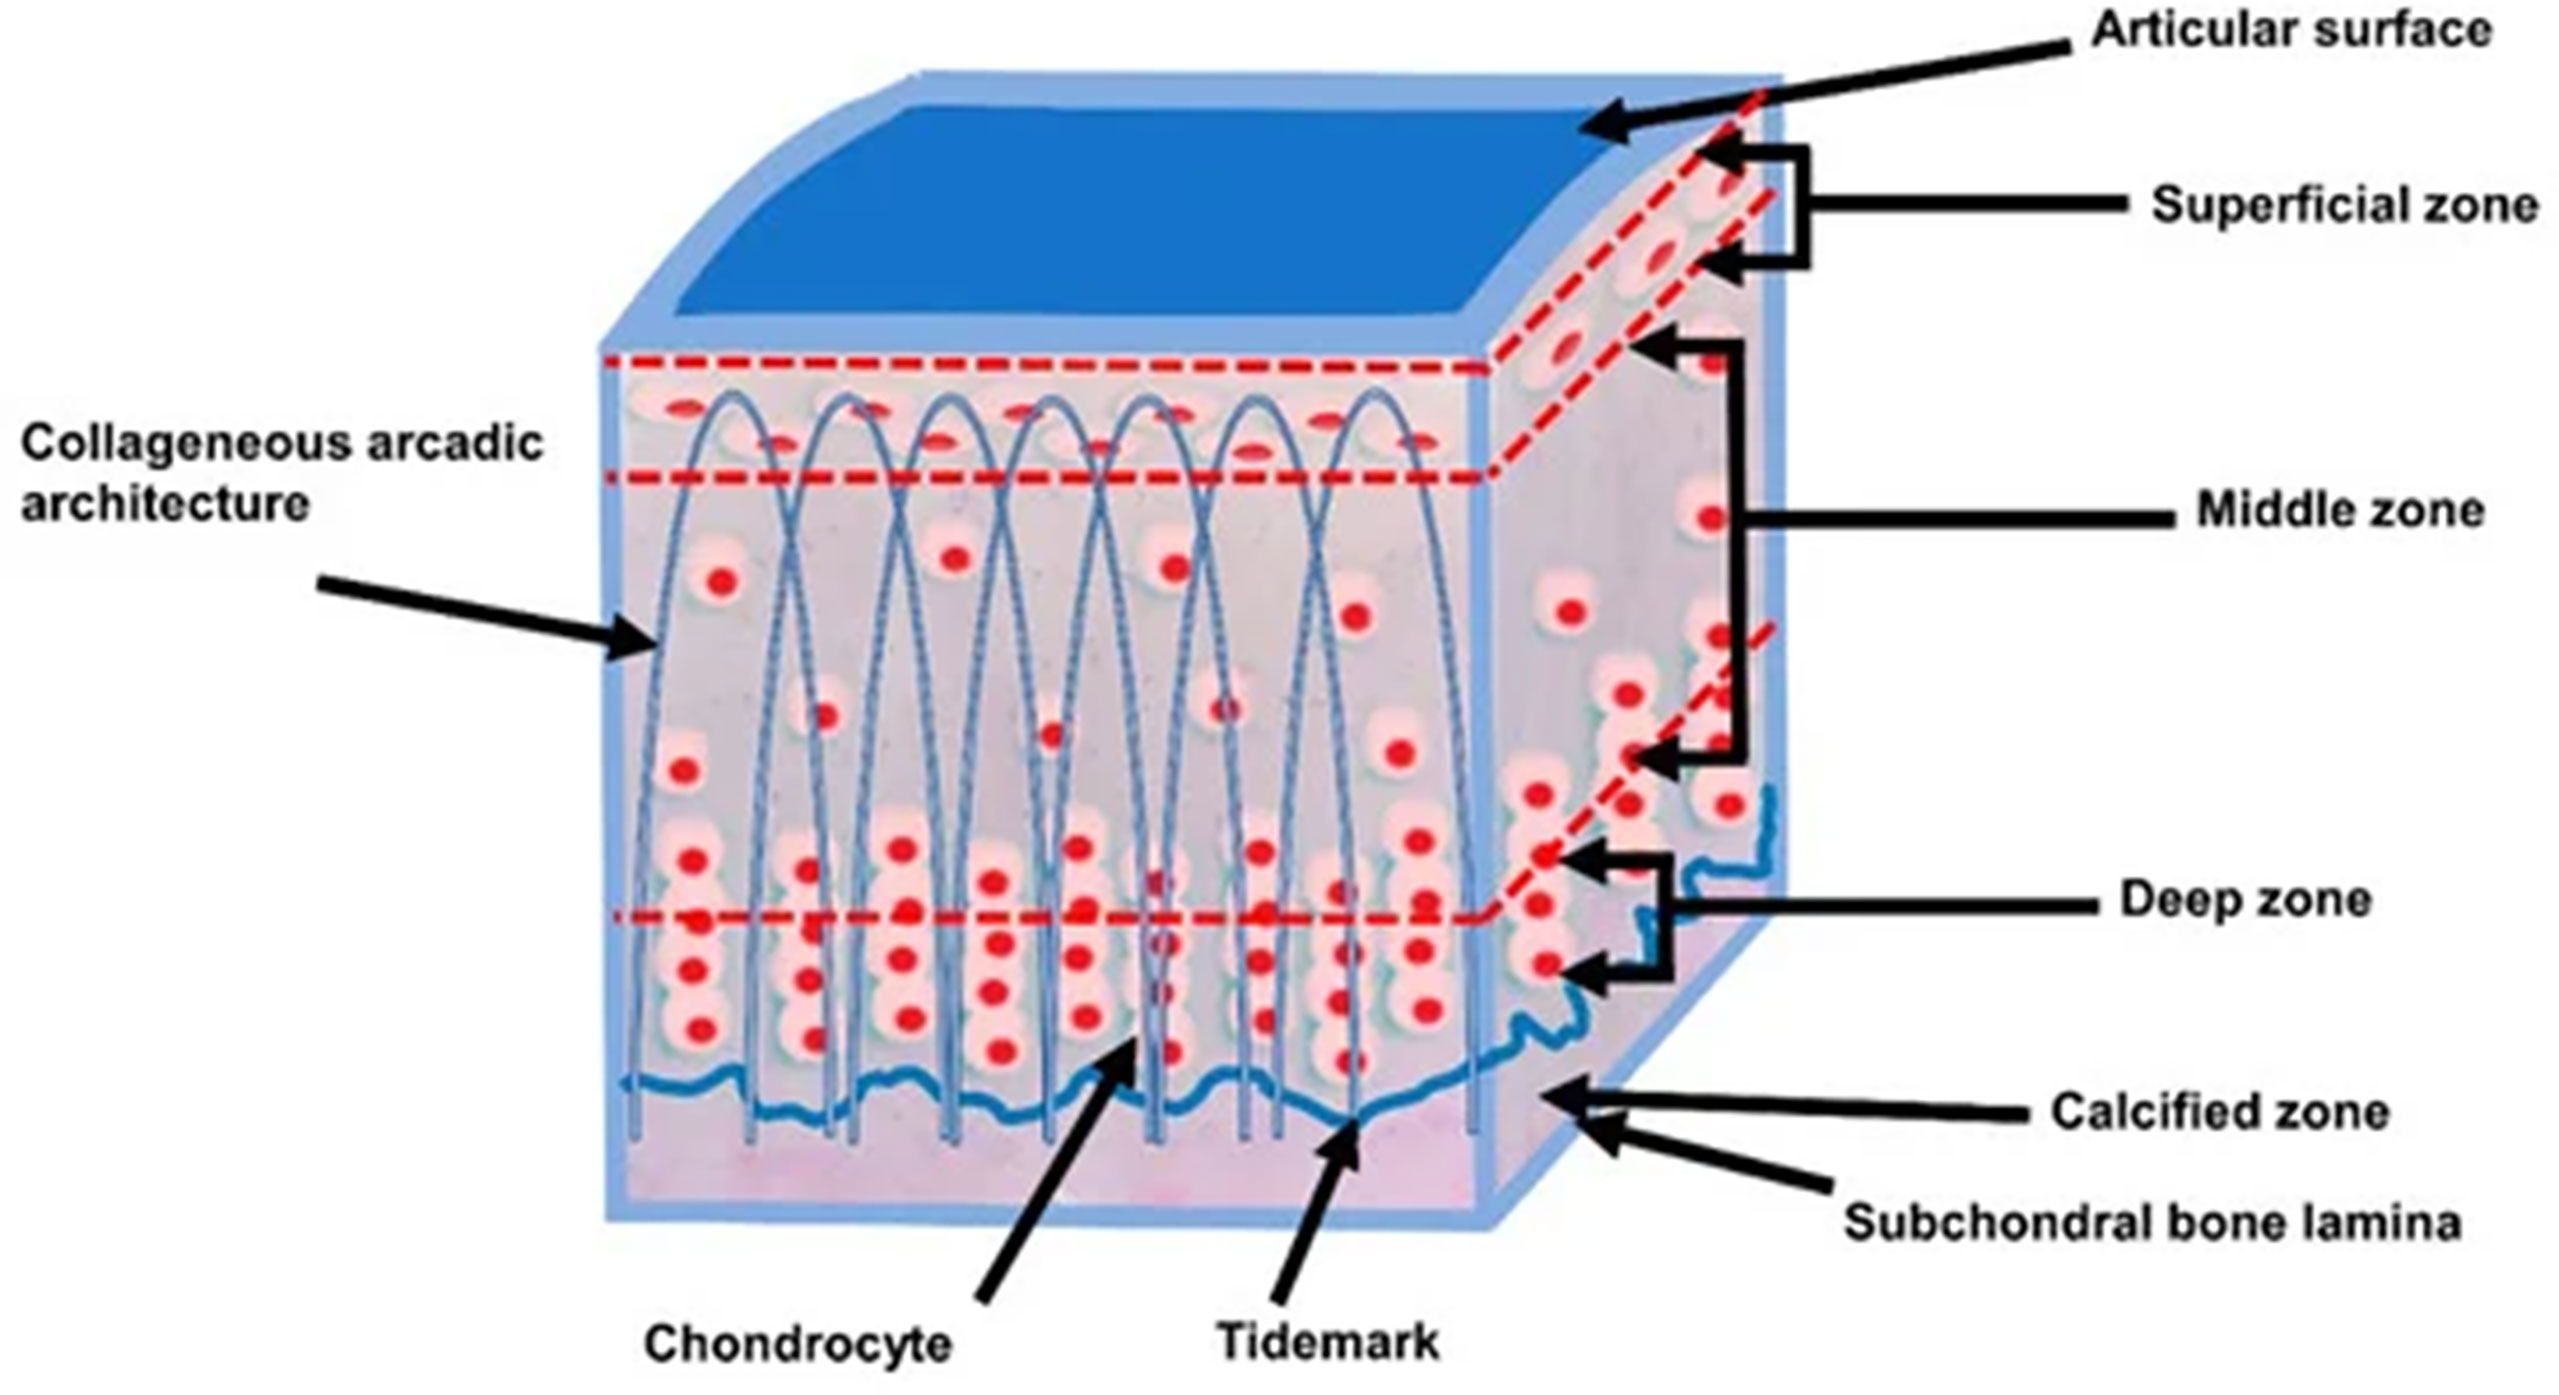
Figure 1 The schematic cross sectional layers of articular cartilage. Articular cartilage consists of four different layers, namely the superficial, middle, deep, and calcified layers. Modified, with permission under Creative Common Attribution License from Ref (24).
This study is a systematic review focused on the current development of UTE MRI techniques applied for articular cartilage evaluation. It is categorized based on different UTE techniques including basic UTE, various IR-UTE methods, UTE , UTE T1, UTE T1ρ, UTE MT, UTE DESS, and UTE QSM. Table 1 presents a summary of the articles reviewed in this study. This study is an update of the current review literature focused on musculoskeletal tissues with short T2 values (4, 6) as these techniques continue to rapidly evolve and have been applied in numerous other studies.
Basic UTE, or UTE without any preparation pulses, has mainly been employed for morphological imaging of the articular cartilage. However, by using UTE images at varying echo times (TEs) or at varying repetition times (TRs) and flip angles (FAs), basic UTE has been used to measure cartilage (39, 61) and cartilage T1 (4, 29, 31), respectively. Basic UTE can also be performed with different readout trajectories. Figure 2 illustrates three representative UTE pulse sequence diagrams. In UTE sequences, a short rectangular or half soft pulse is employed for signal excitation. Ramp sampling and fast transmit/receive switching strategy are utilized to minimize TE for the excited fid signals. Non-Cartesian k-space trajectories, such as radial and spiral, are the most commonly used spatial encoding patterns.
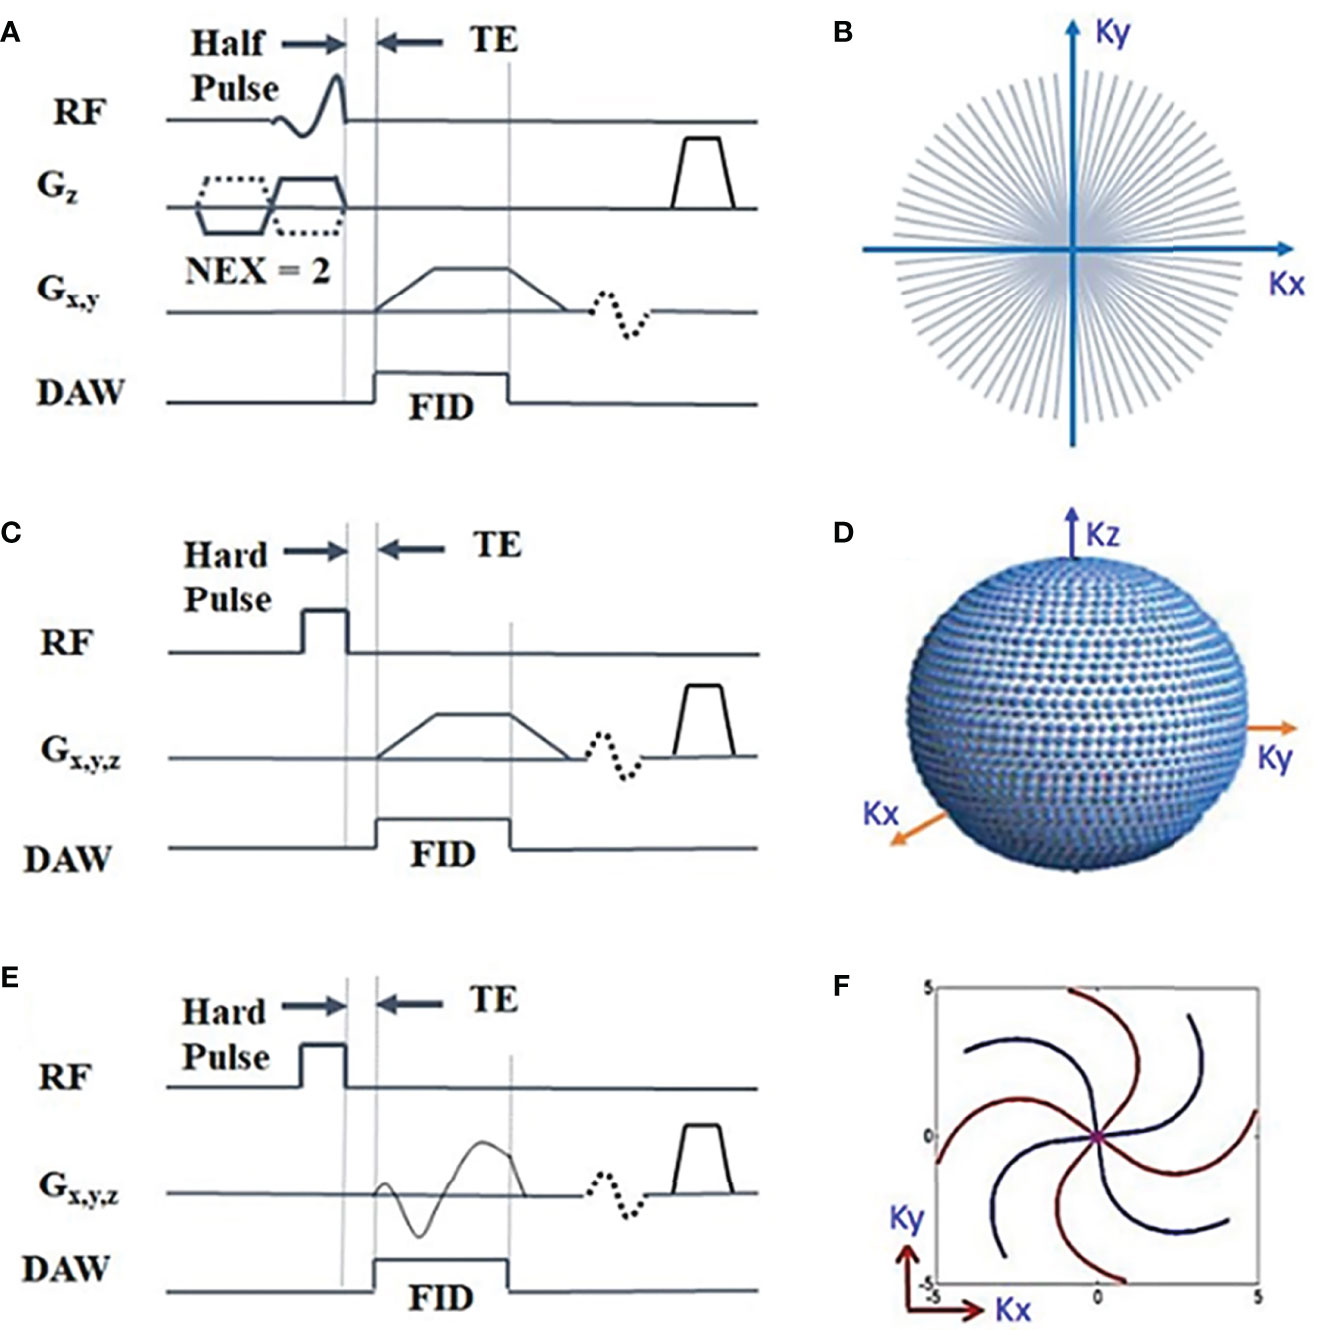
Figure 2 Three representative UTE pulse sequence diagrams: 2D UTE sequence with a slice-selective half radiofrequency (RF) pulse excitation followed by 2D radial ramp sampling (A) (4), and 3D UTE with a short hard pulse excitation followed by 3D radial ramp sampling (C) (4) or by twisted radial trajectories with conical view ordering (4, 31) (33, 62) (E). The k-space sampling patterns are shown in (B, D, F), respectively. The data acquisition window (DAW) covers part of the free induction decay (FID) before the short T2 transverse magnetization decays to near zero. Modified, with permission from Refs (4, 31).
One of the very first in vivo studies to apply UTE sequences in various parts of the knee, including articular cartilage, was conducted by Gatehouse et al., who used UTE sequences with a TE of 0.08 ms to visualize knee tissues in 16 patients who had various knee injuries on a 1.5T scanner (30). Using gadodiamide enhancement, conventional fat suppression, and subtraction images, they were able to detect higher signals from the deepest (i.e., calcified) cartilage layers which have shorter T1s and T2s relative to the more superficial cartilage layers. Cartesian and radial k-space sampling were originally used for UTE signal acquisition (63), but 2D spiral sampling has since been developed to accelerate the UTE imaging of short T2 species (43). Du et al. combined half-pulse excitation and spiral sampling for UTE imaging of the deep radial and calcified layers of knee cartilage in a healthy volunteer at 1.5T field strength and obtained good contrast and high spatial resolution (43). Figure 3 illustrates axial imaging of a slice of patella with clinical gradient echo sequence (GE) (A), GE with fat saturation (FS) (B), proton density- weighted fast spin echo (PD FSE) (C), PD FSE with FS (D), T1 FSE (E), T1 FSE with FS (F), and conventional UTE with a TE of 8 μs (G) and of 6.6 ms (H), subtraction of the second from the first echo (I), fat-saturated UTE with a TE of 8 μs (J) and of 6.6 ms (K) followed by corresponding later echo subtraction (L), and dual inversion recovery (DIR) UTE (M).
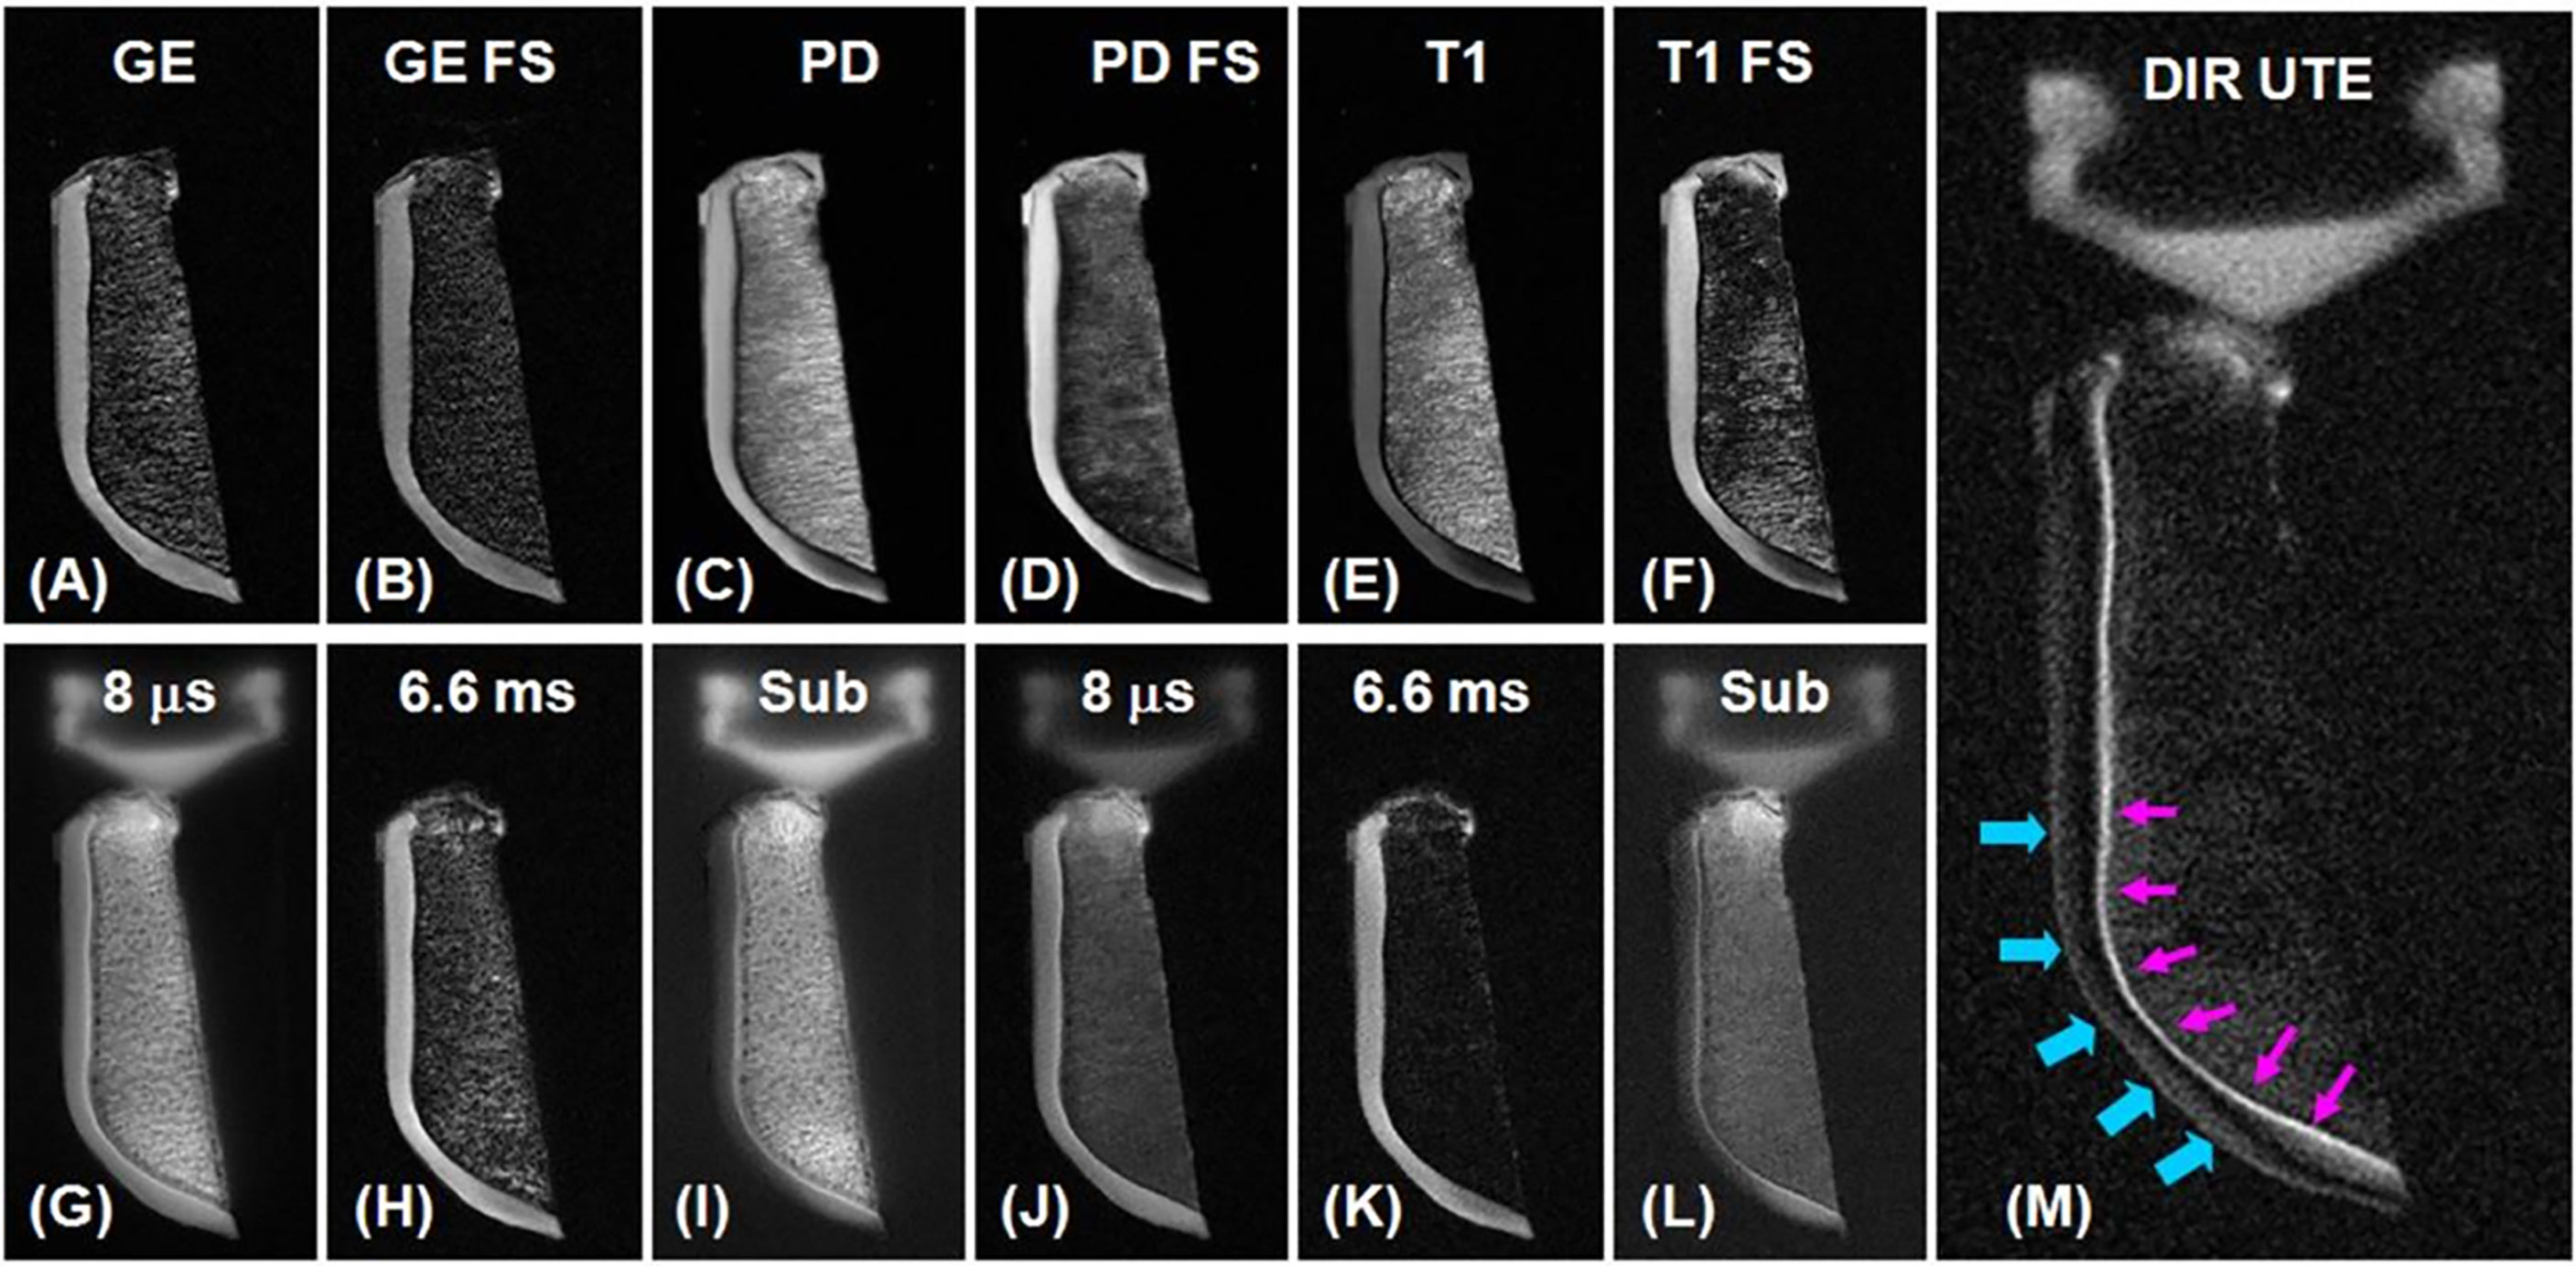
Figure 3 Axial imaging of a slice of patella with clinical gradient echo sequence (GE) (A), GE with fat saturation (FS) (B), proton density-weighted fast spin echo (PD FSE) (C), PD FSE with FS (D), T1 FSE (E), T1 FSE with FS (F), conventional UTE with a TE of 8 μs (G) and 6.6 ms (H), subtraction of the second from the first echo (I), fat-saturated UTE with a TE of 8 μs (J) and 6.6 ms (K) followed by corresponding later echo subtraction (L), and dual inversion recovery (DIR) UTE (M). Clinical GE and spin echo (SE)-FSE sequences do not show signal from deep radial and calcified cartilage layers, which are brightly visualized in UTE sequences. There is limited contrast between not only the deep and superficial layers of cartilage, but also between the cartilage layers and bone marrow fat. The DIR UTE image illustrates the deep radial and calcified cartilage layers with high contrast (pink arrows) and with good signal suppression from the superficial cartilage layers and fat. There is some residual signal from the superficial cartilage layers as a result of T1 variations (imperfect nulling). Modified, with permission from Ref (64).
Other studies have also employed spiral UTE MRI for deep cartilage morphological imaging. For example, Goto et al. (44) used spiral UTE sequences on 5 healthy volunteers to evaluate UTE sensitivity in the visualization of deep calcified cartilage layers and found a sufficient contrast of deep and calcified cartilage layers from the UTE dual-echo subtracted images.
Other variations of the spiral UTE MRI imaging technique have also been developed to reduce scan time and to improve the signal-to-noise ratio (SNR), resolution, and short T2 contrast within the knee joint (51, 65–67). Fermat looped, orthogonally encoded trajectories (FLORET) are superior to 3D radial acquisition with regards to image quality, SNR, scan time, and off-resonance blurring for UTE data (65). 3D cones trajectories (66), stack of spirals trajectories (67), and acquisition-weighted stack of spirals (AWSOS) (51) are all variations on UTE acquisition trajectories that have been used successfully. For example, Qian et al. utilized the AWSOS technique on a 3T scanner for in vivo morphological imaging of short T2 tissues in the knee joint, including articular cartilage (51). Spiral trajectories applied in this study accelerated in-plane data acquisitions, making the approach much more time-efficient with a reduced scan time by a factor of 4-10 compared with that in Cartesian acquisitions at the same resolution. Employing AWSOS, higher in-plane resolution (0.28-0.14mm) was achieved, making the technique potentially useful for earlier detection of pathology. However, to achieve an SNR acceptable for resolution of 0.14mm, a quite large slice thickness of 3mm is required, which results in strong partial volume effect. A smaller thickness of <2mm, although optimal, suffers SNR reductions at 3T. Higher field strengths such as 7T are a promising solution, as they can accommodate smaller slice thicknesses with sufficiently high SNR (48).
In another morphological study for visualization of short T2 tissues of the knee joint with optimal contrast, Lee et al. (49) implemented weighted subtraction in 3D UTE imaging on a 3T scanner. They hypothesized that weighting subtraction with an optimal weighting factor would provide high positive contrast of short T2 tissues with adequate suppression of the surrounding long T2 tissues. The optimal weighting factor in this study was calculated by determining the SNR and contrast-to-noise ratio (CNR), then dividing SNR by CNR. With a weighting factor of 0.4, they obtained a high contrast-weighted subtraction image in a 67-year-old man with prior clinical diagnoses of osteoarthritis and chondromalacia (49).
UTE measurement of cartilage by acquiring UTE images at varying TEs has been widely investigated (42). Figure 4 shows the comparison between MR imaging of articular cartilage using CPMG-T2 (A) and 3D fat-saturated UTE Cones sequences (C) with corresponding single component fitting curves (B) and (D), respectively.
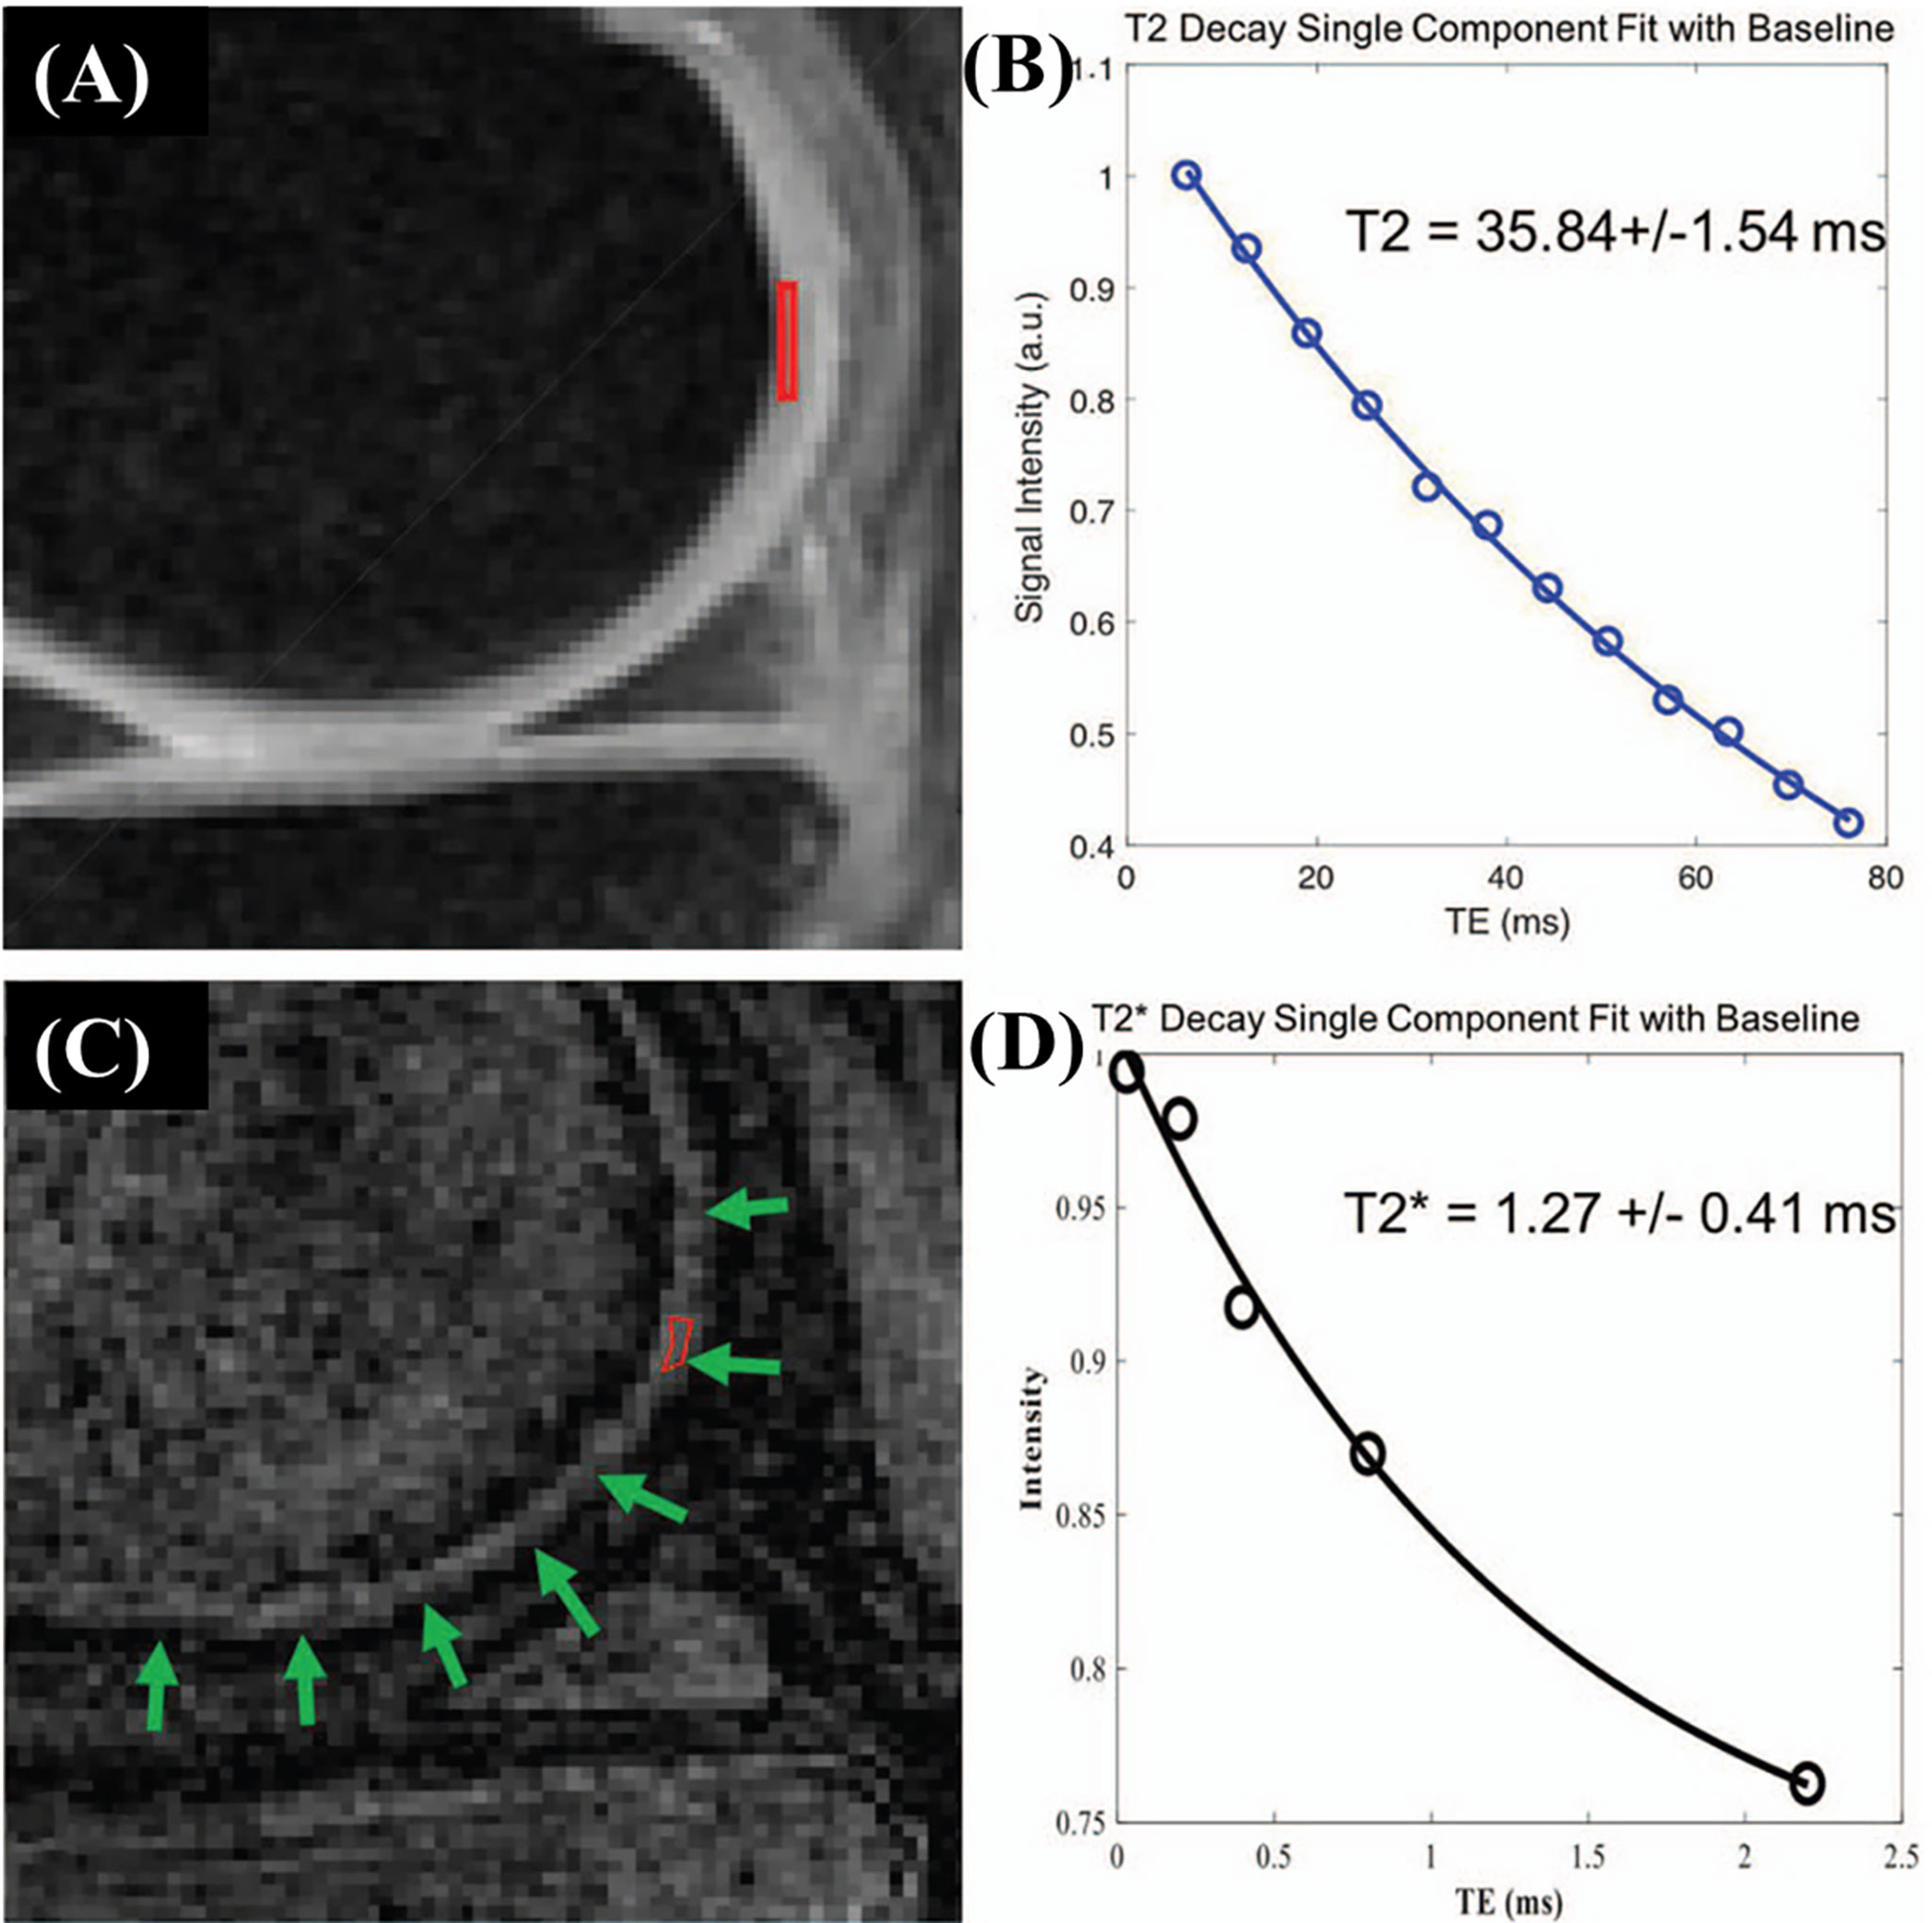
Figure 4 Cadaveric knee joint sample of a 63-year-old female. MR imaging of articular cartilage applying CPMG-T2 (A) and 3D fat saturated UTE Cones sequences (C). The clinical FSE and CPMG sequences demonstrate signal void for the ZCC region. A single-component exponential fitting curves showed T2 values of 35.84 ± 1.54 ms in the deep cartilage (B). The 3D fat-saturated UTE Cones sequence demonstrates high signal but low contrast in the ZCC region (green arrows), with values of 1.27 ± 0.41 ms (D). Modified, with permission from Ref (26).
Williams et al. investigated feasibility and repeatability of UTE mapping at 3T in vivo and reported coefficients of variation (CVs) lower than 10% (38). Their earlier study also concluded that was not only sensitive to cartilage matrix degenerations but was also able to capture signals from short T2 tissues, particularly the deeper regions of severely damaged cartilage that had low values (Figure 5) (39).
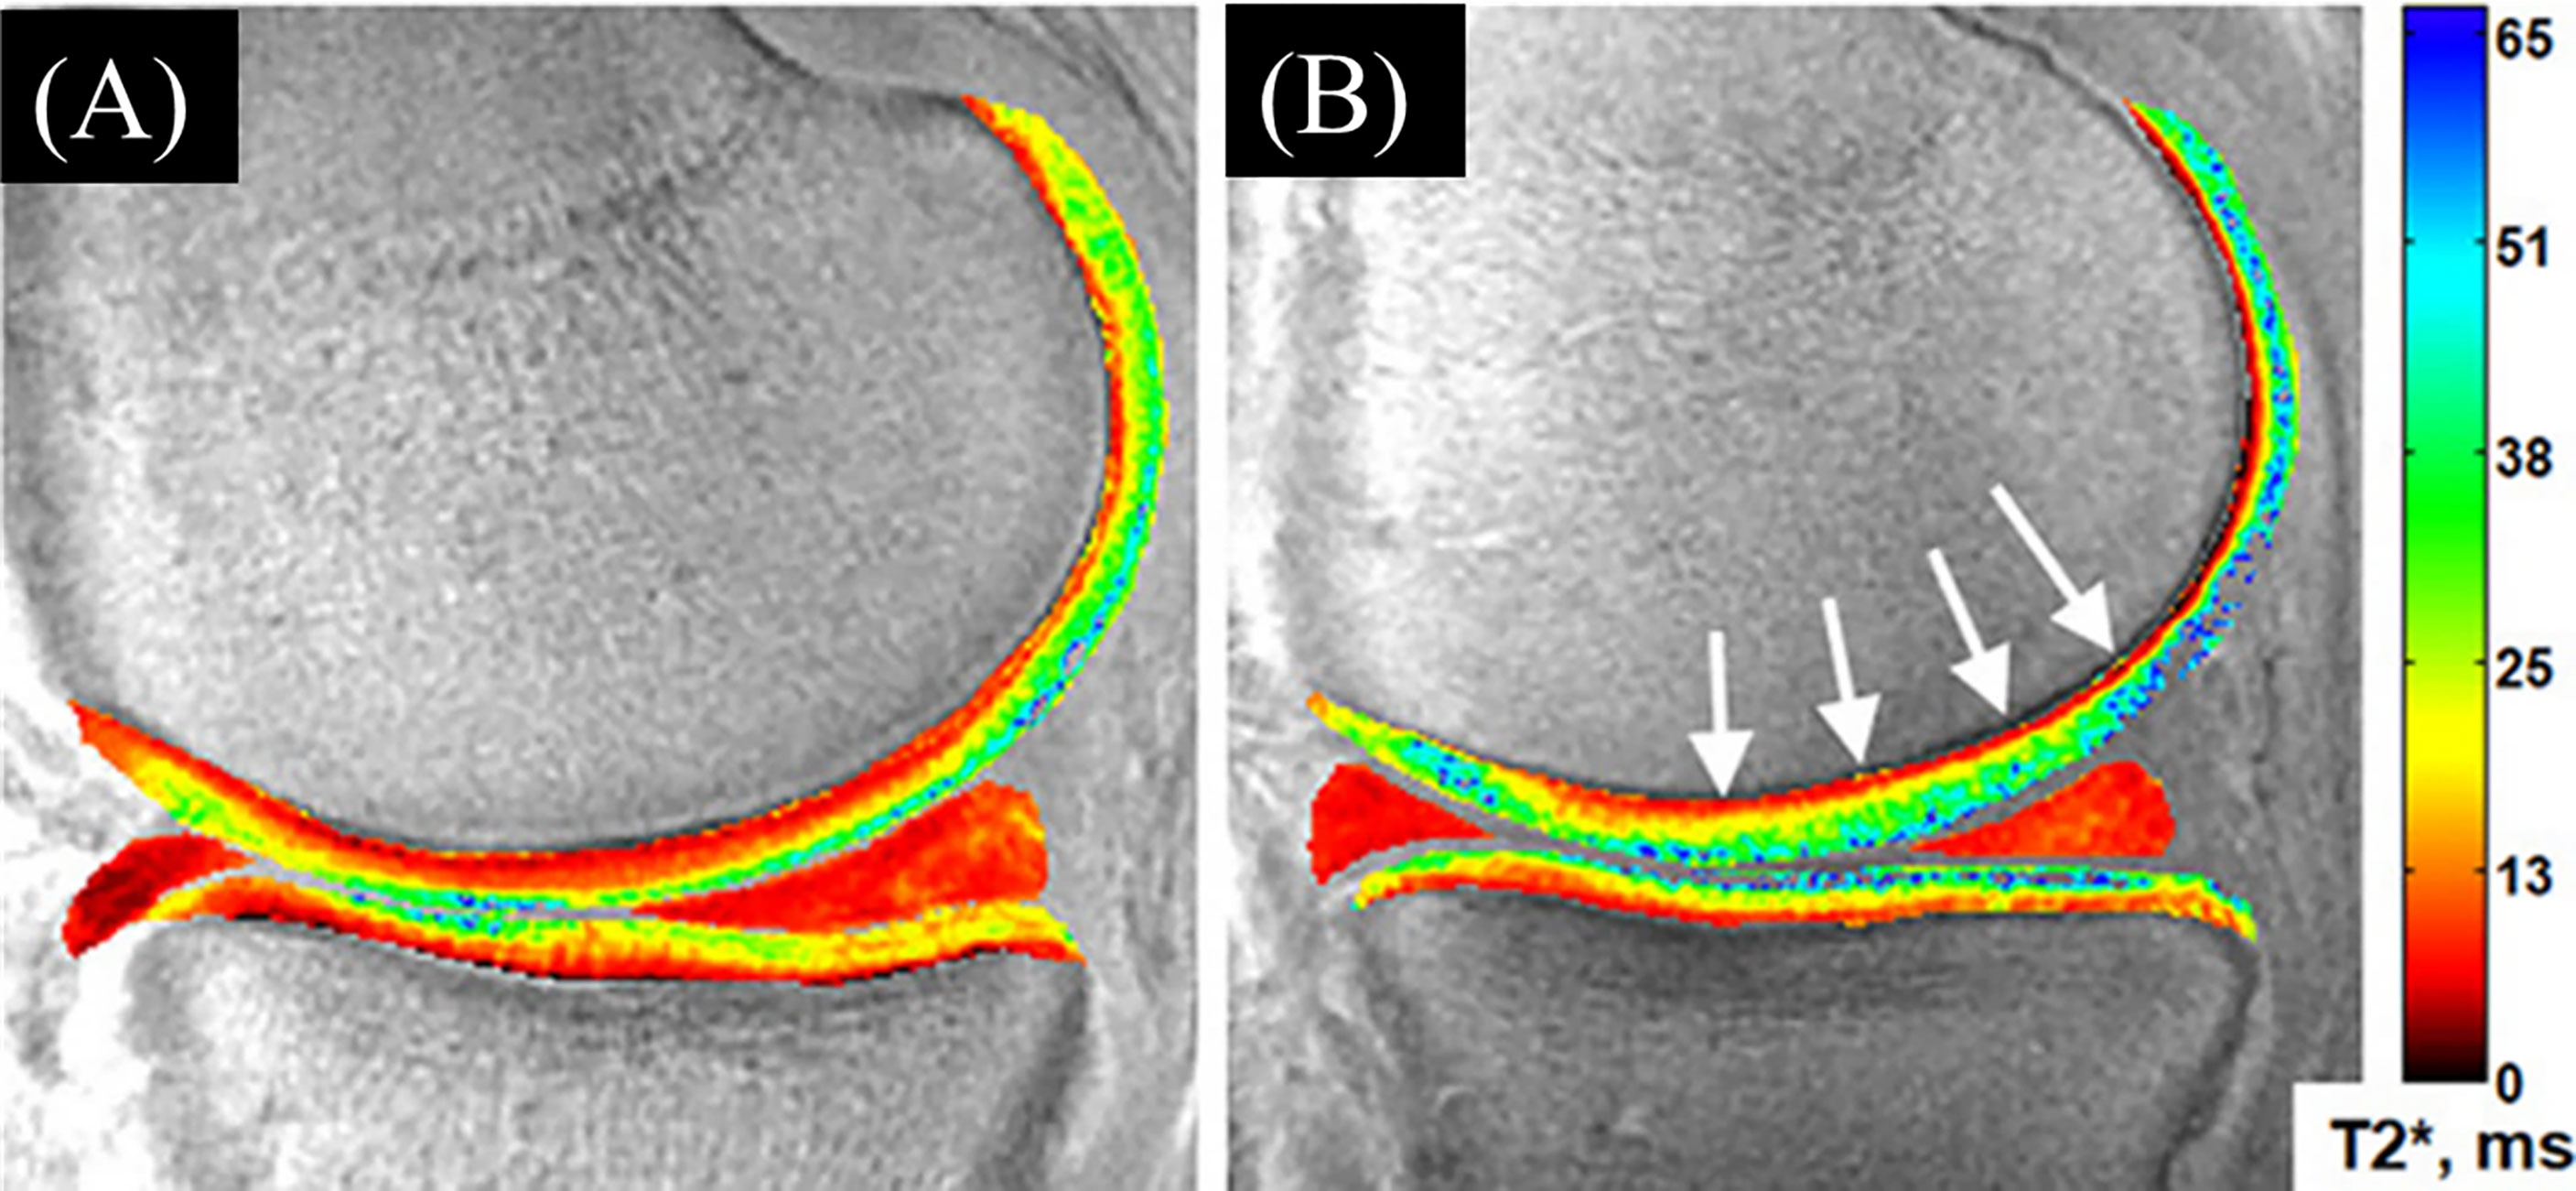
Figure 5 A sample of 2D UTE- maps. (A) An uninjured 29-year-old male control subject with typical laminar appearance to UTE- values. (B) 34-year-old male ACL reconstruction subject 2 years following surgery, without morphological evidence of medial cartilage (Outerbridge grade 0) pathology, demonstrates elevations to UTE- values throughout the medial femoro-tibial cartilage region, specifically in deep medial femoral cartilage (white arrows). Modified, with permission from Ref (15).
In several prospective studies performed by Williams et al., UTE mapping has shown potential in cartilage screening following anterior cruciate ligament (ACL) reconstruction (ACLR) in order to predict future osteoarthritis (15, 37, 39). In a two-year study of patients after ACLR, 2D and 3D UTE mappings of the medial femoral cartilage (MFC) and medial tibial plateau (MTP), respectively, were implemented at 3T. Approximately half of the patients demonstrated pre-osteoarthritic changes in the cartilage, indicated by consistent elevations detected in the medial tibio-femoral deep cartilage (15). In another relevant study, Williams et al. reported moderate correlations between UTE depth-wise change rates (profile slopes) with clinical parameters of patient reported outcomes (PROs) and walking mechanics such as knee adduction moment (KAM) in the two years following ACLR (37). In a similar study, Titchenal et al. confirmed that in the two years following ACLR, deep UTE- elevation in medial knee cartilage components was associated with clinical biomarkers of OA, such as increased varus alignment and increased KAM (40). Later, Chu et al. demonstrated the capability of UTE in detecting deep cartilage matrix changes. This study suggested that the return of elevated values in post-ACLR patients to levels comparable with healthy controls might indicate healing (42).
In a pilot study, Foreman et al. incorporated mapping at 3T to evaluate mineralization of deep cartilage layer in a cohort (n=10) of type 2 diabetes mellitus patients as a prototype for vascular insufficiencies. They reported lower values and more mineralized deep cartilage layer in this patient cohort (35). Similarly, Drygalsky et al. investigated UTE mapping as a method to quantify iron concentration caused by internal joint bleeding in the cartilage of hemophilic patients (36). They have reported correlations between joint deterioration and cartilage hemosiderin levels, as detected by decreased .
With the ultimate goal of assessing the biomechanical properties of tissue, there is the question of whether and how and magnetization transfer ratio (MTR) obtained via UTE MRI correlate with the mechanical properties of human patellar cartilage. Using an in situ model, Hananouchi et al. applied a micro-indentation device with tri-axial force sensor to demonstrate a positive correlation between stiffness/elastic modulus and each predictor variable: UTE-, UTE-MTR, and probing device force (52). In addition, multiple linear regression analyses demonstrated that an even stronger correlation was achieved when all three predictors were combined, further confirming the potential of this noninvasive imaging approach for in situ evaluation of the mechanical properties of cartilage tissue.
Evaluation of the zone of calcified cartilage (ZCC) is another important application of mapping in cartilage assessment. Liu et al. used UTE to assess in healthy and cadaveric specimens at 3T and directly visualized and quantified the ZCC with high SNR (26). Advantages of the UTE approach are limited, however, by long scan times and susceptibility to the magic angle effect, both factors that need to be addressed accordingly to maximize the technique’s usefulness.
Most of the cartilage UTE studies presented above have employed single component exponential fitting models to calculate the values. Bicomponent UTE analysis has been proposed for more comprehensive cartilage assessment by modeling the tissue as two different components: short and long components (Figure 6). Shao et al. identified relatively constant values for short components across various cartilage depths, but noted increasing values for the long components (41). The fraction of the long component was found to increase from the calcified toward the superficial cartilage.

Figure 6 Safranin-O (A), polarized light microscopy (PLM) (B), UTE (C), and PD-SE (D) images of a normal sample of patella donated by a 58 year old male donor. Line profiles for short (E), long (F), short fraction (H), and long fraction (I), as well as CPMG T2 (G) are illustrated. Gradual increases in long , long fraction, and T2 from the deep to the superficial cartilage is observed. Fitting errors in single component T2 and bi-component analysis are depicted. Peak signal areas corresponding to magic angle on the UTE and SE images are also delineated (arrows). Modified, with permission from Ref (41).
To determine the correlation between short and long water fractions obtained by UTE MRI with histopathologic and polarized light microscopic (PLM) results, Pauli et al. scanned human cadaveric patellar cartilage by applying UTE-MRI, spin-echo imaging, and subsequent bicomponent analysis. They realized that short had significant correlations with both the Mankin (histopathologic) scores and Vaudey (PLM) scores (54), suggesting that short could potentially serve as a biomarker of cartilage degeneration. In another study, Du et al. applied 2D UTE with bicomponent analysis on a 3T scanner to quantify short and long as well as their fractions in cadaveric patellar cartilage (0.48 ms and 34.97 ms; 18.47% and 81.53%, respectively) (55). Jang et al. proposed another variant of the technique: a single scan ramped hybrid encoding (RHE) sequence at 3T to provide rapid bicomponent analysis of the human knee joint with a total scan time of less than 9 minutes (56).
Multicomponent UTE acquisitions have also proved to be feasible in knee cartilage studies (53). This approach is based on two important fundamental observations in the literature: 1) that disorganization of collagen fibers is a sign of early stage cartilage degeneration, and 2) that water molecules trapped within well-organized collagen fibrils are sensitive to collagen alterations (53). Based on these facts, Qian et al. developed a UTE sequence and applied it to ex vivo human tibial plateau cartilage specimens in a 3T scanner under the minimum TE of 0.5 ms (53). They demonstrated that multicomponent UTE mappings could probe the short T2 relaxations of the water molecules trapped in the collagen matrix. Most cartilage pixels were found to have mono- and/or bicomponent relaxations with short values of 1-6 ms and long values of about 22 ms across a wide range of component intensity (0-100%). The multi-component decay map has effectively indicated the decay types (e.g., mono-, bi-, tri-, and nonexponential) for each pixel in cartilage.
Cartilage T1 measurement using UTE images can be performed by acquiring images with varying TRs or FAs (31). However, achieving an accurate FA for tissues with short values is challenging due to inhomogeneities in the B1 field. In a feasibility study for T1 values in different knee joint tissues of healthy young volunteers in a 3T scanner, Ma et al. used a single exponential fitting model over different FAs by considering the actual FAs corrected by achievable B1 value over the cartilage volume (31). This so-called UTE actual flip angle-variable flip angle (UTE-AFI-VFA) method was able to measure the T1 value with B1 correction for all the major tissues in the knee with T2s greater than 1 ms, which included approximately all of the articular cartilage regions (Figure 7). A similar UTE method was later used by Cai et al. to measure the T1 values of human patellar cartilage layers; they reported significantly shorter T1 values for the deepest layer compared with other layers (28). Figure 8 demonstrates T1 measurements for different layers of a patellar cartilage sample including the superficial zone (SZ), middle zone (MZ), deep zone (DZ), and osteochondral junction (OCJ) region.
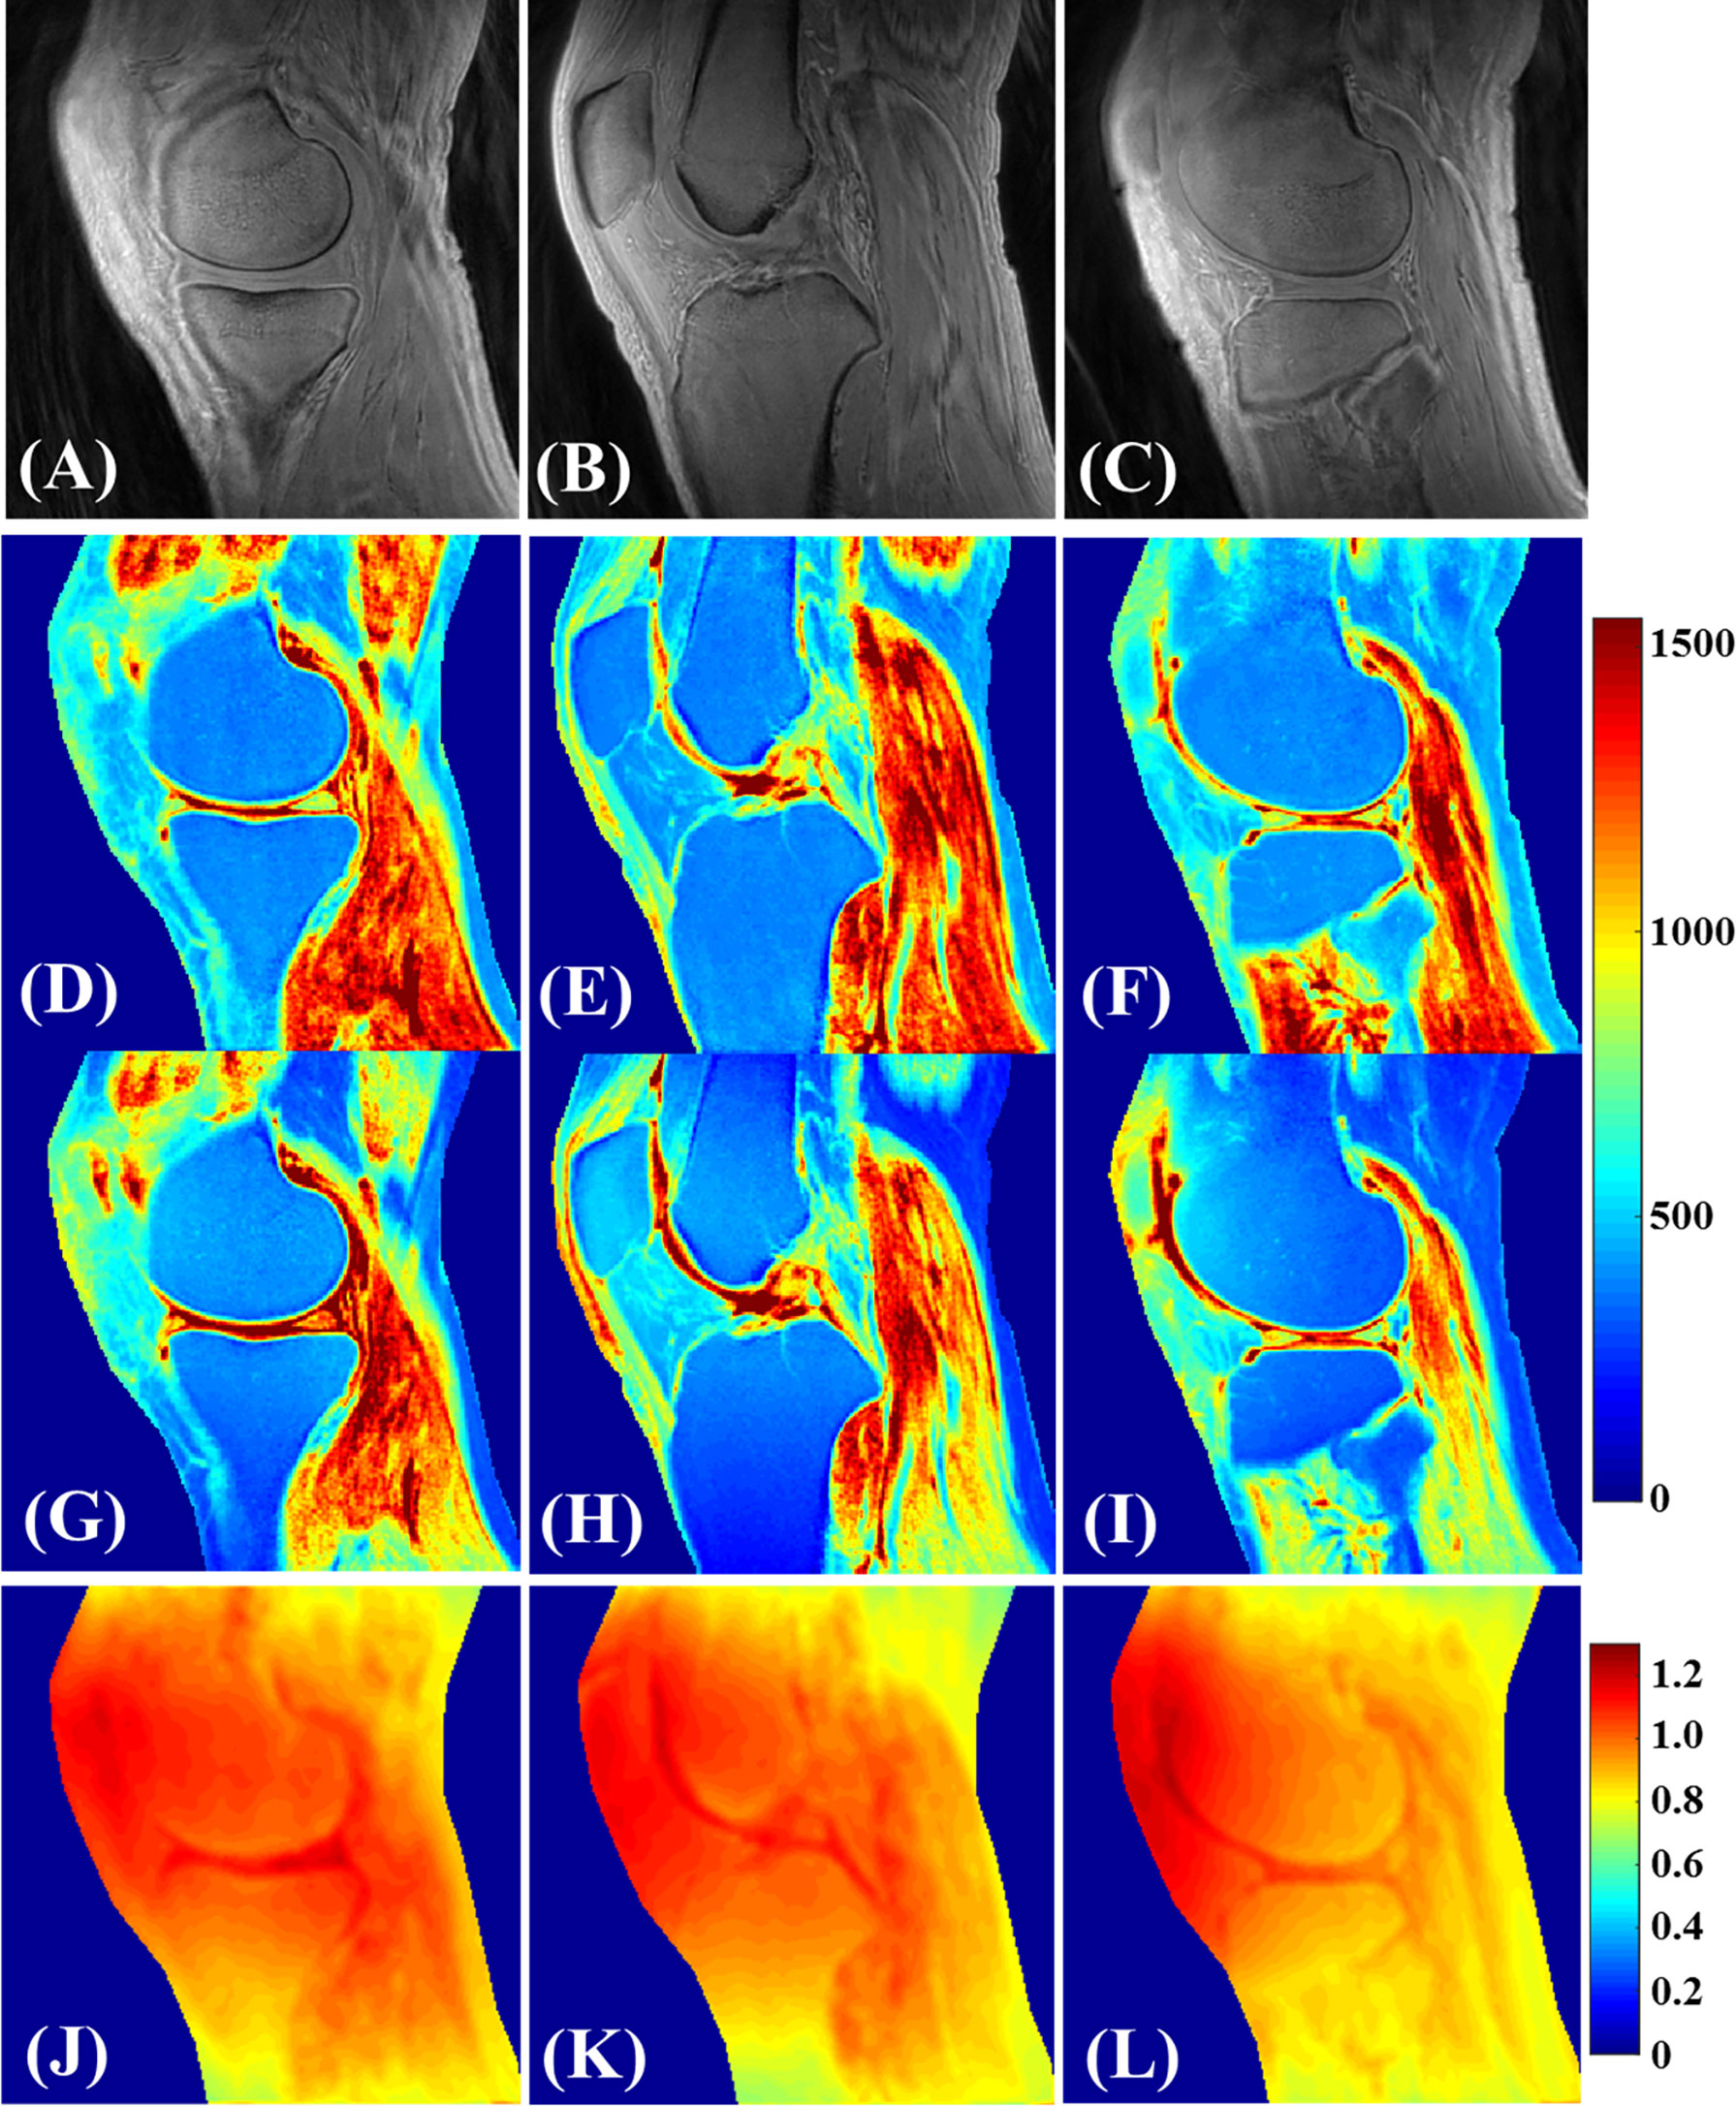
Figure 7 Knee tissues in a healthy 35-year-old male volunteer (A–L). (A–C) are the selected VFA images with FA=5°. T1 mapping utilizing both the proposed 3D UTE-Cones AFI-VFA (D–F) and B1-uncorrected VFA (G–I) methods are illustrated. The B1 maps generated by the AFI technique (J–L) are also depicted. T1 estimation errors as a result of B1 inhomogeneity in the images of (G–I) have been corrected by the proposed 3D UTE-Cones AFI-VFA technique, purticularly in areas close to the coil boundary. Modified, with permission from Ref (31).
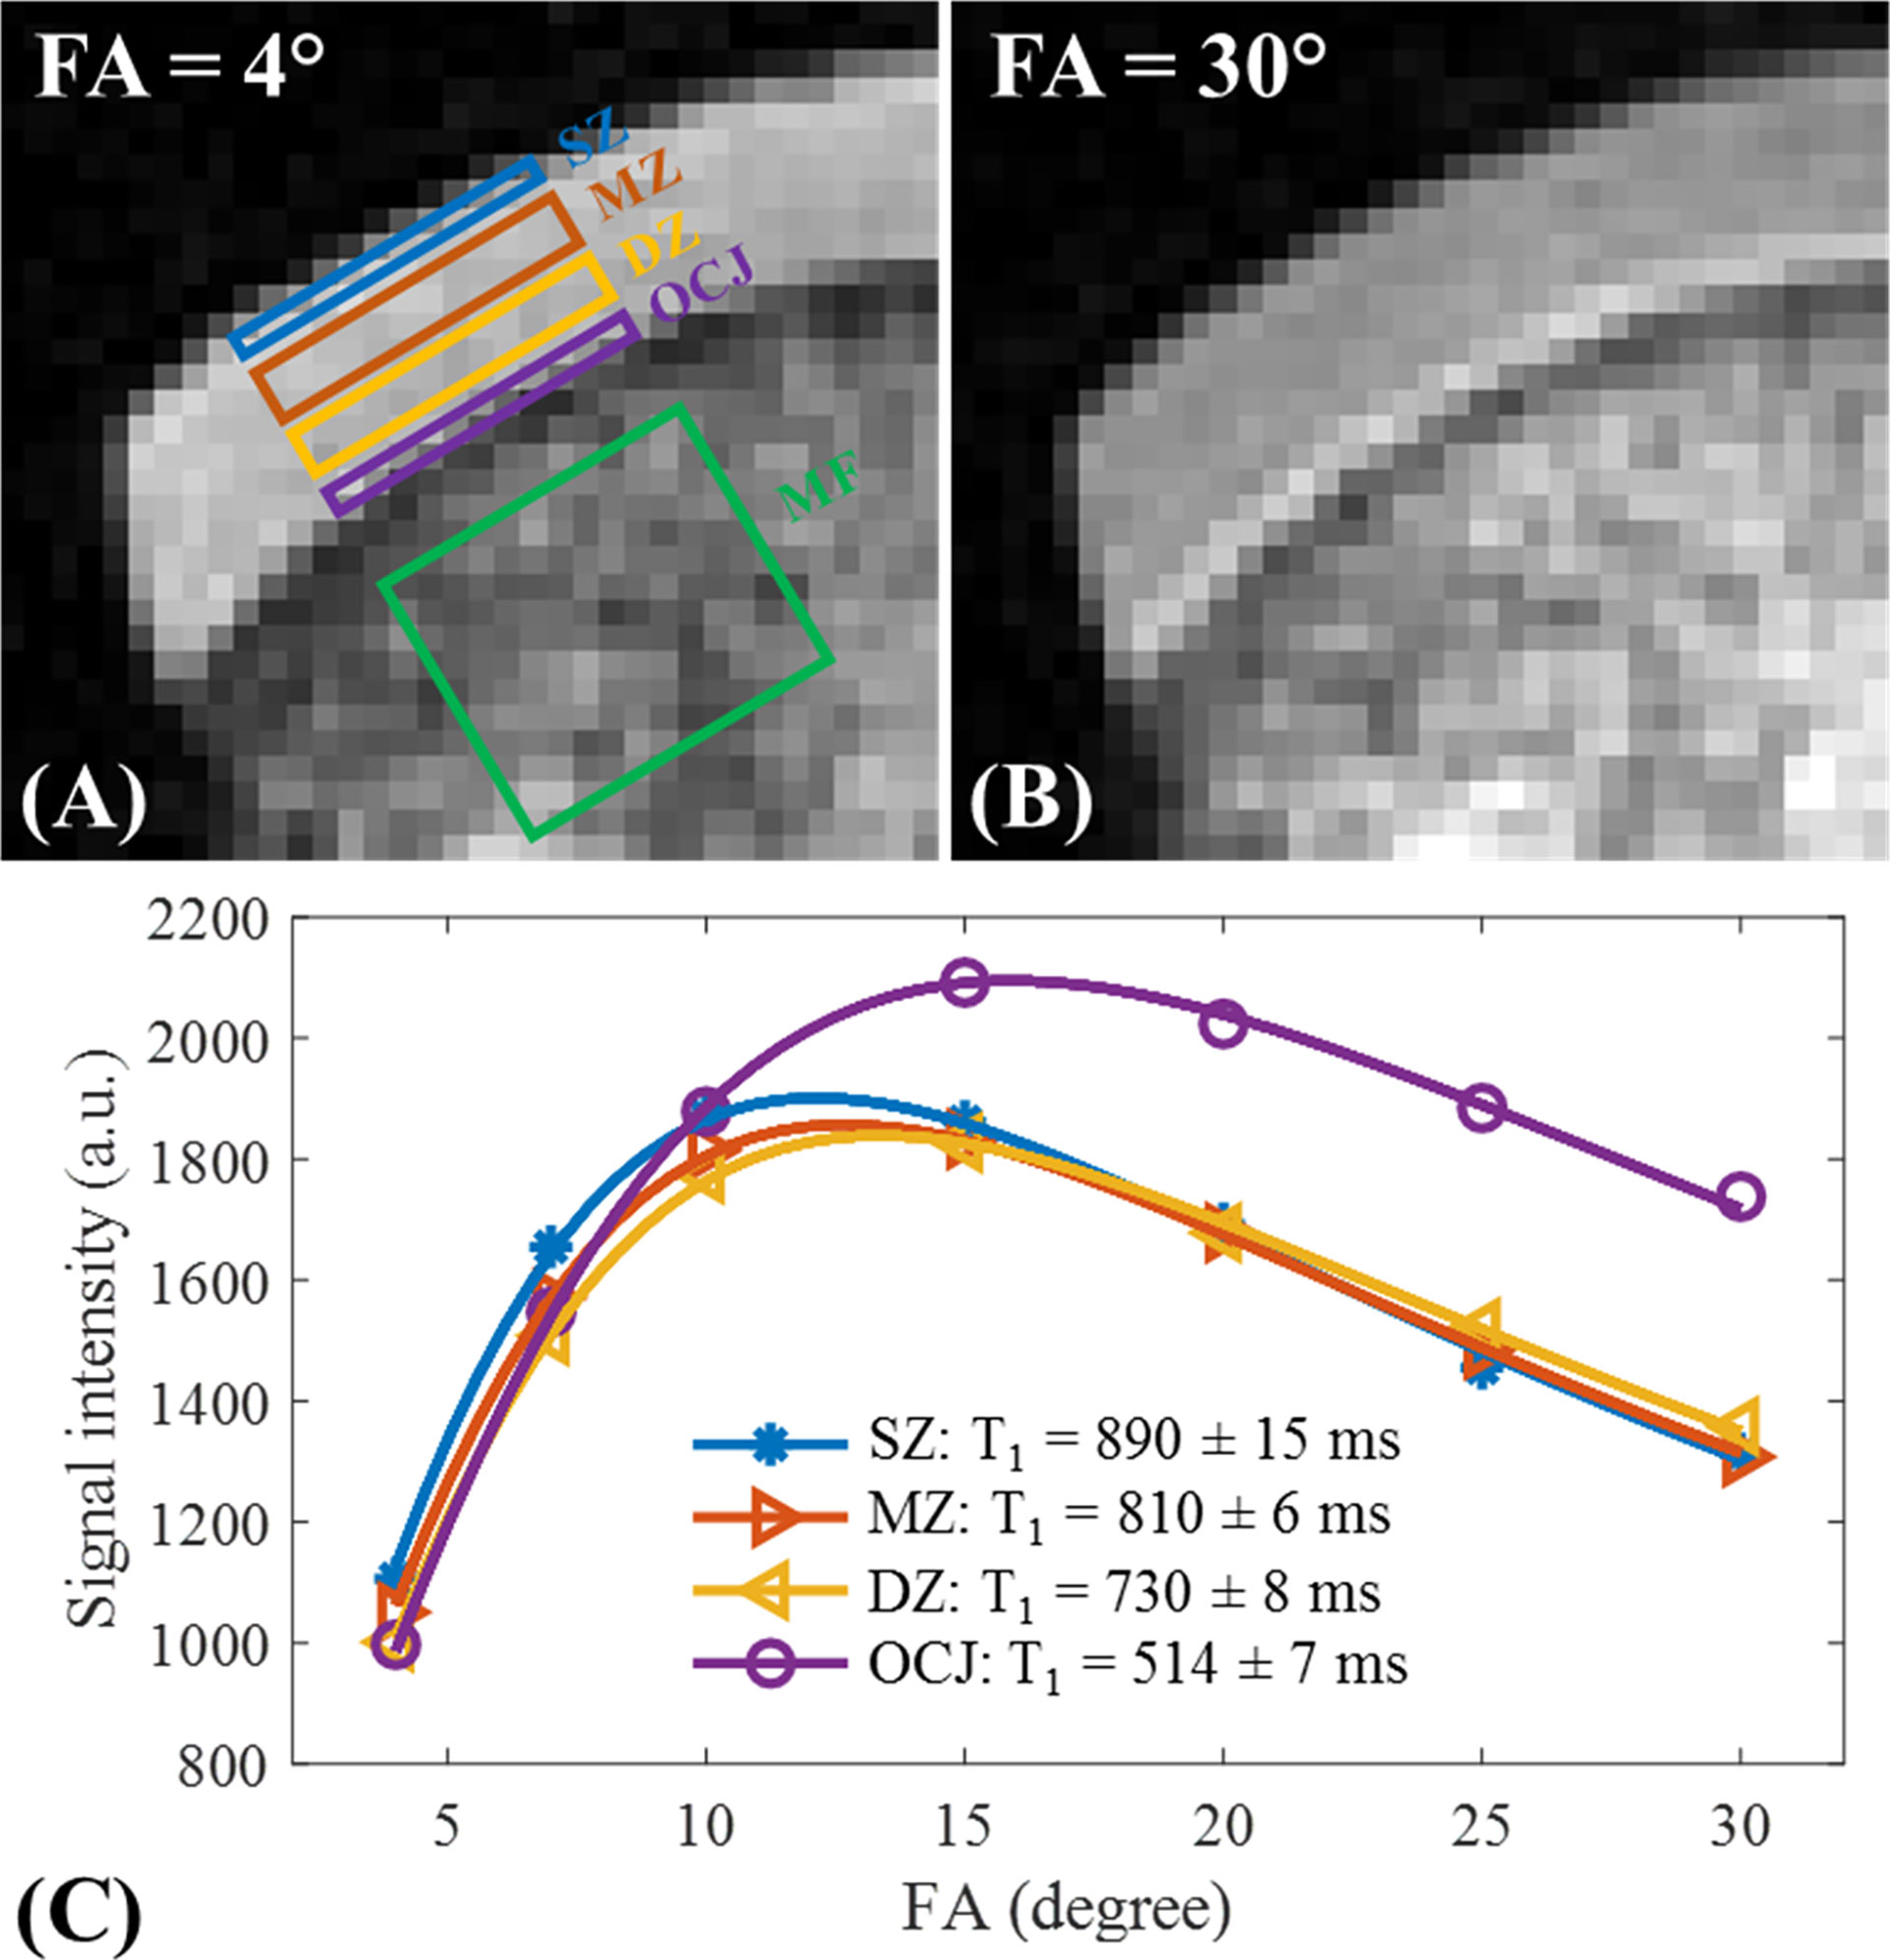
Figure 8 T1 measurements of a sample of patellar cartilage in the superficial zone (SZ), middle zone (MZ), deep zone (DZ), and OCJ region. The bone marrow fat (MF) section has also been labeled in (A) Images with respective flip angles of 4° and 30° are demonstrated in (A, B) In the image with the flip angle of 30°, a high signal intensity band can be seen in the OCJ region. Image (C) demonstrates the fitting curves and T1 values for the SZ, MZ, DZ, and OCJ. Gradual decrease of T1 values from SZ to OCJ is observed. Modified, with permission from Ref (28).
The UTE T1 measurement method described above has been utilized as an important input for UTE magnetization transfer (MT) modeling (34).
UTE MRI has been shown to be capable of visualizing the superficial and deep layers of articular cartilage. Deep layer cartilage and ZCC zones are of great interest to researchers because of their roles in the progression of OA; consequently, several inversion recovery (IR) preparation pulses have been proposed to be used in combination with UTE MRI for visualization and quantification of these clinically significant cartilage layers (12, 68). Figure 9 compares clinical images (PD‐weighted FSE in first column and T2‐weighted FSE in second column) with UTE images (IR prepared fat saturated UTE (IR-FS-UTE) in the third and fourth columns and FS-UTE in last column).
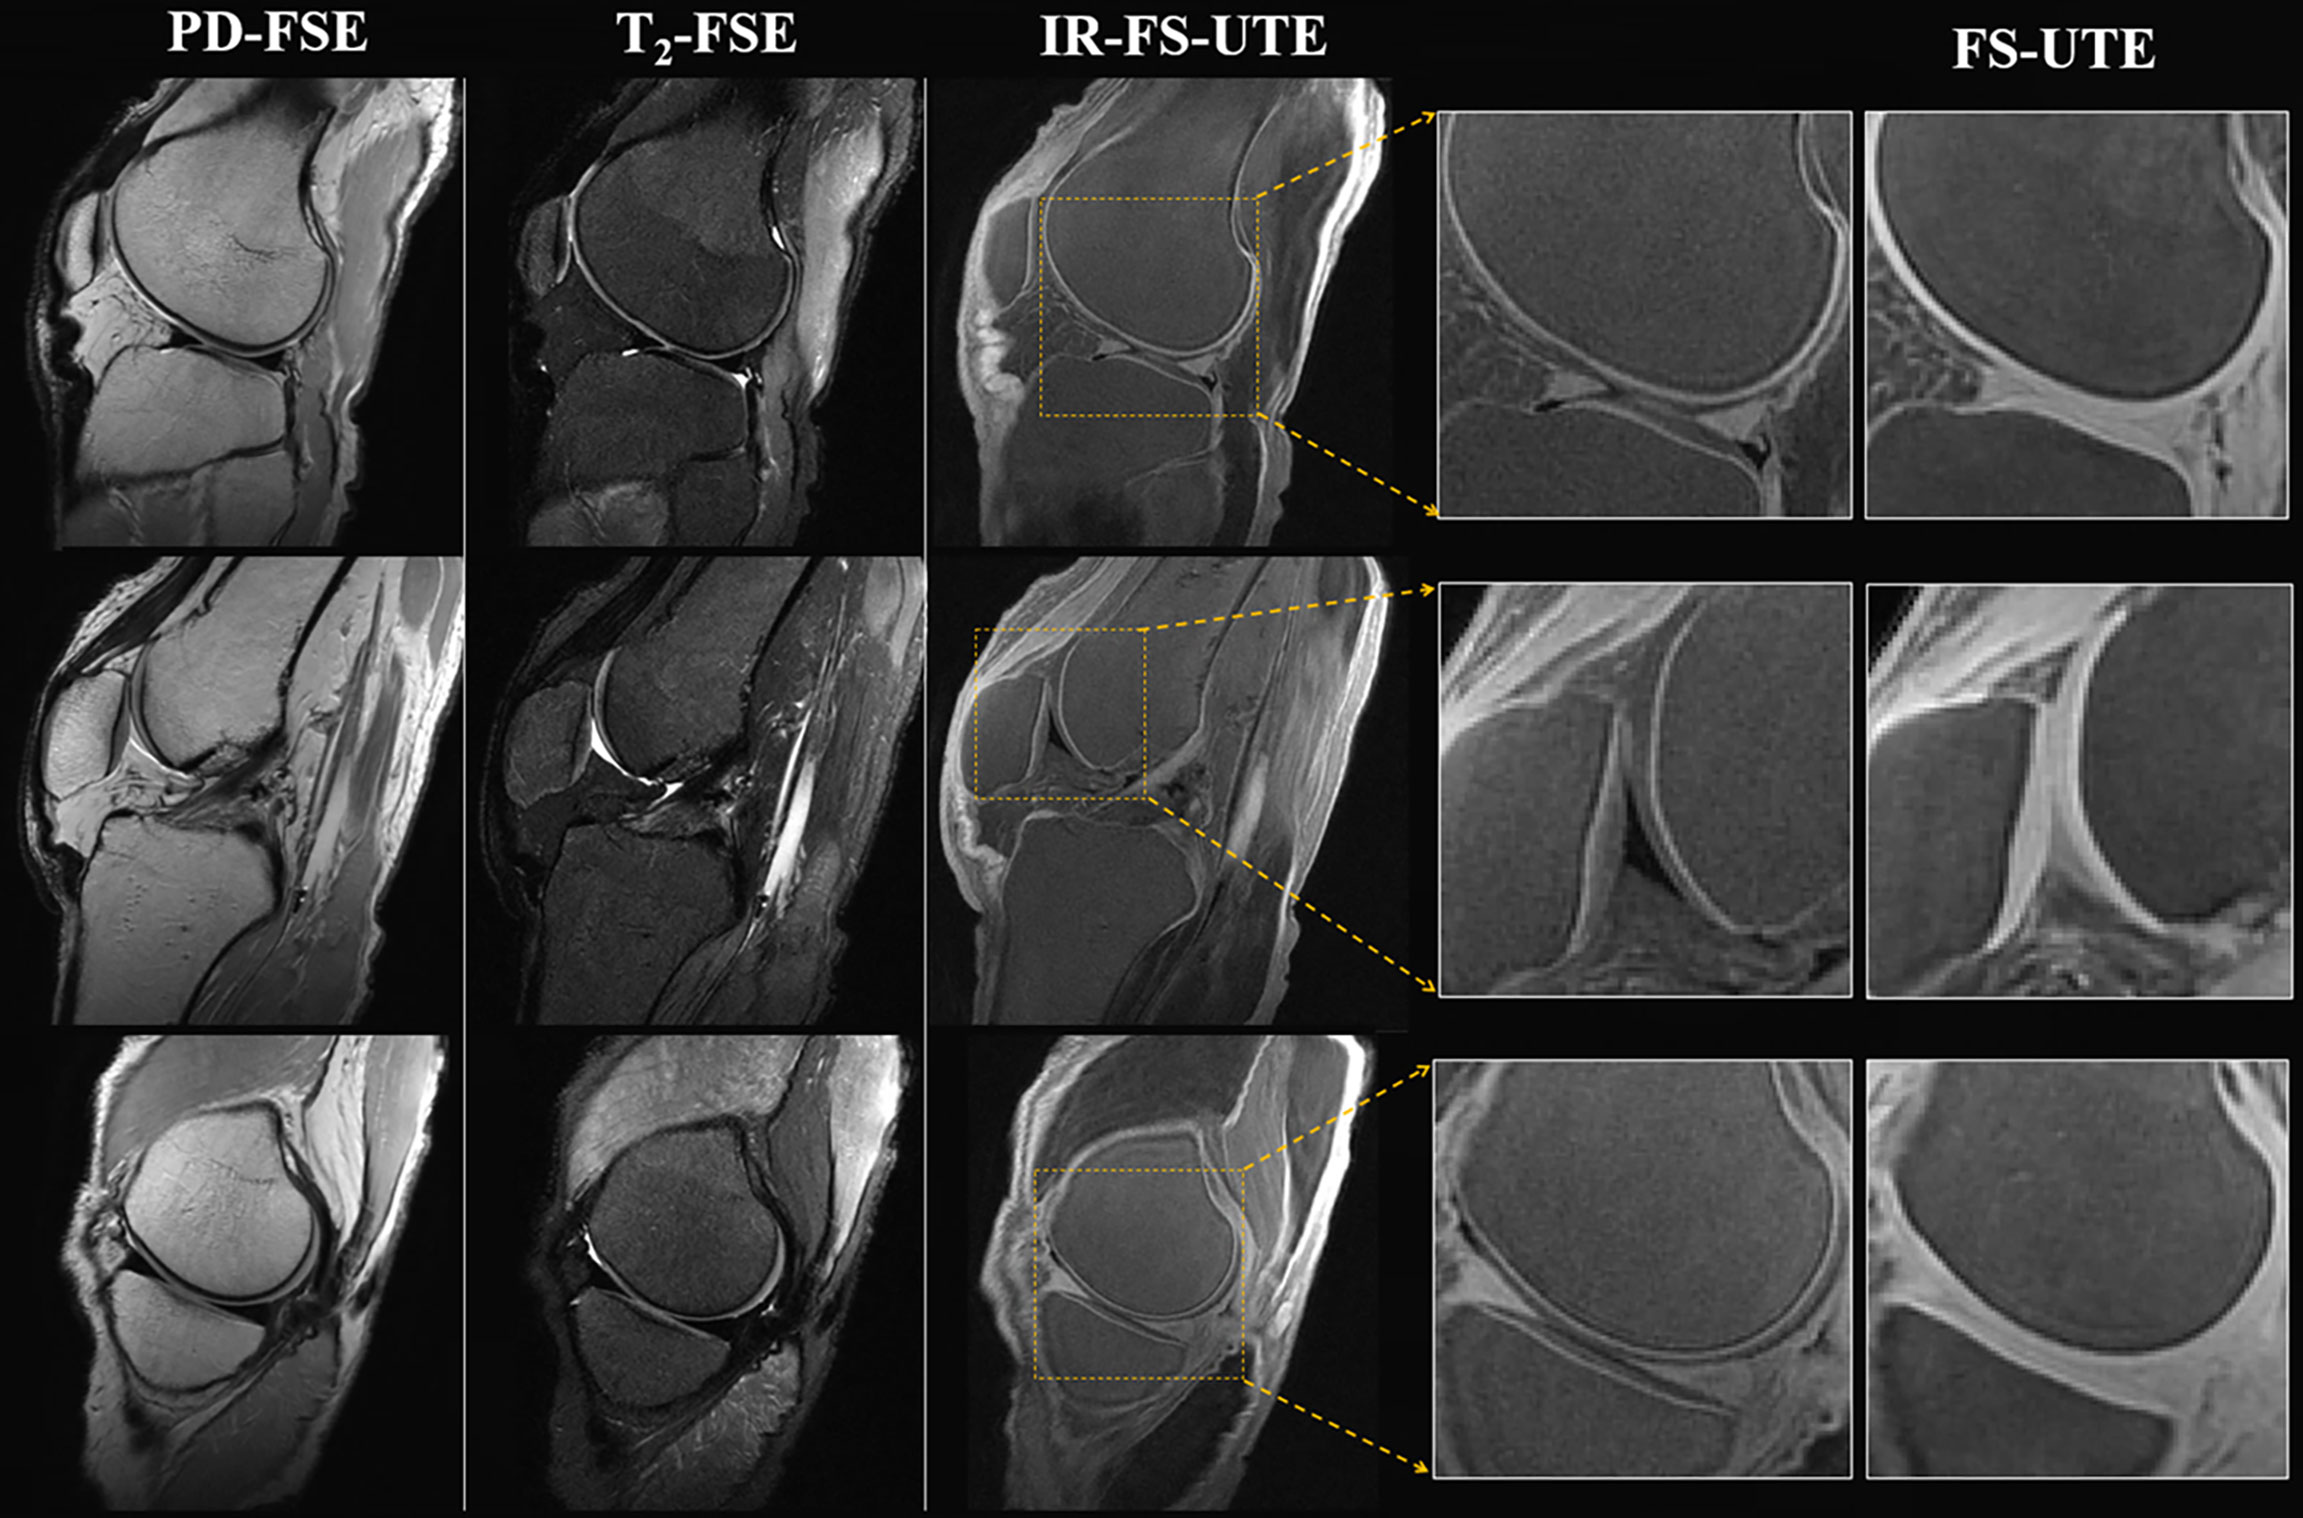
Figure 9 Image of the OCJ region in a normal ex vivo knee joint sample from a 31-year-old male donor. The clinical images (PD-weighted FSE in first column and T2-weighted FSE in second column) are employed to compare with the T1-weighted IR-UTE-Cones images (third column). High OCJ contrasts (i.e., bright band) are demonstrated in the IR-UTE-Cones images, which are more visible in the zoomed images. The last column consists of the conventional fat-saturated UTE-Cones images for the purpose of comparison. These demonstrate signal from both calcified and uncalcified cartilage. Modified, with permission from Ref (12).
In most IR-UTE techniques, an adiabatic full passage inversion pulse is used before the UTE acquisition to invert the longitudinal magnetization of water without incurring a B1 inhomogeneity penalty. Pure short T2 water pool imaging depends on the optimized inversion time (TI) which is required to let the inverted long T2 magnetization reach the nulling status. UTE MRI acquisition after the nulling point results in short T2 water visualization, which is dominant in the deep layer and ZCC of articular cartilage. Maximizing the short T2 signal while simultaneously avoiding long T2 signal contamination has been investigated by Ma et al. and Jang et al. (12, 68) who have optimized several sequence parameters such as TI.
Figure 10 shows the single- and bi-component analysis of IR-FS-UTE imaging of more superficial cartilage (blue box) and OCJ (red box) regions. As can be seen from these fitting curves, the bi-component model performs much better than the single-component model with regard to data fitting. The relaxations for both the short and long T2 components in the more superficial cartilage region are longer than those in the OCJ region. Higher short T2 fraction is also found in the OCJ region. These results demonstrate that the collagen matrix is more densely distributed or there is more calcification existed in the OCJ region.

Figure 10 Single- and bi-component analysis of IR-FS-UTE imaging of more superficial cartilage (blue region) and OCJ (red region in A) regions. The bi-component model performs much better than the single-component model in data fitting (B, C). For the more superficial cartilage region, the values of short and long T2 components as well as the short T2 fraction were 0.55 ms, 18.0 ms, and 11.0%, respectively (B). For the deeper cartilage region, the values of the short and long T2 components as well as the short T2 fraction were 0.38 ms, 6.5 ms, and 27.0%, respectively (C).
For deep cartilage and ZCC cartilage layer assessment, dual adiabatic IR-UTE (Dual-IR-UTE) has also been developed as a method that avoids fat signal contamination that may not be nulled by just a single adiabatic IR pulse (13, 14). Dual-IR-UTE is designed to employ two adiabatic IR pulses that invert and suppress long T2 water and fat magnetizations at their respective frequencies.
By utilizing Dual-IR-UTE images at differing TEs, Dual-IR-UTE images with differing TRs, and spin locking-prepared Dual-IR-UTE acquisitions, the ZCC were able to be visualized and quantified (i.e., , T1, and T1ρ) (13).
The application of off-resonance saturation (ORS) pulses has been suggested by Du et al. (69) and Carl et al. (70) as a way to optimize the UTE MRI contrast of short T2 tissues such as deep layer cartilage. Because the ORS pulse application selectively reduces the short T2 signals of the surrounding tissues and fluids, subtracting the UTE images with and without applying ORS facilitated selective positive short T2 enhancement, which was a result of the ORS saturation. These studies demonstrated that ORS UTE could efficiently suppress long T2 while highlighting short T2 signals. It should be noted that the contrast can be improved by increasing the ORS pulse power while decreasing the ORS frequency difference from the water peak.
Using higher power levels, the saturation induced by the ORS pulse can be applied to proton pools with extremely short T2 values, as is the case in macromolecules such as collagen. The saturation induced in the macromolecular proton pool, for instance, would then be transferred to the surrounding water proton pools, including bound and free water pools. The magnetization transfer phenomenon can be employed in UTE-MT imaging for macromolecular pool quantifications with respect to the water pool. UTE-MT ratio (UTE-MTR) is defined as (unsaturated - saturated)/unsaturated. UTE-MTR values have been compared to and T2 mapping values in a study by Yang et al. on 20 degenerative anterolateral condyles of total knee arthroplasty specimens on a 3T scanner (19). This study observed strong correlations between Mankin histological scores (which were used as an indication of the cartilage degeneration level) with the resultant UTE-MTR.
In an ex vivo study, Shao et al. investigated the diagnostic efficacy of multiparametric quantitative UTE MRI for knee cartilage degeneration detection (71). They obtained 20 anterolateral femoral condyle specimens from total knee arthroplasty patients and scanned them on a 3T scanner using UTE-MT, UTE-AdiabT1ρ, UTE-, and CubeQuant-T2 sequences. They also classified cartilage degeneration according to polarized light microscopy (PLM) collagen organization score and OA Research Society International grade. The study demonstrated the strongest correlation amongst all the investigated biomarkers between UTE-MTR and both abovementioned cartilage degeneration classifications. The receiver operating characteristic (ROC) analysis revealed that UTE-MTR also possessed a higher diagnostic efficacy for mild cartilage degeneration than the other biomarkers.
As previously mentioned, Hananouchi et al. (52) demonstrated a positive correlation between the mechanical properties of human patellar cartilage such as stiffness/elastic modulus and MR properties such as UTE-MTR by using an indentation device.
Because MTR values are functions of the MT pulse power level and the frequency offset, MTR is difficult to reproduce between studies. UTE-MT modeling has therefore been proposed to provide multiple parameters, including macromolecular fraction (MMF), macromolecular relaxation time (T2mm), and exchange rates, while preserving much higher levels of reproducibility (18, 72). Figures 11, 12 show the MT modeling fitting curve and parameter maps, respectively, of cartilage from a representative knee joint sample. Recent studies also demonstrate that UTE-MT modeling is nearly insensitive to the magic angle effect (73, 74), supporting its potential for effective detection of cartilage degeneration.
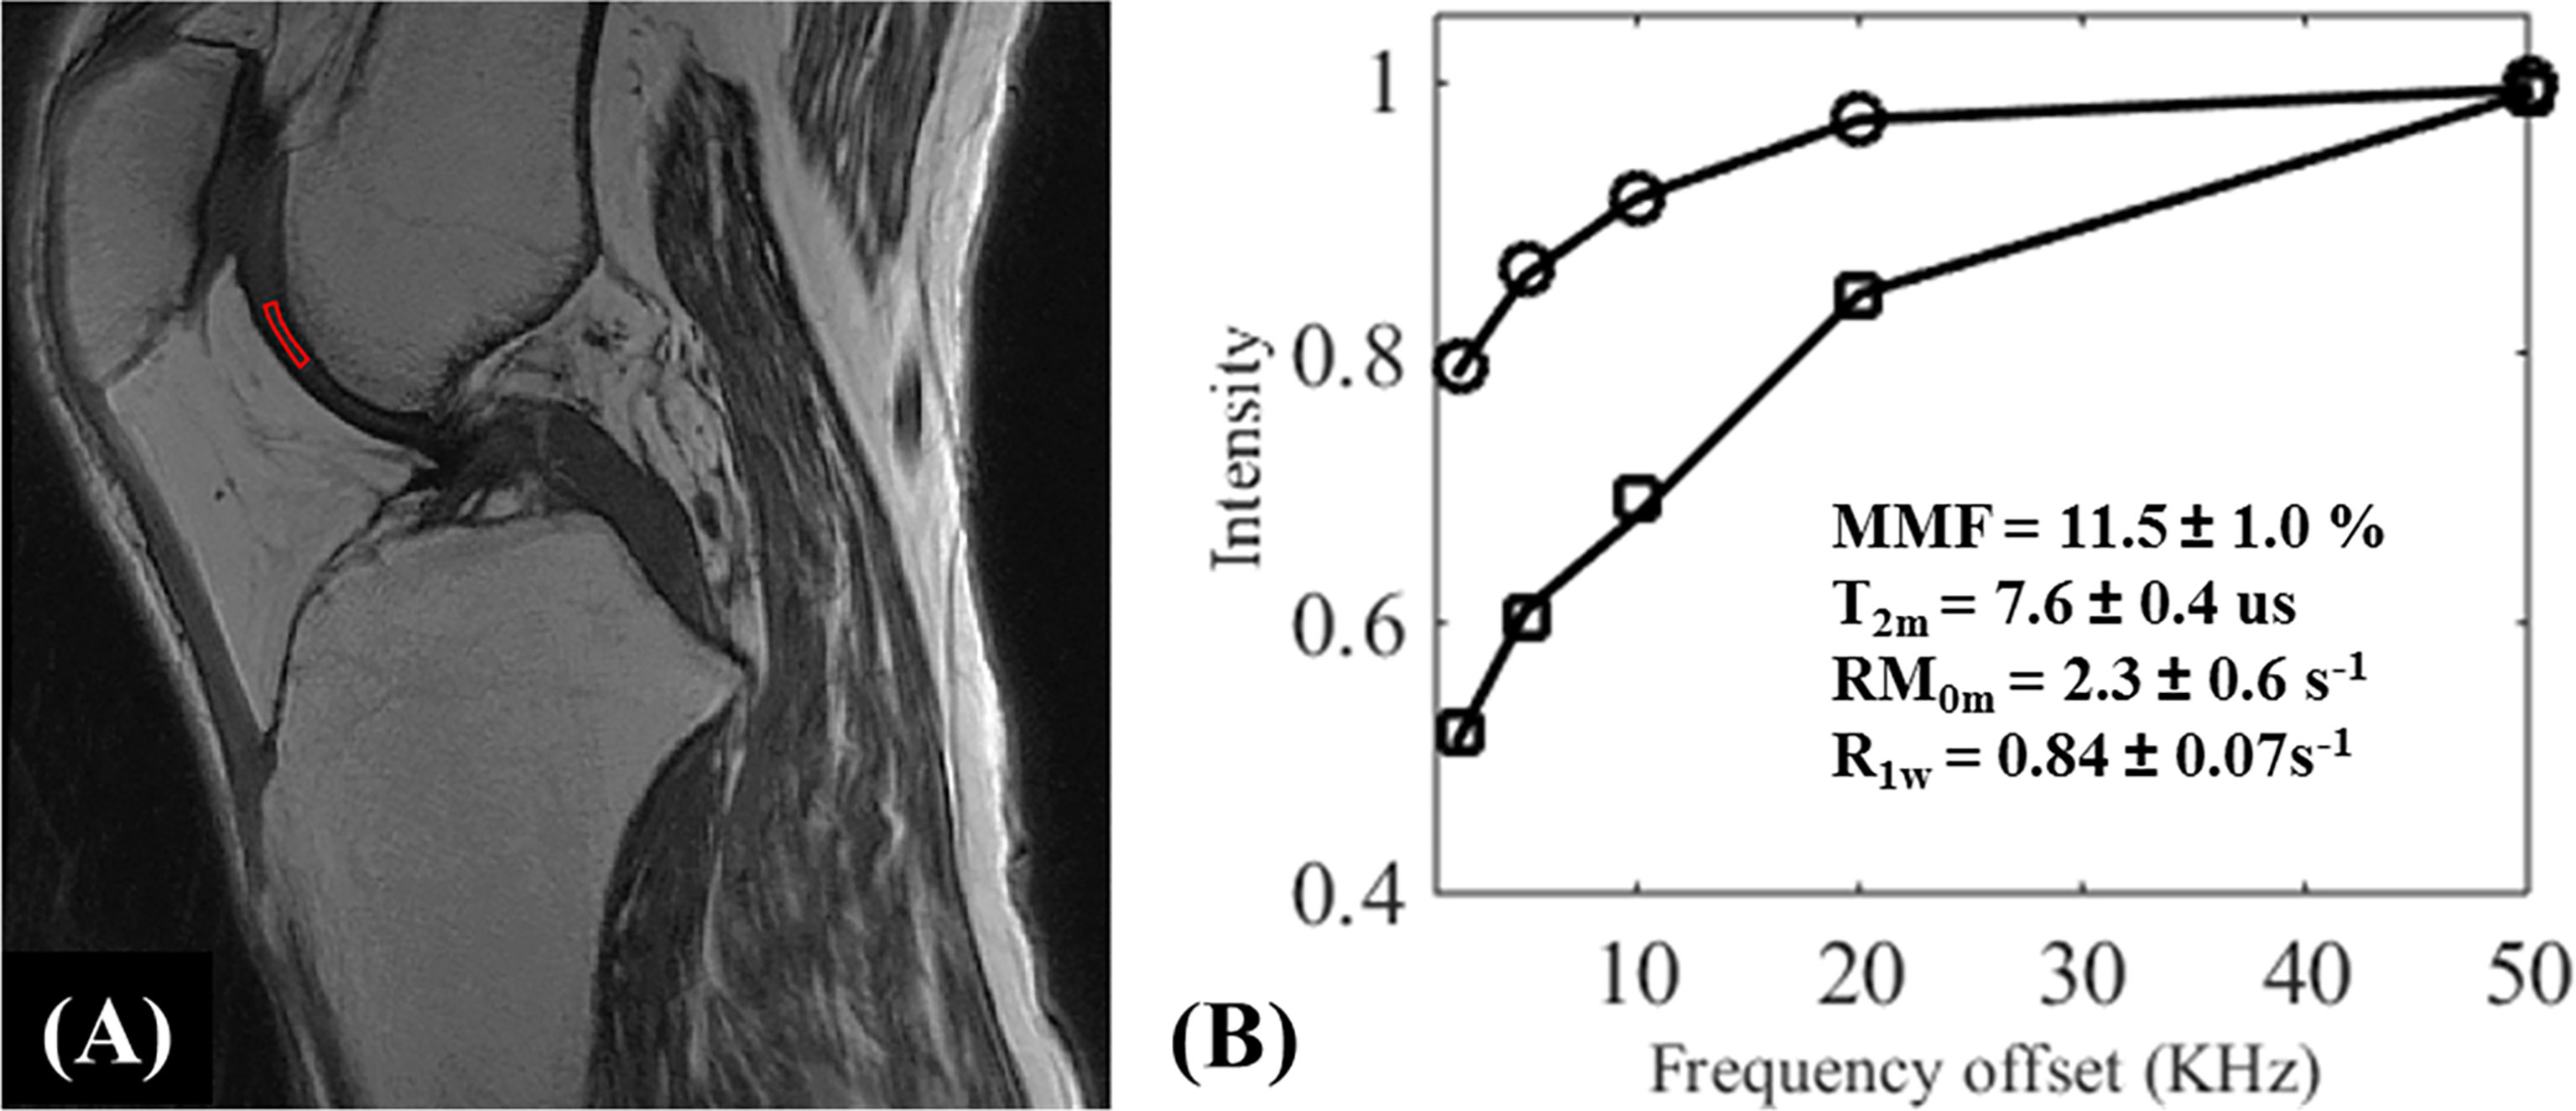
Figure 11 UTE-MT modeling (fitting) of knee cartilage. The UTE‐Cones‐MT (A) images were acquired from an ex vivo knee joint specimen with two different MT flip angles of 500° and 1500° at five different frequency offsets of 2, 5, 10, 20, and 50 KHz, and a region of interest (ROI) in the femoral condyle cartilage was selected for MT modeling. Image (B) illustrates the fitting curve and corresponding fitted parameters [i.e., MMF (%), T2m (us), RM0m (s-1), and R1w (s-1)]. MMF = macromolecular fraction; T2m = T2 relaxation time of macromolecular pool; R1w = spin-lattice relaxation rate of water pool; RM0m = proton exchange rate from water to macromolecular pool.
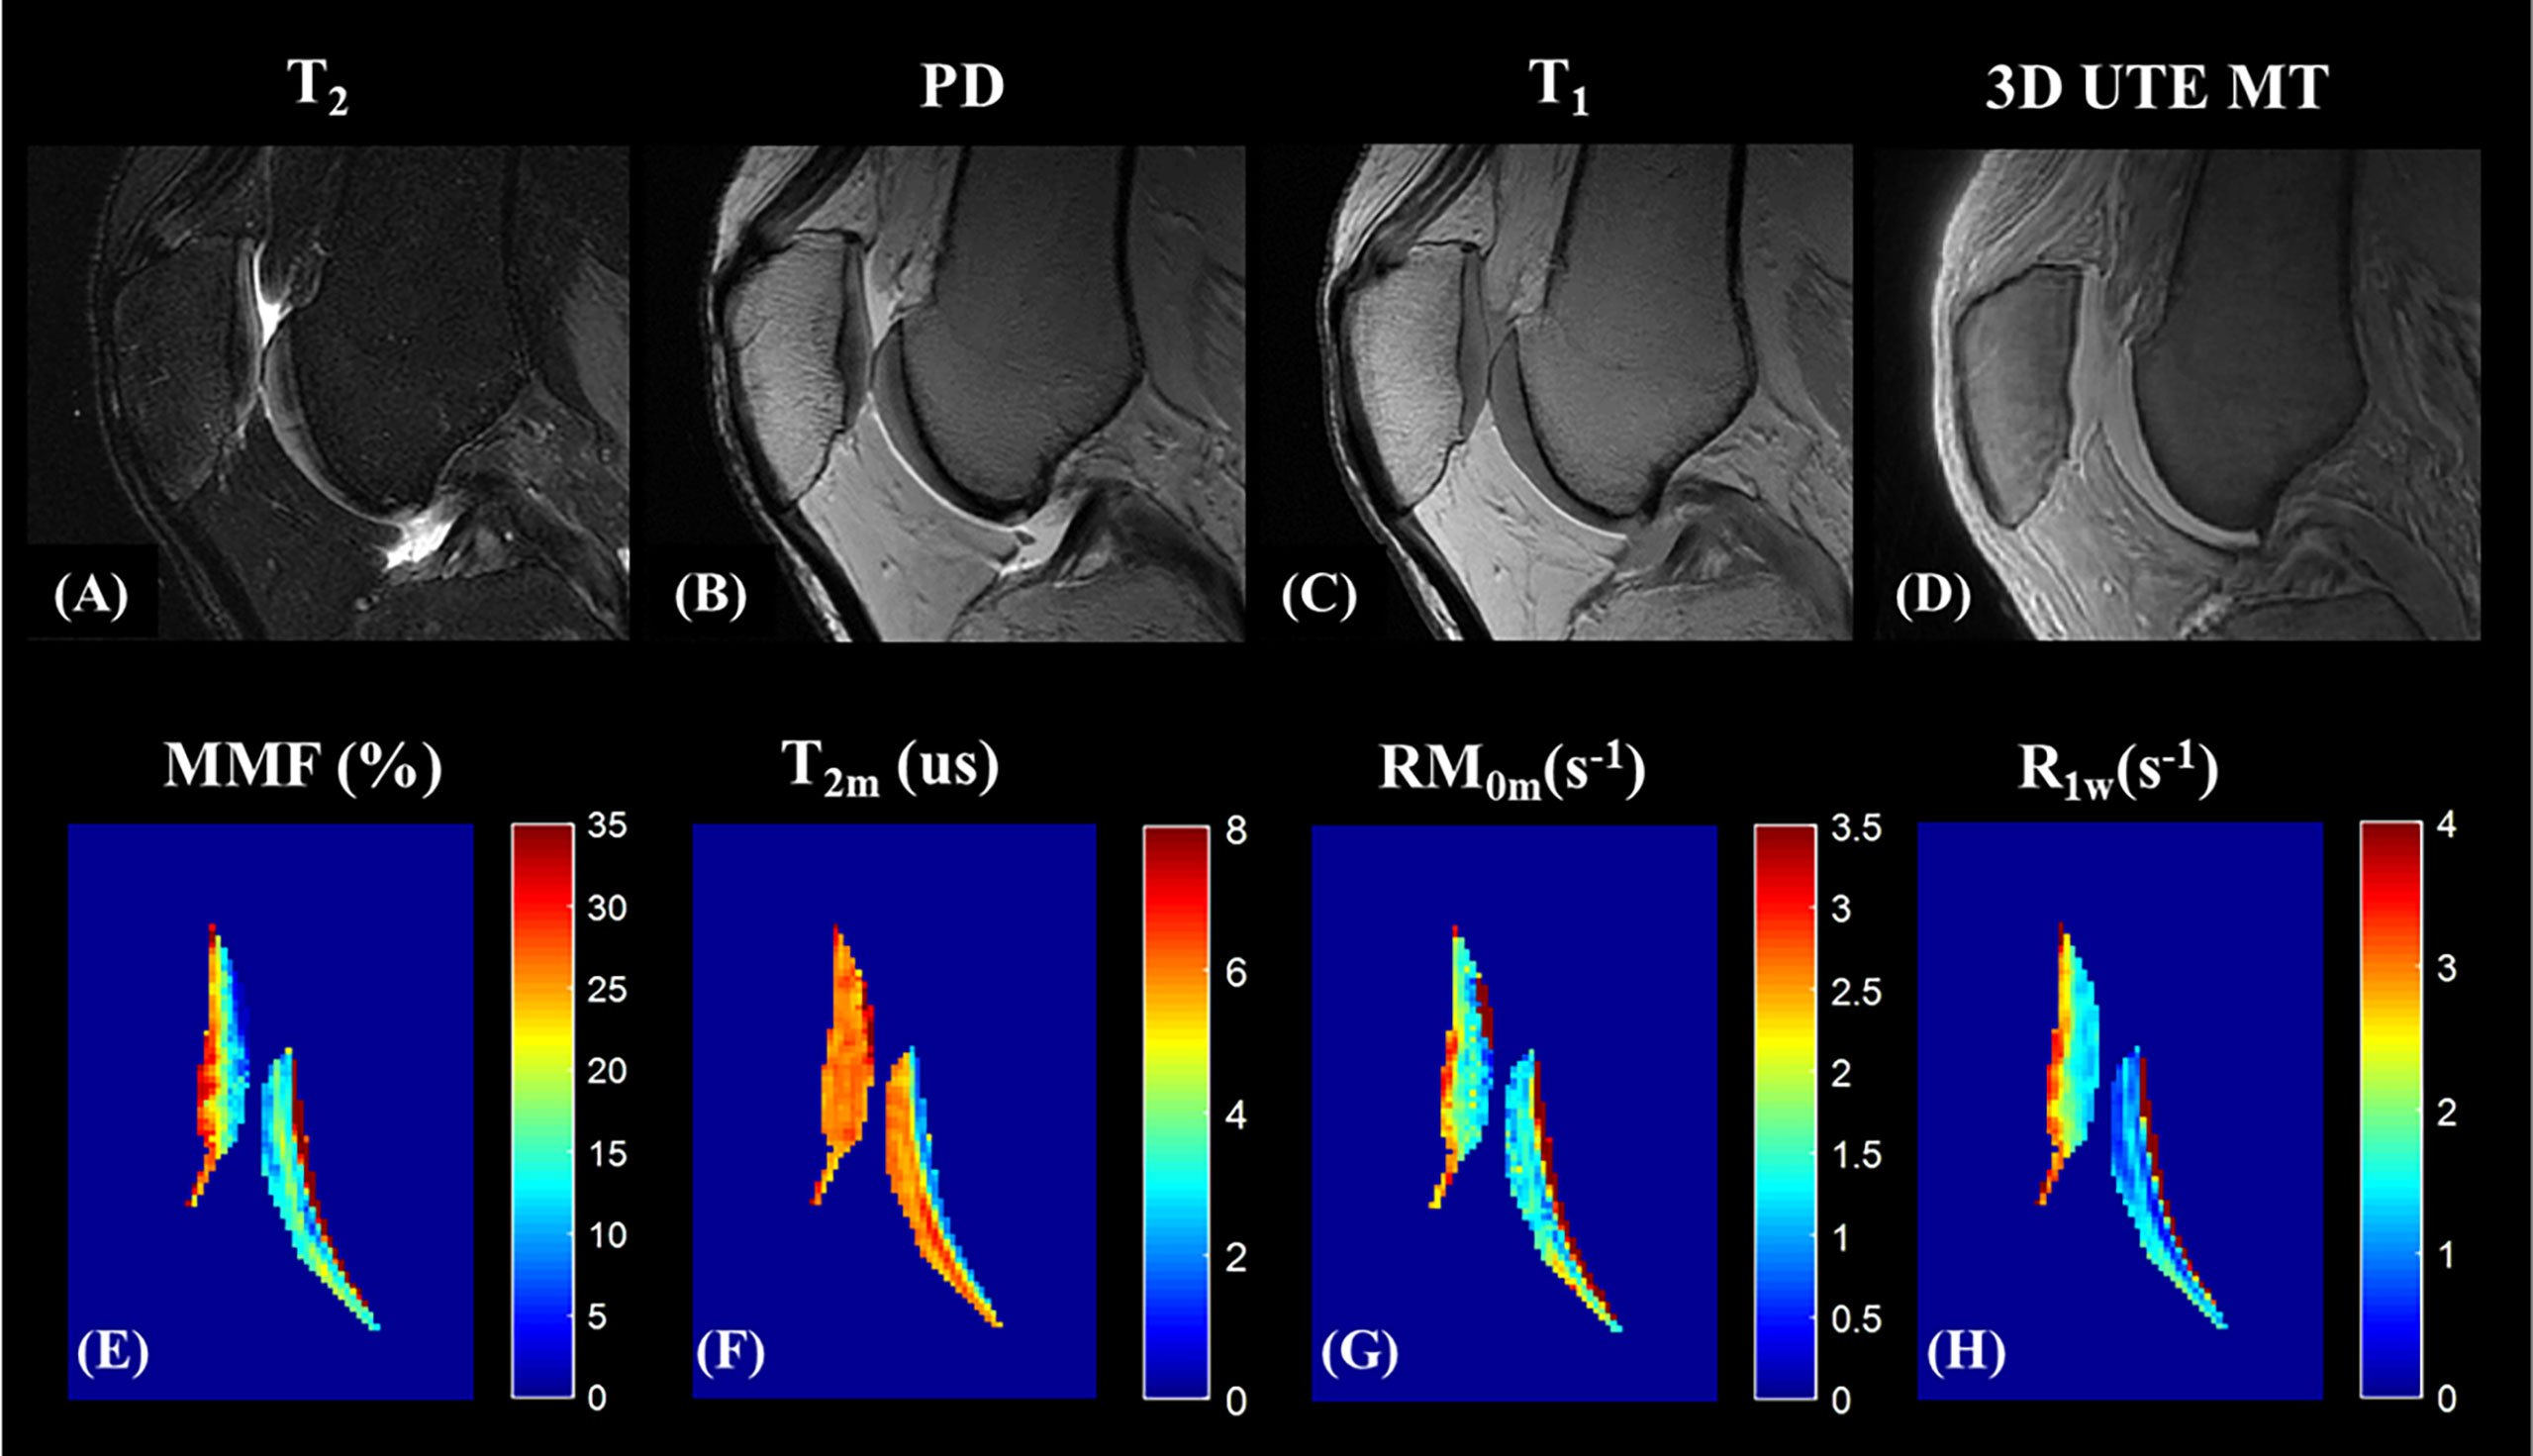
Figure 12 UTE-MT modeling (mapping) of knee cartilage. Panels (A–D) show the representative ex vivo knee MR images acquired from clinical sequences (A–C) and 3D UTE -MT (MT flip angle of 500° and frequency offset of 50 KHz) (D). Color mapping of UTE-MT modeling parameters, including MMF (%) (E), T2 relaxation time of the macromolecular pool (T2m, us) (F), proton exchange rate from water to macromolecular pool (RM0m, s-1) (G), and spin-lattice relaxation rate of the water pool (R1w,s-1) (H) are demonstrated.
Jerban et al. assessed UTE-MT variation under mechanical loading in the tibiofemoral cartilage of cadaveric knee joints and calculated MMF from UTE-MT modeling (58). To assess MRI data differences between loading conditions, they applied Wilcoxon rank sum test. For young specimens and with load increases, MMF increased in all grouped regions of interest (ROIs) of the tibial articular cartilage, femoral articular cartilage, and articular cartilage regions that were both covered and uncovered by meniscus. MMF increases were significant for articular cartilage regions covered by meniscus. After unloading, MMF decreased in all studied regions, but only reaching significant levels of difference for the articular cartilage regions covered by meniscus. For elderly specimens, they did not observe significant changes in MRI parameters by loading or unloading. This study of different patterns of MMF variations in the joints of young and elderly samples demonstrates the capability of UTE-MT modeling combined with knee loading in differentiating between normal and abnormal knee joints.
In a prospective study, Xue et al. investigated the feasibility of MMF to differentiate normal and degenerated knee cartilage (20). They employed a 3D UTE-MT sequence on 62 volunteers with and without osteoarthritis at 3T. A two-pool MT model was applied to evaluate the MMF difference between cartilage in normal and abnormal knees as categorized by both Kellgren-Lawrence (KL) grades and Whole-Organ Magnetic Resonance Imaging Scores (WORMS). Reporting significant negative correlations of MMF with KL grade and WORMS, this study is yet another indication of the MMF potential to detect early OA.
Namiranian et al. investigated the correlations of MTR, MMF, and T2mm with the mechanical properties of articular cartilage, namely cartilage stiffness and Hayes elastic modulus, scanned on a 3T scanner (34). Correlations were assessed in the superficial layer, deep layer, and global (combining both the superficial and deep layers) cartilage ROIs. Higher correlations of mechanical properties were found with MMF and MTR at the superficial layer compared with either the deep layer or the global ROI, likely because the indentation tests measure the surface mechanical properties.
T1ρ relaxation occurs after the application of a long-duration on-resonance RF pulse in order to “spin-lock” the magnetization vector into a rotated frame (75). T1ρ relaxation time is always higher than T2 relaxation time. The T1ρ biomarker has been hypothesized to be sensitive to slow-motion interactions between protons of constrained water molecules and those of associated macromolecules in the extracellular matrix of musculoskeletal tissues, such as proteoglycans (PG) in articular cartilage (75). The conventional T1ρ cannot be used for all cartilage zones, particularly the ZCC, due to the lack of signal in tissue with short T2 values. However, UTE-T1ρ techniques, either with continuous wave (CW) spin-locking (CW-UTE-T1ρ) or with adiabatic spin-locking (UTE-AdiabT1ρ), have been developed to quantify the T1ρ of short and long T2 tissues (17).
Ma et al. has developed a novel UTE-AdiabT1ρ sequence that uses an adiabatic spin-lock pulse train followed by UTE data acquisition (17). They have achieved robust in vivo and ex vivo volumetric measurements of T1ρ in both short and long T2 tissues of the knee joint, including patellar cartilage. Figures 13, 14 show the representative UTE-AdiabT1ρ fitting curve and parameter maps, respectively, for in vivo knee joint cartilage.
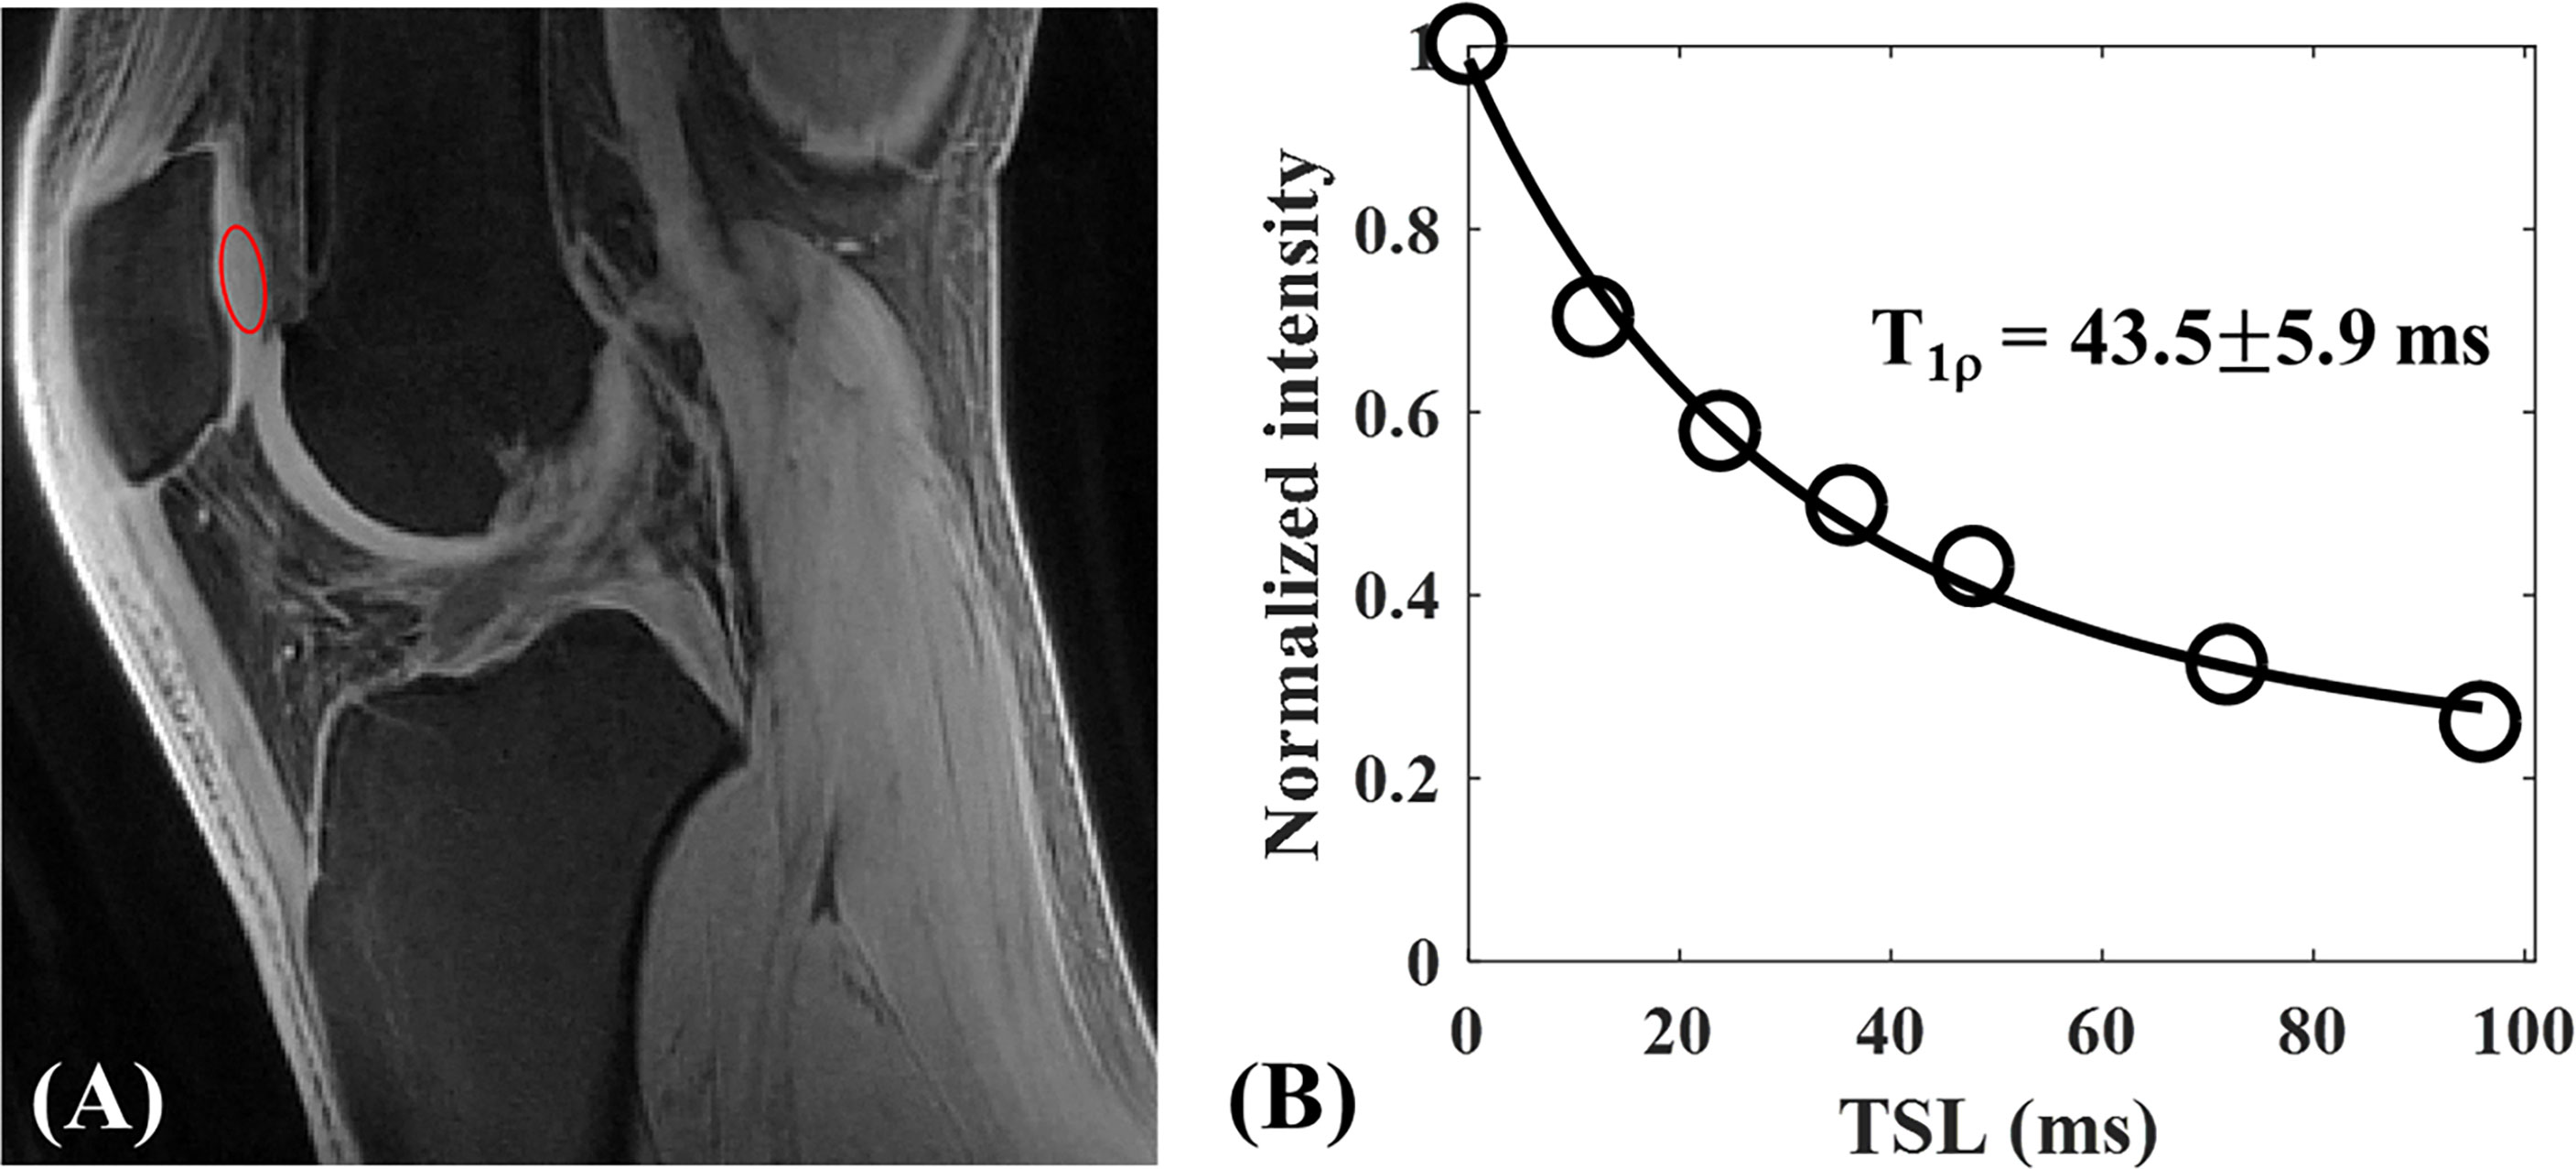
Figure 13 3D UTE-AdiabT1ρ Cones imaging of an in vivo knee from a 23-year-old healthy male volunteer. Representative AdiabT1ρ image (A) with region of interest (ROI) (red circle) and corresponding fitting curve (B) of patellar cartilage are demonstrated. The T1ρ value of patellar cartilage was obtained with 43.5 ± 5.9 ms. Modified, with permission from Ref (17).
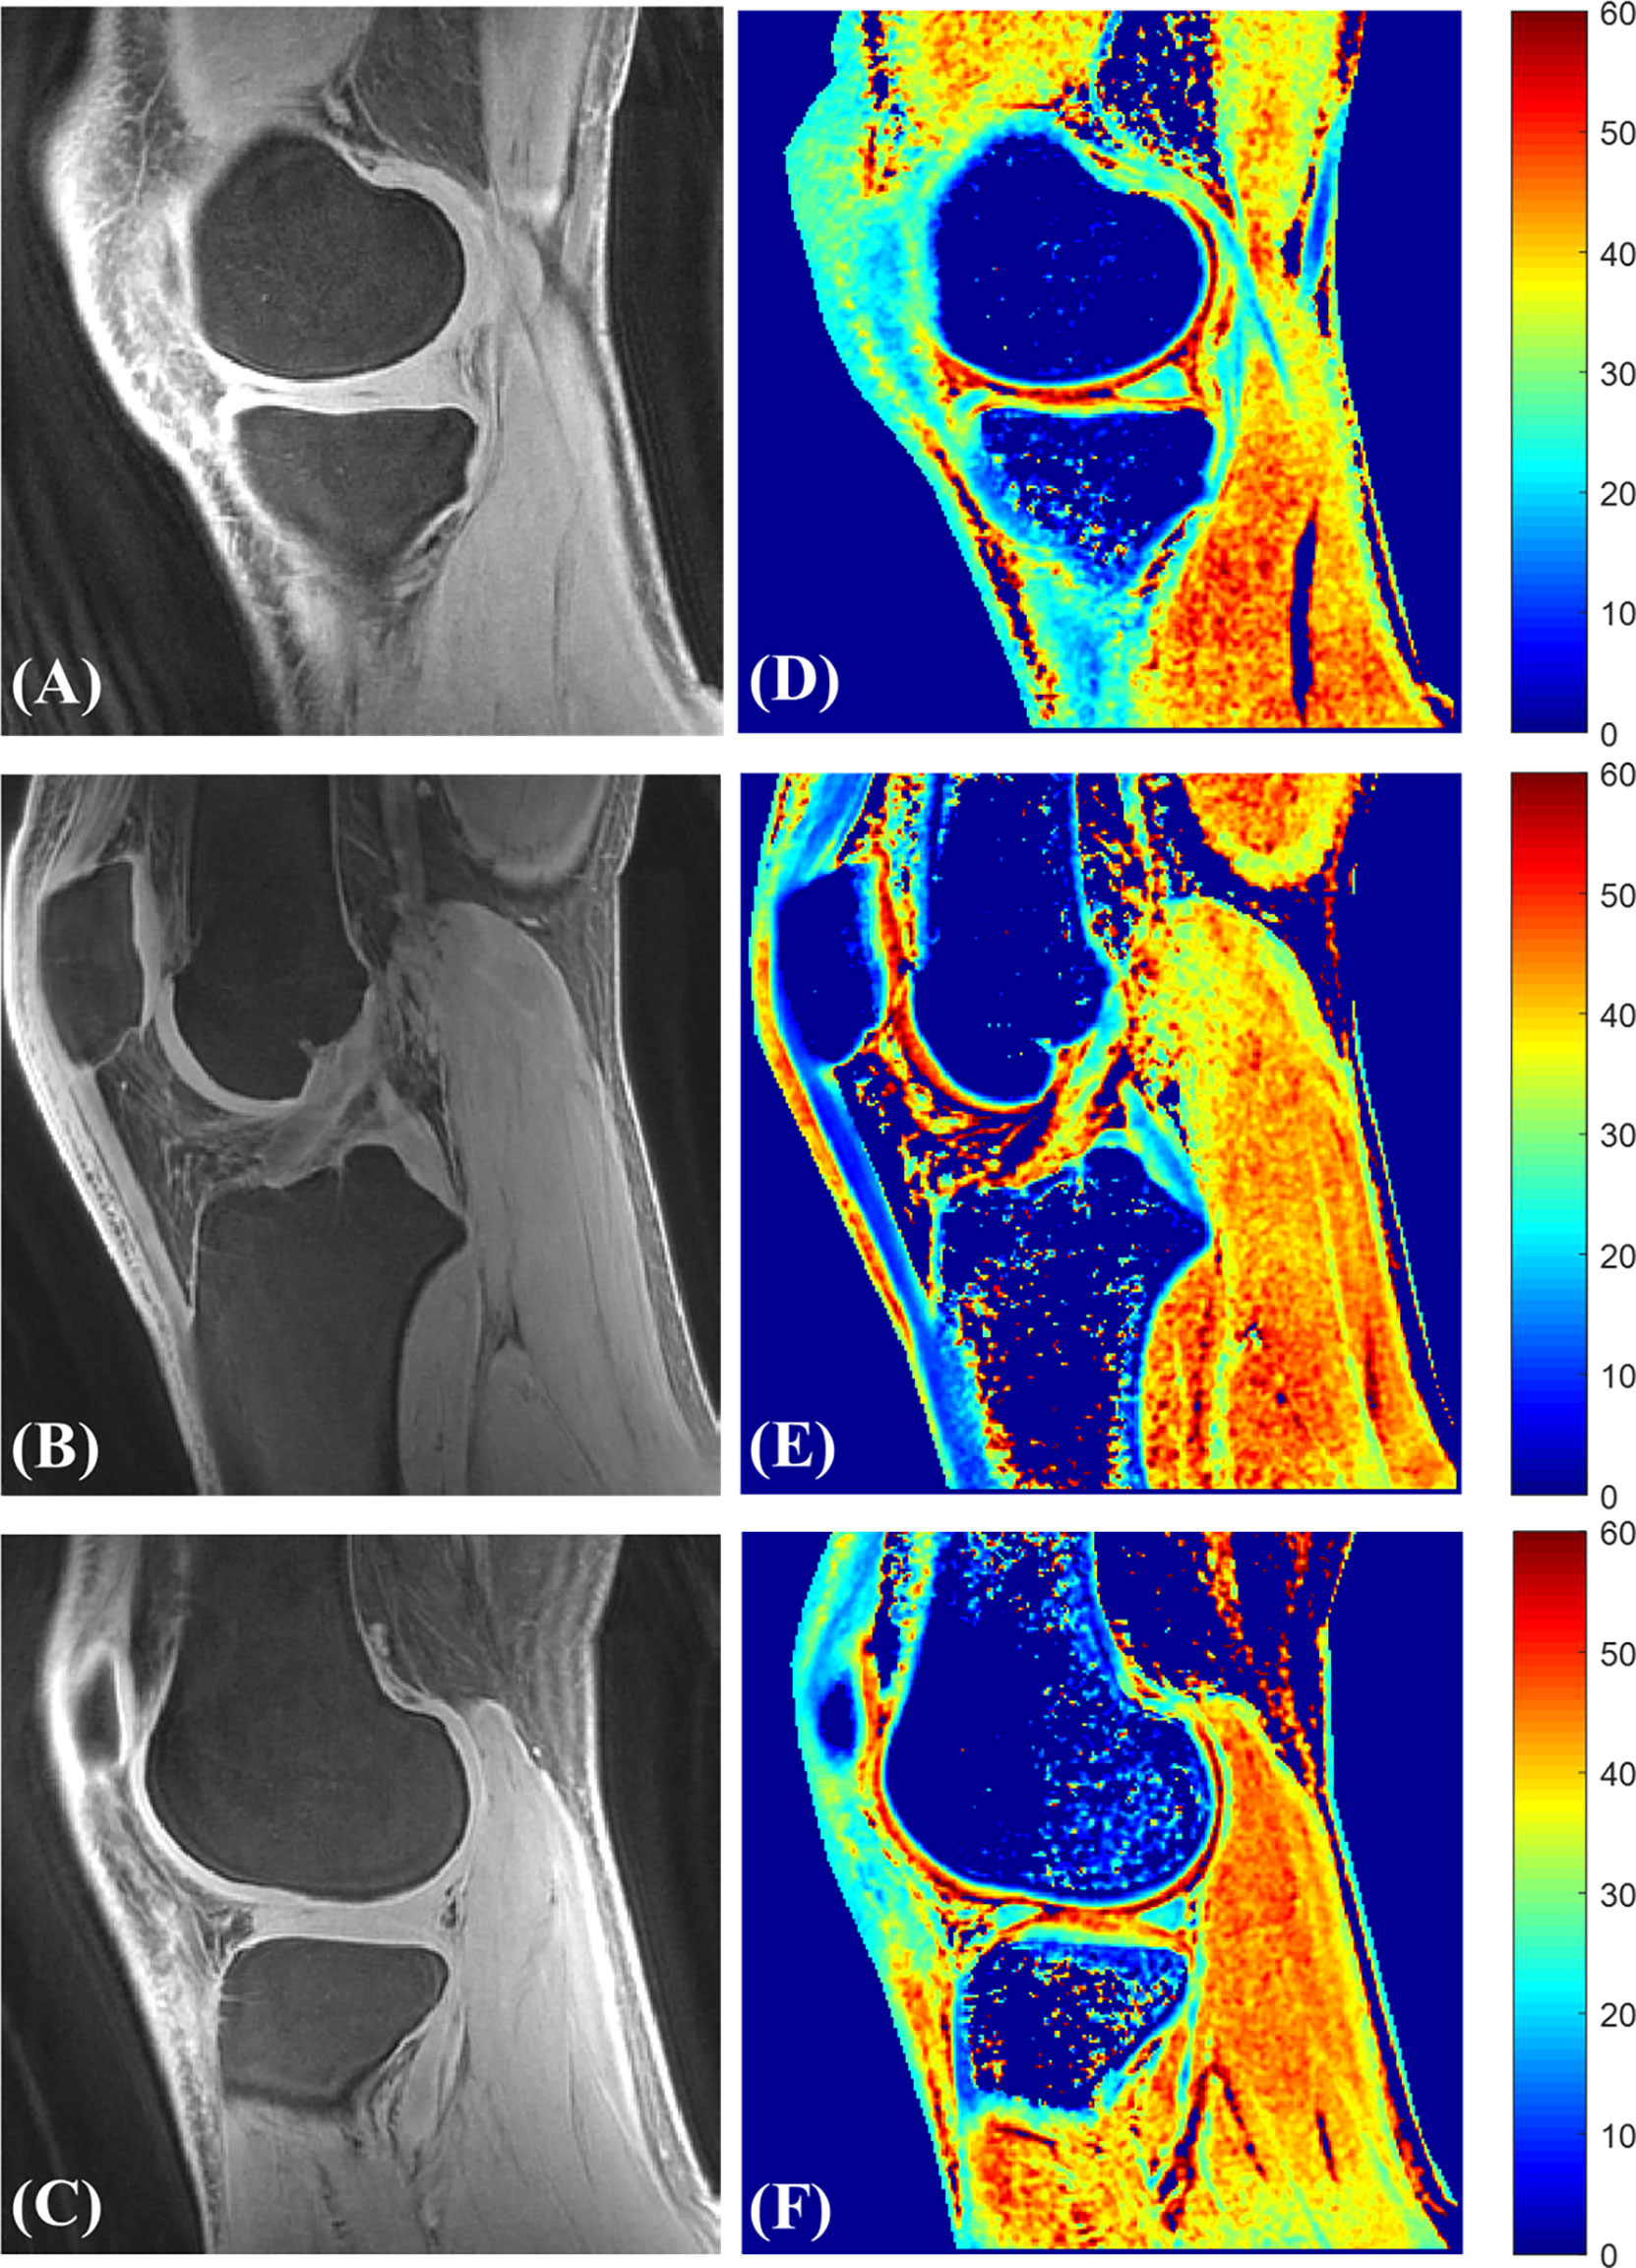
Figure 14 Representative 3D UTE-AdiabT1ρ Cones images (A–C) with their corresponding T1ρ maps (D–F).
A recent study by the same research group demonstrated that this UTE-AdiabT1ρ sequence had a low sensitivity to the magic angle effect (57). Wu et al. scanned human patellar samples at 3T and investigated the magic angle effect at five angular orientations ranging from 0° to 90° in relation to the B0 field. For the comparison, they also applied UTE‐ and UTE continuous wave T1ρ (UTE‐CW‐T1ρ) sequences, ultimately concluding that the 3D UTE-AdiabT1ρ sequence was less sensitive to the magic angle effect across all patellar cartilage layers compared with either the UTE‐CW‐T1ρ or UTE‐ sequences (57).
Namiranian et. al., also reported significant correlations between UTE-AdiabT1ρ and the articular cartilage mechanical properties (34). Higher correlations were found at superficial layer as the indentation tests mainly measured the surface mechanical properties.
Lastly, in an ex vivo study by Shao et al. (71), the UTE-AdiabT1ρ values showed significant differences but lower diagnostic efficacy (compared to UTE-MTR) between the normal group and mildly degenerated group of anterolateral femoral condyle specimens obtained from total knee arthroplasty.
The chemical exchange saturation transfer (CEST) phenomena occurs when water-soluble macromolecules with exchangeable protons (generally, the amide side of the chains in contrast agents typically injected into joints) become exposed to water or body fluid protons (76). Because CEST is assumed to occur more intensely in an acidic environment where there are more free protons available, it has been hypothesized that quantification of CEST can be used to detect pH changes in tissues, which themselves may be a sign of lactic acid accumulation and pain triggers.
AcidoCEST-UTE has been introduced recently by Ma et al. as a potential technique for measuring extracellular PH in tissues with short T2 values such as articular cartilage (50). The feasibility of the acidoCEST-UTE technique was investigated on a liquid phantom and ex vivo human cartilage phantoms doped with iodinated contrast agent in a 3T scanner. Among iodinated contrasts tested in liquid phantoms, iopamidol and iohexol were determined to be feasible for pH detection using AcidoCEST-UTE., with iohexol having the best performance in determine the tissue pH (50).
In a similar study, High et al. hypothesized that changes in extracellular pH may mediate the degeneration of cartilage (60). To determine the feasibility of the acidoCEST MRI method for measuring pH in cartilage in vivo and to optimize saturation powers used with the technique, they evaluated MTR asymmetry and ratio of RF power mismatch at different powers in cartilage tissue phantoms for iodinated contrasts of iohexol and iopamidol (77). They also administered the iodinated contrasts directly into the joints of 4 patients with chronic knee pain and, by using optimized RF powers, they utilized the acidoCEST-UTE MRI sequence to evaluate the pH of joint tissues and fluid. In the phantoms, the ratio of powers demonstrated the strongest correlation with pH. In vivo measurements of acidoCEST-UTE pH of intra-articular fluid were similar to electrode measurements of the contrast media (7.65 vs. 7.5 for iohexol and 7.22 vs. 7.1 for iopamidol, respectively). This study demonstrated that after direct intra-articular administration of either iohexol or iopamidol, acidoCEST-UTE MRI is capable of measuring cartilage pH in vivo.
UTE spectroscopic imaging (UTESI) has been developed by Du et al. (46) as a suite of chemical shift imaging techniques suitable for MSK tissues with short T2 values such as articular cartilage particularly at the deep and calcified layers. In general, chemical shift imaging techniques provide spectroscopic information, an estimation of the relative numbers of the protons with a specific relaxation time, in the targeted tissue. UTESI employs a combination of highly under-sampled interleaved projection reconstruction with a multi-echo UTE acquisition at progressively increasing TEs up to few milliseconds in order to investigate the various proton pools in cartilage including the short T2 proton pool. The undersampled data is used for calculation through either exponential fitting of the time domain images or line fitting of the magnitude spectrum.
Fat saturation techniques are regularly used to improve image contrast for better visualization of the target tissue. In a novel study, Ma et al. proposed a soft-hard composite RF pulse to suppress fat signals in UTE imaging for tissues with short T2 (78). The soft pulse of this composite pulse has a narrow bandwidth, small negative flip angle, and is centered on the fat peak. The hard pulse is a short rectangular pulse and has a small positive flip angle. The outcome is fat magnetization that tips down and back with an identical flip angle, i.e., that returns to a state of equilibrium, so that only the excited water magnetization remains. Ma et al.’s feasibility study investigated the knees and tibias of respectively five and six healthy volunteers between the ages of 22 and 35 on a 3T scanner. For comparison, a conventional fat saturation (FatSat) model was used; for evaluation of the novel technique’s efficiency, signal suppression ratio (SSR) was introduced. Higher SSR was consistent with better fat suppression or water attenuation induced by fat suppression. The soft-hard composite pulse approach resulted in much lower signal attenuation of water imaging than the conventional FatSat method on simulation studies, performed well for in vivo fat suppression, and produced better preservation of both long and short T2 signals, significantly higher SSR specifically for short T2 signals, and better contrast between water and fat.
Jang et al. developed the ultrashort echo time cones double echo steady state (UTE-Cones-DESS) sequence for fast volumetric and high quality image contrast of MSK tissues (22). This technique was performed in the knee joints of both healthy volunteers and patients with osteoarthritis. To achieve a scan time of less than 5 minutes without compromising image quality, Jang et al. applied fat suppression using a novel, single-point Dixon (spDixon) approach (79). This high contrast morphological imaging method of short T2 tissues, including the deep layers of cartilage, has the potential to assess musculoskeletal diseases.
Chen et al. investigated the effects of fat saturation on three quantitative UTE images including , T1ρ, and MT (59). These sequences were implemented with and without fat saturation on knee cartilage samples and whole cadaveric knee specimens at 3T. This investigation demonstrated strong correlations and agreement with some minor differences for all UTE biomarkers between the measurements with and without FatSat, confirming that fat suppression was effective in all three UTE sequences where FatSat was employed for whole joint quantification including cartilage.
Springer et al. aimed to visualize short T2 tissues with optimal contrast and adequate suppression of signal from the surrounding fat by implementing a time-efficient 1:1 double pulse water-selective excitation (WE) into a 3D UTE sequence (WE-UTE) (80). In this study, they applied WE-UTE on the flexor tendons of the human hand and the PCLs of the knee in vivo at 3T and saw that these short T2 tissues could be well demarcated with positive contrast compared to surrounding fat. Even for tissues with T2 values of 1 ms, WE-UTE led to 79% of maximal signal yield of UTE without fat suppression and is assumed more efficient with regard to signal yield in comparison to UTE with FatSat. Hopefully, further developments in WE-UTE will lead to optimization of a technique that can quickly and effectively visualize short T2 tissues like knee cartilage with positive and optimal contrast (80).
The suite of currently available quantitative UTE techniques has significantly improved the state of articular cartilage assessment, particularly for regions of cartilage with significant short T2 components such as the deep layer cartilage and calcified cartilage zone. This review first described the existing UTE sampling patterns, including radial, stack of spiral, and spiral, that have been utilized to study cartilage. In general, spiral sampling is more time-efficient than radial in covering the whole k-space because of its flexibility with regard to readout stretching. 3D sampling is a better choice for high-resolution cartilage imaging than 2D, especially for evaluation of the thin deep or calcified layers.
The review next systematically described the current state-of-the-art UTE techniques for assessment of cartilage, including both morphological and quantitative imaging. Morphological UTE techniques, including UTE echo subtraction, fat saturated T1-weghted UTE, UTE-DESS, IR, and Dual-IR prepared UTE, have been developed for high contrast imaging of the deep and calcified layers of cartilage. Generally, IR-based UTE sequences can generate a greater short T2 contrast compared to other non-IR-based techniques but require a much longer scan time. Many quantitative UTE imaging techniques have been developed including UTE-T1, UTE-, UTE-T1ρ, UTE-MT, UTE-CEST, and UTE-QSM. The biomarkers created by these techniques have different specificities: UTE-T1 is sensitive to the water content changes, UTE- is sensitive to the collagen integrity and calcification, UTE-T1ρ is sensitive to the proteoglycan changes, UTE-MT is sensitive to collagen content and integrity, UTE-CEST is sensitive to the pH changes, and UTE-QSM is sensitive to susceptibility changes and calcification. Many of these biomarkers, such as UTE-T1ρ, UTE-MT and UTE-CEST, have been validated with both sample and patient studies in a number of promising studies. However, more comprehensive studies have yet to be performed that compare the performance of these biomarkers. We expect that more clinical trial studies could help answer the question.
The UTE biomarkers such as UTE-T1ρ and , are limited by orientation sensitivity to the magic angle (57, 81, 82). Orientation-based changes may exceed the changes caused by degeneration in the cartilage itself. A few of the recently developed UTE techniques, such as UTE-AdiabT1ρ and UTE-MT modeling, have shown promise in overcoming this so-called magic angle effect (57, 73, 74), suggesting that they have the potential to provide more robust evaluation of the cartilage composition and structural quality. Quantitative UTE biomarkers of MTR and MMF also exhibit feasibility to recognize enzymatic collagen degradation (83). Moreover, AdiabT1ρ and T1 biomarkers have the capability to detect enzymatic proteoglycan (PG) loss in human knee cartilage (83).
There is only one study currently published in the literature that investigated the feasibility of simultaneous susceptibility mapping of the articular cartilage and cortical bone in knee (23). In this work, susceptibility variations were found in different layers of cartilage, which was in agreement with previous GRE-QSM studies (84, 85).
Fat signals shift radially in non-Cartesian UTE imaging due to the off-resonance sampling of fat. This significantly affects the deep and calcified layer cartilage imaging since these regions are close to the marrow fat region. Thus, fat suppression is important to reduce the fat signal contamination for both morphological and quantitative imaging. The conventional fat saturation technique is still the most widely used fat suppression technique in UTE, but the fat saturation pulse attenuates the cartilage signal due to direct and indirect saturation, especially for the shorter T2 layers. Newly developed fat saturation techniques such as the soft-hard water excitation pulse or single point Dixon method can avoid attenuating the cartilage signals while still performing effective fat suppression. Further studies to investigate the impact of quantitative UTE imaging for variable fat suppression techniques are highly valuable. In addition, field inhomogeneity can affect the effectiveness of fat suppression and generate off-resonance blurring. Furthermore, eddy currents can create an artificial tissue boundary, thus impacting the general brightness and contrast of UTE images. Therefore, accurate eddy correction is also critical for UTE imaging. Lastly, the integrity of high-resolution UTE imaging is of paramount importance for the accurate characterization of the thin structures of both the deep and calcified cartilage layers. Because the signal-to-noise ratio may be significantly reduced for high resolution imaging, a dedicated coil or deep learning-based denoise reconstruction should be applied to help improve the SNR performance of UTE imaging (32).
In addition to UTE MRI, a few other novel MRI techniques have been developed in recent years for qualitative and quantitative assessment of those tissues which have short T2 values (86). For example, zero echo time (ZTE) MRI, which utilizes a short rectangular excitation pulse during the fully ramped up readout gradient followed by fast radial sampling, is related to the UTE approach. Compared to UTE, ZTE has a shorter readout duration and therefore less contrast but also lacks flexibility in terms of ability to adjust either the field of view or flip angle. This makes each technique better suited for particular applications in the visualization of short T2 tissues (87). Larson et al. performed a comparative study between UTE and ZTE MRI techniques at 7T in the knee, ankle, and brain to assess differences between these two methods (48). They chose to use 7T field strength in order to take advantage of the increased polarization and also to accentuate any pulse sequence differences due to B0 and B1 inhomogeneities. This study observed that the UTE and ZTE techniques both achieved similar SNR efficiencies and image contrasts for volumetric imaging, but that UTE was more flexible in terms of volume selection, image contrast, and quantitative assessment of the tissue, and at a disadvantage in terms of sensitivity to gradient fidelity and higher acoustic noise.
The described MRI techniques in this review image hydrogen protons and proportions of water in various forms. However, sodium (i.e., Na+) and other elements have been of interest to researchers given that they may function as indicators of compositional changes in articular cartilage. Chang et al. performed a preliminary study of UTE and IR-UTE sodium MRI at 7T field strength on cartilage repair patients to investigate whether UTE MRI could detect sodium concentration in cartilage repair tissue, native cartilage adjacent to repaired tissue, and native cartilage on the side that was not involved in surgery (47). Significant differences between repair tissue and native tissue as well as between native tissues of different parts were identified by sodium IR-UTE. Cartilage Na+ concentration was found to be underestimated on non-fluid-suppressed MR imaging (sodium UTE).
The quantitative UTE MRI protocols described in this review usually require around 10 minutes of scan time, making them less optimal for clinical application given the heightened risk for motion artifacts. Therefore, for in vivo quantitative imaging, motion registration becomes a highly critical element of the protocol to limit artifacts resulting from patient movement during scans (88). Moreover, employing different accelerating techniques, such as stretching the readout trajectory (33), compressed sensing (89), integration of deep convolutional neural networks (CNNs) (32), 3D simplex deformable modeling (90), and attention U-Net with transfer learning, could and should be employed to accelerate the quantitative UTE protocols, largely reducing potential motion-related artifacts, with negligible errors. Interestingly, the U-Net with transfer learning framework has been applied for auto-segmentation of knee cartilage in quantitative UTE imaging (91).
In this review, we have systematically introduced and discussed the major existing UTE MR techniques for assessment of knee cartilage. We expect that some of these UTE MRI techniques, especially for these magic angle-insensitive techniques, will be translated to clinical use in the near future to help improve diagnosis and treatment monitoring.
The conception and design of the study: AA and Y-JM. Acquisition of data: AA, SS, DM, GA, Y-JM, and JA. Writing-original draft preparation: AA and Y-JM. Writing-review and editing: Y-JM, AA, and HJ. Revising the manuscript critically for important intellectual content: Y-JM. Final approval of the version to be submitted: Y-JM and AA. All authors contributed to the article and approved the submitted version.
The authors acknowledge grant support from NIH (R01AR078877, R01AR079484 and R21AR075851) and GE Healthcare. The authors declare that GE Healthcare was not involved in the study design, collection, analysis, interpretation of data, the writing of this article or the decision to submit it for publication.
GA was employed by the company BioSapien.
The remaining authors declare that the research was conducted in the absence of any commercial or financial relationships that could be construed as a potential conflict of interest.
All claims expressed in this article are solely those of the authors and do not necessarily represent those of their affiliated organizations, or those of the publisher, the editors and the reviewers. Any product that may be evaluated in this article, or claim that may be made by its manufacturer, is not guaranteed or endorsed by the publisher.
1. Heinegård D, Saxne T. The Role of the Cartilage Matrix in Osteoarthritis. Nat Rev Rheumatol (2011) 7(1):50–6. doi: 10.1038/nrrheum.2010.198
2. Tavernier T, Dejour D. Knee Imaging: What Is the Best Modality. J Radiol (2001) 82(3 Pt 2):387–8.
3. Dean Deyle G. The Role of MRI in Musculoskeletal Practice: A Clinical Perspective. J Man Manip Ther (2011) 19(3):152–61. doi: 10.1179/2042618611Y.0000000009
4. Chang EY, Du J, Chung CB. UTE Imaging in the Musculoskeletal System. J Magn Reson Imag (2015) 41(4):870–83. doi: 10.1002/jmri.24713
5. Bydder GM. The Agfa Mayneord Lecture: MRI of Short and Ultrashort T2and T2* Components of Tissues, Fluids and Materials Using Clinical Systems. Br J Radiol (2011) 84(1008):1067–82. doi: 10.1259/bjr/74368403
6. Afsahi AM, Ma Y, Jang H, Jerban S, Chung CB, Chang EY, et al. Ultrashort Echo Time Magnetic Resonance Imaging Techniques: Met and Unmet Needs in Musculoskeletal Imaging. J Magn Reson Imaging (2021). doi: 10.1002/jmri.28032
7. Pauly J, Conolly S, Nishimura D, Macovski A. Slice-Selective Excitation for Very Short T2 Species. In: Proceedings of the ISMRM 8th Annual Meeting, vol. 28. Amsterdam, The Netherlands (1989).
8. Bergin CJ, Pauly JM, Macovski A. Lung Parenchyma: Projection Reconstruction MR Imaging. Radiology (1991) 179(3):777–81. doi: 10.1148/radiology.179.3.2027991
9. Gold GE, Pauly JM, Macovski A, Herfkens RJ. MR Spectroscopic Imaging of Collagen: Tendons and Knee Menisci. Magn Reson Med (1995) 34(5):647–54. doi: 10.1002/mrm.1910340502
10. Mastrogiacomo S, Dou W, Jansen JA, Walboomers XF. Magnetic Resonance Imaging of Hard Tissues and Hard Tissue Engineered Bio-Substitutes. Mol Imaging Biol (2019) 21(6):1003–19. doi: 10.1007/s11307-019-01345-2
11. Bae WC, Biswas R, Chen K, Chang EY, Chung CB. UTE MRI of the Osteochondral Junction. Curr Radiol Rep (2014) 2(2):35. doi: 10.1007/s40134-013-0035-7
12. Ma Y, Jerban S, Carl M, Wan L, Guo T, Jang H, et al. Imaging of the Region of the Osteochondral Junction (OCJ) Using a 3D Adiabatic Inversion Recovery Prepared Ultrashort Echo Time Cones (3d IR-UTE Cones) Sequence at 3T. NMR Biomed (2019) 32(5):e4080. doi: 10.1002/nbm.4080
13. Du J, Carl M, Bae WC, Statum S, Chang EY, Bydder GM, et al. Dual Inversion Recovery Ultrashort Echo Time (DIR-UTE) Imaging and Quantification of the Zone of Calcified Cartilage (ZCC). Osteoarthr Cartil (2013) 21(1):77–85. doi: 10.1016/j.joca.2012.09.009
14. Lombardi AF, Jang H, Wei Z, Jerban S, Wallace M, Masuda K, et al. High-Contrast Osteochondral Junction Imaging Using a 3D Dual Adiabatic Inversion Recovery-Prepared Ultrashort Echo Time Cones Sequence. NMR Biomed (2021) 34(8):e4559. doi: 10.1002/nbm.4559
15. Williams AA, Titchenal MR, Do BH, Guha A, Chu CR. MRI UTE-T2* Shows High Incidence of Cartilage Subsurface Matrix Changes 2 Years After ACL Reconstruction. J Orthop Res (2019) 37(2):370–7. doi: 10.1002/jor.24110
16. Ma Y-J, Carl M, Shao H, Tadros AS, Chang EY, Du J. Three-Dimensional Ultrashort Echo Time Cones T(1ρ) [3d UTE-Cones-T(1ρ)] Imaging. NMR Biomed (2017) 30(6):e3709. doi: 10.1002/nbm.3709
17. Ma Y-J, Carl M, Searleman A, Lu X, Chang EY, Du J. 3D Adiabatic T(1ρ) Prepared Ultrashort Echo Time Cones Sequence for Whole Knee Imaging. Magn Reson Med (2018) 80(4):1429–39. doi: 10.1002/mrm.27131
18. Ma Y-J, Chang EY, Carl M, Du J. Quantitative Magnetization Transfer Ultrashort Echo Time Imaging Using a Time-Efficient 3D Multispoke Cones Sequence. Magn Reson Med (2018) 79(2):692–700. doi: 10.1002/mrm.26716
19. Yang J, Shao H, Ma Y, Wan L, Zhang Y, Jiang J, et al. Quantitative Ultrashort Echo Time Magnetization Transfer (UTE-MT ) for Diagnosis of Early Cartilage Degeneration : Comparison With UTE-T2 * and T2 Mapping. Quant Imaging Med Surg (2020) 10(1):171–83. doi: 10.21037/qims.2019.12.04
20. Xue YP, Ma YJ, Wu M, Jerban S, Wei Z, Chang EY, et al. Quantitative 3d Ultrashort Echo Time Magnetization Transfer Imaging for Evaluation of Knee Cartilage Degeneration In Vivo. J Magn Reson Imaging (2021) 54(4):1294–302. doi: 10.1002/jmri.27659
21. Chaudhari AS, Sveinsson B, Moran CJ, McWalter EJ, Johnson EM, Zhang T, et al. Imaging and T(2) Relaxometry of Short-T(2) Connective Tissues in the Knee Using Ultrashort Echo-Time Double-Echo Steady-State (UTEDESS). Magn Reson Med (2017) 78(6):2136–48. doi: 10.1002/mrm.26577
22. Jang H, Ma Y, Carl M, Jerban S, Chang EY, Du J. Ultrashort Echo Time Cones Double Echo Steady State (UTE-Cones-DESS) for Rapid Morphological Imaging of Short T2 Tissues. Magn Reson Med (2021) 86(2):881–92. doi: 10.1002/mrm.28769
23. Zhang M, Li Z, Wang H, Chen T, Lu Y, Yan F, et al. Simultaneous Quantitative Susceptibility Mapping of Articular Cartilage and Cortical Bone of Human Knee Joint Using Ultrashort Echo Time Sequences. Front Endocrinol (Lausanne) (2022) 13:1–7. doi: 10.3389/fendo.2022.844351
24. Eschweiler J, Horn N, Rath B, Betsch M, Baroncini A, Tingart M, et al. The Biomechanics of Cartilage — An Overview. Life (2021) 11(4):302. doi: 10.3390/life11040302
25. Sharma AR, Jagga S, Lee S, Nam J. Interplay Between Cartilage and Subchondral Bone Contributing to Pathogenesis of Osteoarthritis. Int J Mol Sci (2013) 14(10):19805–30. doi: 10.3390/ijms141019805
26. Liu J, Wei Y, Ma YJ, Zhu YC, Zhou Q, Zhao YH. Magnetic Resonance Imaging of the Zone of Calcified Cartilage in the Knee Joint Using 3-Dimensional Ultrashort Echo Time Cones Sequences. Chin Med J (Engl) (2019) 132(5):562–8. doi: 10.1097/CM9.0000000000000103
27. Bae WC, Dwek JR, Znamirowski R, Statum SM, Hermida JC, D’Lima DD, et al. Ultrashort Echo Time MR Imaging of Osteochondral Junction of the Knee at 3 T: Identification of Anatomic Structures Contributing to Signal Intensity. Radiology (2010) 254(3):837–45. doi: 10.1148/radiol.09081743
28. Cai Z, Wei Z, Wu M, Jerban S, Jang H, Li S, et al. Knee Osteochondral Junction Imaging Using a Fast 3D T(1)-Weighted Ultrashort Echo Time Cones Sequence at 3T. Magn Reson Imag (2020) 73:76–83. doi: 10.1016/j.mri.2020.08.003
29. Du J, Bydder M, Takahashi AM, Carl M, Chung CB, Bydder GM. Short T2 Contrast With Three-Dimensional Ultrashort Echo Time Imaging. Magn Reson Imag (2011) 29(4):470–82. doi: 10.1016/j.mri.2010.11.003
30. Gatehouse PD, Thomas RW, Robson MD, Hamilton G, Herlihy AH, Bydder GM. Magnetic Resonance Imaging of the Knee With Ultrashort TE Pulse Sequences. Magn Reson Imag (2004) 22(8):1061–7. doi: 10.1016/j.mri.2004.08.018
31. Ma Y-J, Zhao W, Wan L, Guo T, Searleman AC, Jang H, et al. Whole Knee Joint T1 Values Measured In Vivo at 3T by Combined 3d Ultrashort Echo Time Cones Actual Flip Angle and Variable Flip Angle Methods. Magn Reson Med (2019) 81(3):1634–44. doi: 10.1002/mrm.27510
32. Wu Y, Ma Y, Capaldi DP, Liu J, Zhao W, Du J, et al. Incorporating Prior Knowledge via Volumetric Deep Residual Network to Optimize the Reconstruction of Sparsely Sampled MRI. Magn Reson Imag (2020) 66:93–103. doi: 10.1016/j.mri.2019.03.012
33. Wan L, Ma Y, Yang J, Jerban S, Searleman AC, Carl M, et al. Fast Quantitative Three-Dimensional Ultrashort Echo Time (UTE ) Cones Magnetic Resonance Imaging of Major Tissues in the Knee Joint Using Extended Sprial Sampling. NMR Biomed (2020) 33(10):1–10. doi: 10.1002/nbm.4376
34. Namiranian B, Jerban S, Ma Y, Dorthe EW, Masoud-afsahi A, Wong J, et al. Assessment of Mechanical Properties of Articular Cartilage With Quantitative Three-Dimensional Ultrashort Echo Time (UTE ) Cones Magnetic Resonance Imaging. J Biomech (2020) 113:110085. doi: 10.1016/j.jbiomech.2020.110085
35. Foreman SC, Ashmeik W, Baal JD, Han M, Bahroos E, Schacky CEV, et al. Patients With Type 2 Diabetes Exhibit a More Mineralized Deep Cartilage Layer Compared With Nondiabetic Controls : A Pilot Study. Cartilage (2019) 13(1_suppl):428S–36S. doi: 10.1177/1947603519870853
36. von Drygalski A, Barnes RFW, Jang H, Ma Y, Wong JH, Berman Z, et al. Advanced Magnetic Resonance Imaging of Cartilage Components in Haemophilic Joints Reveals That Cartilage Hemosiderin Correlates With Joint Deterioration. Haemophilia (2019) 25(5):851–8. doi: 10.1111/hae.13802
37. Williams AA, Titchenal MR, Andriacchi TP, Chu CR, Alto P. MRI UTE-T2* Profile Characteristics Correlate to Walking Mechanics and Patient Reported Outcomes 2 Years After ACL Reconstruction. Osteoarthr Cartil (2019) 26(4):569–79. doi: 10.1016/j.joca.2018.01.012
38. Williams A, Qian Y, Chu CR. UTE-T2* Mapping of Human Articular Cartilage In Vivo: A Repeatability Assessment. Osteoarthr Cartil (2011) 19(1):84–8. doi: 10.1016/j.joca.2010.10.018
39. Williams A, Qian Y, Bear D, Chu CR. Assessing Degeneration of Human Articular Cartilage With Ultrashort Echo Time (UTE) T2* Mapping. Osteoarthr Cart (2010) 18(4):539–46. doi: 10.1016/j.joca.2010.02.001
40. Titchenal MR, Williams AA, Chehab EF, Asay JL, Dragoo JL, Gold GE, et al. Cartilage Subsurface Changes to Magnetic Resonance Imaging UTE-T2 * 2 Years After Anterior Cruciate Ligament Reconstruction Correlate With Walking Mechanics Associated With Knee Osteoarthritis. Am J Sport Med (2018) 46(3):565–72. doi: 10.1177/0363546517743969
41. Shao H, Chang EY, Pauli C, Zanganeh S, Bae W, Chung CB, et al. UTE Bi-Component Analysis of T2* Relaxation in Articular Cartilage. Osteoarthr Cartil (2016) 24(2):364–73. doi: 10.1016/j.joca.2015.08.017
42. Chu CR, Williams AA, West RV, Qian Y, Fu FH, Do BH, et al. Quantitative Magnetic Resonance Imaging UTE-T2* Mapping of Cartilage and Meniscus Healing After Anatomic Anterior Cruciate Ligament Reconstruction. Am J Sport Med (2014) 42(8):1847–56. doi: 10.1177/0363546514532227
43. Du J, Bydder M, Takahashi AM, Chung CB. Two-Dimensional Ultrashort Echo Time Imaging Using a Spiral Trajectory. Magn Reson Imag (2008) 26:304–12. doi: 10.1016/j.mri.2007.08.005
44. Goto H, Fujii M, Iwama Y, Aoyama N, Ohno Y, Sugimura K. Magnetic Resonance Imaging (MRI) of Articular Cartilage of the Knee Using Ultrashort Echo Time (uTE) Sequences With Spiral Acquisition. J Med Imaging Radiat Oncol (2012) 56(3):318–23. doi: 10.1111/j.1754-9485.2012.02388.x
45. Van Dyck P, Vanhevel F, Vanhoenacker FM, Wouters K, Grodzki DM, Gielen JL, et al. Morphological MR Imaging of the Articular Cartilage of the Knee at 3 T — Comparison of Standard and Novel 3D Sequences. Insights Imag (2015) 6(3):285–93. doi: 10.1007/s13244-015-0405-1
46. Du J, Takahashi AM, Chung CB. Ultrashort TE Spectroscopic Imaging (UTESI): Application to the Imaging of Short T2 Relaxation Tissues in the Musculoskeletal System. J Magn Reson Imag (2009) 29(2):412–21. doi: 10.1002/jmri.21465
47. Chang G, Madelin G, Sherman OH, Strauss EJ, Xia D, Recht MP, et al. Improved Assessment of Cartilage Repair Tissue Using Fluid- Suppressed 23 Na Inversion Recovery MRI at 7 Tesla: Preliminary Results. Eur Radiol (2012) 22(6):1341–9. doi: 10.1007/s00330-012-2383-8
48. Larson PEZ, Han M, Krug R, Jakary A, Nelson J, Vigneron DB, et al. Ultrashort Echo Time and Zero Echo Time MRI at 7T. Magn Reson Mater Phys Biol Med (2016) 29(3):359–70. doi: 10.1007/s10334-015-0509-0
49. Lee YH, Kim S, Song H-T, Kim I, Suh J-S. Weighted Subtraction in 3D Ultrashort Echo Time (UTE) Imaging for Visualization of Short T2 Tissues of the Knee. Acta Radiol (2014) 55(4):454–61. doi: 10.1177/0284185113496994
50. Ma Y-J, High RA, Tang Q, Wan L, Jerban S, Du J, et al. AcidoCEST-UTE MRI for the Assessment of Extracellular pH of Joint Tissues at 3T. Invest Radiol (2019) 54(9):565–71. doi: 10.1097/RLI.0000000000000576
51. Qian Y, Williams AA, Chu CR, Fernando E. High-Resolution Ultrashort Echo Time (UTE) Imaging on Human Knee With AWSOS Sequence at 3.0 T. Magn Reson Imaging (2012) 35(1):204–10. doi: 10.1002/jmri.22639
52. Hananouchi T, Chen Y, Jerban S, Teramoto M, Ma Y, Dorthe EW, et al. A Useful Combination of Quantitative Ultrashort Echo Time MR Imaging and a Probing Device for Biomechanical Evaluation of Articular Cartilage. Biosensors (2021) 11(2):52. doi: 10.3390/bios11020052
53. Qian Y, Williams AA, Chu CR, Boada FE. Multicomponent T2* Mapping of Knee Cartilage: Technical Feasibility Ex Vivo. Magn Reson Med (2011) 64(5):1426–31. doi: 10.1002/mrm.22450
54. Pauli C, Bae WC, Lee M, Lotz M, Bydder GM, D’Lima DL, et al. Ultrashort-Echo Time MR Imaging of the Patella With Bicomponent Analysis: Correlation With Histopathologic and Polarized Light Microscopic Findings. Radiology (2012) 264(2):484–93. doi: 10.1148/radiol.12111883
55. Du J, Diaz E, Carl M, Bae W, Chung CB, Bydder GM. Ultrashort Echo Time Imaging With Bicomponent Analysis. Magn Reson Med (2012) 67(3):645–9. doi: 10.1002/mrm.23047
56. Jang H, McMillan AB, Ma Y, Jerban S, Chang EY, Du J, et al. Rapid Single Scan Ramped Hybrid-Encoding for Bicomponent T2* Mapping in a Human Knee Joint: A Feasibility Study. NMR Biomed (2020) 33(11):1–10. doi: 10.1002/nbm.4391
57. Wu M, Ma YJ, Kasibhatla A, Chen M, Jang H, Jerban S, et al. Convincing Evidence for Magic Angle Less-Sensitive Quantitative T1ρ Imaging of Articular Cartilage Using the 3D Ultrashort Echo Time Cones Adiabatic T1ρ (3d UTE Cones-Adiabt1ρ) Sequence. Magn Reson Med (2020) 84(5):2551–60. doi: 10.1002/mrm.28317
58. Jerban S, Kasibhatla A, Ma Y, Wu M, Chen Y, Guo T, et al. Detecting Articular Cartilage and Meniscus Deformation Effects Using Magnetization Transfer Ultrashort Echo Time (MT-UTE) Modeling During Mechanical Load Application: Ex Vivo Feasibility Study. Cartilage (2021) 13(1_suppl):665S–73S. doi: 10.1177/1947603520976771
59. Chen Y, Li L, Le N, Chang EY, Huang W, Ma Y-J. On the Fat Saturation Effect in Quantitative Ultrashort TE MR Imaging. Magn Reson Med (2022) 87(5):2388–97. doi: 10.1002/mrm.29149
60. High RA, Ji Y, Ma Y, Tang Q, Murphy ME, Du J, et al. In Vivo Assessment of Extracellular pH of Joint Tissues Using acidoCEST-UTE MRI. Quant Imaging Med Surg (2019) 9(10):1664–73. doi: 10.21037/qims.2019.08.11
61. Li X, Li E, Zhang W. Quantifying Auricular Cartilage In Vivo Using Ultra-Short Echo Time (UTE) T2* Mapping. ACM Int Conf Proc Ser (2019), 138–42. doi: 10.1145/3364836.3364864
62. Ma Y-J, Lu X, Carl M, Zhu Y, Szeverenyi NM, Bydder GM, et al. Accurate T1 Mapping of Short T2 Tissues Using a Three-Dimensional Ultrashort Echo Time Cones Actual Flip Angle Imaging-Variable Repetition Time (3D UTE-Cones AFI-VTR) Method. Magn Reson Med (2018) 80(2):598–608. doi: 10.1002/mrm.27066
63. Latta P, Star Z, Gruwel MLH, Weber MH, Tomanek B. K-Space Trajectory Mapping and its Application for Ultrashort Echo Time Imaging. Magn Reson Imag (2017) 36:68–76. doi: 10.1016/j.mri.2016.10.012
64. Du J, Takahashi AM, Bae WC, Chung CB, Bydder GM. Dual Inversion Recovery, Ultrashort Echo Time (DIR UTE) Imaging: Creating High Contrast for Short-T(2) Species. Magn Reson Med (2010) 63(2):447–55. doi: 10.1002/mrm.22257
65. Robison RK, Anderson AG 3rd, Pipe JG. Three-Dimensional Ultrashort Echo-Time Imaging Using a FLORET Trajectory. Magn Reson Med (2017) 78(3):1038–49. doi: 10.1002/mrm.26500
66. Setoi A, Kose K. 3d Cones Acquisition of Human Extremity Imaging Using a 1.5T Superconducting Magnet and an Unshielded Gradient Coil Set. Magn Reson Med Sci (2019) 18(1):88–95. doi: 10.2463/mrms.tn.2017-0170
67. Valvano G, Martini N, Landini L, Santarelli MF. Variable Density Randomized Stack of Spirals (VDR-SoS) for Compressive Sensing MRI. Magn Reson Med (2016) 76(1):59–69. doi: 10.1002/mrm.25847
68. Jang H, Ma Y, Carl M, Lombardi AF, Chang EY, Du J. Feasibility of an Inversion Recovery-Prepared Fat-Saturated Zero Echo Time Sequence for High Contrast Imaging of the Osteochondral Junction. Front Endocrinol (Lausanne) (2021) 12:1–9. doi: 10.3389/fendo.2021.777080
69. Du J, Takahashi AM, Bydder M, Chung CB, Bydder GM. Ultrashort TE Imaging With Off-Resonance Saturation Contrast (UTE-OSC). Magn Reson Med (2009) 62(2):527–31. doi: 10.1002/mrm.22007
70. Carl M, Ma Y, Du J. Theoretical Analysis and Optimization of Ultrashort Echo Time (UTE) Imaging Contrast With Off-Resonance Saturation. Magn Reson Imag (2018) 50(760):12–6. doi: 10.1016/j.mri.2018.03.002
71. Shao H, Yang J, Ma Y, Su X, Tang G, Jiang J, et al. Evaluation of Cartilage Degeneration Using Multiparametric Quantitative Ultrashort Echo Time-Based MRI: An Ex Vivo Study. Quant Imaging Med Surg (2022) 12(3):1738–49. doi: 10.21037/qims-21-550
72. Henkelman RM, Huang X, Xiang QS, Stanisz GJ, Swanson SD, Bronskill MJ. Quantitative Interpretation of Magnetization Transfer. Magn Reson Med (1993) 29(6):759–66. doi: 10.1002/mrm.1910290607
73. Ma YJ, Shao H, Du J, Chang EY. Ultrashort Echo Time Magnetization Transfer (UTE-MT) Imaging and Modeling: Magic Angle Independent Biomarkers of Tissue Properties. NMR Biomed (2016) 29(11):1546–52. doi: 10.1002/nbm.3609
74. Zhu Y, Cheng X, Ma Y, Wong JH, Xie Y, Du J, et al. Rotator Cuff Tendon Assessment Using Magic-Angle Insensitive 3D Ultrashort Echo Time Cones Magnetization Transfer (UTE-Cones-MT) Imaging and Modeling With Histological Correlation. J Magn Reson Imag (2018) 48(1):160–8. doi: 10.1002/jmri.25914
75. Wang L, Regatte RR. T1ρ MR Imaging of Human Musculoskeletal System. J Magn Reson Imaging (2015) 41:586–600. doi: 10.1002/jmri.24677
76. Ward KM, Balaban RS. Determination of pH Using Water Protons and Chemical Exchange Dependent Saturation Transfer (CEST). Magn Reson Med (2000) 44(5):799–802. doi: 10.1002/1522-2594(200011)44:5<799::AID-MRM18>3.0.CO;2-S
77. Longo DL, Sun PZ, Consolino L, Michelotti FC, Uggeri F, Aime S. A General MRI-CEST Ratiometric Approach for pH Imaging: Demonstration of In Vivo pH Mapping With Iobitridol. J Am Chem Soc (2014) 136(41):14333–6. doi: 10.1021/ja5059313
78. Ma Y-J, Jerban S, Jang H, Chang EY, Du J. Fat Suppression for Ultrashort Echo Time Imaging Using a Novel Soft - Hard Composite Radiofrequency Pulse. Magn Reson Med (2019) 82(6):2178–87. doi: 10.1002/mrm.27885
79. Jang H, Carl M, Ma Y, Jerban S, Guo T, Zhao W, et al. Fat Suppression for Ultrashort Echo Time Imaging Using a Single Point Dixon Method. NMR Biomed (2019) 32(5):1–16. doi: 10.1002/nbm.4069
80. Springer F, Steidle G, Martirosian P, Grosse U, Syha R, Schabel C, et al. Quick Water-Selective Excitation of Fast Relaxing Tissues With 3D UTE Sequences. Magn Reson Med (2014) 71(2):534–43. doi: 10.1002/mrm.24684
81. Shao H, Pauli C, Li S, Ma Y, Tadros AS, Chang, et al. Magic Angle Effect Plays a Major Role in Both T1rho and T2 Relaxation in Articular Cartilage. Osteoarthr Cartil (2017) 25(12):2022–30. doi: 10.1016/j.joca.2017.01.013
82. Wu M, Ma Y, Wan L, Jerban S, Jang H, Chang EY, et al. Magic Angle Effect on Adiabatic T(1ρ) Imaging of the Achilles Tendon Using 3D Ultrashort Echo Time Cones Trajectory. NMR Biomed (2020) 33(8):e4322. doi: 10.1002/nbm.4322
83. Wan L, Cheng X, Searleman AC, Ma YJ, Wong JH, Meyer RS, et al. Evaluation of Enzymatic Proteoglycan Loss and Collagen Degradation in Human Articular Cartilage Using Ultrashort Echo Time-Based Biomarkers: A Feasibility Study. NMR Biomed (2021) 35(5):e4664. doi: 10.1002/nbm.4664
84. Zhang M, Li Y, Feng R, Wang Z, Wang W, Zheng N, et al. Change in Susceptibility Values in Knee Cartilage After Marathon Running Measured Using Quantitative Susceptibility Mapping. J Magn Reson Imag (2021) 54(5):1585–93. doi: 10.1002/jmri.27745
85. Wei H, Lin H, Qin L, Cao S, Zhang Y, He N, et al. Quantitative Susceptibility Mapping of Articular Cartilage in Patients With Osteoarthritis at 3T. J Magn Reson Imag (2019) 49(6):1665–75. doi: 10.1002/jmri.26535
86. Weiger M, Brunner DO, Dietrich BE, Müller CF, Pruessmann KP. ZTE Imaging in Humans. Magn Reson Med (2013) 70(2):328–32. doi: 10.1002/mrm.24816
87. Breighner RE, Endo Y, Konin GP, Gulotta LV, Koff MF, Potter HG. Technical Developments: Zero Echo Time Imaging of the Shoulder: Enhanced Osseous Detail by Using MR Imaging. Radiology (2018) 286(3):960–6. doi: 10.1148/radiol.2017170906
88. Wu M, Zhao W, Wan L, Kakos L, Li L, Jerban S, et al. Quantitative Three-Dimensional Ultrashort Echo Time Cones Imaging of the Knee Joint With Motion Correction. NMR Biomed (2020) 33(1):e4214. doi: 10.1002/nbm.4214
89. Ma Y-J, Searleman AC, Jang H, Wong J, Chang EY, Corey-Bloom J, et al. Whole-Brain Myelin Imaging Using 3d Double-Echo Sliding Inversion Recovery Ultrashort Echo Time (DESIRE UTE) MRI. Radiology (2020) 294(2):362–74. doi: 10.1148/radiol.2019190911
90. Liu F, Zhou Z, Jang H, Samsonov A, Zhao G, Kijowski R. Deep Convolutional Neural Network and 3D Deformable Approach for Tissue Segmentation in Musculoskeletal Magnetic Resonance Imaging. Magn Reson Med (2018) 79(4):2379–91. doi: 10.1002/mrm.26841
Keywords: ultrashort echo time, MRI, knee, cartilage, deep layer cartilage, calcified cartilage
Citation: Afsahi AM, Sedaghat S, Moazamian D, Afsahi G, Athertya JS, Jang H and Ma Y-J (2022) Articular Cartilage Assessment Using Ultrashort Echo Time MRI: A Review. Front. Endocrinol. 13:892961. doi: 10.3389/fendo.2022.892961
Received: 09 March 2022; Accepted: 14 April 2022;
Published: 26 May 2022.
Edited by:
Edwin Oei, Erasmus Medical Center, NetherlandsReviewed by:
Victor Casula, University of Oulu, FinlandCopyright © 2022 Afsahi, Sedaghat, Moazamian, Afsahi, Athertya, Jang and Ma. This is an open-access article distributed under the terms of the Creative Commons Attribution License (CC BY). The use, distribution or reproduction in other forums is permitted, provided the original author(s) and the copyright owner(s) are credited and that the original publication in this journal is cited, in accordance with accepted academic practice. No use, distribution or reproduction is permitted which does not comply with these terms.
*Correspondence: Ya-Jun Ma, eWFtMDEzQGhlYWx0aC51Y3NkLmVkdQ==
Disclaimer: All claims expressed in this article are solely those of the authors and do not necessarily represent those of their affiliated organizations, or those of the publisher, the editors and the reviewers. Any product that may be evaluated in this article or claim that may be made by its manufacturer is not guaranteed or endorsed by the publisher.
Research integrity at Frontiers

Learn more about the work of our research integrity team to safeguard the quality of each article we publish.