 Tobias M. Wolff
 Johannes W. Dietrich
 Matthias A. Müller1
- 1Institute of Automatic Control, Leibniz University Hannover, Hannover, Germany
- 2Diabetes, Endocrinology and Metabolism Section, Department of Internal Medicine I, St. Josef Hospital, Ruhr University Bochum, Bochum, Germany
- 3Diabetes Centre Bochum-Hattingen, St. Elisabeth-Hospital Blankenstein, Hattingen, Germany
- 4Ruhr Center for Rare Diseases (CeSER), Ruhr University of Bochum and Witten/Herdecke University, Bochum, Germany
In this paper, we address the problem of optimal thyroid hormone replacement strategy development for hypothyroid patients. This is challenging for the following reasons. First, it is difficult to determine the correct dosage leading to normalized serum thyroid hormone concentrations of a patient. Second, it remains unclear whether a levothyroxine L-T4) monotherapy or a liothyronine/levothyroxine (L-T3/L-T4) combined therapy is more suitable to treat hypothyroidism. Third, the optimal intake frequency of L-T3/L-T4 is unclear. We address these issues by extending a mathematical model of the pituitary-thyroid feedback loop to be able to consider an oral intake of L-T3/L-T4. A model predictive controller (MPC) is employed to determine optimal dosages with respect to the thyroid hormone concentrations for each type of therapy. The results indicate that the L-T3/L-T4 combined therapy is slightly better (in terms of the achieved hormone concentrations) to treat hypothyroidism than the L-T4 monotherapy. In case of a specific genetic variant, namely genotype CC in polymorphism rs2235544 of gene DIO1, the simulation results suggest that the L-T4 monotherapy is better to treat hypothyroidism. In turn, when genotype AA is considered, the L-T3/L-T4 combined therapy is better to treat hypothyroidism. Furthermore, when genotype CC of polymorphism rs225014 (also referred to as c.274A>G or p.Thr92Ala) in the DIO2 gene is considered, the outcome of the L-T3/L-T4 combined therapy is better in terms of the steady-state hormone concentrations (for a triiodothyronine setpoint at the upper limit of the reference range of healthy individuals). Finally, the results suggest that two daily intakes of L-T3 could be the best trade-off between stable hormone concentrations and inconveniences for the patient.
1 Introduction
The standard form of therapy to treat hypothyroid patients is a levothyroxine (L-T4) monotherapy (1). L-T4 is a synthetic replacement hormone of thyroxine (T4) (2). The conversion of T4 into triiodothyronine (T3) in peripheral organs like the liver and the kidney as well as the long half-life of T4 lead to stable serum thyroid hormone concentrations (3, 4).
However, several problems regarding this treatment strategy occur. First, it is difficult to determine the correct individual dosage in practice. Usually, every 4-6 weeks adaptations of the dosages are necessary to reach the desired thyroid stimulating hormone (TSH) concentration (1). This results in a long time until the correct individual L-T4 dosage is found and potentially in temporary iatrogen hyperthyroidism (5).
Second, 5 % - 10 % of the hypothyroid patients treated with an L-T4 monotherapy continue suffering from symptoms of hypothyroidism even if their TSH concentrations are within the reference range of healthy individuals (6). In order to tackle this second problem, an additional prescription of liothyronine (L-T3) can be considered, leading to a so called L-T3/L-T4 combined therapy. On the one hand, some studies documented that an L-T3/L-T4 combined therapy leads to a higher quality of life and lower depressivity (7, 8). Additionally, the patients’ own preference tends towards the L-T3/L-T4 combined therapy (7–9). On the other hand, there are studies that do not conclude that the L-T3/L-T4 combined therapy is superior compared to the L-T4 monotherapy regarding aspects as quality of life or symptoms (10–12). A known disadvantage of the L-T3/L-T4 combined therapy is that it usually goes along with undesired fluctuations in the T3 concentrations (13). By splitting up the daily dosages, these fluctuations can be reduced. However, the best trade-off between stable T3 concentrations and small inconveniences for the patients is difficult to find.
These issues demonstrate that the existing treatment strategies of hypothyroidism are far from being optimal. One appealing alternative to tackle these issues is to consider a mathematical model of the pituitary-thyroid feedback loop and use it for model-based treatment design. In the pioneering work (14), the authors present a first procedure to determine optimal thyroid hormone replacement strategies based on the solution of one single optimal control problem. However, the applied mathematical model does not take into account a T3 synthesis which directly depends on the TSH concentration (here considered by the so-called TSH-T3 shunt, compare (15)). This aspect will be of crucial importance when comparing the L-T4 monotherapy to the L-T3/L-T4 combined therapy. Furthermore, the drug intake model is quantified by rather old data leading to considerably high thyroid hormone replacement dosages to treat hypothyroidism.
In (16), the authors address the question why some clinical studies document an advantage of the L-T3/L-T4 combined therapy compared to the L-T4 monotherapy, whereas other clinical studies do not document an advantage. The authors apply a mathematical model of the pituitary-thyroid feedback loop to estimate the residual thyroid function. Additionally, they propose optimal steady-state dosages for an L-T3/L-T4 combined therapy in dependence of the residual thyroid function. They formulate and partially validate two hypotheses to explain the different outcomes of the clinical studies. Loosely speaking, the first hypothesis states that patients benefit from the L-T3/L-T4 combined therapy, if their L-T3 dosages bring the T3 concentrations to the upper reference range of healthy individuals, whereas their L-T4 dosages normalize the T4 concentrations. The second hypothesis states that the residual thyroid function substantially influences the outcome of an L-T3/L-T4 combined therapy. However, compared to our work, no controller is developed to determine optimal dosages and no genetic variants are considered.
The authors in (17) propose a simplified mathematical model of the pituitary-thyroid feedback loop and illustrate the influence of different thyroid hormone replacement dosages on the hormone concentrations in the case of hypothyroidism. However, the applied model of that work does not consider the T3 concentrations. Consequently, no comparison between an L-T4 monotherapy and an L-T3/L-T4 combined therapy is possible. Furthermore, no oral intake of the thyroid hormone replacement dosages is considered but rather an “intravenous intake”. This procedure prevents an analysis of the intake frequency of the medication dosages on the thyroid hormone concentrations.
Recently, a clinical trial evaluated the treatment outcome of thyroidectomized patients when the responsible physician is supported by a decision aid tool (18). This tool is based on an individualized TSH-T4 relationship and a simple dynamic model for the course of free T4 (FT4). An optimal L-T4 steady-state dosage is determined by means of mathematical optimization and proposed to the treating physician. Again, the T3 concentrations (and consequently an L-T3 prescription) are not considered in the mathematical model and, additionally, the authors assume an “intravenous intake” of L-T4 for the computations of the optimal dosages.
In this work, we extend the mathematical model of the pituitary-thyroid feedback loop originally developed by (19) to consider the oral drug intake of L-T3 and L-T4. We then design a model predictive controller (MPC) for the pituitary-thyroid feedback loop to determine optimal thyroid hormone replacement strategies for both types of therapy, different genetic variants and different frequencies of drug intake.
This procedure leads to several contributions of this paper. First, the approach paves the way to improve the current trial-and-error process of prescribing thyroid replacement hormones, since the optimal dosages need not to be estimated by a physician, but can directly be determined by the controller. Second, simulations of both treatment strategies show that the L-T3/L-T4 combined therapy is slightly superior to treat hypothyroidism compared to the L-T4 monotherapy both in case without genetic variants and for genotype AA of polymorphism rs2235544 of gene DIO1. However, given genotype CC of polymorphism rs2235544, an L-T4 monotherapy can turn out to be advantageous compared to an L-T3/L-T4 combined therapy. An L-T3/L-T4 combined therapy can be beneficial in terms of the steady-state hormone concentrations for patients with the CC genotype of polymorphism rs225014 (also referred to as c.274A>G or p.Thr92Ala) of gene DIO2 for a T3 setpoint at the upper limit of the reference range of healthy individuals. Third, we analyze the impact of one, two, or three daily intakes of L-T3. Two daily intakes could be the best trade-off between stable T3 concentrations and a convenient therapy for the patient.
2 Methods
The basis of this work is a mathematical model of the pituitary-thyroid feedback loop. Loosely speaking, the (simplified) operating principle of this feedback loop is the following: the production of the thyroid hormones T3 and T4 is stimulated by TSH. Additionally, T4 is converted into T3 in peripheral organs and in the thyroid by means of 5’-deiodinase type I (D1) and 5’-deiodinase type II (D2). The production of TSH is inhibited by thyroid hormones and stimulated by thyrotropin-releasing hormone (TRH).
In this work, we consider a mathematical model of the pituitary-thyroid feedback loop which was originally developed in (19) and extended in (15, 20). It consists of six nonlinear differential equations describing the cause-effect relations between different hormone concentrations, compare Section S1 of the Supplementary Material for the exact definition of the differential equations. A more detailed explanation of this model and the underlying mechanisms can be found in (20, Supplementary Material). The complete mathematical model is illustrated in Figure 1.
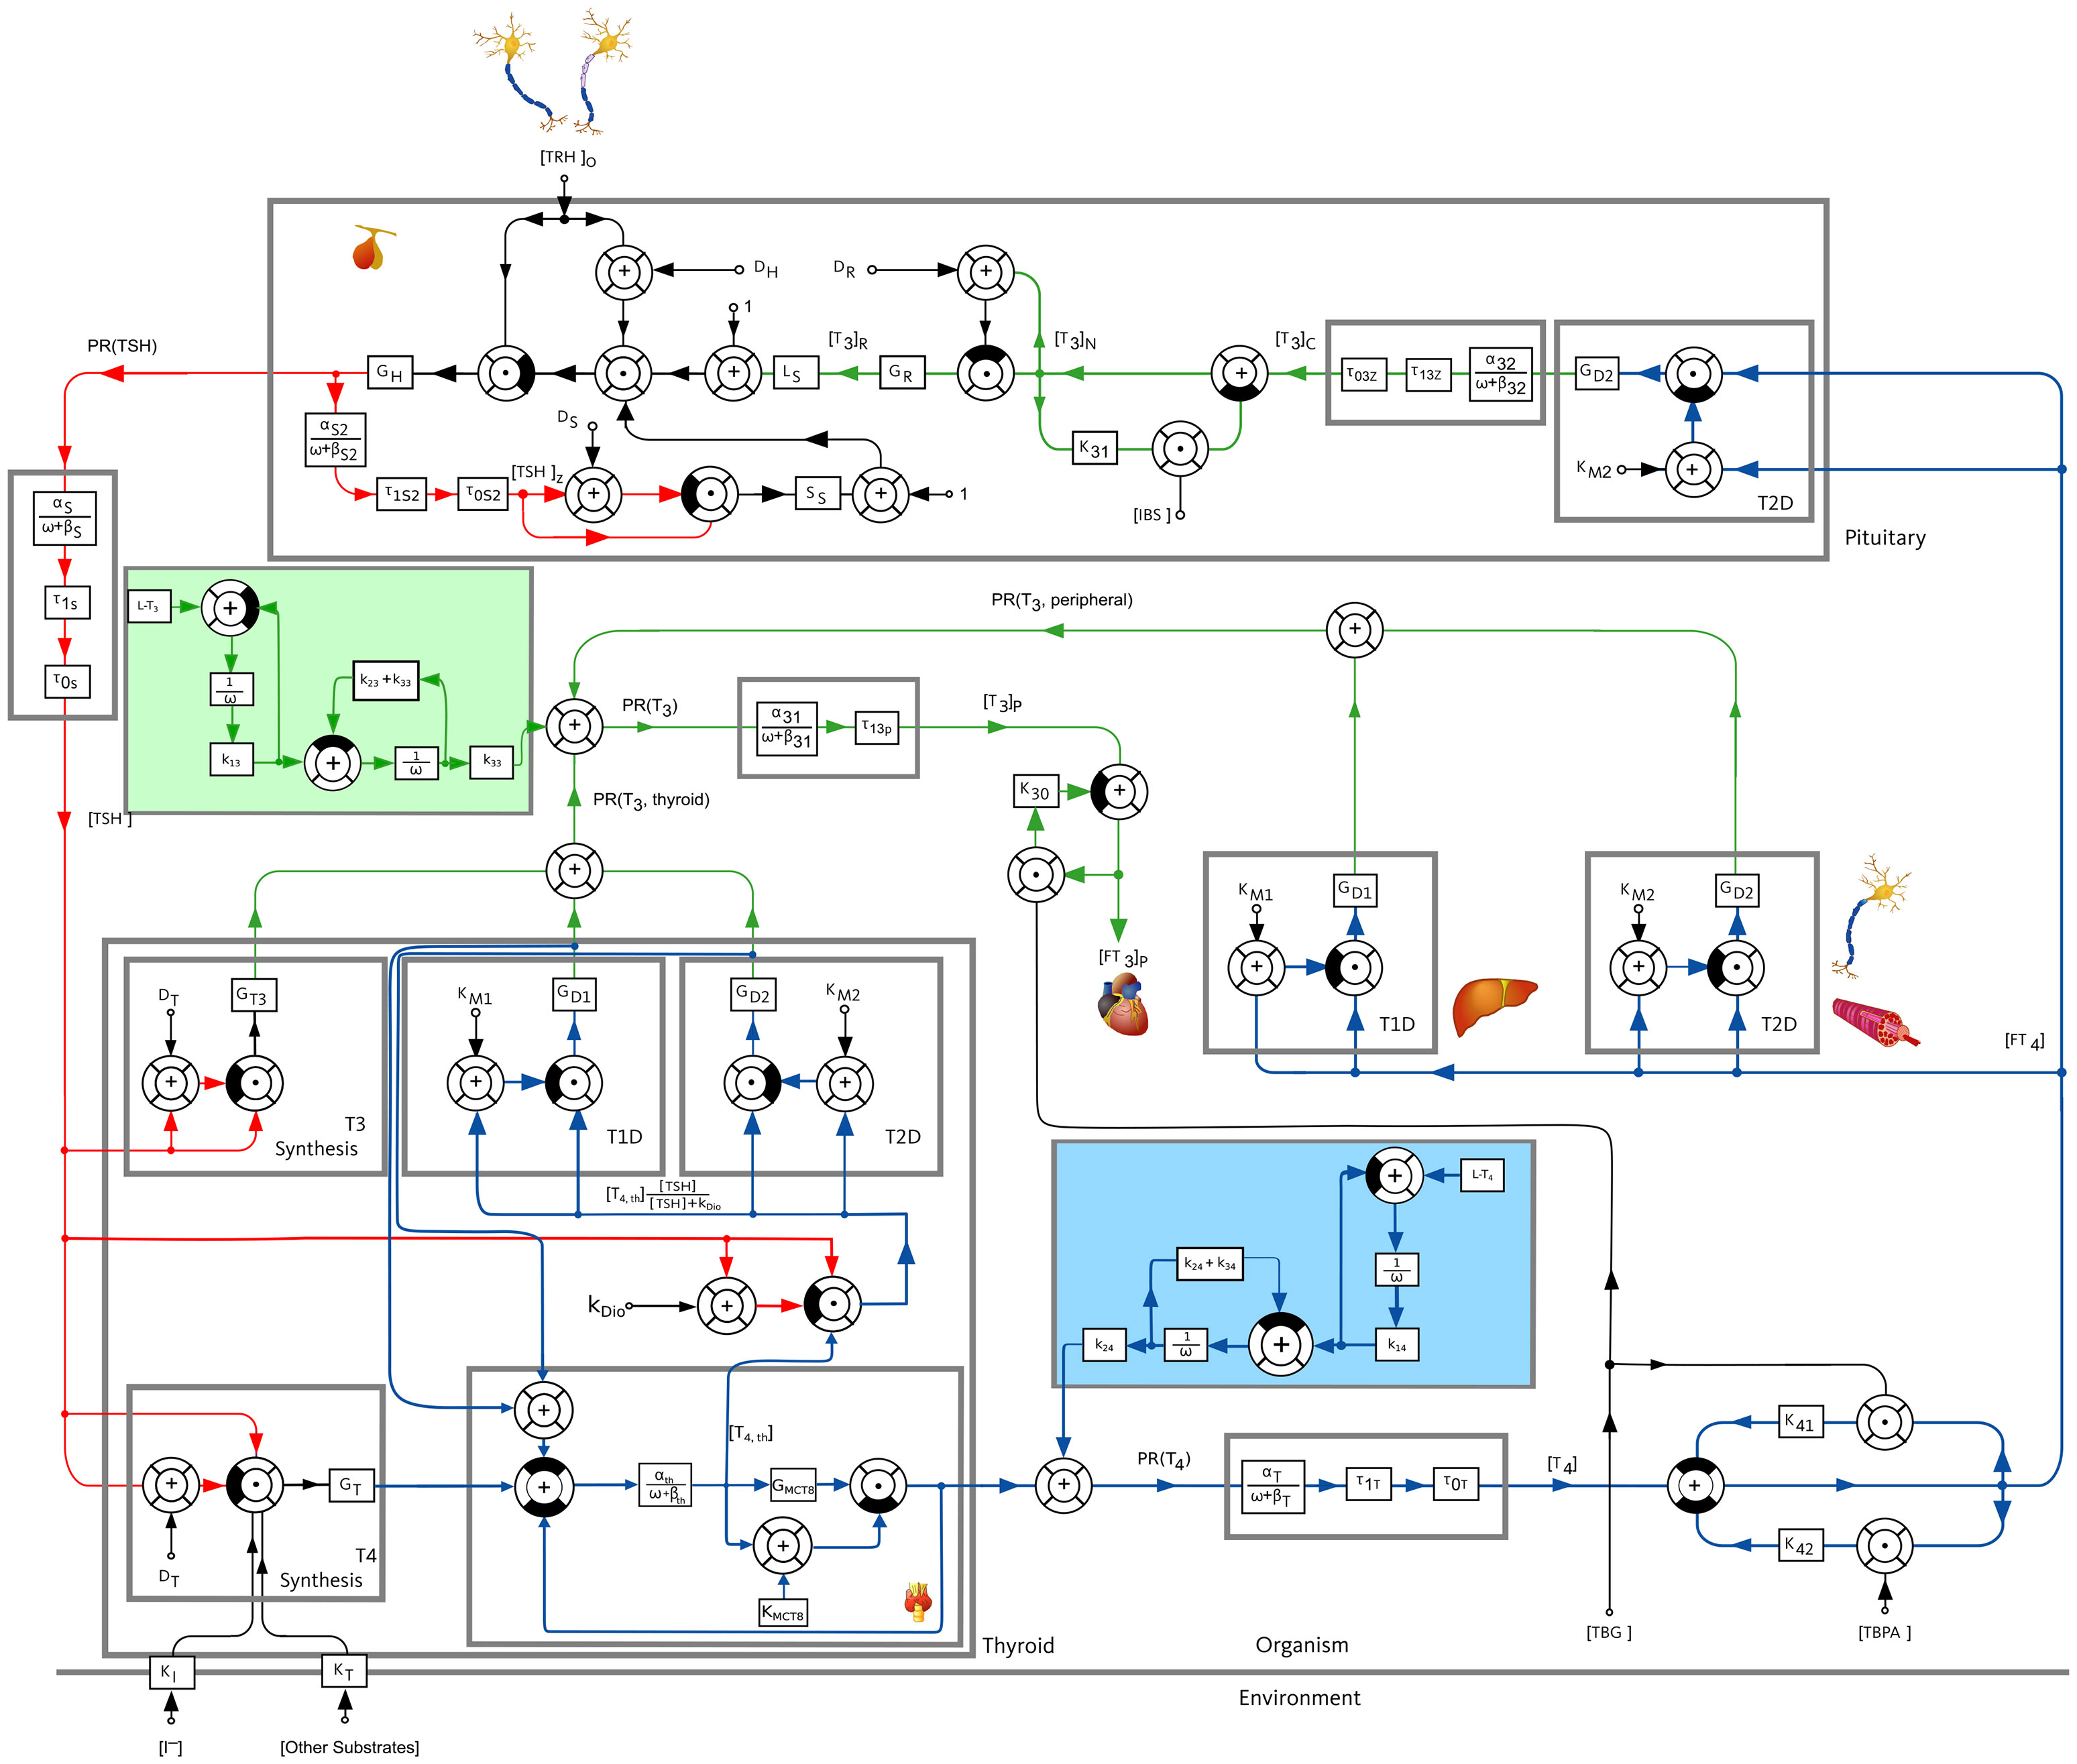
Figure 1 Block diagram of the pituitary-thyroid feedback loop. A detailed explanation of the model is given in (20, Supplementary Material). The underlying differential equations are shown in Section S1 of the Supplementary Material and the numerical parameter values are given in Section S4 of the Supplementary Material. The extensions of the mathematical model compared to the previous versions of the model, see (15, 19, 20), are shown by a slight blue and a slight green background color.
The first step of our work is to extend the mathematical model once again to be able to consider the oral medication intake of L-T3 and L-T4. To this end, we adopt the model used in (14), a two compartment model describing the intake, dissolution and absorption of thyroid replacement hormones. By means of a least-squares fit, we fit the numerical values of the constants k1i (dissolution rate constant), k2i (direct gut-excretion rate constant) and k3i (absorption rate constant) to the more recent results documented in (21), rather than to the ones used by (14), namely (4). In (21), the authors document a dependence of the bioavailabilities of L-T3 and L-T4 on the thyroid state of the patient (euthyroid, hypothyroid, hyperthyroid). Throughout this work, we apply the bioavailability of euthyroid individuals. In addition, we perform simulations using the bioavailability of hypothyroid patients which demonstrate that the results remain qualitatively the same for both bioavailabilities (compare Section S3.3 of the Supplementary Material). Nevertheless, an interesting topic for further research would be to dynamically adapt the bioavailabilities in dependence of the thyroid state. The extensions of the model are shown in Figure 1 with a slight green and blue background color regarding the intake of L-T3 and L-T4, respectively. The exact numerical parameter values of the oral medication intake model as well as of the complete mathematical model are shown in Section S4 of the Supplementary Material.
In its original form, the mathematical model represents generic euthyroid healthy individuals, since the parameters of the model are either well-known quantities (such as the half-life of thyroid hormones) or fitted to serum thyroid function tests of healthy individuals see (20). Hypothyroidism can be considered in the mathematical model by choosing a smaller value for the secretory capacity of the thyroid gland (GT) (15). In this work, we choose a secretory capacity of the thyroid, which represents 10 % of the one of healthy individuals. Note that the secretory capacity of thyroidectomized hypothyroid patients would correspond to GT = 0. Furthermore, the parameter GT could also be determined individually by means of the method SPINA- GT (22). Therefore, extending the results presented here for generic hypothyroid patients to individual patients by fitting GT and other model parameters as GD1 (maximum activity of D1) and GT3 (maximum activity of direct T3 synthesis) to individual patient data is an interesting topic for future research; we emphasize that the main findings of the paper are qualitatively the same for other values of GT (and GD1, GT3) compare Section S3.1 of the Supplementary Material for further simulation results considering different numerical values of GT than the one used in the main part. For the sake of brevity, the simulation results regarding different GD1/GT3 parameter configurations are not shown here.
Next, we focus on how optimal dosages of the L-T4 monotherapy and the L-T3/L-T4 combined therapy can be determined. To this end, we make use of MPC, which is one of the most successful modern control methods (23). The potentially most important advantage is that constraints can be incorporated in the design of the controller, which is typically not the case for other control methods. Loosely speaking, the principle of MPC is the following: at each sampling instant, the optimal input trajectory with respect to a cost function is determined by predicting the system’s behavior over a specific time into the future. Only the first element of the optimal input trajectory is then applied to the system and the system’s state is measured again. This procedure is repeated until a predefined number of iterations is elapsed. In our case, the cost function denotes a weighted quadratic difference between the hormone concentrations T3, T4, and TSH and their equilibrium hormone concentrations of generic healthy individuals1 (the setpoint to be reached via medication intake), compare Section S2 of the Supplementary Material for a detailed mathematical description of the MPC setting and further comments on the design of MPC.
As mentioned in the previous section, we want to analyze the effect of specific genetic variants on the outcome of both types of therapy. In this work, we focus exemplarily on polymorphism rs2235544 in gene DIO1 encoding D1, which is associated with different D1 activities in dependence of the number of C-allele (24). To model such genotypes, we exemplarily reduce and increase the maximal activity of D1 (named GD1 that was determined by means of real thyroid hormone measurements of healthy individuals, compare footnote 1) in the mathematical model by 10 %. In other words, the genotype AA of polymorphism rs2235544 is modeled by reducing GD1 to GD1'=0.9GD1 and the genotype CC of polymorphism rs2235544 is modeled by increasing GD1 to GD1''=1.1GD1. In addition, we consider the case in which the CC genotype is modeled by GD 1'''=1.2GD 1, which yields additional insight regarding the evaluation of the therapies. We determine optimal thyroid hormone replacement strategies based on an L-T4 monotherapy and an L-T3/L-T4 combined therapy for these three cases. In addition, we consider the genotype CC of polymorphism rs225014 that is associated with a decreased D2 activity (25) and with an improved response (in terms of symptoms) to the L-T3/L-T4 combined therapy (26). To model this variant, we reduce exemplarily GD2 to GD2'=0.6GD2, corresponding to the results documented in (25).
Finally, we analyze the optimal frequency of medication intake. In general, a higher frequency of medication intake, e.g., two daily drug intakes instead of one daily drug intake result in more stable hormone concentrations. This is advantageous since variations of the thyroid hormone concentrations lead to an increased cardiovascular risk (27). However, a higher frequency of medication intake is less convenient for the patient. Therefore, we consider the cases when the daily dosage is taken once, twice, or three times per day. A good medication outcome should result in hormone concentrations that are as monotone as possible and not fluctuating too much. Regarding the transient phase, it means that the hormone concentrations shall rise as smoothly as possible, until the desired euthyroid setpoint is reached. After reaching the desired euthyroid setpoint, the hormone concentrations shall stay as constant as possible. Both effects can be captured by calculating how much the hormone concentrations decrease within one day, compare Table 1 in Section 4.1 for the exact formula.
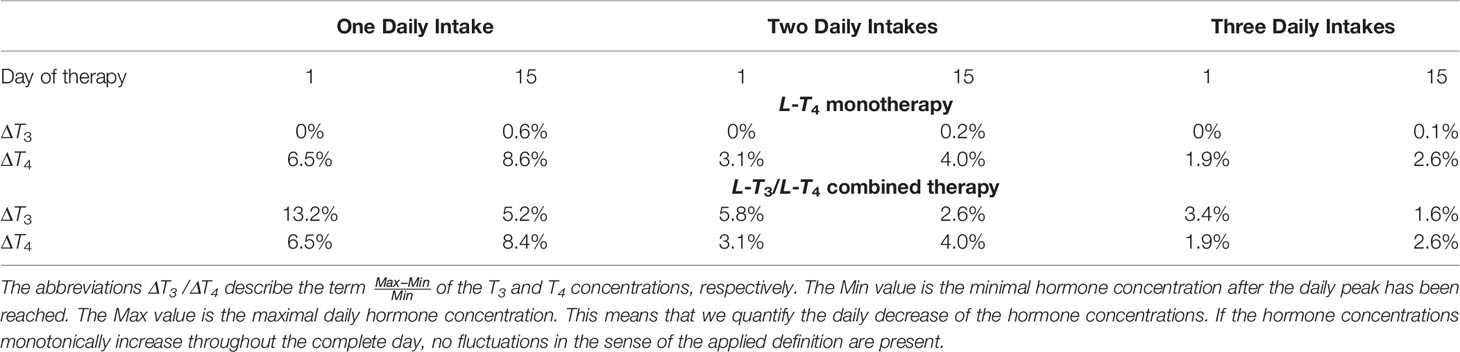
Table 1 Effects of the frequency of medication intake on the fluctuations of the T3 and the T4 concentrations for the first and the 15th day of therapy regarding the L-T4 monotherapy and the L-T3/L-T4 combined therapy.
Throughout this work, we consider a constant TRH concentration, compare Section S4 of the Supplementary Material for the exact numerical value. Obviously, a constant TRH concentration is an approximation of the real pulsatile TRH course. This approximation can be used in this work because mainly TSH is affected by the course of TRH (15). Here, we are interested in the concentrations of T3 and T4, which are only slightly affected by the pulsatile TRH course (15).
3 Results
First, we focus on the simulations of the L-T4 monotherapy and the L-T3/L-T4 combined therapy for hypothyroid patients2 for one daily drug intake. Second, the simulated treatment of different genetic variants is shown. Third, the results regarding the impact of the frequency of medication intake are presented. Note that the hormone concentrations are in their (hypothyroid) steady state prior to the beginning of the thyroid hormone replacement therapies.
The results were obtained by means of a standard PC (Intel(R) Core(TM) i7-10875H CPU @ 2.30GHz (16 CPUs) processor with 16 GB RAM) using MATLAB/Simulink®, version 9.10.0.1684407 (R2021a), CasADi (28) and the NLP solver IPOPT (29).
3.1 L-T4 Monotherapy
In Figure 2, the results of the L-T4 monotherapy are illustrated for one daily intake, meaning that the simulated treatment considers one daily intake of L-T4. In Figure 2A, the course of the hormone concentrations over 15 days is illustrated by the continuous lines. The dashed lines represent the setpoints of the considered euthyroid generic healthy individual. Figure 2B illustrates the corresponding amount of L-T4 for each day. The hormone concentrations do not reach their desired setpoints. The concentration of T4 remains slightly higher, and the concentrations of TSH and T3 remain slightly lower than their respective setpoints. The concentrations of T4 and TSH fluctuate strongly compared to the concentration of T3. A high starting dosage (400 µg L-T4) followed by a steady-state dosage (130 µg) are optimal. The nonlinear decrease of the TSH concentrations is due to the nonlinear dependence of T4 and TSH, compare eqs. (S4), (S5), (S8), and (S9) in the Supplementary Material.
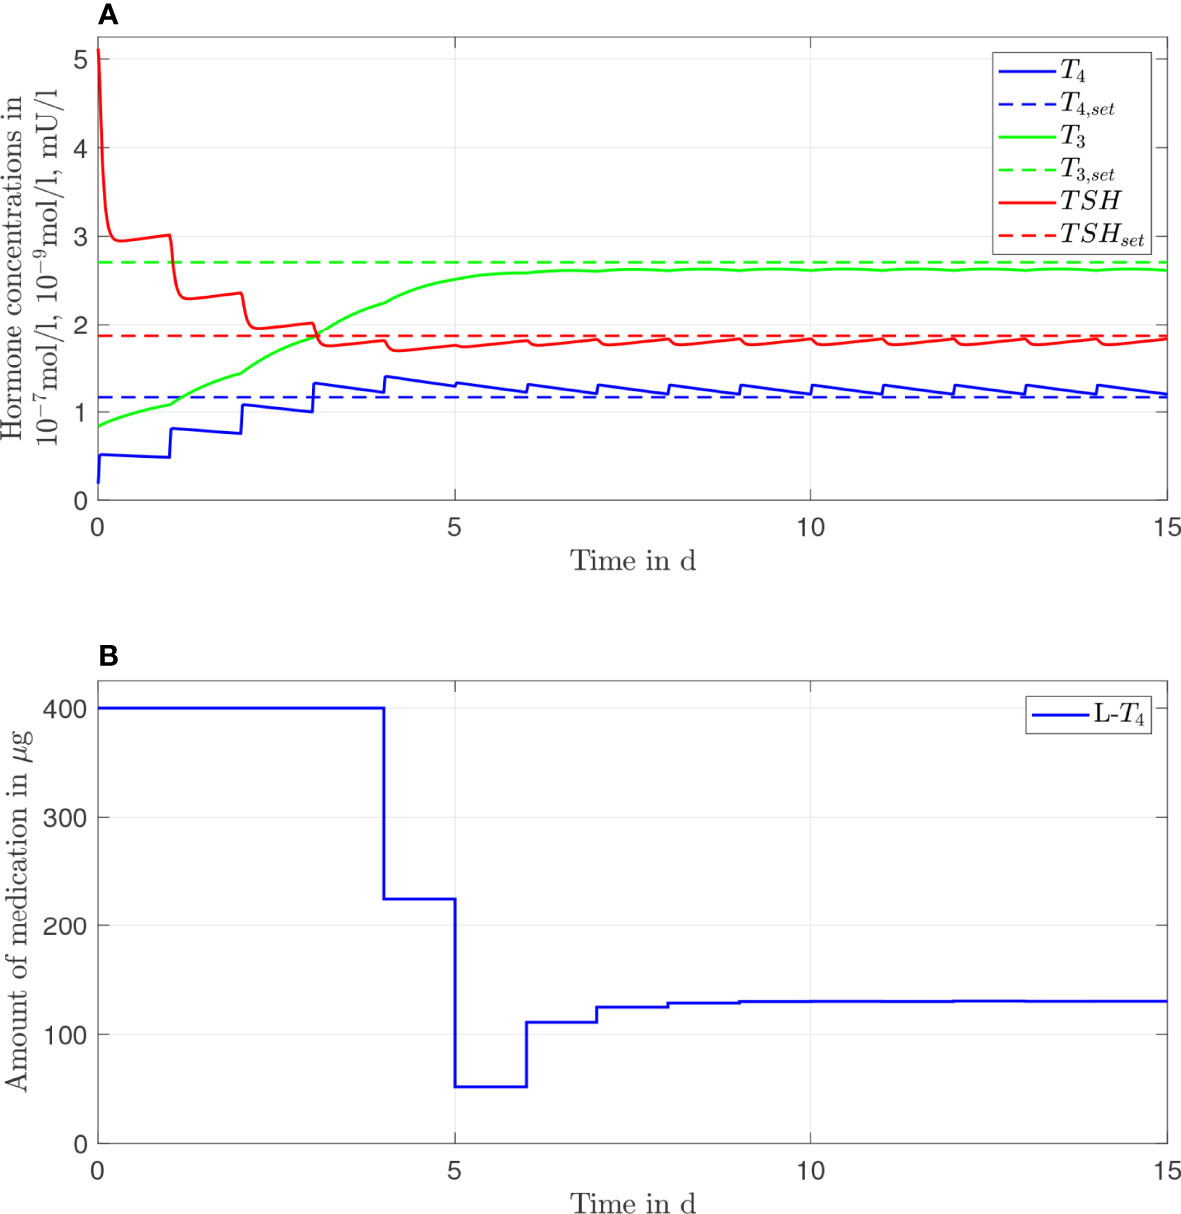
Figure 2 Simulation results of an L-T4 monotherapy for a generic hypothyroid patient. The hormone concentrations (A) result from the application of the thyroid hormone replacement dosages (B), which are determined by means of an MPC.
3.2 L-T3/L-T4 Combined Therapy
In Figure 3, the simulation results of the L-T3/L-T4 combined therapy are illustrated for one daily intake. In contrast to the L-T4 monotherapy, the setpoint is reached for all hormone concentrations (taking into account the unavoidable daily fluctuations), no persisting offset between the hormone concentrations and their setpoints can be seen. The fluctuations of the hormone concentration of T3 are higher, whereas the fluctuations of T4 and TSH are similar compared to the L-T4 monotherapy. Again, high starting dosages (400 µg of L-T4 and 30 µg of L-T3) followed by steady-state dosages (121 µg of L-T4 and 4.7 µg of L-T3) are optimal.
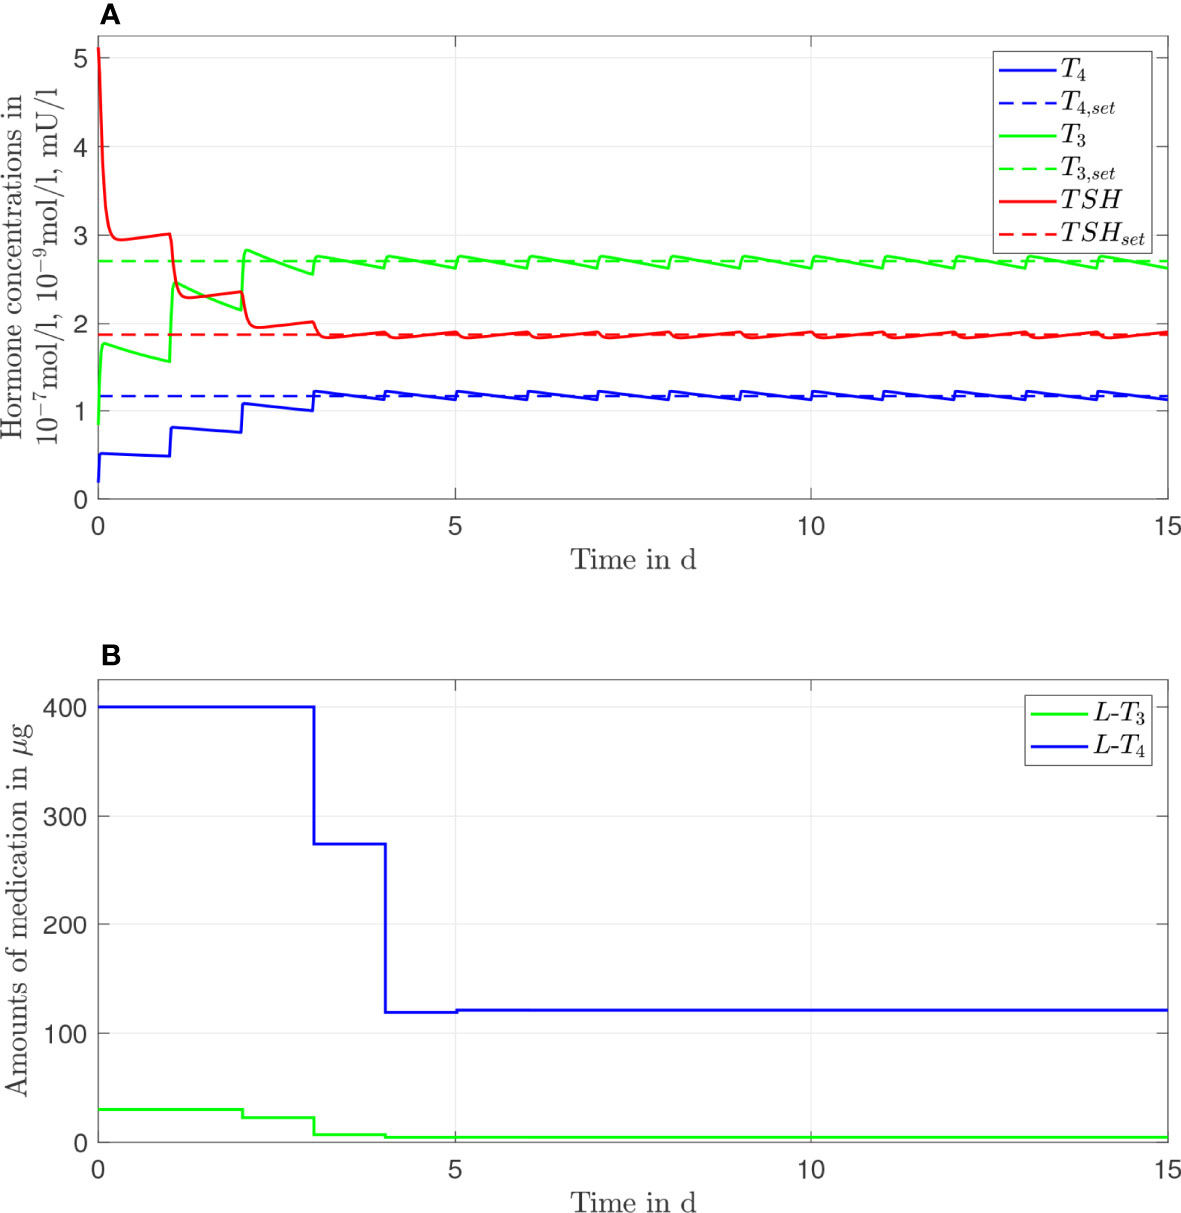
Figure 3 Simulation results of an L-T3/L-T4 combined therapy for a generic hypothyroid patient. The hormone concentrations (A) result from the application of the thyroid hormone replacement dosages (B), which are determined by means of an MPC.
3.3 Genetic Variants
In this section, the results of both therapies for different genetic variants are shown. In Figures 4–6, we consider GD1'=0.9GD1, GD1''=1.1GD1, GD 1'''=1.2GD 1, respectively. The left column plots illustrate the results of the L-T4 monotherapy and the right column plots show the results of the L-T3/L-T4 combined therapy. As mentioned in the previous section, the adapted numerical values represent exemplarily different genotypes.
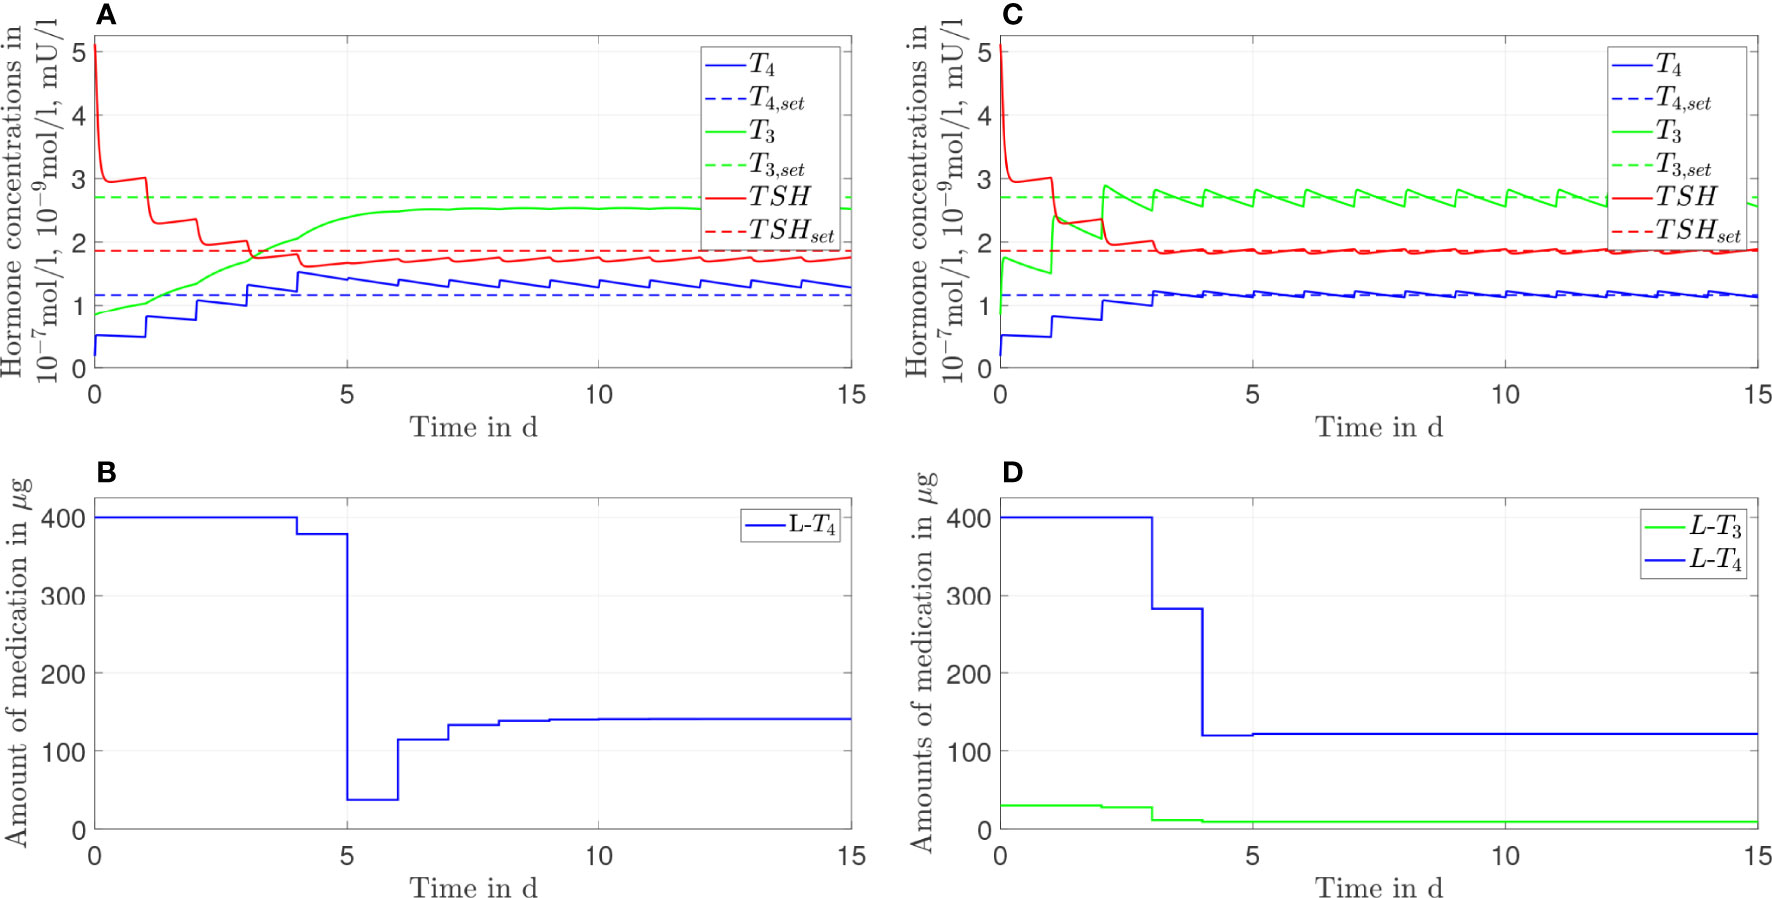
Figure 4 Simulation results of an L-T4 monotherapy (A, B) and an L-T3/L-T4 combined therapy (C, D) for G'D1 = 0.9GD1.
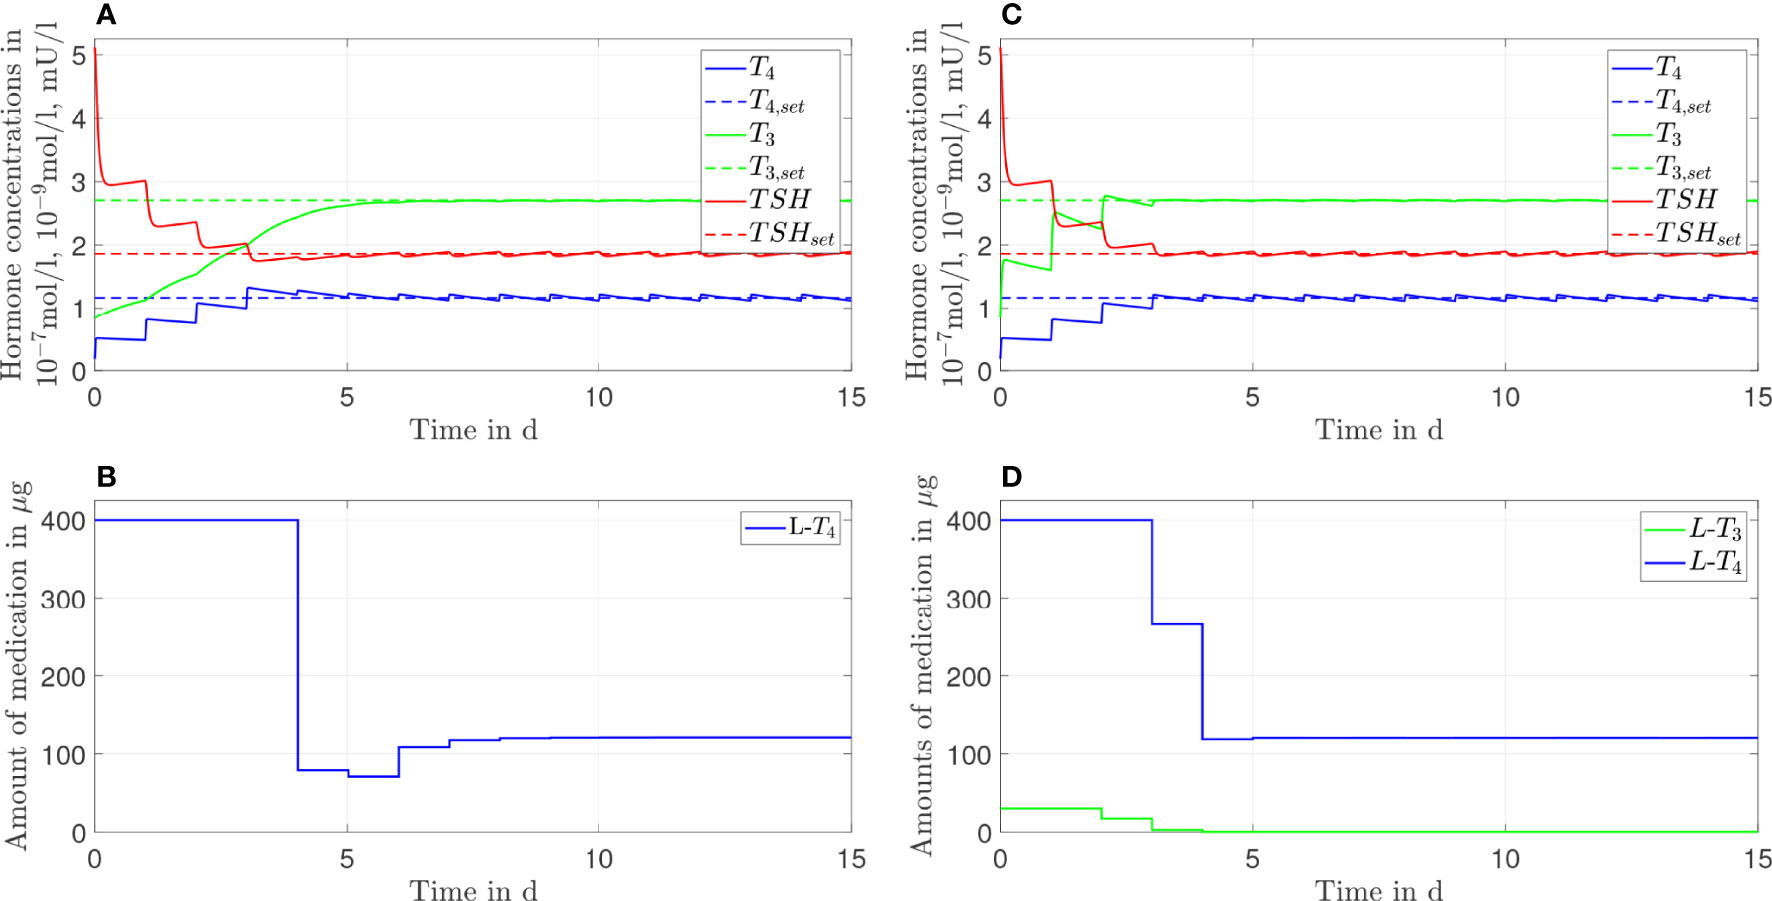
Figure 5 Simulation results of an L-T4 monotherapy (A, B) and an L-T3/L-T4 combined therapy (C, D) for G''D1 = 1.1GD1.
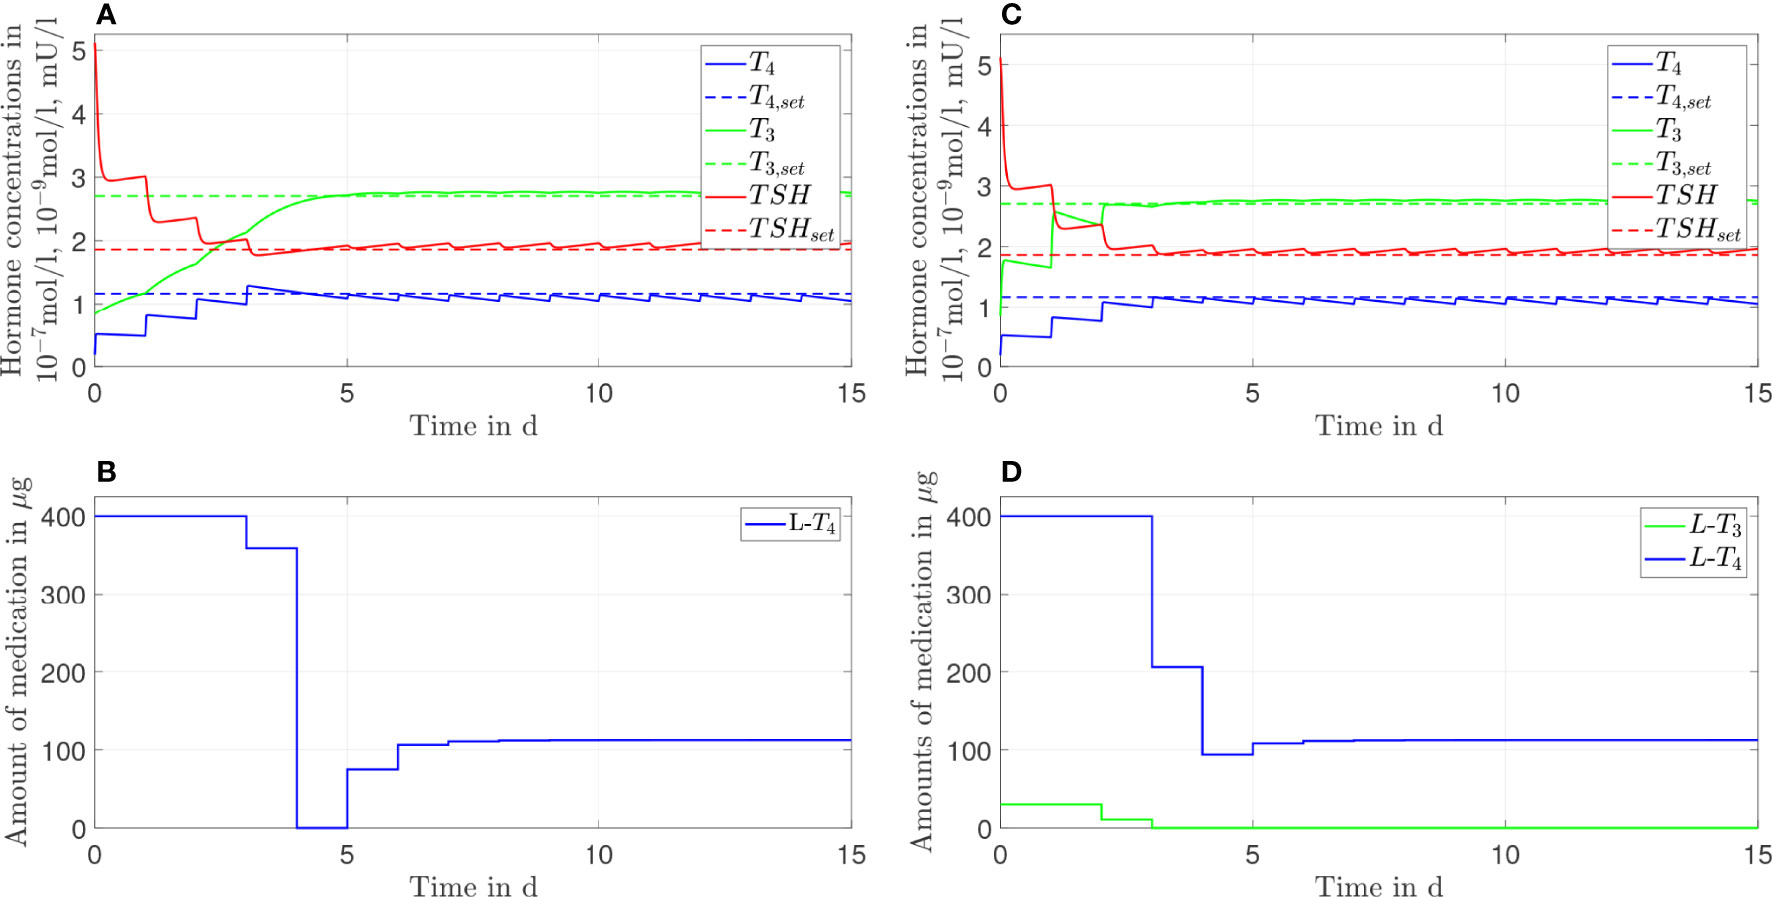
Figure 6 Simulation results of an L-T4 monotherapy (A, B) and an L-T3/L-T4 combined therapy (C, D) for G'''D1 = 1.2GD1.
The L-T4 monotherapy does not restore the setpoint of healthy individuals for the case GD1'=0.9GD1 (compare Figures 4A, B). There is a substantial offset visible between the T3, T4, and TSH concentrations and their euthyroid setpoints. This offset is higher compared to the case when no genetic variant is considered, compare Figure 2. In turn, the L-T3/L-T4 combined therapy restores the euthyroid setpoint of healthy individuals up to some daily fluctuations.
In the case of GD1''=1.1GD1 (compare Figure 5), not only the L-T3/L-T4 combined therapy but also the L-T4 monotherapy reaches the euthyroid setpoint. In contrast to the L-T4 monotherapy, the L-T3/L-T4 combined therapy goes along with high fluctuations of T3 during the first days of therapy.
In the last case, where GD 1'''=1.2GD 1, the L-T4 monotherapy and the L-T3/L-T4 combined therapy lead to similar results. Both therapies reach the setpoint up to some small offset; the concentrations of T3 and TSH are slightly higher than their respective setpoints whereas the concentration of T4 remains slightly lower than the respective setpoint, which is the opposite situation to Figure 2. In Figure 6D, one can see that after day three no L-T3 is needed to remain in the steady state. Therefore, the L-T3/L-T4 combined therapy reduces to an L-T4 monotherapy. For the sake of brevity, the results concerning the CC genotype of polymorphism rs225014 are shown in Figures 7, 8 of the Supplementary Material. These figures illustrate that the L-T3/L-T4 combined therapy results in better steady-state hormone concentrations, if the T3 setpoint is set to the upper limit of the reference range of healthy individuals. Additionally, the euthyroid setpoint is reached earlier in case of the L-T3/L-T4 combined therapy.
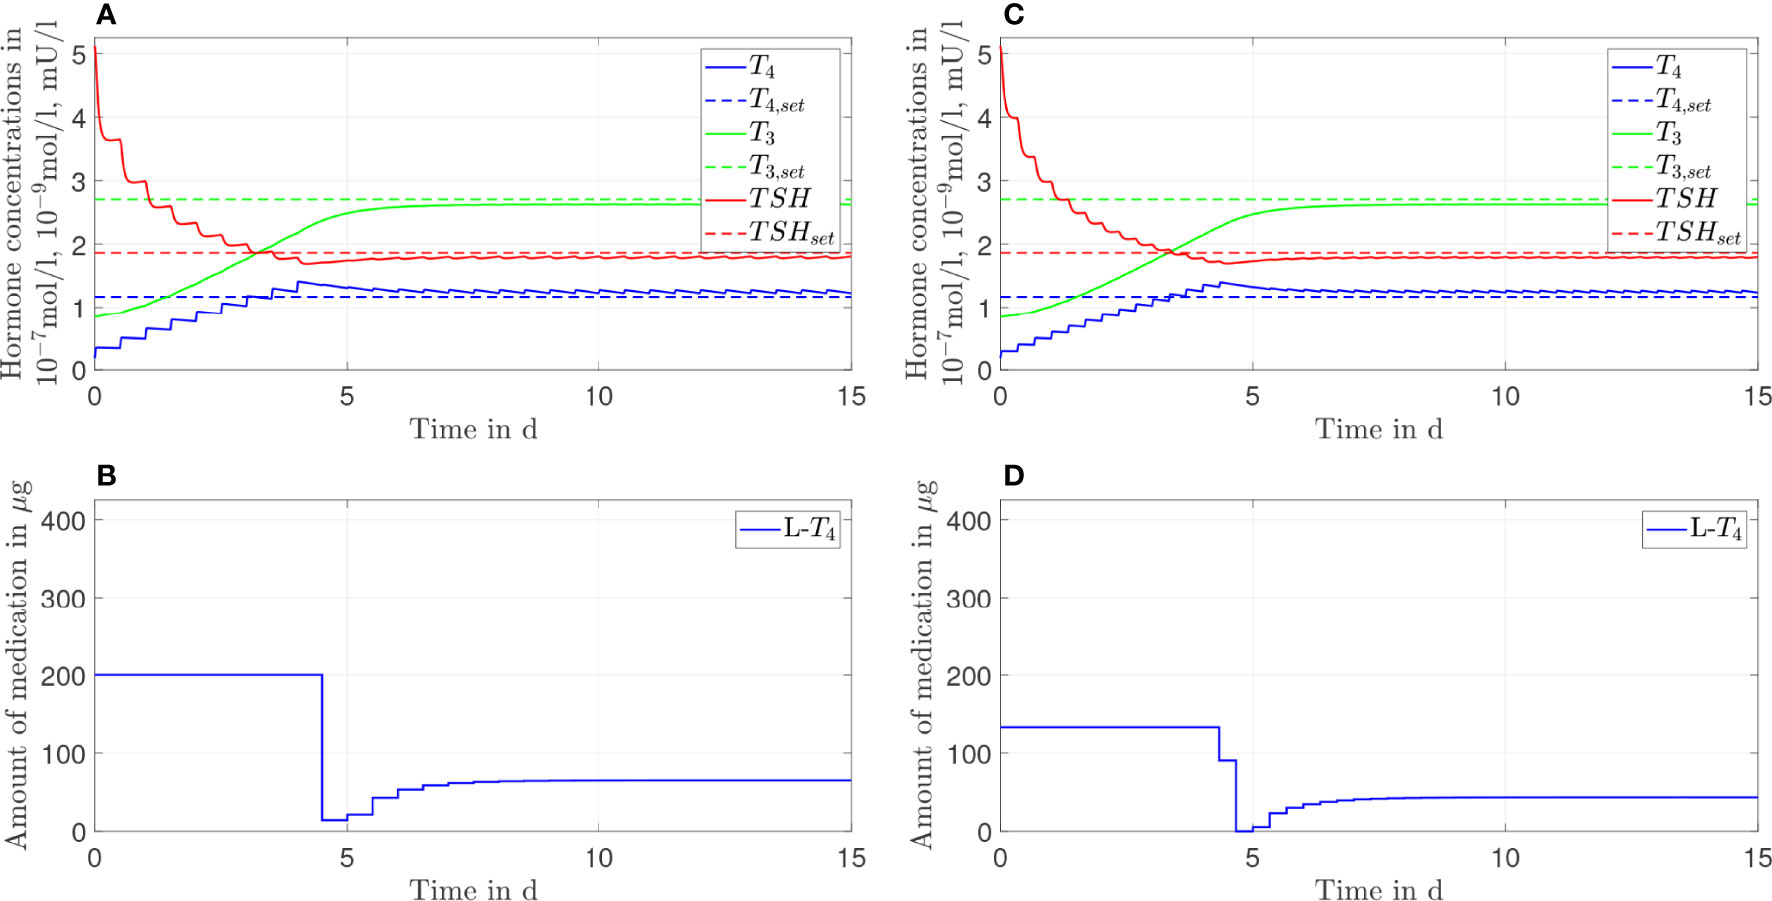
Figure 7 Simulation results of an L-T4 monotherapy in which the patient takes in a drug two times (A, B) or three times (C, D) a day.
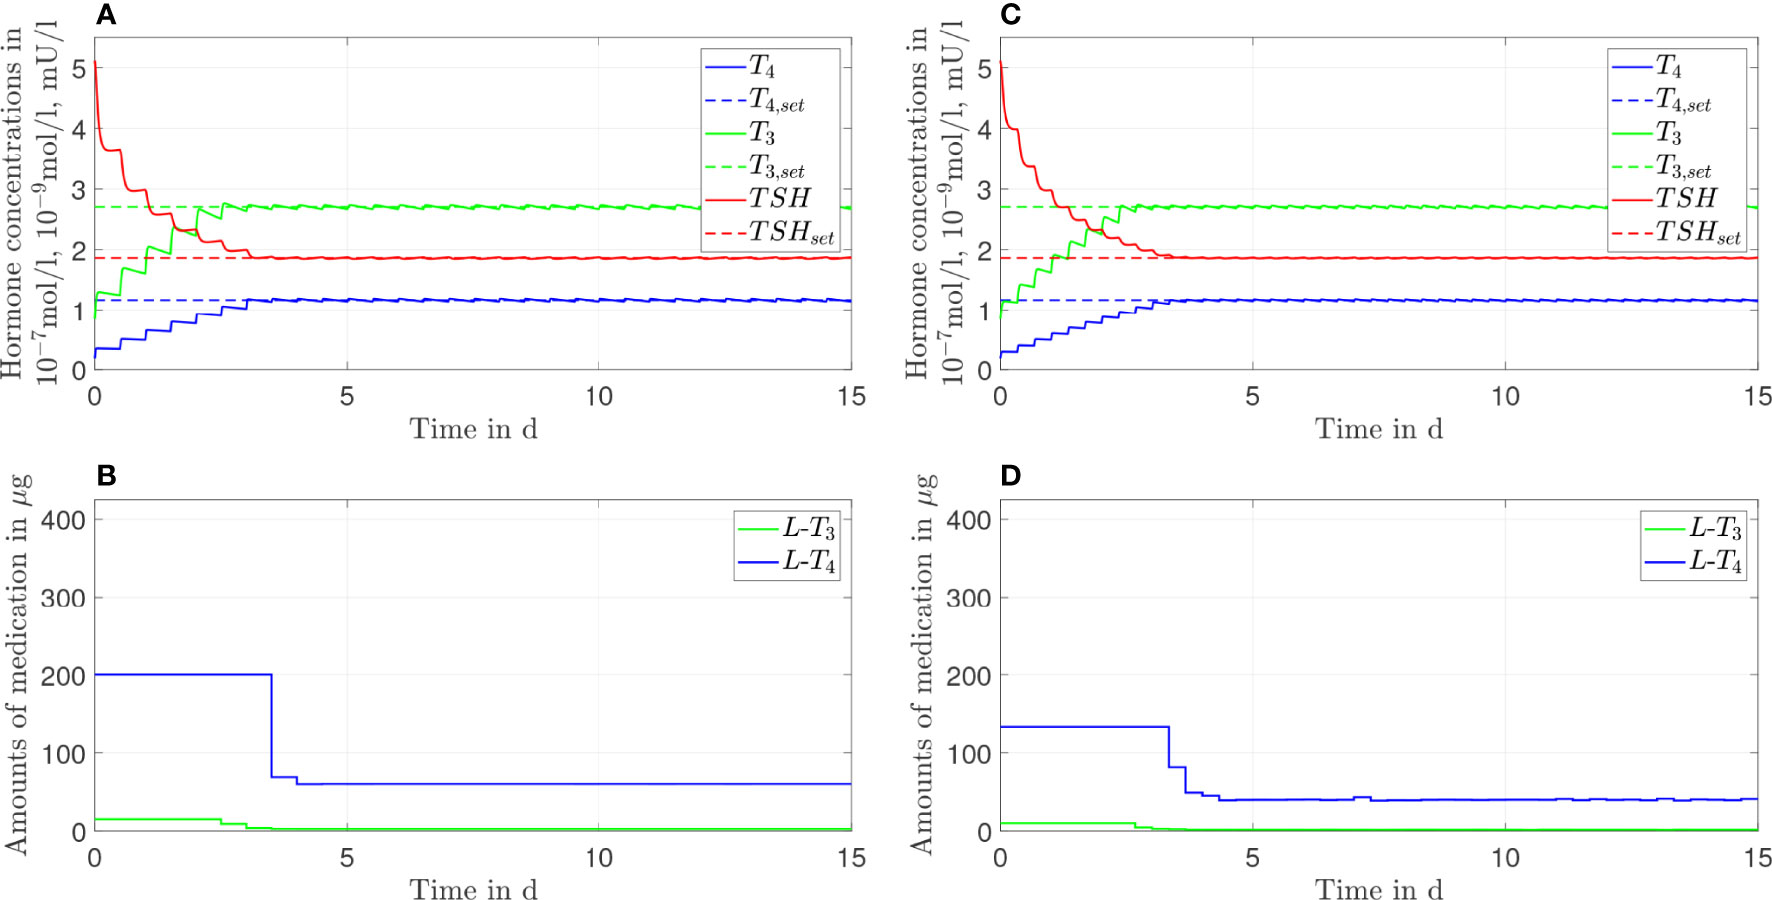
Figure 8 Simulation results of an L-T3/L-T4 combined therapy in which the patient takes in a drug two times (A, B) or three times (C, D) a day.
3.4 Frequency of Medication Intake
In this section, we show the results of the analysis regarding the frequency of medication intake. Here, we do not consider genetic variants. We compare one, two, and three daily intakes. Since Figures 2, 3 already show the results for one daily intake, Figures 7, 8 complement the cases for two and three daily intakes. Table 1 summarizes the effects of each frequency of intake for both types of therapy. Exemplary, we analyze the first day and the last day of therapy, which are representative for the transient phase and the steady state.
In general, concerning both types of therapy, an increasing number of medication intakes reduces the fluctuations of all hormone concentrations. In particular, we focus on the concentrations of T3. Regarding the L-T4 monotherapy (compare Figures 2, 7), the T3 concentrations do not fluctuate and smoothly increase until the steady state is reached.
In turn, the T3 concentrations fluctuate substantially concerning the L-T3/L-T4 combined therapy (see Figures 3, 8). These fluctuations are higher in the transient phase and smaller in the steady state. The strongest fluctuations occur for one daily intake.
Note that the small variations of the L-T4 dosage (after the steady state has been reached) regarding three daily medication intakes (compare Figure 8D) are due to numerical issues and not due to medical reasons. We need to solve a highly nonlinear optimization problem where the solver can be stuck in local minima.
4 Discussion
4.1 Prescription Policy
As mentioned in the introduction, one difficulty of the current treatment strategies is the trial-and-error process in order to find the correct individual dosage. The here presented procedure represents the first step to improve this (potentially unnecessary) trial-and-error process. For a generic hypothyroid patient, the daily dosages can directly be adopted from the simulation results of the MPC. In contrast to (18), the MPC does not only compute an optimal steady-state dosage but also optimal dosages regarding the transient phase of the therapy.
Furthermore, the usage of an MPC provides the opportunity to adapt the dosage much earlier, if necessary. In Figures 2, 3, one can see that the steady-state hormone concentrations are reached within the first week of the start of the therapy. Therefore, if the resulting thyroid hormone replacement strategy does not yield to the desired outcome, one can adapt the dosage(s) already after one or two weeks, as it is also suggested in (18). It is not necessary that the adaptation is made after 4-6 weeks, as it is currently recommended (1).
Another interesting aspect is the tendency that high dosages at the beginning of the therapy followed by lower dosages are optimal. In the past, some experts suggested that the treatment strategy should start with low dosages and should be continued by increasing the dosages only slowly (sometimes designated as “start low go slow” policy), especially for elderly patients (1, 30). However, this strategy seems outdated for cardiac asymptomatic patients (31). The results presented here underline once again the advantageous effects of high starting dosages: the setpoint is reached much faster with this policy than by following the “start low go slow” policy. These considerations apply especially to myxoedema coma, the most severe complication of hypothyroidism. The question of optimal substitution treatment remains controversial (32), and the modality of optimum treatment continues to be uncertain, mainly due to the low number of clinical studies and inherent difficulties in performing controlled trials. The population at risk from myxoedema coma predominantly includes elderly subjects and patients suffering from cardiovascular disease, thereby suggesting that the dosage should be escalated slowly. However, several case series and small studies reported it to be beneficial to start with a single high-dose intravenous bolus of 500 µg and to continue with a maintenance dose of 50 to 100 µg daily (33, 34).
One important long-term perspective of this work is to translate these results into clinical practice. Before this translation can be realized, two issues must be considered. First, the optimal dosages determined by means of the MPC may not be available in form of a commercial product. Second, the medication dosages should not be adapted every day. As visible in Figure 2B, the results of the MPC suggest that the (generic) patient should take in 400 µg of L-T4 for the first four days. In the following days, the patient should take in several different dosages before a constant dosage of approximately 130 µg of L-T4 should be taken in. In clinical practice, one might simply prescribe 400 µg of L-T4 for the first four days. Subsequently, one could directly prescribe the closest commercially available dosage to 130 µg of L-T4. Following this procedure, one only adapts the dosage once and additionally only uses dosages that are available in form of a commercial product. An additional issue must be considered regarding the prescription of L-T3. Currently, the commercially available L-T3 dosages are remarkably higher than the dosages that are recommended in clinical guidelines and that are determined in this work. For example, in Germany, the available L-T3 medications such as Thybon® 20 or the combined L-T3/L-T4 preparation Prothyrid® contain 20 µg or 10 \mu\g of L-T3, L-T3 respectively. These dosages are approximately four times or two times higher compared to the optimal dosages determined by means of the MPC in this work. Therefore, the implementation of our work (and of the mentioned guidelines) in clinical practice imperatively requires the availability of pharmaceutical preparations containing lower dosages of L-T3.
Most practicing physicians are familiar with the prescription of the dosages regarding an L-T4 monotherapy. However, they are potentially not familiar with the prescription of L-T3 making the treatment with an L-T3/L-T4 combined therapy challenging. Possible guidelines for physicians are given by the European Thyroid Association (13). Four alternative formulas are given, but no preference regarding one formula is mentioned. Consequently, the treating physician decides the formula so far. We provide assistance to this decision by comparing the formulas of (13) to our simulation results. The formulas in (13) are based on a prior treatment with L-T4 that normalizes the thyroid hormone concentrations, which would be in our case around 130 \mu \g, compare Figure 2. The resulting dosages for the L-T3/L-T4 combined therapy of the four different formulas are given in Table 2. The dosages regarding an L-T3/L-T4 combined therapy determined by means of the MPC are approximately 121 µg of L-T4 and 4.7 of L-T3. By comparing these dosages to the ones given in Table 2, one can conclude that the simulation results fit best to formula B2. This suggests that from the four different methods proposed in (13), formula B2 seems to be the best strategy.
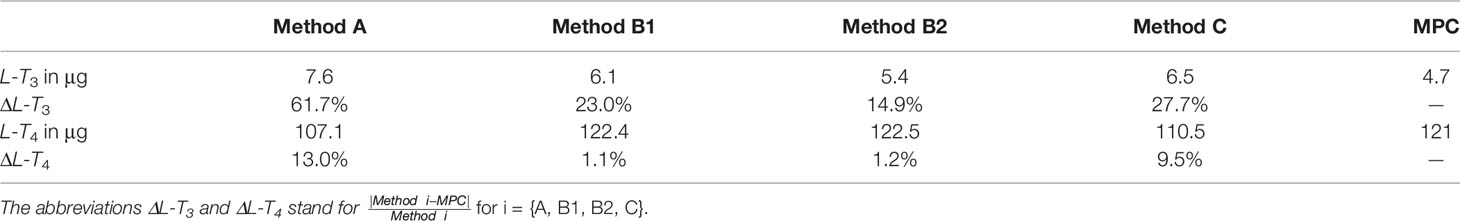
Table 2 Recommended dosages regarding an L-T3/L-T4 combined therapy based on a prior treatment with an L-T4 monotherapy (here with 130 µg of L-T4) and the four different formulas given in (13).
So far, we only considered a generic hypothyroid patient. A matter of ongoing research deals with a reliable individualization of the mathematical model. When this is the case, the treatment strategies obtained by applying the MPC will be optimal individual strategies. This would clearly pave the way into the era of personalized medicine. In a first clinical trial exploiting the advantages of mathematical modeling to determine optimal dosages, the importance of an individualized model is pointed out (18). However, the individualization of our complex model is currently not straight-forward, one problem in this context is that some model parameters cannot be identified uniquely based on only few individual hormone measurements (15, 20). This issue could potentially be resolved using more frequently measured (dynamic) hormone data as available in (18), compare the discussions in (15) and (20), which is subject of future work.
Interestingly, clinical studies such as (35) document that athyroid patients that are treated with an L-T4 monotherapy have higher T4 but similar T3 concentrations compared to the patients’ prethyroidectomy concentrations. Higher T4 concentrations in the case of the L-T4 monotherapy are also visible in the simulations of the mathematical model, compare Figure 2. However, the simulations show slightly decreased concentrations of T3 compared to the concentrations of healthy individuals, see Figure 2. This can be explained by the design of the MPC (compare Section S2 of the Supplementary Material). The objective is to reach simultaneously the euthyroid steady-state concentrations of T3, T4 and TSH leading to a trade-off between too high T4 and too low T3 concentrations. If one chooses a cost function that penalizes solely the deviation of T3 from its steady state, the result is a T3 conncentration similar to the setpoint of healthy individuals and a higher concentration of T4 than the one observed in Figure 2 as reported in (35). For the sake of brevity, the corresponding simulation results are illustrated in Section S3.2, Figure 3 of the Supplementary Material. Additionally, that section contains simulation results with cost functions that penalize mainly the deviations of T4 or TSH from their euthyroid setpoints. These results illustrate that the course of the hormone concentrations depends on the tuning of the weighting matrix Q, compare Figures 4 and 5 of the Supplementary Material.
Note that the authors in (16) underline the importance of high serum T3 concentrations for a successful outcome of the L-T3/L-T4 combined therapy. This objective could be easily met by adapting the cost function of the MPC so that the difference between the measured hormone concentrations and the upper limit of the reference range is penalized. In addition, for patients affected by differentiated thyroid cancer a cost function that solely penalizes the T3 concentrations can be benefical, since for these patients the free T3 (FT3) concentratios are particulary important for the relief of symptoms, compare (36).
4.2 Comparison L-T4 Monotherapy With L-T3/L-T4 Combined Therapy
As mentioned in the previous section, the L-T4 monotherapy can only approximately restore the setpoint of healthy individuals (with some remaining offset), whereas the L-T3/L-T4 combined therapy can restore this setpoint. In the case of the L-T4 monotherapy, the missing endogenously produced T4 is simply replaced by L-T4. T3 is synthesized out of T4 in peripheral organs and in the thyroid mainly by D1 and by D2. The peripheral T3 production is restored by an L-T4 monotherapy, since the serum T4 is replaced by L-T4. In turn, the production of T3 in thyroid cells (describing the TSH-T3 shunt) cannot be restored by L-T4, because L-T4 only enters the pituitary-thyroid feedback loop in the periphery and not within the thyroid. Consequently, the L-T4 dosages increase, until the best trade-off between a too low concentration of T3 and a too high concentration of T4 is found.
Regarding the L-T3/L-T4 combined therapy, the missing endogenously produced T4 and the subsequent peripheral T3 production can again be replaced by L-T4. In contrast to the L-T4 monotherapy, the production of T3 in thyroid cells is compensated through the intake of L-T3. Since only a small fraction of T3 is synthesized within thyroid cells (15), the necessary L-T3 dosages are rather low.
As explained above, the main reason for the resulting different treatment outcome of an L-T4 monotherapy compared to an L-T3/L-T4 combined therapy is the fact that the T3 production also takes place in thyroid cells (the so-called TSH-T3 shunt, compare (15)). When this intrathyroidal T3 production is not considered in the mathematical model, the final treatment outcome between the two types of therapy is the same. In particular, in (14), where no direct T3 synthesis based on TSH is considered in the model (also referred to as TSH-T3 shunt), the authors conclude that the L-T3/L-T4 combined therapy is not superior to the L-T4 monotherapy, because the same hormone concentrations are reached and because of undesired fluctuations of the T3 concentrations in the case of the L-T3/L-T4 combined therapy.
Since the difference in the outcome of the two therapies is rather small (compare Figures 2, 3), it might seem questionable whether an L-T3/L-T4 combined therapy should be recommended in practice. However, when it is known that the patient is affected by an AA or CC genotype in polymorphism rs2235544 in DIO1, the difference between the L-T4 monotherapy and the L-T3/L-T4 combined therapy in the simulations of the model can be substantial. On the one hand, when patients have an AA genotype (leading to lower activity of D1, here exemplary considered by GD1'=0.9GD1) they might profit considerably from an L-T3/L-T4 combined therapy, compare Figure 4. In this case, less T3 is produced out of T4 in peripheral organs and in the thyroid gland. The lack of endogenously produced T3 cannot be compensated by means of the L-T4 monotherapy. Again, the controller increases the L-T4 dosages further in order to reach the best trade-off between a too low T3 concentration and a too high T4 concentration. In turn, the L-T3/L-T4 combined therapy restores the setpoint of healthy individuals by means of higher L-T3 dosages. The difference to the case without genetic variants is an increased offset between the T3, T4 and TSH concentrations and their respective setpoints regarding the L-T4 monotherapy and increased T3 fluctuations regarding the L-T3/L-T4 combined therapy. On the other hand, when the patient has a CC genotype leading to a higher activity of D1 (here considered by GD1′′=1.1GD1), there is no difference in the outcome of both therapies. There is enough endogenously produced T3 such that the setpoint of healthy individuals is reached even for the L-T4 monotherapy. The intrathyroidal production of T3 (that cannot be replaced by an L-T4 monotherapy) is compensated by the increased D1 activity. In contrast to the L-T4 monotherapy, the L-T3/L-T4 combined therapy goes along with high fluctuations of T3 during the first days of therapy. Furthermore, the simulation results for GD 1′′′=1.2GD 1 (which is another simple exemplary modeling of two C-allele) show that both therapies reach the setpoint up to some small offset; the concentrations of T3 and TSH are slightly higher than their setpoints whereas the concentration of T4 remains slightly lower than the respective setpoint. Here, the intrathyroidal production of T3 is overcompensated by the increased activity of D1, explaining the opposite results of Figure 2 (where a too low concentration of T3 and a too high concentration of T4 is observed). Therefore, an additional intake of L-T3 would lead to even higher concentrations of T3 which are not desired. Consequently, even though two medication inputs are available, it is impossible to reach the euthyroid setpoint. In Figure 6D, one can see that after day three no L-T3 is needed to remain at the steady state. Therefore, the L-T3/L-T4 combined therapy reduces to an L-T4 monotherapy. If one additionally prescribes L-T3 after day three, the T3 concentrations would be even higher which potentially leads to symptoms of hyperthyroidism.
In conclusion, our results suggest that in case of genotype AA regarding polymorphism rs2235544 of DIO1, an L-T3/L-T4 combined therapy can be beneficial, whereas an L-T4 monotherapy seems to be better suited (with respect to the achieved thyroid hormone concentration) in case of genotype CC concerning polymorphism rs2235544 of DIO1. However, clinical studies do not document a better response (in terms of symptoms) to an L-T3/L-T4 combined therapy when patients are affected by this polymorphism (26). This difference to our result could be explained by the hypotheses mentioned in (16) stating that the success of the L-T3/L-T4 combined therapy strongly depends on whether the T3 concentrations are brought to the upper reference range and on the residual thyroid function. Furthermore, the simulations of polymorphism rs225014 reveal that the L-T3/L-T4 combined therapy is better to treat hypothyroidism in terms of the treated steady-state hormone concentrations, if the T3 setpoint is set to the upper limit of the reference range of healthy individuals, compare Figures 7, 8 in the Supplementary Material. This result is in line with the study (26), where the authors document a better response to the L-T3/L-T4 combined therapy for patients affected by the considered genotype. Once again, these results underline the relevance of the hypothesis that the L-T3/L-T4 combined therapy is successful if the T3 concentrations are brought to the upper reference range of healthy individuals because the L-T3/L-T4 combined therapy does not yield to an improved outcome in terms of the treated steady-state hormone concentrations, if the T3 setpoint remains unchanged. In any case, the benefit of the L-T3/L-T4 combined therapy might depend strongly on genetic variants. Such genetic variants could play a crucial role in explaining why some studies document an advantage of the L-T3/L-T4 combined therapy over the L-T4 monotherapy and others not as also suggested in (13).
4.3 Frequency of Intake
Before going into detail regarding the optimal L-T3 intake frequency in order to reach stable T3 concentrations, we briefly want to comment on the impact of the L-T4 intake frequency on the course of the T4 concentrations. These are known to be stable in the case of an L-T4 monotherapy for one daily intake (13). The simulations of the L-T4 monotherapy emphasize this observation, compare Figures 2, 7 as well as Table 1. Two or three daily medication intakes lead to reduced fluctuations of T4 as shown in Table 1. However, since many patients feel well with one daily intake of L-T4, there is potentially no need in increasing the intake frequency although the fluctuations would decrease. Furthermore, the fluctuations of the T4 concentrations are similar concerning the L-T3/L-T4 combined therapy. This is due to the similar dosages of L-T4 regarding the L-T4 monotherapy and the L-T3/L-T4 combined therapy. In addition, the fluctuations of the T4 concentrations are similar in the transient phase and in the steady state, compare ΔT4 in Table 1 for one daily intake. The long half-life of approximately one week leads to stable hormone concentrations, such that the fluctuations are not impacted considerably by the different medication dosages occurring in the transient phase and in the steady state.
Considering the T3 concentrations in Figures 2 and 7 as well as in Table 1, one can see that the L-T4 monotherapy leads to stable T3 concentrations, even in the case of one daily intake. Regarding the L-T3/L-T4 combined therapy, the frequency of the intake of L-T3 influences substantially the fluctuations of the T3 concentrations, compare Figures 3, 8, as well as Table 1. As expected, a higher intake frequency of L-T3 results in lower fluctuations of the T3 concentrations. However, a higher intake frequency is also less convenient for patients, especially since these therapies are often life-long therapies. Given the numbers reported in Table 1, a good trade-off could be to consider two daily intakes in case of the L-T3/L-T4 combined therapy.
5 Conclusion
In this work, we design an MPC for the pituitary-thyroid feedback loop in order to develop optimal thyroid hormone replacement strategies. By means of this approach, an improvement of the current trial-and-error process of prescribing thyroid replacement hormones is possible. Furthermore, the simulations indicate that the L-T3/L-T4 combined therapy is, in general, slightly superior to treat hypothyroidism compared to the L-T4 monotherapy. In case of genotype CC concerning polymorphism rs2235544 of gene DIO1, the L-T4 monotherapy shows better results than the L-T3/L-T4 combined therapy. In turn, regarding genotype AA of polymorphism rs2235544, the L-T3/L-T4 combined therapy seems to be more suitable. Furthermore, we observe an improved outcome (in terms of treated hormone concentrations) of the L-T3/L-T4 combined therapy when patients are affected by genotype CC of polymorphism rs225014 in gene DIO2 for a T3 setpoint at the upper limit of reference range of healthy individuals. The dependence of the results on genetic variants might explain the conflicting results of existing clinical studies focusing on a comparison of both therapies. In order to reach stable T3 concentrations and a sufficiently convenient therapy, a good trade-off for an L-T3/L-T4 combined therapy is to consider two daily drug intakes.
Data Availability Statement
The original contributions presented in the study are included in the article/Supplementary Material. Further inquiries can be directed to the corresponding author.
Author Contributions
TW drafted the manuscript and performed the calculations/simulations with Matlab/Simulink, under the supervision of MM and with input from JD. All authors contributed to the article and approved the submitted version.
Funding
This project has received funding from the European Research Council (ERC) under the European Union’s Horizon 2020 research and innovation programme (grant agreement No 948679).
Conflict of Interest
JD received funding and personal fees by Sanofi-Henning, Hexal AG, Bristol-Myers Squibb, and Pfizer, and is co-owner of the intellectual property rights for the patent “System and Method for Deriving Parameters for Homeostatic Feedback Control of an Individual” (Singapore Institute for Clinical Sciences, Biomedical Sciences Institutes, Application Number 201208940-5, WIPO number WO/2014/088516).
The remaining authors declare that the research was conducted in the absence of any commercial or financial relationships that could be construed as a potential conflict of interest.
Publisher’s Note
All claims expressed in this article are solely those of the authors and do not necessarily represent those of their affiliated organizations, or those of the publisher, the editors and the reviewers. Any product that may be evaluated in this article, or claim that may be made by its manufacturer, is not guaranteed or endorsed by the publisher.
Supplementary Material
The Supplementary Material for this article can be found online at: https://www.frontiersin.org/articles/10.3389/fendo.2022.884018/full#supplementary-material
Footnotes
- ^ The parameters GD1 and GT3 are determined using thyroid hormone measurements from healthy individuals (considering men and women) with a mean age of approximately 25 years, a mean body weight of approximately 70kg, and a BMI of approximately 22kg/m2, compare also (19, 20).
- ^ The considered generic hypothyroid patients have the same characteristics with respect to sex, age, body weight, and BMI as the considered healthy individuals, compare footnote 1.
References
1. Jonklaas J, Bianco AC, Bauer AJ, Burman KD, Cappola AR, Celi FS, et al. Guidelines for the Treatment of Hypothyroidism: Prepared by the American Thyroid Association Task Force on Thyroid Hormone Replacement. Thyroid Off J Am Thyroid Assoc (2014) 24:1670–751. doi: 10.1089/thy.2014.0028
2. Kaufman SC, Gross TP, Kennedy DL. Thyroid Hormone Use: Trends in the United States From 1960 Through 1988. Thyroid (1991) 1:285–91. doi: 10.1089/thy.1991.1.285
3. Visser TJ. Metabolism of Thyroid Hormone. New Compr Biochem (1988) 18:81–103. doi: 10.1016/S0167-7306(08)60641-9
4. Saberi M, Utiger RD. Serum Thyroid Hormone and Thyrotropin Concentrations During Thyroxine and Triiodothyronine Therapy. J Clin Endocrinol Metab (1974) 39:923–7. doi: 10.1210/jcem-39-5-923
5. Singer PA, Cooper DS, Levy EG, Ladenson PW, Braverman LE, Daniels G, et al. Treatment Guidelines for Patients With Hyperthyroidism and Hypothyroidism. JAMA (1995) 273:808–12. doi: 10.1001/jama.1995.03520340064038
6. Saravanan P, Chau WF, Roberts N, Vedhara K, Greenwood R, Dayan CM. Psychological Well-Being in Patients on A’dequate’ Doses of L-Thyroxine: Results of a Large, Controlled Community-Based Questionnaire Study. Clin Endocrinol (2002) 57:577–85. doi: 10.1046/j.1365-2265.2002.01654.x
7. Nygaard B, Jensen EW, Kvetny J, Jarløv A, Faber J. Effect of Combination Therapy With Thyroxine (T4) and 3,5,3’-Triiodothyronine Versus T4 Monotherapy in Patients With Hypothyroidism, a Double-Blind, Randomised Cross-Over Study. Eur J Endocrinol (2009) 161:895–902. doi: 10.1530/EJE-09-0542
8. Bunevicius R, Kazanavicius G, Zalinkevicius R, Prange AJJ. Effects of Thyroxine as Compared With Thyroxine Plus Triiodothyronine in Patients With Hypothyroidism. New Engl J Med (1999) 340:424–9. doi: 10.1056/NEJM199902113400603
9. Escobar-Morreale HF, Botella-Carretero JI, Gómez-Bueno M, Galán JM, Barrios V, Sancho J. Thyroid Hormone Replacement Therapy in Primary Hypothyroidism: A Randomized Trial Comparing L-Thyroxine Plus Liothyronine With L-Thyroxine Alone. Ann Internal Med (2005) 142:412–24. doi: 10.7326/0003-4819-142-6-200503150-00007
10. Saravanan P, Simmons DJ, Greenwood R, Peters TJ. Dayan CM. Partial Substitution of Thyroxine (T4) With Tri-Iodothyronine in Patients on T4 Replacement Therapy: Results of a Large Community-Based Randomized Controlled Trial. J Clin Endocrinol Metab (2005) 90:805–12. doi: 10.1210/jc.2004-1672
11. Appelhof BC, Fliers E, Wekking EM, Schene AH, Huyser J, Tijssen JGP, et al. Combined Therapy With Levothyroxine and Liothyronine in Two Ratios, Compared With Levothyroxine Monotherapy in Primary Hypothyroidism: A Double-Blind, Randomized, Controlled Clinical Trial. J Clin Endocrinol Metab (2005) 90:2666–74. doi: 10.1210/jc.2004-2111
12. Clyde PW, Harari AE, Getka EJ, Shakir KMM. Combined Levothyroxine Plus Liothyronine Compared With Levothyroxine Alone in Primary Hypothyroidism: A Randomized Controlled Trial. JAMA (2003) 290:2952–8. doi: 10.1001/jama.290.22.2952
13. Wiersinga WM, Duntas L, Fadeyev V, Nygaard B, Vanderpump MPJ. ETA Guidelines: The Use of L-T4 + L-T3 in the Treatment of Hypothyroidism. Eur Thyroid J (2012) 1:55–71. doi: 10.1159/000339444
14. Mak PH, DiStefano JJ. Optimal Control Policies for the Prescription of Thyroid Hormones. Math Biosci (1978) 42:159–86. doi: 10.1016/0025-5564(78)90094-9
15. Berberich J, Dietrich JW, Hoermann R, Müller MA. Mathematical Modeling of the Pituitary-Thyroid Feedback Loop: Role of a TSH-T3-Shunt and Sensitivity Analysis. Front Endocrinol (2018) 9:91. doi: 10.3389/fendo.2018.00091
16. DiStefano J, Jonklaas J. Predicting Optimal Combination LT4 + LT3 Therapy for Hypothyroidism Based on Residual Thyroid Function. Front Endocrinol (2019) 10:746. doi: 10.3389/fendo.2019.00746
17. Yang B, Tang X, Haller MJ, Schatz DA, Rong L. A Unified Mathematical Model of Thyroid Hormone Regulation and Implication for Personalized Treatment of Thyroid Disorders. J Theor Biol (2021) 528:110853. doi: 10.1016/j.jtbi.2021.110853
18. Brun VH, Eriksen AH, Selseth R, Johansson K, Vik R, Davidsen B, et al. Patient-Tailored Levothyroxine Dosage With Pharmacokinetic/Pharmacodynamic Modeling: A Novel Approach After Total Thyroidectomy. Thyroid (2021) 31:1297–304. doi: 10.1089/thy.2021.0125
19. Dietrich JW. Der Hypophysen-Schilddrüsen-Regelkreis: Entwicklung Und Klinische Anwendung Eines Nichtlinearen Modells. (2001) 2. doi: 10.13140/RG.2.1.4845.9368.
20. Wolff TM, Veil C, Dietrich JW, Müller MA. Mathematical Modeling of Thyroid Homeostasis: Implications for the Allan-Herndon-Dudley Syndrome. bioRxiv (2022). doi: 10.1101/2022.01.24.476744
21. Hasselström K, Siersbæk-Nielsen K, Lumholtz B, Faber J, Kirkegaard C, Friis T, et al. The Bioavailability of Thyroxine and 3, 5, 3’-Triiodothyronine in Normal Subjects and in Hyper-and Hypothyroid Patients. Eur J Endocrinol (1985) 110:483–6. doi: 10.1530/acta.0.1100483
22. Dietrich JW, Landgrafe-Mende G, Wiora E, Chatzitomaris A, Klein HH, Midgley JE, et al. Calculated Parameters of Thyroid Homeostasis: Emerging Tools for Differential Diagnosis and Clinical Research. Front Endocrinol (2016) 7:57. doi: 10.3389/fendo.2016.00057
23. Rawlings JB, Mayne DQ, Diehl M. Model Predictive Control: Theory, Computation, and Design. 2. Madison, Wisconsin, United States: Nob Hill Publishing Madison, WI (2020).
24. Panicker V, Cluett C, Shields B, Murray A, Parnell KS, Perry JRB, et al. A Common Variation in Deiodinase 1 Gene DIO1 Is Associated With the Relative Levels of Free Thyroxine and Triiodothyronine. J Clin Endocrinol Metab (2008) 93:3075–81. doi: 10.1210/jc.2008-0397
25. Canani LH, Capp C, Dora JM, Meyer ELS, Wagner MS, Harney JW, et al. The Type 2 Deiodinase a/G (Thr92Ala) Polymorphism is Associated With Decreased Enzyme Velocity and Increased Insulin Resistance in Patients With Type 2 Diabetes Mellitus. J Clin Endocrinol Metab (2005) 90:3472–8. doi: 10.1210/jc.2004-1977
26. Panicker V, Saravanan P, Vaidya B, Evans J, Hattersley AT, Frayling TM, et al. Common Variation in the Dio2 Gene Predicts Baseline Psychological Well-Being and Response to Combination Thyroxine Plus Triiodothyronine Therapy in Hypothyroid Patients. J Clin Endocrinol Metab (2009) 94:1623–9. doi: 10.1210/jc.2008-1301
27. Müller P, Dietrich JW, Lin T, Bejinariu A, Binnebößel S, Bergen F, et al. Usefulness of Serum Free Thyroxine Concentration to Predict Ventricular Arrhythmia Risk in Euthyroid Patients With Structural Heart Disease. Am J Cardiol (2020) 125:1162–9. doi: 10.1016/j.amjcard.2020.01.019
28. Andersson JAE, Gillis J, Horn G, Rawlings JB, Diehl M. CasADi – A Software Framework for Nonlinear Optimization and Optimal Control. Math Program Comput (2019) 11:1–36. doi: 10.1007/s12532-018-0139-4
29. Wächter A, Biegler LT. On the Implementation of an Interior-Point Filter Line-Search Algorithm for Large-Scale Nonlinear Programming. Math Program (2006) 106:25–57. doi: 10.1007/s10107-004-0559-y
30. Lindsay RS, Toft AD. Hypothyroidism. Lancet (1997) 349:413–7. doi: 10.1016/S0140-6736(97)80050-5
31. Roos A, Linn-Rasker SP, van Domburg RT, Tijssen JP, Berghout A. The Starting Dose of Levothyroxine in Primary Hypothyroidism Treatment: A Prospective, Randomized, Double-Blind Trial. Arch Intern Med (2005) 165:1714–20. doi: 10.1001/archinte.165.15.1714
32. Klubo-Gwiezdzinska J, Wartofsky L. Thyroid Emergencies. Med Clinics (2012) 96:385–403. doi: 10.1016/j.mcna.2012.01.015
33. .Holvey DN, Goodner CJ, Nicoloff JT, Dowling JT. Treatment of Myxedema Coma With Intravenous Thyroxine. Arch Internal Med (1964) 113:89–96. doi: 10.1001/archinte.1964.00280070091015
34. Rodriguez I, Fluiters E, Pérez-Méndez L, Luna R, Páramo C, García-Mayor R. Factors Associated With Mortality of Patients With Myxoedema Coma: Prospective Study in 11 Cases Treated in a Single. J Endocrinol (2004) 180:50. doi: 10.1677/joe.0.1800347
35. Jonklaas J, Davidson B, Bhagat S, Soldin SJ. Triiodothyronine Levels in Athyreotic Individuals During Levothyroxine Therapy. JAMA (2008) 299:769–77. doi: 10.1001/jama.299.7.769
Keywords: mathematical modeling, automatic control, model predictive control, thyroid homeostasis, combined therapy, monotherapy
Citation: Wolff TM, Dietrich JW and Müller MA (2022) Optimal Hormone Replacement Therapy in Hypothyroidism - A Model Predictive Control Approach. Front. Endocrinol. 13:884018. doi: 10.3389/fendo.2022.884018
Received: 25 February 2022; Accepted: 25 April 2022;
Published: 24 June 2022.
Edited by:
Joseph DiStefano, University of California, Los Angeles, United StatesReviewed by:
Patrick Mak, The Aerospace Corporation, United StatesJacqueline Jonklaas, Georgetown University, United States
Copyright © 2022 Wolff, Dietrich and Müller. This is an open-access article distributed under the terms of the Creative Commons Attribution License (CC BY). The use, distribution or reproduction in other forums is permitted, provided the original author(s) and the copyright owner(s) are credited and that the original publication in this journal is cited, in accordance with accepted academic practice. No use, distribution or reproduction is permitted which does not comply with these terms.
*Correspondence: Tobias M. Wolff, d29sZmZAaXJ0LnVuaS1oYW5ub3Zlci5kZQ==