
94% of researchers rate our articles as excellent or good
Learn more about the work of our research integrity team to safeguard the quality of each article we publish.
Find out more
ORIGINAL RESEARCH article
Front. Endocrinol., 03 June 2022
Sec. Clinical Diabetes
Volume 13 - 2022 | https://doi.org/10.3389/fendo.2022.873318
 Liangjing Lv
 Xiangjun Chen
 Jinbo HuJinshan Wu
 Wenjin LuoYan ShenRui LanXue LiYue WangTing Luo
 Shumin Yang
 Qifu Li
 Zhihong Wang*
Background and Objectives: The study aimed to evaluate the performance of a predictive model using the kidney failure risk equation (KFRE) for end-stage renal disease (ESRD) in diabetes and to investigate the impact of glomerular filtration rate (GFR) as estimated by different equations on the performance of the KFRE model in diabetes.
Design, Setting, Participants, and Measurements: A total of 18,928 individuals with diabetes without ESRD history from the UK Biobank, a prospective cohort study initiated in 2006–2010, were included in this study. Modification of diet in renal disease (MDRD), chronic kidney disease epidemiology collaboration (CKD-EPI) or revised Lund–Malmö (r-LM) were used to estimate GFR in the KFRE model. Cox proportional risk regression was used to determine the correlation coefficients between each variable and ESRD risk in each model. Harrell’s C-index and net reclassification improvement (NRI) index were used to evaluate the differentiation of the models. Analysis was repeated in subgroups based on albuminuria and hemoglobin A1C (HbA1c) levels.
Results: Overall, 132 of the 18,928 patients developed ESRD after a median follow-up of 12 years. The Harrell’s C-index based on GFR estimated by CKD-EPI, MDRD, and r-LM was 0.914 (95% CI = 0.8812–0.9459), 0.908 (95% CI = 0.8727–0.9423), and 0.917 (95% CI = 0.8837–0.9496), respectively. Subgroup analysis revealed that in diabetic patients with macroalbuminuria, the KFRE model based on GFR estimated by r-LM (KFRE-eGFRr-LM) had better differentiation compared to the KFRE model based on GFR estimated by CKD-EPI (KFRE-eGFRCKD-EPI) with a KFRE-eGFRr-LM C-index of 0.846 (95% CI = 0.797–0.894, p = 0.025), while the KFRE model based on GFR estimated by MDRD (KFRE-eGFRMDRD) showed no significant difference compared to the KFRE-eGFRCKD-EPI (KFRE-eGFRMDRD C-index of 0.837, 95% CI = 0.785–0.889, p = 0.765). Subgroup analysis of poor glycemic control (HbA1c >8.5%) demonstrated the same trend. Compared to KFRE-eGFRCKD-EPI (C-index = 0.925, 95% CI = 0.874–0.976), KFRE-eGFRr-LM had a C-index of 0.935 (95% CI = 0.888–0.982, p = 0.071), and KFRE-eGFRMDRD had a C-index of 0.925 (95% CI = 0.874–0.976, p = 0.498).
Conclusions: In adults with diabetes, the r-LM equation performs better than the CKD-EPI and MDRD equations in the KFRE model for predicting ESRD, especially for those with macroalbuminuria and poor glycemic control (HbA1c >8.5%).
Diabetes mellitus (DM) is the leading cause of end-stage renal disease (ESRD) (1), and it is estimated that 20–40% of ESRD patients have DM. Approximately 30% of ESRD cases result from DM (2, 3). Diabetic patients with ESRD have a higher risk of death than patients with ESRD alone (4), and early identification effectively improves the prognosis (5). Therefore, the ability to predict ESRD in a population with diabetes is of great clinical importance.
Many studies have focused on ESRD prediction models (6–8), but only a few of them have focused on patients with DM. The existing ESRD prediction models that focus on patients with DM often require information for renal pathological characteristics, such as glomerular sclerosis score and tubular injury markers, or they contain complex variables, making it difficult to generalize for the clinical setting. There is a lack of simple and reliable predictive models for ESRD in diabetes. The kidney failure risk equation (KFRE) is a risk prediction model for ESRD widely used in the general population (9–11). The KFRE includes sex, age, urinary (or urine) albumin-to-creatinine ratio (UACR), and estimated glomerular filtration rate (eGFR) (9). The KFRE has also been recommended by the European Renal Best Practice (ERBP), especially for older people (12), but whether it effectively measures the risk of incident ESRD in people with diabetes is less certain.
The glomerular filtration rate (GFR) is an effective indicator of renal function. Because of the complexity and invasiveness of its gold standard measurement, eGFR is often used as a surrogate in clinical practice. The Modification of Diet in Renal Disease (MDRD) and Chronic Kidney Disease Epidemiology Collaboration (CKD-EPI) equations are the most commonly used equations based on serum creatinine, but they do not perform well in DM (13–15). In 2011, a new eGFR equation based on serum creatinine, named the revised Lund–Malmö (r-LM), emerged. Zafari et al. evaluated the diagnostic performance of GFR estimated by the CKD-EPI, MDRD, and r-LM equations in diabetes, and they found that the r-LM equation outperformed the CKD-EPI MDRD equations in terms of consistency, precision, accuracy, and bias in estimating GFR in adults with diabetes (16). Nevertheless, it remains unclear whether using different eGFR equations affects the performance of the ESRD prediction model and whether the GFR estimation formula is better in DM for predicting ESRD. Therefore, using clinical data from the UK Biobank prospective cohort, this study aimed to investigate the performance of GFR as estimated by different formulas in the KFRE model to predict the risk of ESRD in patients with diabetes.
The UK Biobank is a large-scale biomedical database containing genetic and health information from 502,536 participants aged 37 to 73 in the UK between 2006 and 2010 (17). Baseline clinical data, such as demographics, were collected via a touchscreen device (17). This cohort is supported by the North West Multi-Centre Research Ethics Committee (REC Reference: 11/NW/03820). All participants provided informed consent. The current analysis was approved by the UK Biobank (ID: 66536).
Patients with a prior history of ESRD (defined as the date of ESRD algorithm reporting earlier than the date of recruitment), patients whose eGFR was less than 15 ml/min/1.73 m2 and patients without a history of diabetes (defined as the date of onset of diabetes earlier than the date of recruitment) were excluded.
All clinical data were derived from the UK Biobank cohort. Blood and urine samples were collected and analyzed in the central laboratory. Blood glucose and glycated hemoglobin levels were measured by chromatographic analysis using the Variant II Turbo system (Bio-Rad, USA). Total cholesterol (TC), triglyceride (TG), high-density lipoprotein cholesterol (HDL-c), and low-density lipoprotein cholesterol (LDL-c) were measured by chemical analysis using an AU5800 instrument (Beckman Coulter, Brea, CA, USA). Serum creatinine (Scr) and urinary creatinine were measured using an AU5400 instrument (Beckman Coulter) (18). Urine microalbumin was measured by an immunoturbidimetric method using reagents and calibrators obtained from Randox Bioscience (19). Ethnicity data were sorted by black or other to calculate GFR estimated by the CKD-EPI (20) and MDRD equations (21) as shown in Table 1.
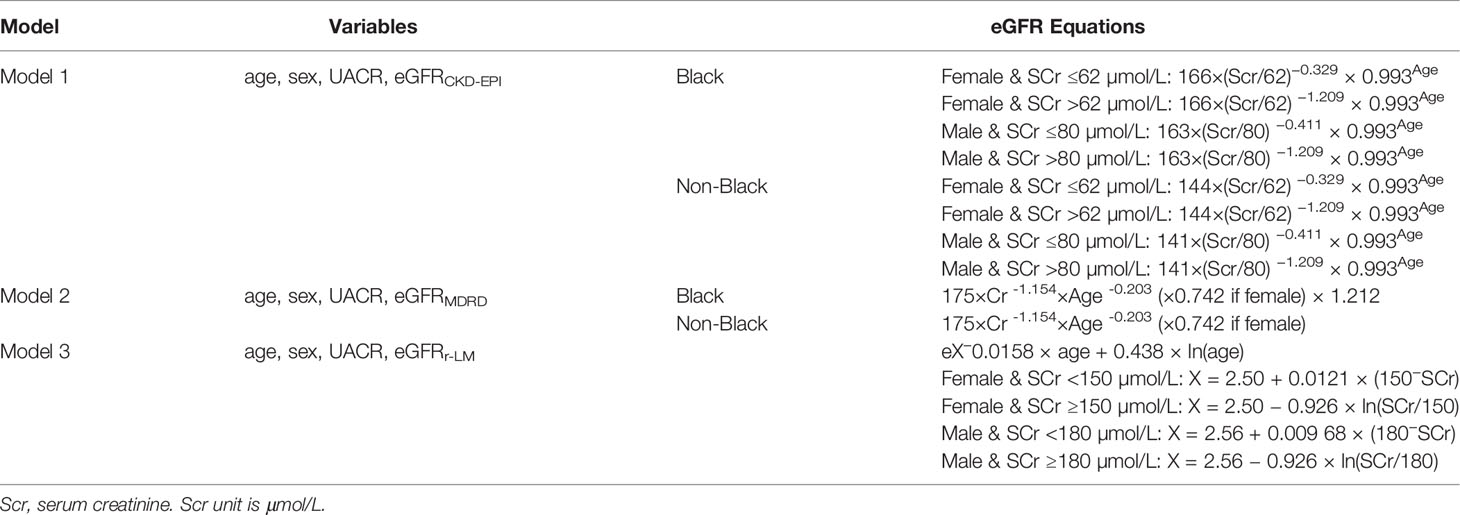
Table 1 The three models and variables.
The ESRD outcome was defined using the ICD-10 and OPCS4 hospital admission codes. Participants who reached stage 5 CKD, required renal replacement therapy, or received peritoneal dialysis were identified as ESRD patients during the follow-up period. This algorithm has previously been used to successfully identify patients with ESRD in the UK Biobank (22).
No albuminuria, microalbuminuria, and macroalbuminuria was defined as UACR <30 mg/g, 30 mg/g< UACR <300 mg/g, and UACR >300 mg/g, respectively. Good, fair, and poor blood glucose control were defined as HbA1c <7%, 7%< HbA1c <8.5%, and HbA1c >8.5%, respectively.
This study discussed the following predictive models for ESRD in diabetes (Table 1). The descriptive statistics were grouped by gender. The Kolmogorov–Simov Z test was used to test the normality of continuous variables. All the continuous variables in this study were not normally distributed, and they are expressed as the median (interquartile range, IQR). Intergroup comparisons were performed using the t test or Mann–Whitney U test. Categorical variables are expressed as percentages (frequency), and the chi-square test was used for comparison between groups. The correlation between each variable and the outcome was tested by Spearman’s test. Cox proportional risk regression was used to observe the correlation coefficients between each variable and ESRD risk in each model. Harrell’s C-index and net reclassification improvement (NRI) index were used to evaluate the differentiation of the models. Subgroup analysis was performed on the basis of renal function and blood glucose levels. All the analyses were performed by Stata 15 software (Statacorp LP, College Station, TX, USA) and R v4.0.4 (http://www.R-project.org, The R Foundation). P <0.05 represents statistical significance.
Of the half of a million people in the UK Biobank, 604 had a history of ESRD, 460,113 did not have a history of diabetes, and 40,794 were eligible for inclusion in this study. Among them, 2,939 lost serum creatinine data, 18,927 lost urine microalbumin data, and 18,928 had complete data and were included in this study (Figure 1). At baseline, the age of the male and female participants was 60 (53, 67) and 59 (52, 67) years old, respectively. The HbA1c of the male and female participants was 46.81 (28.47, 65.15) mmol/mol and 47.81 (29.96, 65.66) mmol/mol, respectively. The other baseline characteristics are summarized in Table 2.
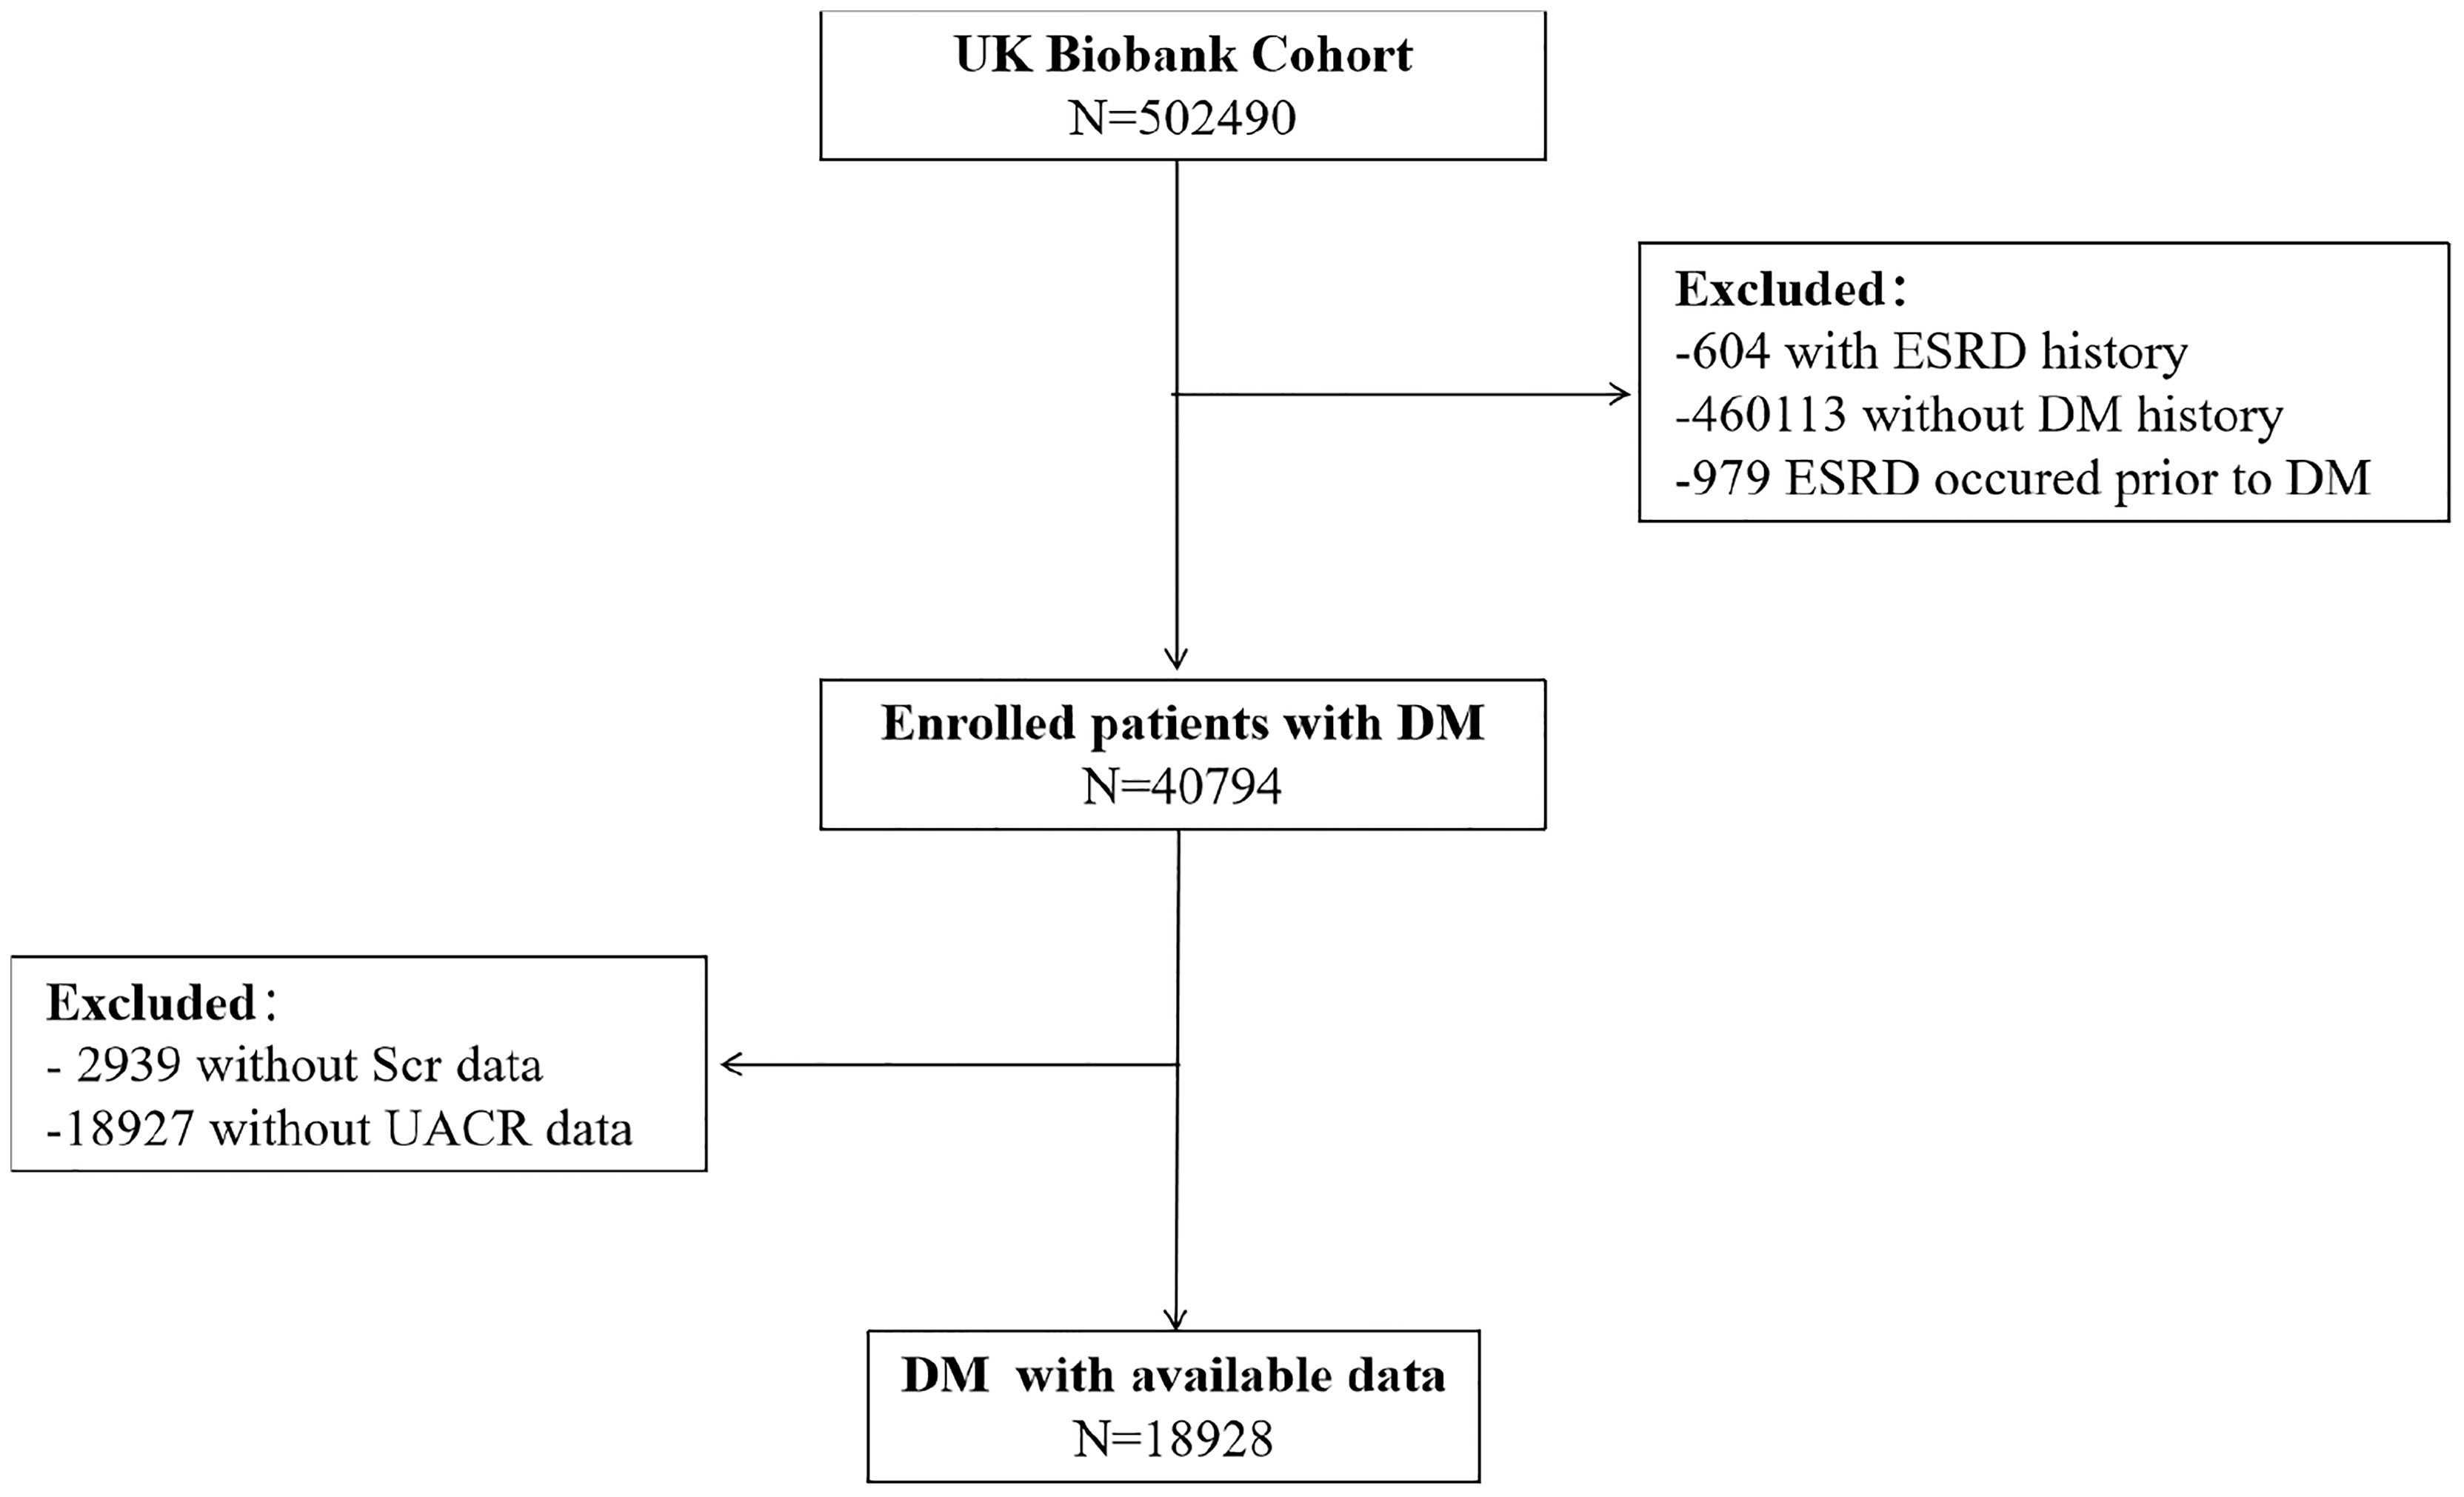
Figure 1 Flow chart of study population.
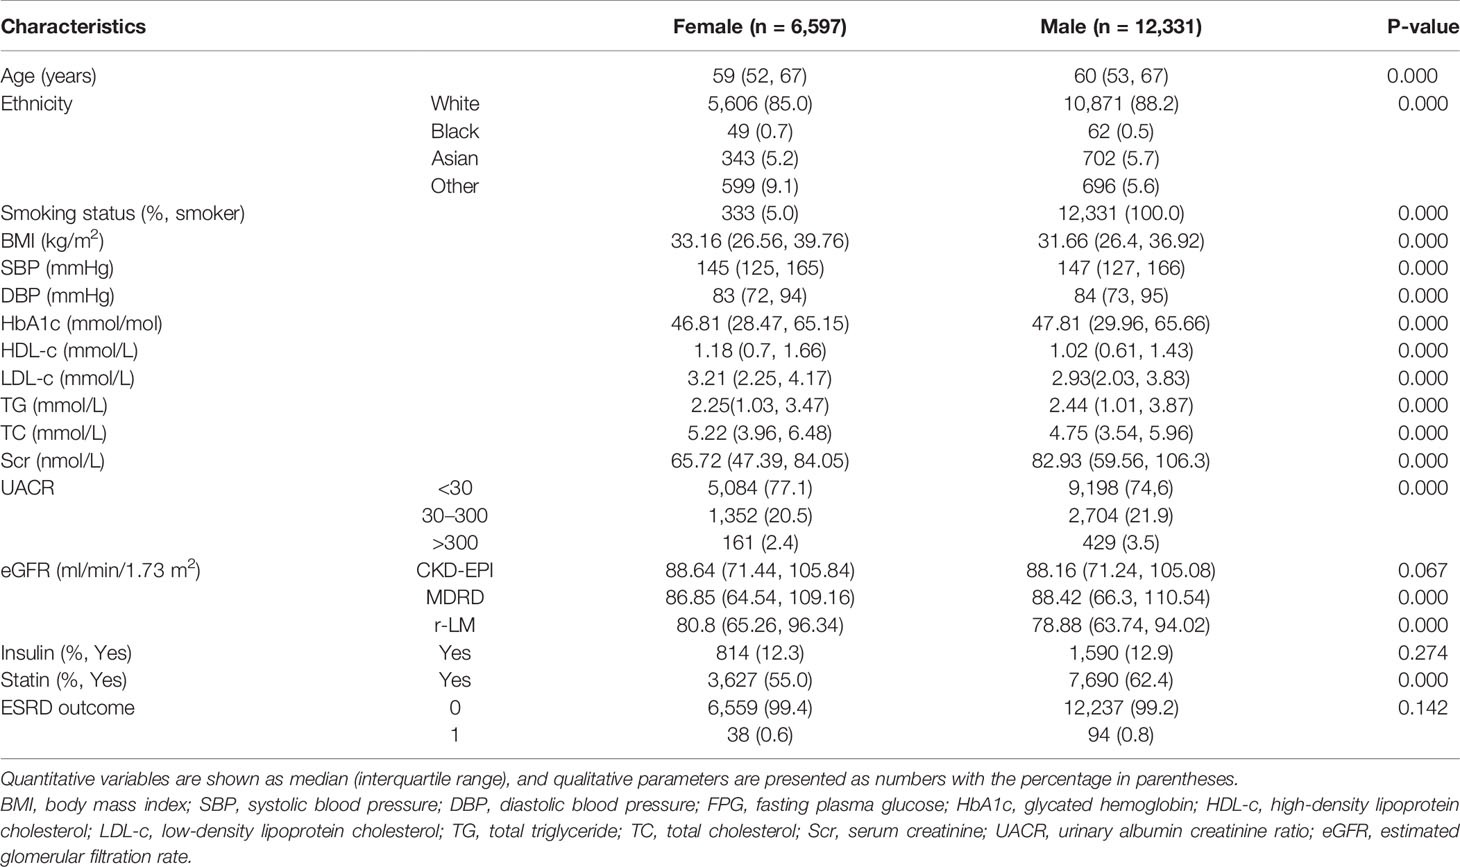
Table 2 Baseline characteristics, follow-up and outcome of the UK Biobank cohort with diabetes.
Most of the participants had normal renal function at baseline, but the GFR estimated by different formulas varied. After a median follow-up of 12 years, 132 of 18,928 patients developed ESRD during the follow-up period.
Each eGFR was negatively correlated with the outcome of ESRD (Supplementary Table 1). Regardless of the formula, a decreased eGFR was associated with an increased risk of ESRD (Table 3). After the Z conversion, the increased risk of ESRD due to decreased eGFR still existed (Table 3).
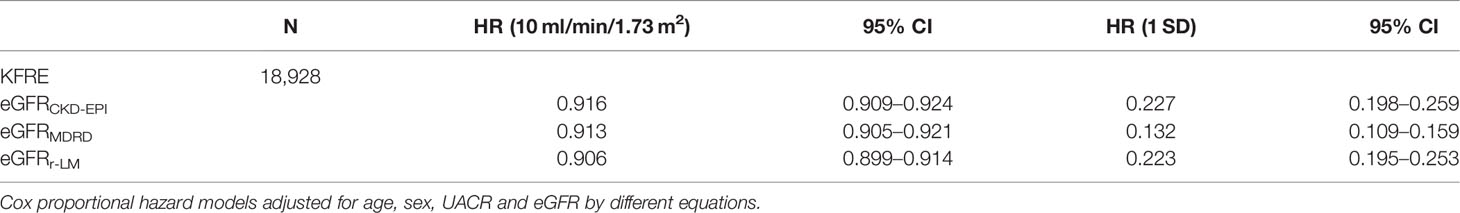
Table 3 Adjusted hazard ratio of variables in different models for ESRD.
In diabetes, compared to patients with well-controlled blood glucose, those who had poor blood glucose control were associated with a greater risk of ESRD in response to the decrease in the eGFR (Supplementary Table 2).
The C-index of the original KFRE model (age, sex, UACR, and eGFRCKD-EPI) was 0.914 (0.8812–0.9459). The eGFR estimated by the r-LM equation improved the differentiation of the ESRD prediction model (C-index of 0.917 (0.8837–0.9496), P = 0.165; Table 4). The NRI index was calculated, but the results showed that the eGFR calculated by different formulas did not significantly impact the differentiation of the KFRE for predicting ESRD (Supplementary Table 3).
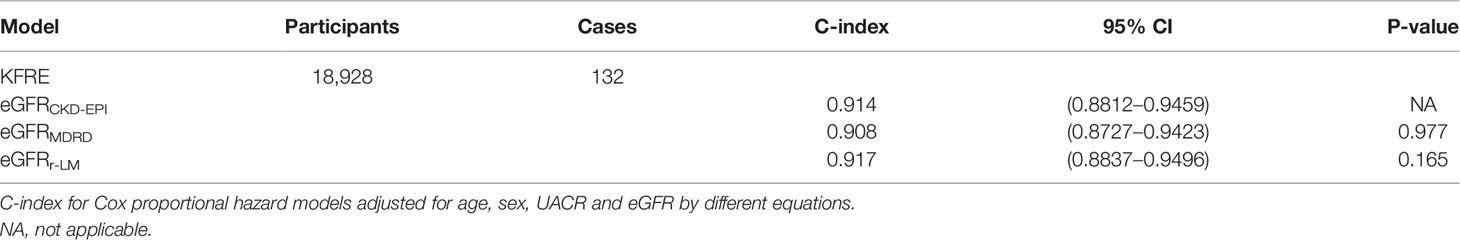
Table 4 Harrell’s C-index of the three models for ESRD.
According to the UACR values, the data were further divided into three groups as follows: no albuminuria, microalbuminuria, and macroalbuminuria. Compared with the no albuminuria and macroalbuminuria subgroups, the original KFRE model based on eGFRCKD-EPI performed best for predicting ESRD in diabetic patients with microalbuminuria [C-index of 0.923 (0.873–0.973); Table 5].
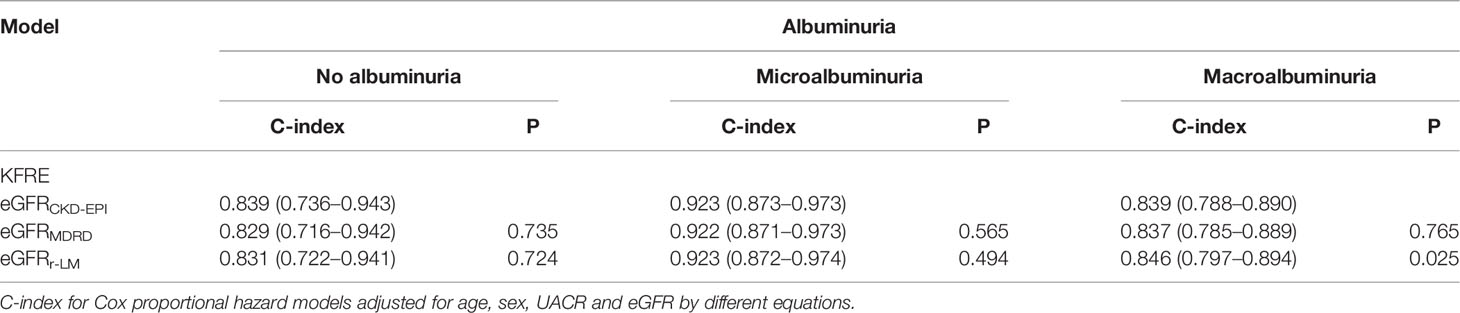
Table 5 Harrell’s C-index of the different models for ESRD according to UACR subgroups.
Regarding the impact of different eGFR equations, there was no significant difference in the C-index of the KFRE model for predicting ESRD in the no albuminuria and microalbuminuria groups. However, in the macroalbuminuria subgroup, the differentiation of the model based on eGFRr-LM was better than the other formulas [C-index of 0.846 (0.798–0.859), P = 0.025; Table 5].
According to the HbA1c values, the data were further divided into three groups as follows: good blood glucose control, fair blood glucose control, and poor blood glucose control. Comparison among groups showed that the KFRE model performed best for predicting ESRD in diabetic patients with fair blood glucose control, as indicated by an HbA1c range of 7–8.5% [C-index of 0.954 (0.925–0.984); Table 6].
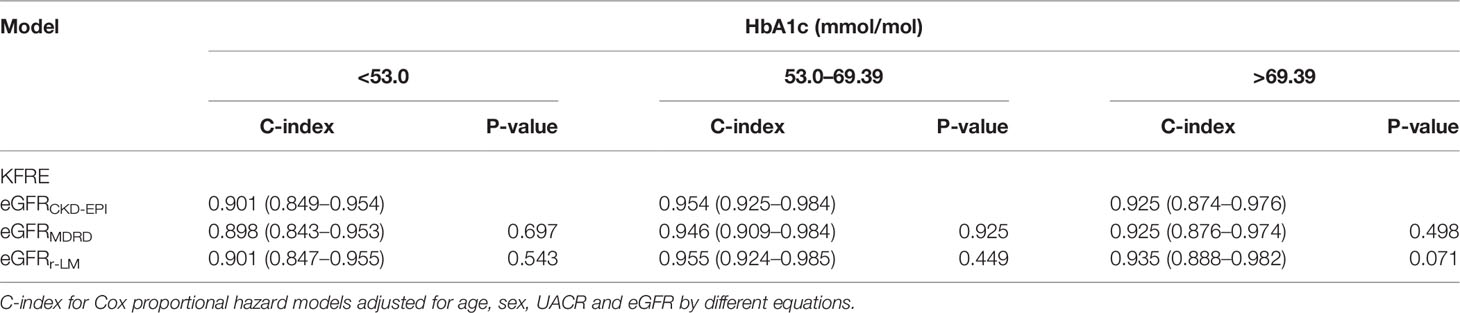
Table 6 Harrell’s C-index of different models for ESRD according to HbA1c subgroups.
Regarding the impact of different eGFR equations, there was no significant difference in the C-index of the KFRE model for predicting ESRD in the good and fair blood glucose control groups. In the poor blood glucose control subgroup, however, the differentiation of the model based on eGFRr-LM was better than the other formulas [C-index of 0.935 (0.888–0.982), P = 0.071; Table 6].
In this study, UK Biobank data were used to evaluate the predictive performance of the KFRE model for ESRD in diabetes and to investigate the impact of different eGFR equations. We found that the KFRE effectively identified patients with a high risk of ESRD (C-index of 0.8812–0.9459). Overall, the GFR formulas did not significantly impact the performance of the KFRE in our data. However, subgroup analysis showed that in diabetic patients with macroalbuminuria (UACR >300 mg/g) and poor blood glucose control (HbA1c >8.5%), the prediction model based on eGFRr-LM outperformed the prediction models based on eGFRCKD-EPI and eGFRMDRD in identifying diabetic patients with a higher risk of ESRD [C-index of 0.846 (0.797–0.894) and 0.935 (0.888–0.982), respectively].
Previous studies have developed and applied many ESRD prediction models, but only a few studies have focused on diabetes, a serious public health problem. Tangri et al. (9) observed the occurrence of renal failure in patients with stage 3–5 CKD (approximately 40% with diabetes); they showed that a model adjusted for serum albumin, serum calcium, blood phosphate, and blood bicarbonate well predicts the incidence of ESRD (C-index of 0.917, 95% CI (0.901–0.933)), but this model is difficult to promote in clinical practice because it uses variables not commonly used in daily follow-up. Jardine et al. (23) enrolled patients with type 2 diabetes from the ADVANCE study (n = 11,140) and performed a 5-year follow-up to observe the risk of renal-related outcomes (creatinine doubling and onset proteinuria); their model contains ten variables (gender, race, eGFR, UACR, SBP, antihypertensive therapy, HbA1c, diabetic retinopathy, waist circumference, and education age) that effectively identifies patients with higher risk of ESRD (C-index of 0.815–0.880), but some of the variables, such as diabetic retinopathy and education age, require a long-term follow-up, limiting its clinical application. Another study has developed a model, a so-called renal risk score, to predict ESRD in patients with diabetes (n = 25,736); this model includes gender, race, age, duration of diabetes, proteinuria, serum creatinine, systolic blood pressure, HbA1c, smoking status, and previous history of cardiovascular disease with a C-index of 0.89–0.92 for ESRD (24), but it also contains many variables that limit its clinical application. In contrast, the KFRE not only performed well in identifying high-risk patients with diabetes but also used more convenient and easily obtained variables.
All the mentioned studies used the CKD-EPI formula to estimate GFR. Although this formula is widely used, its accuracy is poor in patients with diabetes, particularly in the subgroup with poor renal function (14). Therefore, this study also investigated the impact of different eGFR formulas on the performance of the prediction model. Our results showed that the prediction model based on eGFRr-LM better identified diabetic patients with a high-risk for ESRD. Although the GFR formulas did not significantly impact the performance of the KFRE in this study, it may have been due to the uneven distribution of this population. At baseline, most participants had normal or fair renal function, which may have underestimated the proportion of patients with kidney disease. Additionally, diabetic patients with macroalbuminuria (UACR > 300 mg/g) and poor blood glucose control (HbA1c >8.5%) had a higher risk of incident ESRD (4). Subgroup analysis revealed that the prediction models based on eGFRr-LM outperformed the prediction model based on eGFRCKD-EPI and eGFRMDRD in identifying patients who are at high-risk for ESRD, indicating that r-LM is a better option for estimating the GFR in a prediction model for ESRD in diabetes.
This study had the following advantages: This was the first study to investigate the impact of different GFR formulas on a prediction model. Additionally, the study population was obtained from the UK Biobank cohort, representing a large sample size and high reliability of the results. Moreover, the recommended model is simple, and the required variables (age, sex, UACR, and eGFRr-LM) can be easily obtained in routine clinical follow-ups.
Nevertheless, this study had several limitations. First, most of the study population had normal renal function (Table 1), which does not reflect the continuous spectrum of renal function in diabetes. Additionally, the population was mainly white, indicating that the use of this model for other races, such as the Asian population, requires further validation. Second, we defined diabetes mellitus by the first occurrence data of the UK Biobank database, indicating that the diabetic subtypes were not distinguished. However, this model may be suitable to some extent for all types of diabetes.
In this study, the KFRE was validated for predicting ESRD in diabetes. We found that estimating the GFR using different equations had little impact on the model performance. However, eGFRr-LM performed better in subgroups with macroalbuminuria and poor glycemic control. These findings may provide theoretical support for the early identification and intervention of ESRD in diabetes.
The original contributions presented in the study are included in the article/Supplementary Material. Further inquiries can be directed to the corresponding author.
The studies involving human participants were reviewed and approved by the North West Multi-Centre Research Ethics Committee. The patients/participants provided their written informed consent to participate in this study.
ZW proposed the conception,QL and SY helped with the study design. LT and YW take part in the execution, acquisition of data. XL, RL, YS and WL analysis and interpretation the data, JW, JH and XC took part in drafting, revising or critically reviewing the article; LL take charge of data analysing and drafting and revising articles. All authors gave final approval of the version to be published.
This work was supported by the Technological Innovation and Application Development Project of Chongqing (cstc2019jscx-msxmX0207), the Chongqing Science and Health Joint Medical Research Project (2020FYYX141; 2018GDRC004), the Innovative Funded Project of Chongqing Innovation and Retention Program (cx2019032),the Chinese Foundation for International Medical Exchange(Z-2017-26-1902-2) and the Chongqing Yong and Middle-aged Senior Medical Talents Studio (ZQNYXGDRCGZS2021001).
The authors declare that the research was conducted in the absence of any commercial or financial relationships that could be construed as a potential conflict of interest.
All claims expressed in this article are solely those of the authors and do not necessarily represent those of their affiliated organizations, or those of the publisher, the editors and the reviewers. Any product that may be evaluated in this article, or claim that may be made by its manufacturer, is not guaranteed or endorsed by the publisher.
The authors would like to acknowledge Yi Yang, Kanran Wang, Yangmei Zhou, and Qinyin Zhao for their excellent assistance. This work utilized the UK Biobank resource (ID: 66536).
The Supplementary Material for this article can be found online at: https://www.frontiersin.org/articles/10.3389/fendo.2022.873318/full#supplementary-material
1. Atkins R, Zimmet P. Diabetic Kidney Disease: Act Now or Pay Later. Med J Aust (2010) 192(5):272–4. doi: 10.5694/j.1326-5377.2010.tb03506.x
2. Cheng H, Xu X, Lim P, Hung K. Worldwide Epidemiology of Diabetes-Related End-Stage Renal Disease, 2000-2015. Diabetes Care (2021) 44(1):89–97. doi: 10.2337/dc20-1913
3. Perneger T, Brancati F, Whelton P, Klag M. End-Stage Renal Disease Attributable to Diabetes Mellitus. Ann Intern Med (1994) 121(12):912–8. doi: 10.7326/0003-4819-121-12-199412150-00002
4. Saeedi P, Salpea P, Karuranga S, Petersohn I, Malanda B, Gregg E, et al. Mortality Attributable to Diabetes in 20-79 Years Old Adults, 2019 Estimates: Results From the International Diabetes Federation Diabetes Atlas, 9th Edition. Diabetes Res Clin Pract (2020) 162:108086. doi: 10.1016/j.diabres.2020.108086
5. KDIGO. Clinical Practice Guideline for Diabetes Management in Chronic Kidney Disease. Kidney Int (2020) 98:S1–S115. doi: 10.1016/j.kint.2020.06.019
6. Garlo K, White W, Bakris G, Zannad F, Wilson C, Kupfer S, et al. Kidney Biomarkers and Decline in eGFR in Patients With Type 2 Diabetes. Clin J Am Soc Nephrol (2018) 13(3):398–405. doi: 10.2215/CJN.05280517
7. Schroeder E, Yang X, Thorp M, Arnold B, Tabano D, Petrik A, et al. Predicting 5-Year Risk of RRT in Stage 3 or 4 CKD: Development and External Validation. Clin J Am Soc Nephrol (2017) 12(1):87–94. doi: 10.2215/CJN.01290216
8. Mise K, Hoshino J, Ueno T, Hazue R, Hasegawa J, Sekine A, et al. Prognostic Value of Tubulointerstitial Lesions, Urinary N-Acetyl-β-D-Glucosaminidase, and Urinary β2-Microglobulin in Patients With Type 2 Diabetes and Biopsy-Proven Diabetic Nephropathy. Clin J Am Soc Nephrol (2016) 11(4):593–601. doi: 10.2215/CJN.04980515
9. Tangri N, Stevens LA, Griffith J, Tighiouart H, Djurdjev O, Naimark D, et al. A Predictive Model for Progression of Chronic Kidney Disease to Kidney Failure. JAMA (2011) 305(15):1553–9. doi: 10.1001/jama.2011.451
10. Major R, Shepherd D, Medcalf J, Xu G, Gray L, Brunskill N. The Kidney Failure Risk Equation for Prediction of End Stage Renal Disease in UK Primary Care: An External Validation and Clinical Impact Projection Cohort Study. PloS Med (2019) 16(11):e1002955. doi: 10.1371/journal.pmed.1002955
11. Ramspek C, Evans M, Wanner C, Drechsler C, Chesnaye N, Szymczak M, et al. Kidney Failure Prediction Models: A Comprehensive External Validation Study in Patients With Advanced CKD. J Am Soc Nephrol (2021) 32(5):1174–86. doi: 10.1681/ASN.2020071077
12. Farrington K, Covic A, Nistor I, Aucella F, Clyne N, De Vos L, et al. Clinical Practice Guideline on Management of Older Patients With Chronic Kidney Disease Stage 3b or Higher (eGFR<45 Ml/Min/1.73 M2): A Summary Document From the European Renal Best Practice Group. Nephrol Dial Transplant (2017) 32(1):9–16. doi: 10.1093/ndt/gfw356
13. Wood A, Churilov L, Perera N, Thomas D, Poon A, MacIsaac R, et al. Estimating Glomerular Filtration Rate: Performance of the CKD-EPI Equation Over Time in Patients With Type 2 Diabetes. J Diabetes Complicat (2016) 30(1):49–54. doi: 10.1016/j.jdiacomp.2015.08.025
14. MacIsaac R, Ekinci E, Premaratne E, Lu Z, Seah J, Li Y, et al. The Chronic Kidney Disease-Epidemiology Collaboration (CKD-EPI) Equation Does Not Improve the Underestimation of Glomerular Filtration Rate (GFR) in People With Diabetes and Preserved Renal Function. BMC Nephrol (2015) 16:198. doi: 10.1186/s12882-015-0196-0
15. Luis-Lima S, Higueras Linares T, Henríquez-Gómez L, Alonso-Pescoso R, Jimenez A, López-Hijazo A, et al. The Error of Estimated Gfr in Type 2 Diabetes Mellitus. J Clin Med (2019) 8(10):1543. doi: 10.3390/jcm8101543
16. Zafari N, Lotfaliany M, O'Keefe G, Kishore K, Torkamani N, MacIsaac R, et al. Performance of 4 Creatinine-Based Equations in Assessing Glomerular Filtration Rate in Adults With Diabetes. J Clin Endocrinol Metab (2021) 106(1):e61–73. doi: 10.1210/clinem/dgaa722
17. Bycroft C, Freeman C, Petkova D, Band G, Elliott LT, Sharp K, et al. The UK Biobank Resource With Deep Phenotyping and Genomic Data. Nature (2018) 562(7726):203–9. doi: 10.1038/s41586-018-0579-z
18. Elliott P, Peakman TC, UK, Biobank. The UK Biobank Sample Handling and Storage Protocol for the Collection, Processing and Archiving of Human Blood and Urine. Int J Epidemiol (2008) 37(2):234–44. doi: 10.1093/ije/dym276
19. UK Biobank Showcase: Details of Assays and Quality Control Information for the Urinary Biomarker Data V.1.0. (UK Biobank (2016).
20. Levey AS, Stevens LA, Schmid CH, Zhang YL, Castro AF 3rd, Feldman HI, et al. A New Equation to Estimate Glomerular Filtration Rate. Ann Intern Med (2009) 150:604–12. doi: 10.7326/0003-4819-150-9-200905050-00006
21. Levey AS, Greene T, Kusek JW, Beck GJ, for the MDRD Study Group. A Simplified Equation to Predict Glomerular Filtration Rate From Serum Creatinine (Abstract). J Am Soc Nephrol (2000) 11:155A.
22. Wilkinson TJ, Miksza J, Yates T, Lightfoot CJ, Baker LA, Watson EL, et al. Association of Sarcopenia With Mortality and End-Stage Renal Disease in Those With Chronic Kidney Disease: A UK Biobank Study. J Cachexia Sarcopenia Muscle (2021) 12(3):586–98. doi: 10.1002/jcsm.12705
23. Jardine M, Hata J, Woodward M, Perkovic V, Ninomiya T, Arima H, et al. Prediction of Kidney-Related Outcomes in Patients With Type 2 Diabetes. Am J Kidney Dis (2012) 60(5):770–8. doi: 10.1053/j.ajkd.2012.04.025
Keywords: estimated GFR, diabetic kidney disease, ESRD prediction model, revised Lund–Malmö equation, glomerular filtration rate
Citation: Lv L, Chen X, Hu J, Wu J, Luo W, Shen Y, Lan R, Li X, Wang Y, Luo T, Yang S, Li Q and Wang Z (2022) Effect of Glomerular Filtration Rate by Different Equations on Prediction Models for End-Stage Renal Disease in Diabetes. Front. Endocrinol. 13:873318. doi: 10.3389/fendo.2022.873318
Received: 10 February 2022; Accepted: 29 April 2022;
Published: 03 June 2022.
Edited by:
Jeff M. P. Holly, University of Bristol, United KingdomReviewed by:
Cindy George, South African Medical Research Council, South AfricaCopyright © 2022 Lv, Chen, Hu, Wu, Luo, Shen, Lan, Li, Wang, Luo, Yang, Li and Wang. This is an open-access article distributed under the terms of the Creative Commons Attribution License (CC BY). The use, distribution or reproduction in other forums is permitted, provided the original author(s) and the copyright owner(s) are credited and that the original publication in this journal is cited, in accordance with accepted academic practice. No use, distribution or reproduction is permitted which does not comply with these terms.
*Correspondence: Zhihong Wang, dG93emg3MTNAMTI2LmNvbQ==
Disclaimer: All claims expressed in this article are solely those of the authors and do not necessarily represent those of their affiliated organizations, or those of the publisher, the editors and the reviewers. Any product that may be evaluated in this article or claim that may be made by its manufacturer is not guaranteed or endorsed by the publisher.
Research integrity at Frontiers
Learn more about the work of our research integrity team to safeguard the quality of each article we publish.