 Rong Huang
 Huiying Wang
 Ziyang ShenTingting Cai
 Yunting ZhouYuming Wang
 Wenqing Xia
 Bo DingRengna Yan
 Huiqin LiJindan Wu
 Jianhua Ma*
- Department of Endocrinology, Nanjing First Hospital, Nanjing Medical University, Nanjing, China
Background: Subjects with type 2 diabetes mellitus (T2DM) are susceptible to osteoporosis. This study was conducted to evaluate the association between glycemic variability evaluated by continuous glucose monitoring (CGM) and osteoporosis in type 2 diabetic patient.
Methods: A total of 362 type 2 diabetic subjects who underwent bone mineral density (BMD) measurement and were monitored by a CGM system from Jan 2019 to May 2020 were enrolled in this cross-sectional study. Glycemic variability was calculated with the Easy GV software, including 24-hour mean blood glucose (24-h MBG), the standard deviation of 24-h MBG (SDBG), coefficient of variation (CV), mean amplitude of glycemic excursions (MAGE), and time in range between 3.9 and 10.0 mmol/L (TIR). Other potential influence factors for osteoporosis were also examined.
Results: Based on the T-scores of BMD measurement, there were 190 patients with normal bone mass, 132 patients with osteopenia and 40 patients with osteoporosis. T2DM patients with osteoporosis showed a higher 24-h MBG, SDBG, CV, and MAGE, but a lower TIR (all p < 0.05). Multivariate logistic regression analysis revealed that age, female gender, body mass index (BMI), low-density lipoprotein cholesterol (LDL-C), serum uric acid (SUA) and MAGE independently contribute to osteoporosis, and corresponding odds ratio [95% confidence interval (CI)] was 1.129 (1.072-1.190), 4.215 (1.613-11.012), 0.801 (0.712-0.901), 2.743 (1.385-5.431), 0.993 (0.988-0.999), and 1.380 (1.026-1.857), respectively. Further receiver operating characteristic analysis with Youden index indicated that the area under the curve and its 95% CI were 0.673 and 0.604-0.742, with the optimal cut-off value of MAGE predicting osteoporosis being 4.31 mmol/L.
Conclusion: In addition to conventional influence factors including age, female gender, BMI, LDL-C and SUA, increased glycemic variability assessed by MAGE is associated with osteoporosis in type 2 diabetic patients.
Introduction
Both type 2 diabetes mellitus (T2DM) and osteoporosis are frequent metabolic disorders, and induces high morbidity and mortality in elderly population (1, 2). It has become apparent that subjects with T2DM are susceptible to osteoporosis (3). A meta-analysis of 54 studies also showed more than one-third of T2DM patients suffered from osteoporosis in Chinese mainland (4). Therefore, great efforts have been exerted to explore potential risk factors for osteoporosis in patients with T2DM, including increasing age, female gender, unhealthy lifestyle, insulin resistance, elevated body mass index (BMI) and glycated hemoglobin (HbA1c) (5–7). However, exact risk factors and mechanisms remain unknown.
HbA1c, the “gold standard” for long-term glycemic control for decades, has been demonstrated to be positively associated with diabetic chronic complications. A cross-sectional study by Sun et al. strengthened that diabetes duration and HbA1c are risk factors for diabetic retinopathy (DR) (8). Results from Atkin et al. study showed that the HbA1c threshold of 6.5% for DR also elevated the risk of diabetic nephropathy (DN) (9). The INTERPRET-DD study involved in 2,733 subjects with T2DM from 14 countries revealed that each 1% increase in HbA1c level generates an 11 % increased risk of diabetic peripheral neuropathy (DPN) (10). Similarly, poor glycemic control evaluated by HbA1c was linked to lower concentrations of bone formation biomarkers, increasing the susceptibility to osteoporosis in type 2 diabetic postmenopausal women (11, 12). Xu et al. demonstrated that HbA1c is correlated with increased risk of osteoporosis, as well as osteopenia (6). In the study by Wen et al., higher HbA1c level could increase the risk of osteoporosis in patients with newly diagnosed T2DM, which indicated that bone metabolism has been damaged by elevated glucose level even in the early stage of T2DM (7).
During recent years, glycemic variability gained much research interests, which reflected more comprehensive glycemic control. Apart from conventional risk factors including diabetic duration, HbA1c and homeostatic model assessment of insulin resistance (HOMA-IR), Hu et al. found that increased glycemic variability assessed by mean amplitude of glycemic excursions (MAGE) independently contribute to DPN in patients with T2DM (13). Even in T2DM patients with well-controlled HbA1c, MAGE was also demonstrated to be a significantly independent contributor to DPN (14). In Sartore et al. study, glycemic variability regardless of HbA1c may be associated with the development of DR, particularly in the case of acute fluctuations and acute hyperglycemia (15). However, few studies have been performed to assess the relationship of glycemic variability with osteoporosis. Therefore, we conducted this study to evaluate the association between glycemic variability evaluated by continuous glucose monitoring (CGM) system and the risk of osteoporosis in patients with T2DM aged ≥50 years.
Methods
Study Population
This cross-sectional observational study was conducted at Department of Endocrinology, Nanjing First Hospital from Jan 2019 to May 2020. The study was approved by the Research Ethics Committee of Nanjing First Hospital in accordance with the Declaration of Helsinki (KY20170904-07), and all participants signed written informed consent. The patients who met the following criteria were included (1): diagnosis of T2DM according to the World Health Organization (1999) criteria (2); ≥ 50 years old; and (3) subjects who underwent bone mineral density (BMD) measurement and CGM. The exclusion criteria included the following: (1) patients with diabetic acute complications (i.e., diabetic ketoacidosis, diabetic hyperosmolar coma, or severe hypoglycemic events); (2) patients with severe liver diseases (a history of liver dysfunction or liver enzyme level more than two times the upper limit of normal), or kidney diseases (a history of renal dysfunction or the estimated glomerular filtration rate (eGFR) less than 60 ml/min/1.73m2); (3) patients with hyperparathyroidism, rheumatoid arthritis, or other endocrine and immune diseases; (4) patients with malignant tumors or mental disorders; (5) patients using medications that might influence bone metabolism (i.e., bisphosphonates, estrogens, selective estrogen receptor modulators (SERMs), calcitonin, calcium, vitamin D, glucocorticoid or immunosuppressive agents); and (6) no sufficient data to calculate glycemic variability.
Our sample size was calculated using PASS version 21.0.3 software (NCSS, LLC, Kaysville, Utah, USA). If we set type I error (α) as 0.05 and permissible error (δ) as 5% (assuming 20% data missing), the sample size should be at least 293 based on the prevalence of osteoporosis derived from a recent Chinese cross-sectional study (3). In this study, a total of 362 type 2 diabetic patients with complete information were ultimately enrolled.
Clinical Measurement
A questionnaire was employed to collect the information about age, gender, diabetes duration, lifestyle behaviors (i.e., smoking and drinking), and medication usage (i.e., insulin, oral hypoglycemic agents (OHA) and both). All participants underwent anthropometric measurements including height, weight, waist circumstance, hip circumstance and blood pressure. BMI was calculated as weight divided by height squared (kg/m2), and waist-to-hip ratio (WHR) was calculated as the ratio of waist circumstance to hip circumstance. Hypertension was defined as systolic blood pressure (SBP) ≥ 140 mmHg and/or diastolic blood pressure (DBP) ≥ 90 mmHg and/or a diagnosis of hypertension currently taking antihypertensive agents. Fasting blood samples were obtained for measuring fasting blood glucose (FBG), HbA1c, triglycerides (TG), total cholesterol (TC), high-density lipoprotein cholesterol (HDL-C), low-density lipoprotein cholesterol (LDL-C), serum uric acid (SUA) and serum creatinine (SCr). The eGFR was determined based on the Modification of Diet in Renal Disease (MDRD) Study formula: eGFR = 175 × (Scr) –1.154 × (age) –0.203 (× 0.742 if female) (16).
CGM Measurement
All eligible subjects had CGM (Medtronic Incorporated, Northridge, Minnesota, USA) monitored for a continuous 72h. The sensor of the CGM system monitor was inserted into anterior abdominal skin, and calibrated by at least four finger-tip capillary blood glucose readings per day. Data obtained from 0:00 to 24:00 of the second day were calculated for glycemic variability with the Easy GV software, including 24-hour mean blood glucose (24-h MBG), the standard deviation of 24-h MBG (SDBG), coefficient of variation (CV), MAGE, and time in range between 3.9 and 10.0 mmol/L (TIR).
BMD Measurement
The BMD values along with T-scores and Z-scores at the lumbar spine, femur neck, and total hip were measured using dual-energy X-ray absorptiometry (DXA) (GE lunar prodigy, GE, Madison, MA, USA; coefficient of variation = 0.30%). The T-scores were calculated with the gender-matched BMD data from healthy Asian young adults provided by the DXA equipment manufacturer. Osteoporosis was diagnosed based on the World Health Organization (WHO) T-score criteria (17). Briefly, a T-score ≥ −1.0 indicated normal, osteopenia was defined by -2.5 < T-score < −1.0, and osteoporosis was diagnosed as a T-score ≤ −2.5.
Statistical Analysis
Data were presented as mean ± standard deviation, median (interquartile range), or n (%) as appropriate. Analysis of variance (ANOVA) was applied in normally distributed data, whereas Kruskal-Wallis H test was used in asymmetrically distributed data. The frequencies of categorical variables were compared with Pearson’s chi-squared (χ2) test. Post hoc analyses were further carried out for pairwise comparisons if there were between-group differences. Univariate logistic regression analysis was used to investigate potential indicators affecting osteoporosis. Multivariable logistic regression analysis was performed to determine independent factors associated with osteoporosis susceptibility. Correlation analyses were also performed between BMD value and clinical characteristics and CGM parameters of the enrolled subjects, then stepwise multiple linear regression analyses were also run with BMD value as the dependent variable. Receiver operating characteristic (ROC) curve was employed to present the area under the curve (AUC) with corresponding 95% CI, and the Youden index was calculated to identify the optimal cut-off point of involved glycemic variability parameters for predicting diabetic osteoporosis, as well as its sensitivity and specificity. Statistical analyses were performed with SPSS version 22.0 (SPSS Inc., Chicago, IL, USA), and a p-value < 0.05 was considered statistically significant.
Results
Clinical Characteristics and CGM Parameters of the Enrolled Subjects
Table 1 summarizes the clinical characteristics and CGM parameters of the enrolled T2DM subjects. Based on the T-scores of BMD measurement, there are 190 patients with normal bone mass, 132 patients with osteopenia and 40 patients with osteoporosis. T2DM patients with osteoporosis were older, and had higher ratio of female gender, HbA1c, TC, HDL-C and LDL-C levels, but lower BMI and SUA levels (all p < 0.05). Regarding the parameters of glycemic variability, T2DM patients with osteoporosis showed higher 24-h MBG, SDBG, CV, and MAGE, but a lower TIR (all p < 0.05). Post hoc analyses revealed that there exist significant differences for all above-mentioned variables between normal and osteoporosis subjects, while for age, gender, and BMI between normal and osteopenia subjects, and gender, BMI, TC, HDL-C, LDL-C, SUA, 24-h MBG, and MAGE between osteopenia and osteoporosis subjects (all p < 0.05 after Bonferroni correction). Ratio of smoking and drinking, WHR, SBP, DBP, FBG, eGFR and usage of OHA, insulin or both were comparable among the three groups (all p > 0.05).
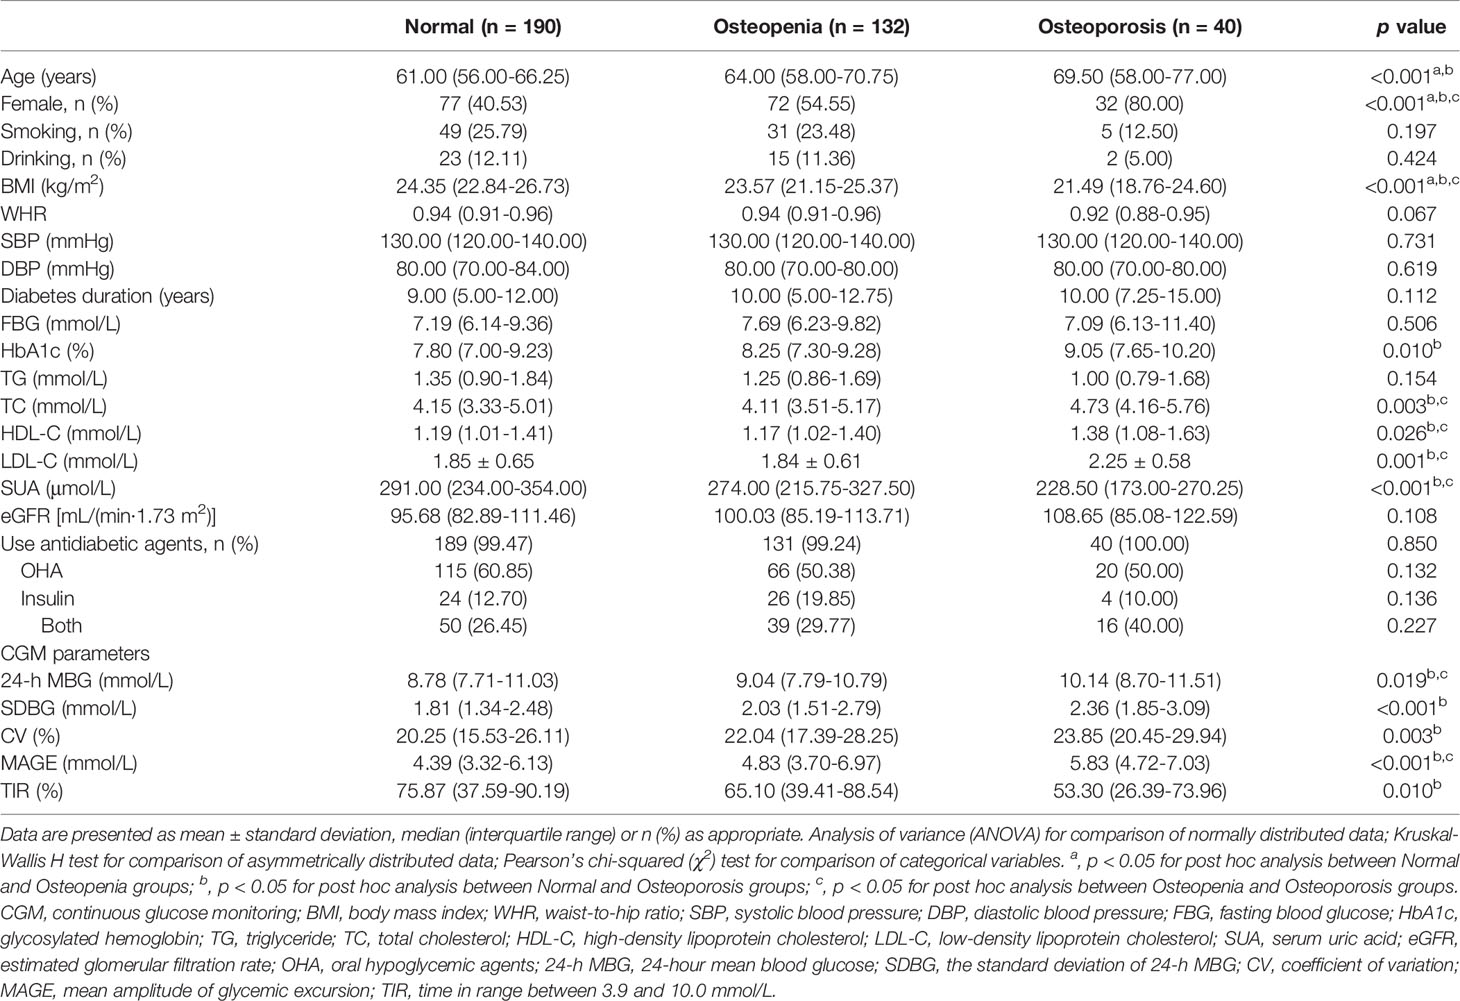
Table 1 Clinical characteristics and CGM parameters of the enrolled subjects.
Association of Glycemic Variability and Clinical Characteristics With Osteoporosis in T2DM Patients
Univariate logistic regression analysis was performed to explore potential factors for osteoporosis in T2DM patients. As shown in Table 2, osteoporosis had a positive association with age [odds ratios (95% confidence interval) (OR (95% CI)), 1.083 (1.041-1.127)], female gender [5.870 (2.567-13.423)], diabetes duration [1.063 (1.009-1.120)], HbA1c [1.401 (1.175-1.671)], HDL-C [3.861 (1.524-9.786)], LDL-C [2.647 (1.526-4.590)], 24-h MBG [1.206 (1.045-1.392)], SDBG [1.988 (1.378-2.868)], CV [1.062 (1.020-1.106)], and MAGE [1.306 (1.129-1.511)]. However, BMI [0.799 (0.719-0.889)], SUA [0.988 (0.984-0.993)], and TIR [0.995 (0.991-0.998)] were negatively associated with osteoporosis in T2DM subjects.
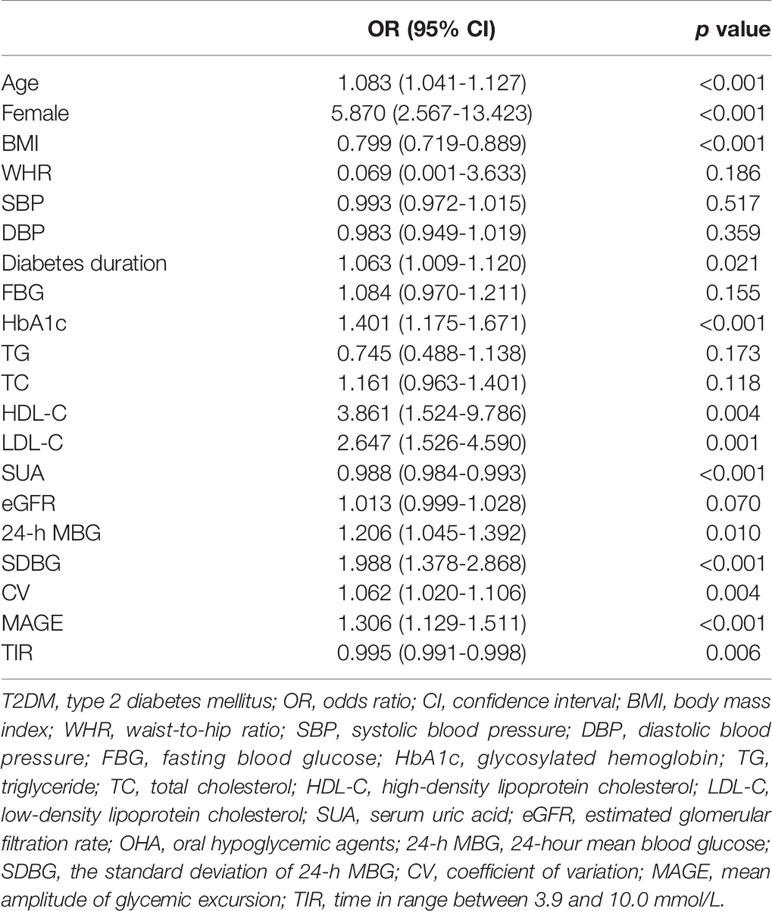
Table 2 Univariate logistic regression analysis to explore potential factors for osteoporosis in T2DM patients.
Multivariate Logistic Regression Analysis to Determine Independent Factors Associated With Osteoporosis Susceptibility in T2DM Patients
Osteoporosis was significantly correlated with age, female gender, BMI, diabetes duration, HbA1c, HDL-C, LDL-C, SUA, 24-h MBG, SDBG, CV, MAGE and TIR according to the above-mentioned univariate logistic regression analysis. Then, a multivariate logistic regression analysis was carried out to determine independent factors associated with osteoporosis susceptibility in T2DM patients. Results demonstrated that age, female gender, BMI, LDL-C, SUA and MAGE independently contribute to osteoporosis, with corresponding OR (95% CI) being 1.129 (1.072-1.190), 4.215 (1.613-11.012), 0.801 (0.712-0.901), 2.743 (1.385-5.431), 0.993 (0.988-0.999), and 1.380 (1.026-1.857), respectively (Table 3). Due to the relatively small sample size of subjects with osteoporosis, stepwise multiple linear regression analyses were also run with BMD value as the dependent variable, and the results were in substantial concordance with our findings with osteoporosis as outcome (Tables S1, S2).
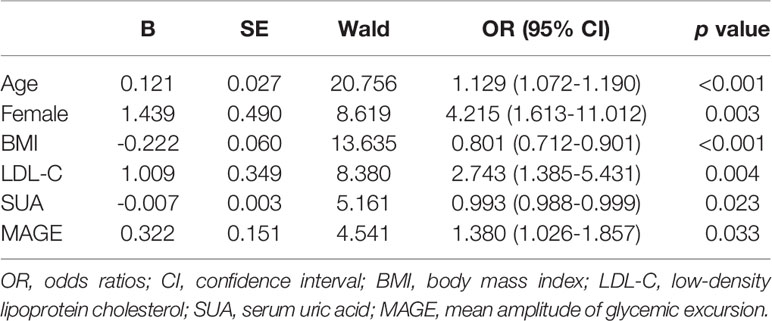
Table 3 Multivariate logistic regression analysis to determine independent factors associated with osteoporosis susceptibility in T2DM patients.
ROC Analysis to Identify the Optimal Cut-Off Value of MAGE Predicting Osteoporosis in T2DM Patients
Regardless of HbA1c, increased glycemic variability assessed by MAGE was associated with osteoporosis. Then, ROC analysis and the Youden index were employed to identify the optimal cut-off value of MAGE to predict osteoporosis in T2DM patients. The corresponding AUC and its 95% CI were 0.673 and 0.604-0.742, with the optimal MAGE cut-off value predicting osteoporosis being 4.31 mmol/L (Figure 1).
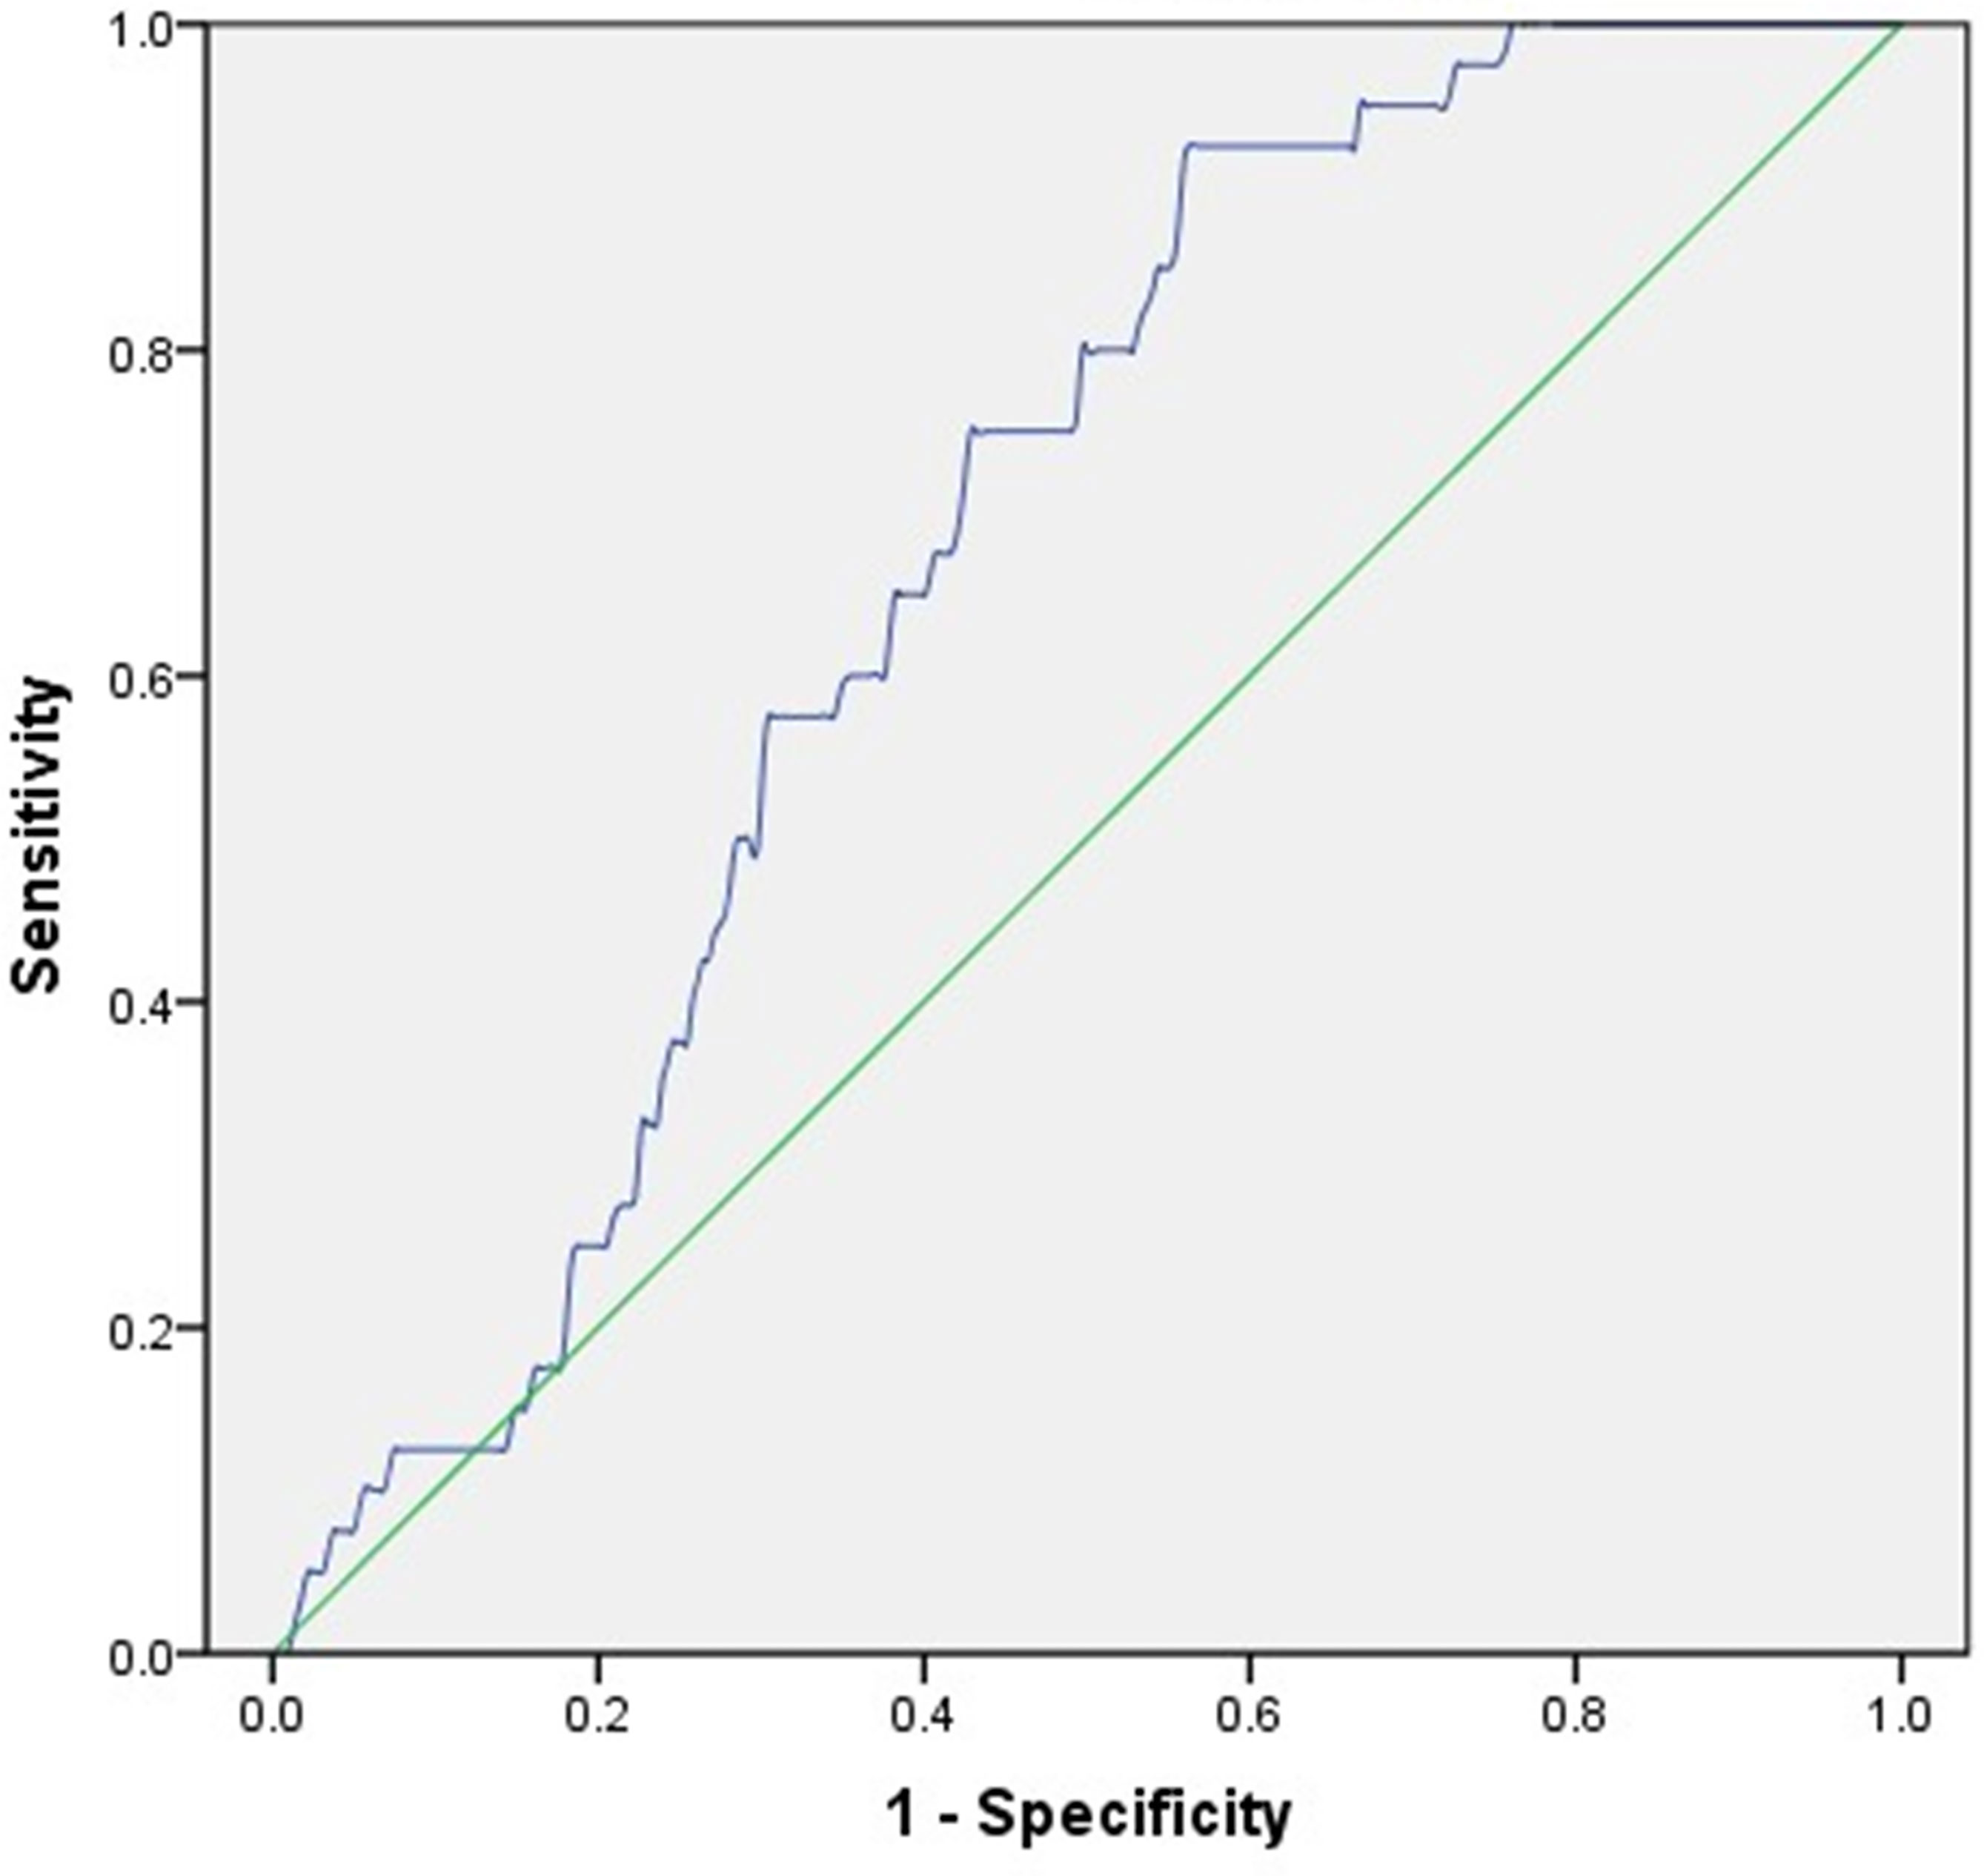
Figure 1 ROC analysis employed to identify the optimal cut-off value of MAGE to predict osteoporosis in T2DM patients. AUC (95% CI) = 0.673 (0.604-0.742), cut-off point = 4.31 mmol/L, Youden index = 0.366, sensitivity = 92.50%, specificity = 55.90%.
Discussion
To our certain knowledge, this study is the first to reveal the relationship between CGM-assessed glycemic variability and the susceptibility to osteoporosis in type 2 diabetic patients. Among a population of 362 subjects with T2DM, we observed 24-h MBG, SDBG, CV, and MAGE were positively associated with osteoporosis, while TIR was inversely related to osteoporosis. Further multivariate logistic regression analysis revealed that MAGE was an independent contributor to osteoporosis regardless of HbA1c, with each 1-mmol/L increment of MAGE being associated with a 38% higher relative risk of osteoporosis. ROC analysis demonstrated that the optimal MAGE cut-off value predicting osteoporosis was 4.31 mmol/L. In addition, age, female gender and LDL-C were also independent risk factors, while BMI and SUA were independent protective factors for osteoporosis in type 2 diabetic patients.
As HbA1c reflects average glucose levels over the past 2-3 months, glycemic variability as assessed by CGM system may reflect more accurately glucose profiles. Importantly, MAGE was first demonstrated to be an independent contributor to osteoporosis in patients with T2DM in the current study. The exact mechanisms remain unknown. One possible reason was that higher MAGE may reflect increased ratio of acute hyperglycemia, while acute hyperglycemia was capable of inducing alkaline phosphatase and suppressing osteocalcin in differentiated osteoblasts (18). Second, increased glycemic variability was also linked to lower BMI in newly diagnosed Chinese type 2 diabetic patients, and low BMI was proved to be a risk factor for osteoporosis (19). Third, results derived from a cross-sectional study showed that osteoporotic women had markedly lower antioxidant levels (20). MAGE has also been linked to high-sensitivity C-reactive protein (hs-CRP) and diacron-reactive oxygen metabolites (d-ROMs), which raise the possibility that MAGE may contribute to bone loss and osteoporosis via promoting oxidative stress and inflammatory status (21, 22). Additionally, studies have shown potential effect of gut microbiota on BMD and osteoporosis, and plasma glucose level was identified to contribute significantly to a differentiated gut microbiota structure (23–25). Therefore, gut microbiota may mediate osteoporosis induced by MAGE.
In this study, we also reported that age, female gender, and BMI are independently associated with osteoporosis in patients with T2DM. The results were partially consistent with a previous study conducted in healthy volunteers, which confirmed that age, sex, and BMI are significant predictors of osteoporosis in Chinese (26). Postmenopausal women have been generally recognized as the population with high risk of osteoporosis, which may be mainly explained by an obvious decline in estrogen level (27). Most previous studies also proposed a high BMI to exert a protective factor for osteoporosis (28–30). One possible reason was that adipocytes are important for estrogen production sources, and a higher BMI may indirectly affect osteoblast and osteoclast activity by producing more estrogen sources (31). Additionally, a higher BMI partly reflects more subcutaneous fat, which exerts beneficial roles in bone structure and strength (32).
The association between serum lipids and bone metabolism has been extensively investigated but shown conflicting findings. Our study found that higher LDL-C level is independently associated with osteoporosis in type 2 diabetic patients. Cui et al. and Li et al. both revealed that elevated serum HDL-C level has a greater probability of being osteoporosis, but no correlations between LDL-C, TC, and TG and osteoporosis (26–33). In a cross-sectional study by Zhang et al., non-linear relationships were found of TC, LDL-C, HDL-C with lumbar spine BMD in postmenopausal women (34). Results from an epidemiological study in South Korea pre-menopausal and post-menopausal women exhibited a negative correlation between serum TC, LDL-C levels and BMD (35). A Mendelian randomization study also observed causal effect of LDL-C to BMD (36). Possibly, different sources and number of participants, inclusion of confounding factors, and methods of analysis contributed to the inconsistent results. Increased lipid levels may bring about progressive oxidation accumulation in the subendothelial matrix of bone vessels, while these oxidized lipids inhibited the differentiation and mineralization of bone cells (37). Statins, a class of drugs that primarily lower LDL, could particularly intervene in bone turnover and remodeling via acting on bone marrow mesenchymal stem cells and osteoclasts (38).
Consistent with our study, positive association was found between SUA and BMD, which suggested SUA is protective against osteoporosis in type 2 diabetic patients (39–42). A 6-year longitudinal study also demonstrated that lower SUA level is associated with higher occurrence of at least osteopenia in Chinese type 2 diabetic patients (43). In subjects without T2DM, SUA was also revealed to be positively correlated with BMD (44–46). Whereas in subgroup analyses according to ethnicity by Yao et al, an inverted U-shaped curve relationship was found about the association of SUA with lumbar BMD in blacks (47). In vitro study has shown promotion of proliferation and osteogenic differentiation in human mesenchymal stem cells with the increased concentration of SUA (48). As reduced BMD is related to increased level of oxidative stress and inflammation, SUA might also protect against osteoporosis via antioxidant capacity (49, 50). However, SUA is a metabolic waste product of purine, and hyperuricemia is a main cause of gout, which supported the phenomenon that subjects with SUA over than 7.5mg/dL is susceptible to osteoporosis (51).
However, several limitations should be noted in the current study. First, we could not draw the conclusion whether MAGE is a cause or an effect for osteoporosis in type 2 diabetic patients as this was a cross-sectional study. In addition, the 3-day CGM-based MAGE may not fully represent glycemic control of the included subjects in peacetime. Second, only hospital-based Chinese Han population were enrolled in the present study, therefore, our results may not be generalizable to all patients from other ethnic groups. Third, only 40 T2DM subjects with osteoporosis, especially among women and with a rather large number of confounders were included in our study, which may limit the power of the study. Although consistent results were drawn with BMD value as the dependent variable by stepwise multiple linear regression analyses, further studies with a substantial sample size should be divided into a training set and a validation set, as well as a validation in a heterogeneous population using Machine Learning algorithms is needed to verify this finding. Then, serum estrogen level as well as some bone turnover markers were not measured in this study, including procollagen type I N-terminal propeptide (P1NP), β-Cross Laps of type I collagen containing cross-linked C-telopeptide (β-CTX) and osteocalcin. Moreover, physical activity and dietary patterns, which could potentially affect glycemic variability, were not evaluated in our study.
In conclusion, increased glycemic variability assessed by MAGE is associated with osteoporosis in patients with T2DM, in addition to conventional influence factors including age, female gender, BMI, LDL-C and SUA. Further well-designed prospective cohort studies are warranted to confirm this observed association, and to determine the causality of MAGE with the onset and progression of osteoporosis in type 2 diabetic patients.
Data Availability Statement
The original contributions presented in the study are included in the article/Supplementary Material. Further inquiries can be directed to the corresponding author.
Ethics Statement
The studies involving human participants were reviewed and approved by the Research Ethics Committee of Nanjing First Hospital, Nanjing Medical University. The patients/participants provided their written informed consent to participate in this study.
Author Contributions
JM and RH designed the study. RH, HW, ZS, TC, YZ and YW collected the data, RH, HW and ZS performed the analyses. RH, WX, BD and RY wrote the first draft. And HL, JW and JM checked the manuscript and revised it. All authors approved the final submission.
Funding
This work was supported by the National Key R&D Program of China (No. 2018YFC1314100), the National Natural Science Foundation of China (No. 81870563) and the Science and Technology Development Fund of Nanjing Medical University (No. NMUB2020209).
Conflict of Interest
The authors declare that the research was conducted in the absence of any commercial or financial relationships that could be construed as a potential conflict of interest.
Publisher’s Note
All claims expressed in this article are solely those of the authors and do not necessarily represent those of their affiliated organizations, or those of the publisher, the editors and the reviewers. Any product that may be evaluated in this article, or claim that may be made by its manufacturer, is not guaranteed or endorsed by the publisher.
Supplementary Material
The Supplementary Material for this article can be found online at: https://www.frontiersin.org/articles/10.3389/fendo.2022.861131/full#supplementary-material
References
1. Sun H, Saeedi P, Karuranga S, Pinkepank M, Ogurtsova K, Duncan BB, et al. IDF Diabetes Atlas: Global, Regional and Country-Level Diabetes Prevalence Estimates for 2021 and Projections for 2045. Diabetes Res Clin Pract (2021) 183:109119. doi: 10.1016/j.diabres.2021.109119
2. Salari N, Darvishi N, Bartina Y, Larti M, Kiaei A, Hemmati M, et al. Global Prevalence of Osteoporosis Among the World Older Adults: A Comprehensive Systematic Review and Meta-Analysis. J Orthop Surg Res (2021) 16(1):669. doi: 10.1186/s13018-021-02821-8
3. Li Y, Zhao Z, Wang L, Fu Z, Ji L, Wu X. The Prevalence of Osteoporosis Tested by Quantitative Computed Tomography in Patients With Different Glucose Tolerances. J Clin Endocrinol Metab (2020) 105(1):201–9. doi: 10.1210/clinem/dgz036
4. Si Y, Wang C, Guo Y, Xu G, Ma Y. Prevalence of Osteoporosis in Patients With Type 2 Diabetes Mellitus in the Chinese Mainland: A Systematic Review and Meta-Analysis. Iran J Public Health (2019) 48(7):1203–14. doi: 10.18502/ijph.v48i7.2942
5. Xia J, Zhong Y, Huang G, Chen Y, Shi H, Zhang Z. The Relationship Between Insulin Resistance and Osteoporosis in Elderly Male Type 2 Diabetes Mellitus and Diabetic Nephropathy. Ann Endocrinol (Paris) (2012) 73(6):546–51. doi: 10.1016/j.ando.2012.09.009
6. Xu H, Wang Z, Li X, Fan M, Bao C, Yang R, et al. Osteoporosis and Osteopenia Among Patients With Type 2 Diabetes Aged >/=50: Role of Sex and Clinical Characteristics. J Clin Densitom (2020) 23(1):29–36. doi: 10.1016/j.jocd.2019.04.004
7. Wen Y, Li H, Zhang X, Liu P, Ma J, Zhang L, et al. Correlation of Osteoporosis in Patients With Newly Diagnosed Type 2 Diabetes: A Retrospective Study in Chinese Population. Front Endocrinol (Lausanne) (2021) 12:531904. doi: 10.3389/fendo.2021.531904
8. Sun Q, Jing Y, Zhang B, Gu T, Meng R, Sun J, et al. The Risk Factors for Diabetic Retinopathy in a Chinese Population: A Cross-Sectional Study. J Diabetes Res (2021) 2021:5340453. doi: 10.1155/2021/5340453
9. Atkin SL, Butler AE, Hunt SC, Kilpatrick ES. The Retinopathy-Derived HbA1c Threshold of 6.5% for Type 2 Diabetes Also Captures the Risk of Diabetic Nephropathy in NHANES. Diabetes Obes Metab (2021) 23(9):2109–15. doi: 10.1111/dom.14449
10. Lu Y, Xing P, Cai X, Luo D, Li R, Lloyd C, et al. Prevalence and Risk Factors for Diabetic Peripheral Neuropathy in Type 2 Diabetic Patients From 14 Countries: Estimates of the INTERPRET-DD Study. Front Public Health (2020) 8:534372. doi: 10.3389/fpubh.2020.534372
11. Wang L, Li T, Liu J, Wu X, Wang H, Li X, et al. Association Between Glycosylated Hemoglobin A1c and Bone Biochemical Markers in Type 2 Diabetic Postmenopausal Women: A Cross-Sectional Study. BMC Endocr Disord (2019) 19(1):31. doi: 10.1186/s12902-019-0357-4
12. Zhao H, Qi C, Zheng C, Gan K, Ren L, Song G. Effects of Glycated Hemoglobin Level on Bone Metabolism Biomarkers in Patients With Type 2 Diabetes Mellitus. Diabetes Metab Syndr Obes (2020) 13:1785–91. doi: 10.2147/DMSO.S248844
13. Hu YM, Zhao LH, Zhang XL, Cai HL, Huang HY, Xu F, et al. Association of Glycaemic Variability Evaluated by Continuous Glucose Monitoring With Diabetic Peripheral Neuropathy in Type 2 Diabetic Patients. Endocrine (2018) 60(2):292–300. doi: 10.1007/s12020-018-1546-z
14. Xu F, Zhao LH, Su JB, Chen T, Wang XQ, Chen JF, et al. The Relationship Between Glycemic Variability and Diabetic Peripheral Neuropathy in Type 2 Diabetes With Well-Controlled HbA1c. Diabetol Metab Syndr (2014) 6(1):139. doi: 10.1186/1758-5996-6-139
15. Sartore G, Chilelli NC, Burlina S, Lapolla A. Association Between Glucose Variability as Assessed by Continuous Glucose Monitoring (CGM) and Diabetic Retinopathy in Type 1 and Type 2 Diabetes. Acta Diabetol (2013) 50(3):437–42. doi: 10.1007/s00592-013-0459-9
16. Levey AS, Coresh J, Greene T, Stevens LA, Zhang YL, Hendriksen S, et al. Chronic Kidney Disease Epidemiology C. Using Standardized Serum Creatinine Values in the Modification of Diet in Renal Disease Study Equation for Estimating Glomerular Filtration Rate. Ann Intern Med (2006) 145(4):247–54. doi: 10.7326/0003-4819-145-4-200608150-00004
17. Kanis JA, Melton LJ 3rd, Christiansen C, Johnston CC, Khaltaev N. The Diagnosis of Osteoporosis. J Bone Miner Res (1994) 9(8):1137–41. doi: 10.1002/jbmr.5650090802
18. Botolin S, McCabe LR. Chronic Hyperglycemia Modulates Osteoblast Gene Expression Through Osmotic and non-Osmotic Pathways. J Cell Biochem (2006) 99(2):411–24. doi: 10.1002/jcb.20842
19. Wang J, Yan R, Wen J, Kong X, Li H, Zhou P, et al. Association of Lower Body Mass Index With Increased Glycemic Variability in Patients With Newly Diagnosed Type 2 Diabetes: A Cross-Sectional Study in China. Oncotarget (2017) 8(42):73133–43. doi: 10.18632/oncotarget.17111
20. Maggio D, Barabani M, Pierandrei M, Polidori MC, Catani M, Mecocci P, et al. Marked Decrease in Plasma Antioxidants in Aged Osteoporotic Women: Results of a Cross-Sectional Study. J Clin Endocrinol Metab (2003) 88(4):1523–7. doi: 10.1210/jc.2002-021496
21. Shi CH, Wang C, Bai R, Zhang XY, Men LL, Du JL. Associations Among Glycemic Excursions, Glycated Hemoglobin and High-Sensitivity C-Reactive Protein in Patients With Poorly Controlled Type 2 Diabetes Mellitus. Exp Ther Med (2015) 10(5):1937–42. doi: 10.3892/etm.2015.2730
22. Ohara M, Kohata Y, Nagaike H, Koshibu M, Gima H, Hiromura M, et al. Association of Glucose and Blood Pressure Variability on Oxidative Stress in Patients With Type 2 Diabetes Mellitus and Hypertension: A Cross-Sectional Study. Diabetol Metab Syndr (2019) 11:29. doi: 10.1186/s13098-019-0425-y
23. Cheng B, Wen Y, Yang X, Cheng S, Liu L, Chu X, et al. Gut Microbiota is Associated With Bone Mineral Density : An Observational and Genome-Wide Environmental Interaction Analysis in the UK Biobank Cohort. Bone Joint Res (2021) 10(11):734–41. doi: 10.1302/2046-3758.1011.BJR-2021-0181.R1
24. Li S, Mao Y, Zhou F, Yang H, Shi Q, Meng B. Gut Microbiome and Osteoporosis: A Review. Bone Joint Res (2020) 9(8):524–30. doi: 10.1302/2046-3758.98.BJR-2020-0089.R1
25. Qin Q, Yan S, Yang Y, Chen J, Yan H, Li T, et al. The Relationship Between Osteoporosis and Intestinal Microbes in the Henan Province of China. Front Cell Dev Biol (2021) 9:752990. doi: 10.3389/fcell.2021.752990
26. Cui R, Zhou L, Li Z, Li Q, Qi Z, Zhang J. Assessment Risk of Osteoporosis in Chinese People: Relationship Among Body Mass Index, Serum Lipid Profiles, Blood Glucose, and Bone Mineral Density. Clin Interv Aging (2016) 11:887–95. doi: 10.2147/CIA.S103845
27. Manolagas SC, O'Brien CA, Almeida M. The Role of Estrogen and Androgen Receptors in Bone Health and Disease. Nat Rev Endocrinol (2013) 9(12):699–712. doi: 10.1038/nrendo.2013.179
28. Mazocco L, Chagas P. Association Between Body Mass Index and Osteoporosis in Women From Northwestern Rio Grande do Sul. Rev Bras Reumatol Engl Ed (2017) 57(4):299–305. doi: 10.1016/j.rbre.2016.10.002
29. Sheng Z, Xu K, Ou Y, Dai R, Luo X, Liu S, et al. Relationship of Body Composition With Prevalence of Osteoporosis in Central South Chinese Postmenopausal Women. Clin Endocrinol (Oxf) (2011) 74(3):319–24. doi: 10.1111/j.1365-2265.2010.03941.x
30. Asomaning K, Bertone-Johnson ER, Nasca PC, Hooven F, Pekow PS. The Association Between Body Mass Index and Osteoporosis in Patients Referred for a Bone Mineral Density Examination. J Womens Health (Larchmt) (2006) 15(9):1028–34. doi: 10.1089/jwh.2006.15.1028
31. Simpson ER. Sources of Estrogen and Their Importance. J Steroid Biochem Mol Biol (2003) 86(3-5):225–30. doi: 10.1016/S0960-0760(03)00360-1
32. Gilsanz V, Chalfant J, Mo AO, Lee DC, Dorey FJ, Mittelman SD. Reciprocal Relations of Subcutaneous and Visceral Fat to Bone Structure and Strength. J Clin Endocrinol Metab (2009) 94(9):3387–93. doi: 10.1210/jc.2008-2422
33. Li S, Guo H, Liu Y, Wu F, Zhang H, Zhang Z, et al. Relationships of Serum Lipid Profiles and Bone Mineral Density in Postmenopausal Chinese Women. Clin Endocrinol (Oxf) (2015) 82(1):53–8. doi: 10.1111/cen.12616
34. Zhang Q, Zhou J, Wang Q, Lu C, Xu Y, Cao H, et al. Association Between Bone Mineral Density and Lipid Profile in Chinese Women. Clin Interv Aging (2020) 15:1649–64. doi: 10.2147/CIA.S266722
35. Cui LH, Shin MH, Chung EK, Lee YH, Kweon SS, Park KS, et al. Association Between Bone Mineral Densities and Serum Lipid Profiles of Pre- and Post-Menopausal Rural Women in South Korea. Osteoporos Int (2005) 16(12):1975–81. doi: 10.1007/s00198-005-1977-2
36. Yang XL, Cui ZZ, Zhang H, Wei XT, Feng GJ, Liu L, et al. Causal Link Between Lipid Profile and Bone Mineral Density: A Mendelian Randomization Study. Bone (2019) 127:37–43. doi: 10.1016/j.bone.2019.05.037
37. Parhami F, Morrow AD, Balucan J, Leitinger N, Watson AD, Tintut Y, et al. Lipid Oxidation Products Have Opposite Effects on Calcifying Vascular Cell and Bone Cell Differentiation. A Possible Explanation for the Paradox of Arterial Calcification in Osteoporotic Patients. Arterioscler Thromb Vasc Biol (1997) 17(4):680–7. doi: 10.1161/01.ATV.17.4.680
38. Shah SR, Werlang CA, Kasper FK, Mikos AG. Novel Applications of Statins for Bone Regeneration. Natl Sci Rev (2015) 2(1):85–99. doi: 10.1093/nsr/nwu028
39. Zhao X, Yu X, Zhang X. Association Between Uric Acid and Bone Mineral Density in Postmenopausal Women With Type 2 Diabetes Mellitus in China: A Cross-Sectional Inpatient Study. J Diabetes Res (2020) 2020:3982831. doi: 10.1155/2020/3982831
40. Yan P, Zhang Z, Wan Q, Zhu J, Li H, Gao C, et al. Association of Serum Uric Acid With Bone Mineral Density and Clinical Fractures in Chinese Type 2 Diabetes Mellitus Patients: A Cross-Sectional Study. Clin Chim Acta (2018) 486:76–85. doi: 10.1016/j.cca.2018.07.033
41. Xu M, Su J, Hao J, Zhong N, Zhang Z, Cui R, et al. Positive Association Between Serum Uric Acid and Bone Mineral Density in Chinese Type 2 Diabetes Mellitus Stratified by Gender and BMI. J Bone Miner Metab (2018) 36(5):609–19. doi: 10.1007/s00774-017-0877-9
42. Zhao DD, Jiao PL, Yu JJ, Wang XJ, Zhao L, Xuan Y, et al. Higher Serum Uric Acid Is Associated With Higher Bone Mineral Density in Chinese Men With Type 2 Diabetes Mellitus. Int J Endocrinol (2016) 2016:2528956. doi: 10.1155/2016/2528956
43. Yang K, Miao H, Zhao R, Wu X, Liu B, Zheng S, et al. Association Between Serum Uric Acid and Bone Mineral Density in Patients With Type 2 Diabetes: A 6-Year Longitudinal Study in China. Med (Baltimore) (2021) 100(17):e25733. doi: 10.1097/MD.0000000000025733
44. Ibrahim WN, Younes N, Shi Z, Abu-Madi MA. Serum Uric Acid Level Is Positively Associated With Higher Bone Mineral Density at Multiple Skeletal Sites Among Healthy Qataris. Front Endocrinol (Lausanne) (2021) 12:653685. doi: 10.3389/fendo.2021.653685
45. Yan DD, Wang J, Hou XH, Bao YQ, Zhang ZL, Hu C, et al. Association of Serum Uric Acid Levels With Osteoporosis and Bone Turnover Markers in a Chinese Population. Acta Pharmacol Sin (2018) 39(4):626–32. doi: 10.1038/aps.2017.165
46. Nabipour I, Sambrook PN, Blyth FM, Janu MR, Waite LM, Naganathan V, et al. Serum Uric Acid is Associated With Bone Health in Older Men: A Cross-Sectional Population-Based Study. J Bone Miner Res (2011) 26(5):955–64. doi: 10.1002/jbmr.286
47. Yao X, Chen L, Xu H, Zhu Z. The Association Between Serum Uric Acid and Bone Mineral Density in Older Adults. Int J Endocrinol (2020) 2020:3082318. doi: 10.1155/2020/3082318
48. Li HZ, Chen Z, Hou CL, Tang YX, Wang F, Fu QG. Uric Acid Promotes Osteogenic Differentiation and Inhibits Adipogenic Differentiation of Human Bone Mesenchymal Stem Cells. J Biochem Mol Toxicol (2015) 29(8):382–7. doi: 10.1002/jbt.21707
49. Hardy R, Cooper MS. Bone Loss in Inflammatory Disorders. J Endocrinol (2009) 201(3):309–20. doi: 10.1677/JOE-08-0568
50. Bowman GL, Shannon J, Frei B, Kaye JA, Quinn JF. Uric Acid as a CNS Antioxidant. J Alzheimers Dis (2010) 19(4):1331–6. doi: 10.3233/JAD-2010-1330
Keywords: type 2 diabetes mellitus, osteoporosis, continuous glucose monitoring, glycemic variability, mean amplitude of glycemic excursions
Citation: Huang R, Wang H, Shen Z, Cai T, Zhou Y, Wang Y, Xia W, Ding B, Yan R, Li H, Wu J and Ma J (2022) Increased Glycemic Variability Evaluated by Continuous Glucose Monitoring is Associated with Osteoporosis in Type 2 Diabetic Patients. Front. Endocrinol. 13:861131. doi: 10.3389/fendo.2022.861131
Received: 24 January 2022; Accepted: 04 May 2022;
Published: 06 June 2022.
Edited by:
Jakob Starup-Linde, Aarhus University Hospital, DenmarkReviewed by:
Peter Vestergaard, Aalborg University Hospital, DenmarkKok Yong Chin, National University of Malaysia, Malaysia
Copyright © 2022 Huang, Wang, Shen, Cai, Zhou, Wang, Xia, Ding, Yan, Li, Wu and Ma. This is an open-access article distributed under the terms of the Creative Commons Attribution License (CC BY). The use, distribution or reproduction in other forums is permitted, provided the original author(s) and the copyright owner(s) are credited and that the original publication in this journal is cited, in accordance with accepted academic practice. No use, distribution or reproduction is permitted which does not comply with these terms.
*Correspondence: Jianhua Ma, bWFqaWFuaHVhMTk2NTAzQDEyNi5jb20=