 Meng-jiao Gao1†
 Hui-zhong Xue1†
 Rui Cai2Bi-yao Jiang1Bao-hong Mi3Zong-jun Chen1Yin-chun Shi1Yong-hua Xiao4*Wen-zheng Zhang4*
- 1The First Clinical Medical School, Beijing University of Chinese Medicine, Beijing, China
- 2Beijing Wholelife Medical Science Co., Ltd., Beijing, China
- 3School of Acupuncture-Moxibustion and Tuina, Beijing University of Chinese Medicine, Beijing, China
- 4Dongzhimen Hospital, Beijing University of Chinese Medicine, Beijing, China
Objective: To explore the temperature distribution characteristics of the face, palms, feet and the trunk area of metabolic syndrome (MS) through infrared thermography (IRT) and provide evidence for the application of IRT in the assistant evaluation of MS population.
Methods: We collected thermographs of 184 participants (91 males, 93 females) and further divided participants of each gender into 4 groups according to the number of abnormal metabolic indexes. Mean temperatures of 6 Region of Interests (ROIs) (face, anterior trunk, bilateral palms and dorsum of feet) were calculated. Comparisons of the mean temperatures between genders, among groups and ROIs were carried out.
Results: Male participants had higher mean temperature in their face, palms (P<0.01) and dorsum of feet (P<0.05), and lower mean temperature in the anterior trunk (P<0.01). Female participants with MS had higher mean temperature in their palms and dorsum of feet (P<0.01) and lower mean temperature in the anterior trunk (P<0.01) than normal participants. Similar tendencies were shown in the mean temperature of the left palms and trunk of MS males. With the increase of the number of abnormal metabolic indexes, it seems that the mean temperature gradually increased in palms and dorsum of feet, and decreased in the anterior trunk.
Conclusion: The thermograph of MS exhibits certain characteristics. This may help reveal the correlations between Infrared thermography and metabolic disorders.
1 Introduction
Metabolic Syndrome (MS) is a clinical syndrome characterized by the presence of a group of metabolic disorders, including hyperglycemia (Diabetes Mellitus, DM, or Impaired Glucose Regulation, IGR), dyslipidemia (hypertriglyceridemia and/or low high density lipoprotein cholesterol), hypertension and central obesity (1). Evidence indicates that MS significantly promotes the onset and progression of type 2 diabetes mellitus (T2DM), cardiovascular and cerebrovascular diseases. Compared with patients without MS, MS patients had a higher risk and mortality of cardiovascular disease (CVD) (with a relative risk of 2.35 and 2.40, respectively) (2). In 2013-2014, the prevalence of MS adults was 31.5% in the US (3). In Mainland China, the prevalence of MS among the population aged 15 years and older has reached 24.5% in 2016 (4). According to the Yearbook issued by China’s National Health and Family Planning Commission, the total cost of hospitalization for diabetes, acute myocardial infarction and cerebral infarction in China has reached RMB 49.1 billion in 2016 (5), more than three times higher than that in 2012 (6). The increasing prevalence of MS implicates a heavy global health burden and socioeconomic cost, making it of great significance for early diagnosis and intervention of MS.
Nevertheless, in China, 2015, the awareness rate, treatment rate, and control rate of hypertension among adults were 51.6%, 45.8%, and 16.8%, respectively (7). In the 2013 national survey, undiagnosed diabetics accounted for 63% of the total (8). In 2010, the awareness rate, treatment rate, and control rate of dyslipidemia in Chinese adults were 10.93%, 6.84%, and 3.53%, respectively (9). The unsatisfying control station of MS might be the results due to asymptomatic MS patients of early-stage and complicated diagnostic procedure, which involves multiple assessments of body indexes such as blood glucose, blood lipid, blood pressure, waist circumference, etc., some of which are invasive examination and inconvenient to patients. Hence, it’s meaningful to explore a method that can effectively and quickly pick out MS patients as well as the high-risk groups of MS from so-called “healthy people”, assisting early detections and evaluation of the MS population.
Infrared thermography (IRT) is a technique capable of capturing infrared radiation emanating from the human body and converting it to temperature with the output of thermal maps (10). This accurate (with a thermal resolution of 0.03-0.1°C), non-contact and non-invasive technique has been used to early screening and efficacy evaluation of numerous diseases such as breast cancer, diabetic neuropathy, liver metastases, cardiovascular disease and so on (11, 12). The body surface temperature is mainly affected by local blood perfusion, but the influence of muscle activity and metabolic activity cannot be excluded (13). It might serve as an indicator of the function of corresponding parts of the body. Therefore, it’s possible to detect diseases before the noticeable occurrence of structural changes.
According to recent studies, the metabolic indexes which are used in the diagnosis of MS do have correlations with skin temperature: temperature of palms of DM patients tend to be lower than that of normal people (14). While overweight females have lower mean abdominal temperature and higher hand temperature than the lean ones (15), and average skin surface temperature (°C) waveform of hypertension participants varies from normal participants (16). Besides, skin temperature of the anterior supraclavicular shows the ability to detect brown adipose tissue (BAT) activation, which is involved in the body weight, glucose and lipid regulation, reflecting the metabolic changes (17, 18). Therefore, IRT exhibits the potential of indicating metabolic disorders, and may have some advantages and application prospects in MS screening.
Based on the current findings, we conducted this study which sought to explore the temperature distribution characteristics of the face, trunk, palms and feet of MS, hope to establish the correlation between specific thermograph patterns and metabolic disorder, and provide reference to further studies and the application of IRT in early assistant diagnosis and evaluation of MS population.
2 Materials and Methods
2.1 Participants
The data of this retrospective study were collected from patients who visited the Health Management Center of the International Department of Dongzhimen Hospital and the endocrinology department of Dongzhimen Hospital, Beijing University of Chinese Medicine from June 2016 to April 2019. After reviewing the inclusion, exclusion and rejection criteria, 184 Asian participants aged between 18 and 70 were brought into the study, including 91 males and 93 females. This study has been waived the requirement for informed consent by the institutional Ethics Committee of Dongzhimen Hospital because of its retrospective nature (No. DZMEC-KY-2020-12).
The MS diagnostic criteria used in the study was published in Guidelines for the prevention and control of type 2 diabetes in China (2017 Edition) (19) by Chinese Diabetes Society: 1) Abdominal obesity: waist circumference ≥ 90 cm in males and 85 cm in females; 2) Hyperglycemia: fasting plasma glucose ≥6.1 mmol/L or 2-hour plasma glucose ≥ 7.8mmol/L following a 75 g oral glucose load and (or) diabetes diagnosis has been confirmed; 3) Hypertension: blood pressure≥130/85 mmHg and (or) hypertension diagnosis has been confirmed; 4) Fasting TG≥1.70 mmol/L; 5) Fasting HDL-C<1.04 mmol/L; 3 out of 5 factors above are required.
Exclusion criteria: 1) Coronary heart disease, cerebral vascular disease, hypertensive nephropathy, diabetic retinopathy, diabetic peripheral neuropathy, diabetic peripheral vascular disease, diabetic nephropathy or other severe chronic complications caused by MS constituents (hypertension, hyperlipidemia, diabetes); 2) Menstruation, pregnancy or lactation; 3) Diseases that may affect body temperatures, such as cold and thyroid disease; 4) Medical histories of hepatic and renal insufficiency, hematopathy, tumor, severe trauma or major surgery; 5) Critical illness such as diabetic ketoacidosis, hypertensive crisis and hypertensive encephalopathy.
Rejection criteria: 1) Data with obvious error, low creditability or omissions; 2) Thermal maps taken in non-standard positions, blurring or interfered by sweat or medical ultrasonic couplant.
2.2 Groups
The participants were grouped by their gender (group M for males and group F for females) and further divided into four groups according to the number of abnormal metabolic indexes.
1) Two normal groups (M0, F0) with no abnormal metabolic index, consist of 26 participants in group M0 and 50 participants in group F0;
2) Two groups with 1 abnormal index (M1, F1), consist of 18 participants in group M1 and 21 participants in group F1;
3) Two groups with 2 abnormal indexes (M2, F2), consist of 16 participants in group M2 and 10 participants in group F2;
4) Two MS groups (M3, F3) with 3 or more abnormal indexes, consist of 31 participants in group M3 and 12 participants in group F3.
2.3 Methods
The following data of all participants were collected: demographics (gender, age), medical history, body measurement indexes (height, body mass, BMI, waist circumference, hip circumference), systolic blood pressure (SBP) and diastolic blood pressure (DBP), fasting plasma glucose (FPG), total cholesterol (TC), triglyceride (TG), high density lipoprotein cholesterol (HDL-C), low density lipoprotein cholesterol (LDL-C), serum uric acid (UA), etc.
Thermography and all those data above of each participant were obtained on the same day. Thermography was captured by an HIR-2000A (FLIR detector) medical infrared camera produced by Beijing Yuetian Optoelectronics Technology Co., Ltd, with the emissivity of 0.98, spectral range of 8-14μm, frame rate of 9 frames/second, pixels/frame of 256×324×14 Bits, thermal resolution of 0.05°C, and spatial resolution of 0.95 mrad. The detector had gone through blackbody correction and temperature calibration before leaving the factory. The ambient temperature was controlled at 22.0°C ± 2.0°C, and the relative humidity was 60% - 70%. There were no other electronic devices, no air convection nor direct illumination of strong light in the cabin. The participants were informed to avoid taking in foods that were too cold or too hot one hour before the conduction of thermography, loosen the clothing, take off hats and glasses, avoid pressing or scratching the body, and rest for 15 minutes before the examination. The participants were unclothed and kept 2 meters away from the detector. Both anterior and posterior views were captured in the anatomical position (the gesture of standing erect with palms facing forward).
The analysis of thermography was carried out by TMI-W Infrared Medical Imaging Workstation V1.0 produced by Beijing Wholelife Medical Science Co., Ltd. Mean temperature of the anterior trunk was generated automatically by the workstation. The other five regions of interest (ROIs) (face, bilateral palms and bilateral dorsum of feet) were manually delimited (Figure 1). Then mean temperature (Tmean ± SD) of each ROI were calculated (represented as Tf for the face, Tt for the anterior trunk, Trp/Tlp for the right/left palm, Trf/Trf for the right/left dorsum of the foot).
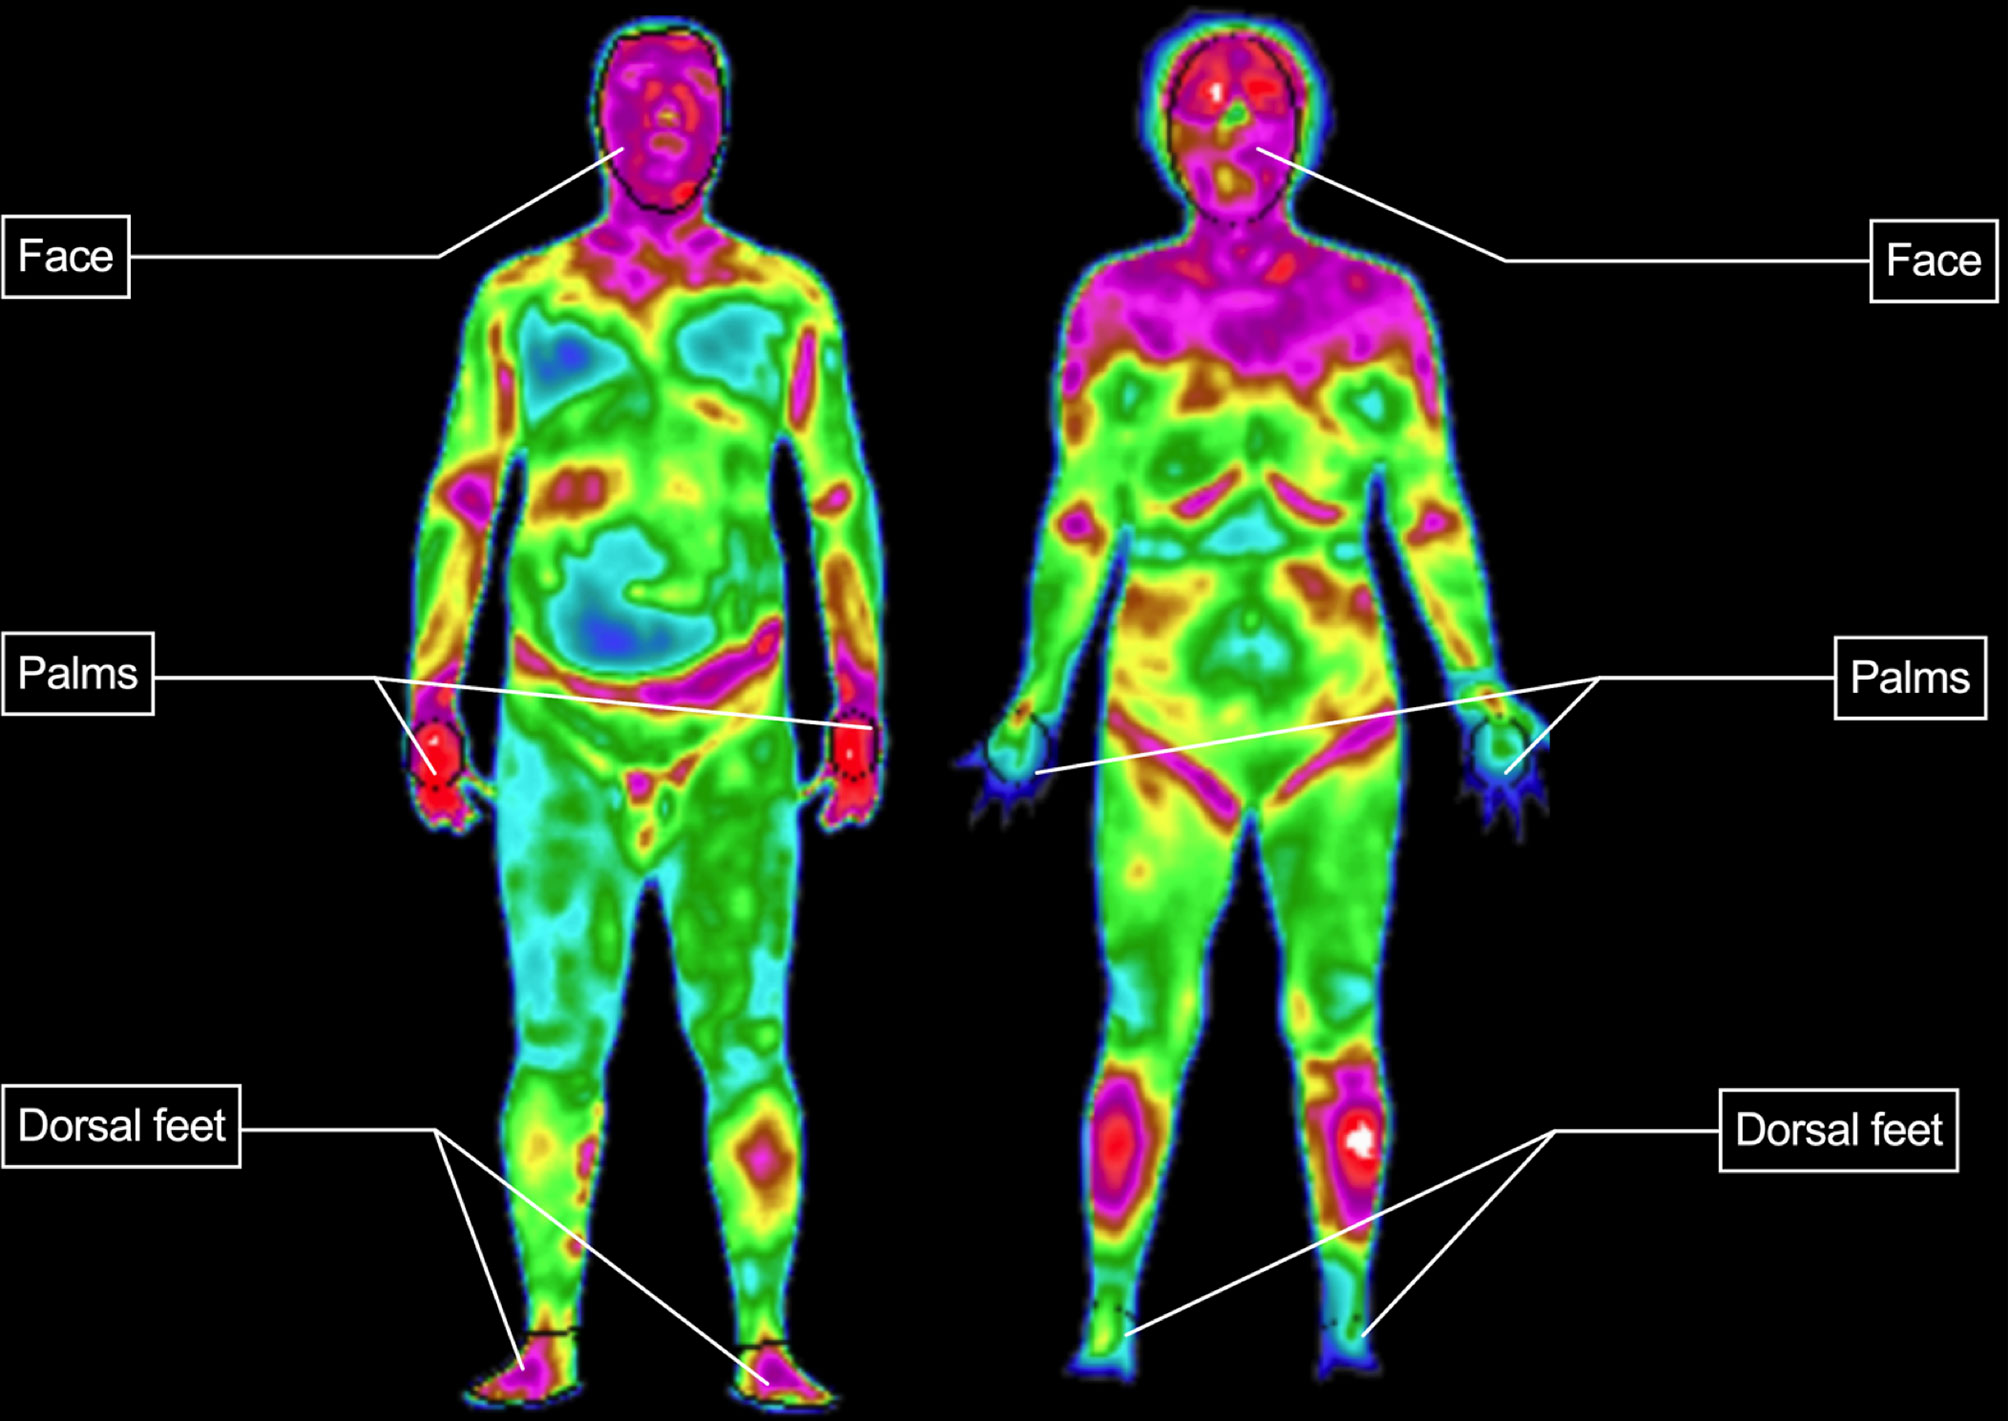
Figure 1 Delimitation of ROI.
2.4 Outcomes
The primary objectives of the analysis were to compare the mean temperature of six ROIs within each group to find out the temperature distribution characteristics of each group that conform to different numbers of indexes in MS diagnostic criteria, and to compare the mean temperature of four groups in each gender to explore the fluctuation trends of temperature along with the progress of metabolic disorders. And the secondary objective of the analysis was to probe into the correlation of the mean temperature of the ROIs with the measurement and laboratory data that relevant to metabolic disorders.
2.5 Statistical Analysis
Statistical analysis was carried out using IBM®SPSS®Statistics (version 24). Data were tested for normality using the Shapiro –Wilk test (α=0.1). Variable transformation was performed for data not conforming to normal distribution. With regard to the quantitative data with normal distribution, differences between two groups were tested using the two-sample t-test for data with homogeneity and t’-test for data with heterogeneity of variance. One-way analysis of variance (ANOVA) followed by Bonferroni’s post-hoc test was used to compare multiple groups. For the data which did not conform to the normal distribution or homogeneity of variance, differences between two groups or multiple groups were tested using Wilcoxon rank-sum test and Kruskal-Wallis test, respectively. The measurement data were expressed as mean ± standard deviation . Correlation analysis was performed using the Pearson correlation test. Then perform unary linear regression or multiple stepwise regression to analyze the correlations between Tmean of ROI and correlated measurement and laboratory data. In regression analysis, Tmean of each ROI was set as the dependent variable, and independent variables were corresponding data. For all statistical analyses, a p-value lower than 0.05 was assumed significant. The complete study process is shown in Figure 2.
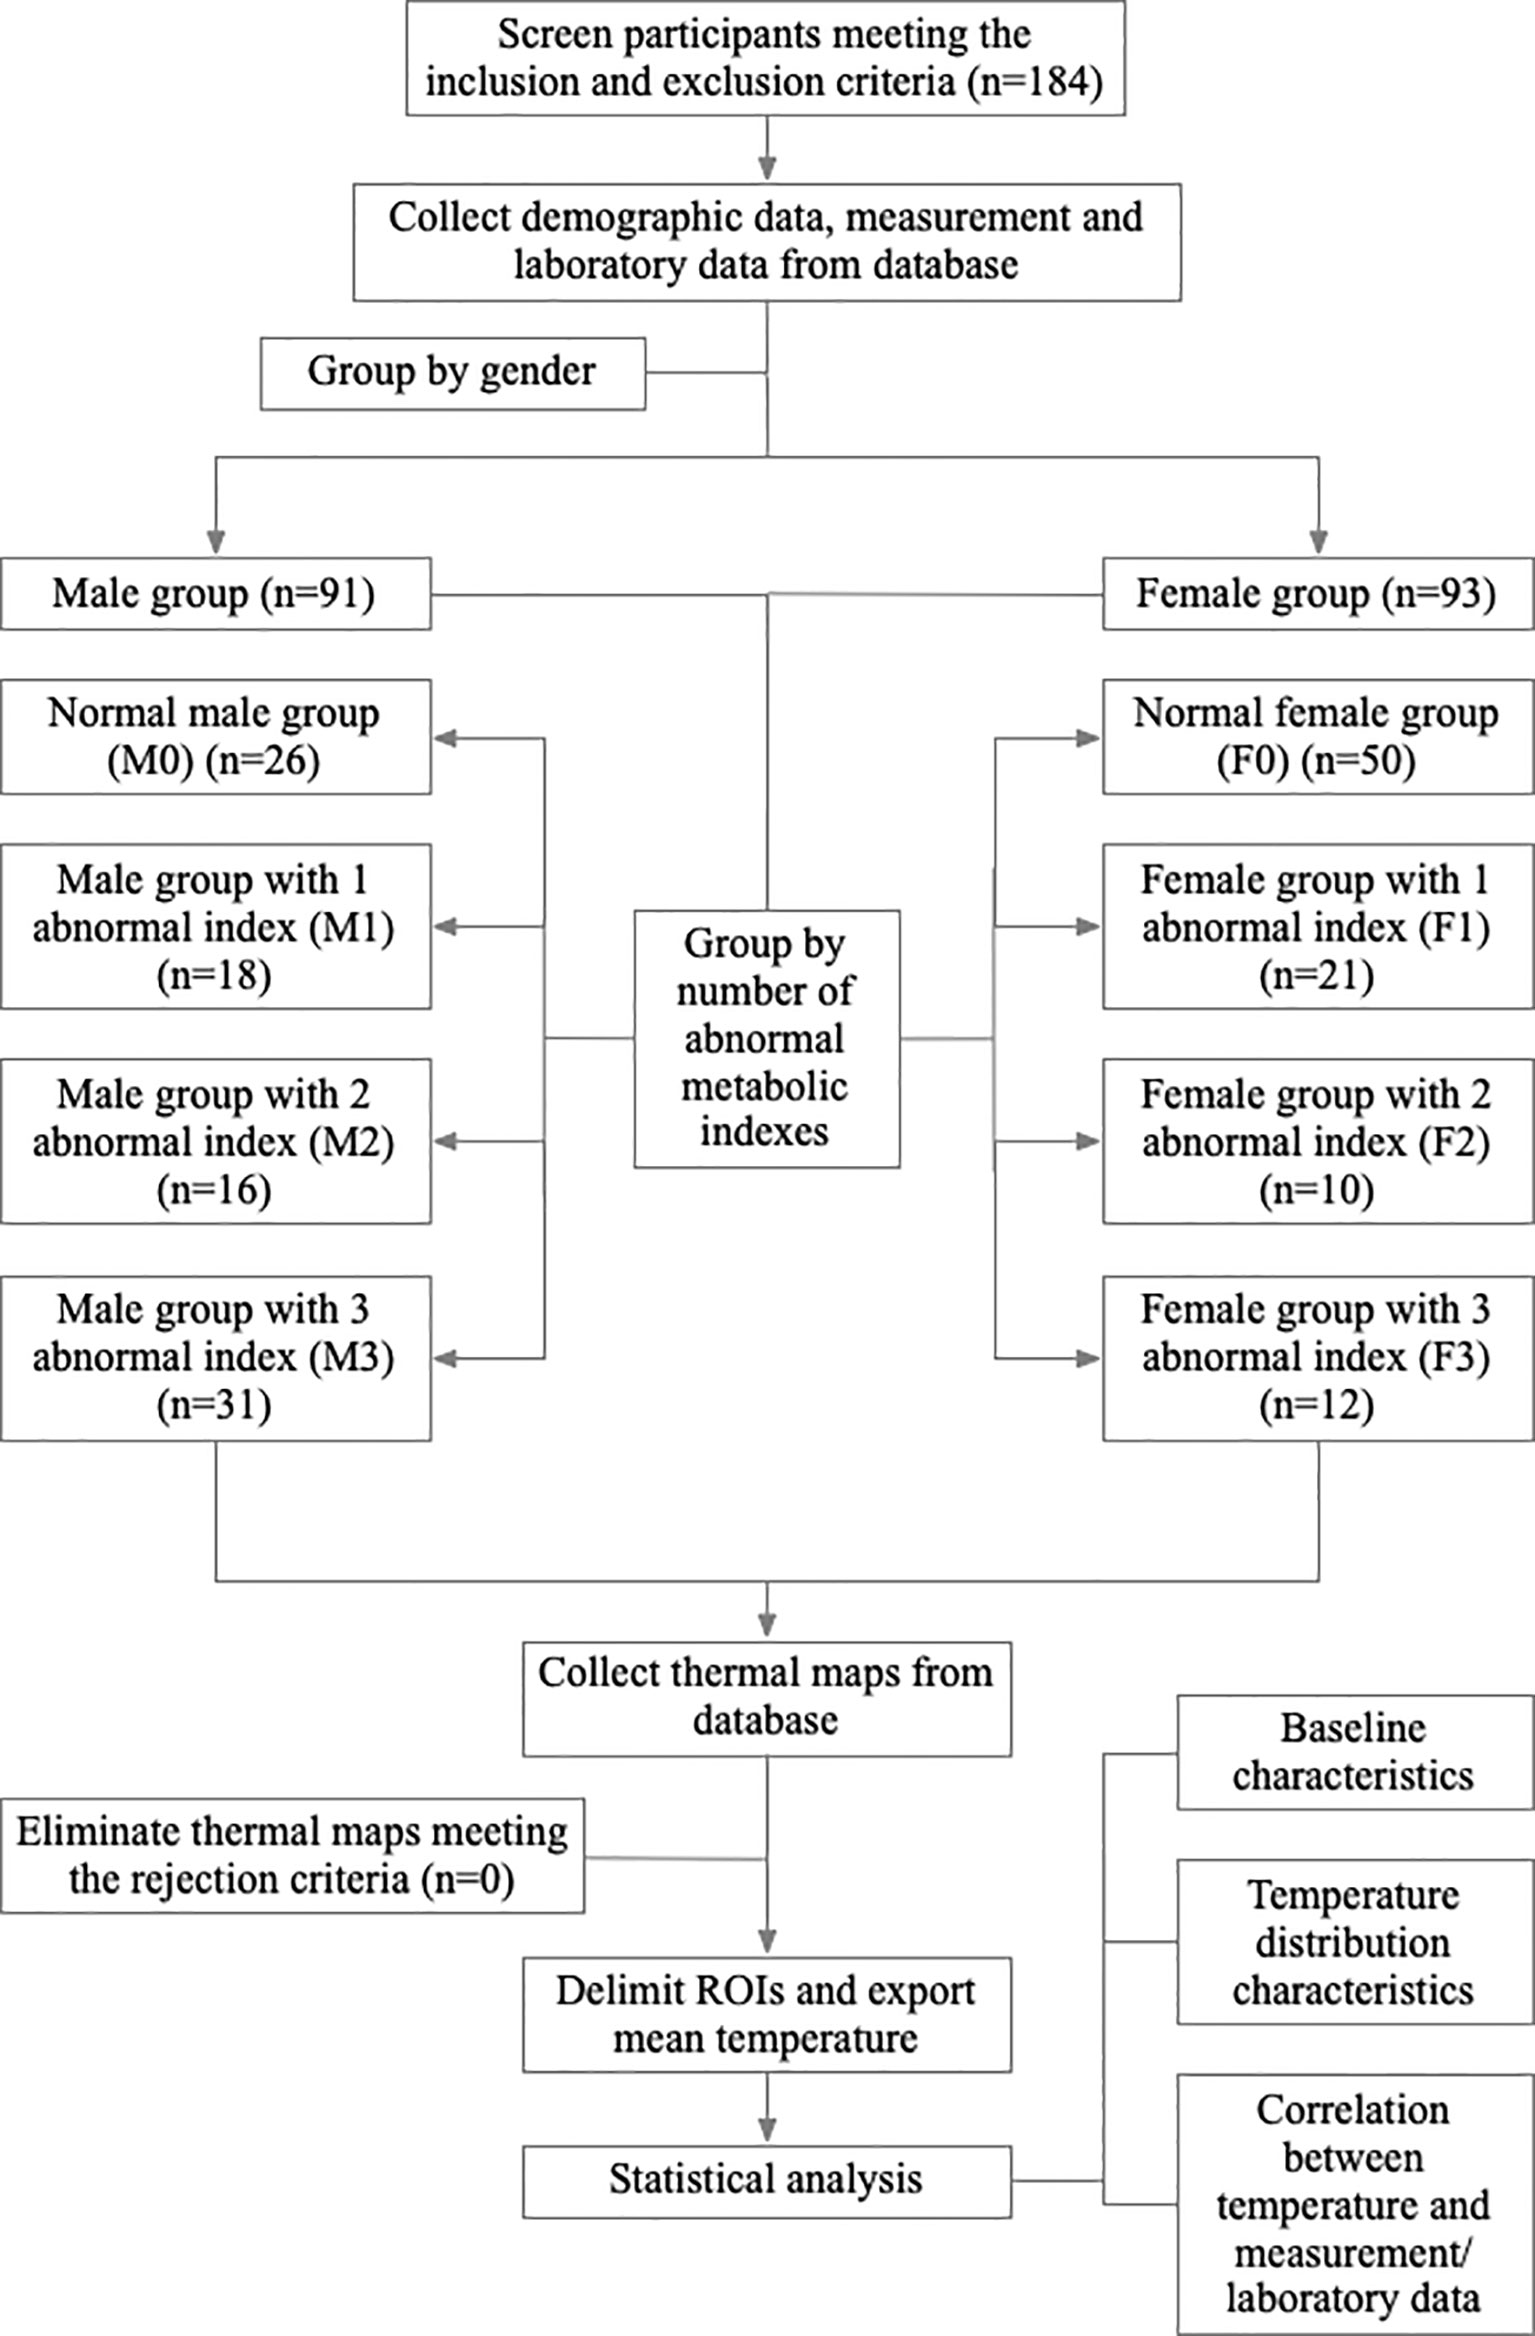
Figure 2 Study flow chart.
3 Results
3.1 Baseline Characteristics
Demographic and clinical data are summarized in Table 1. The age distribution was similar in male groups while having significant differences (P<0.05) in female groups. With the increase of the number of abnormal metabolic indexes, except the age of women increased significantly, some of the body measurement and laboratory data also showed increasing trend among four subgroups in both genders (Table 1).
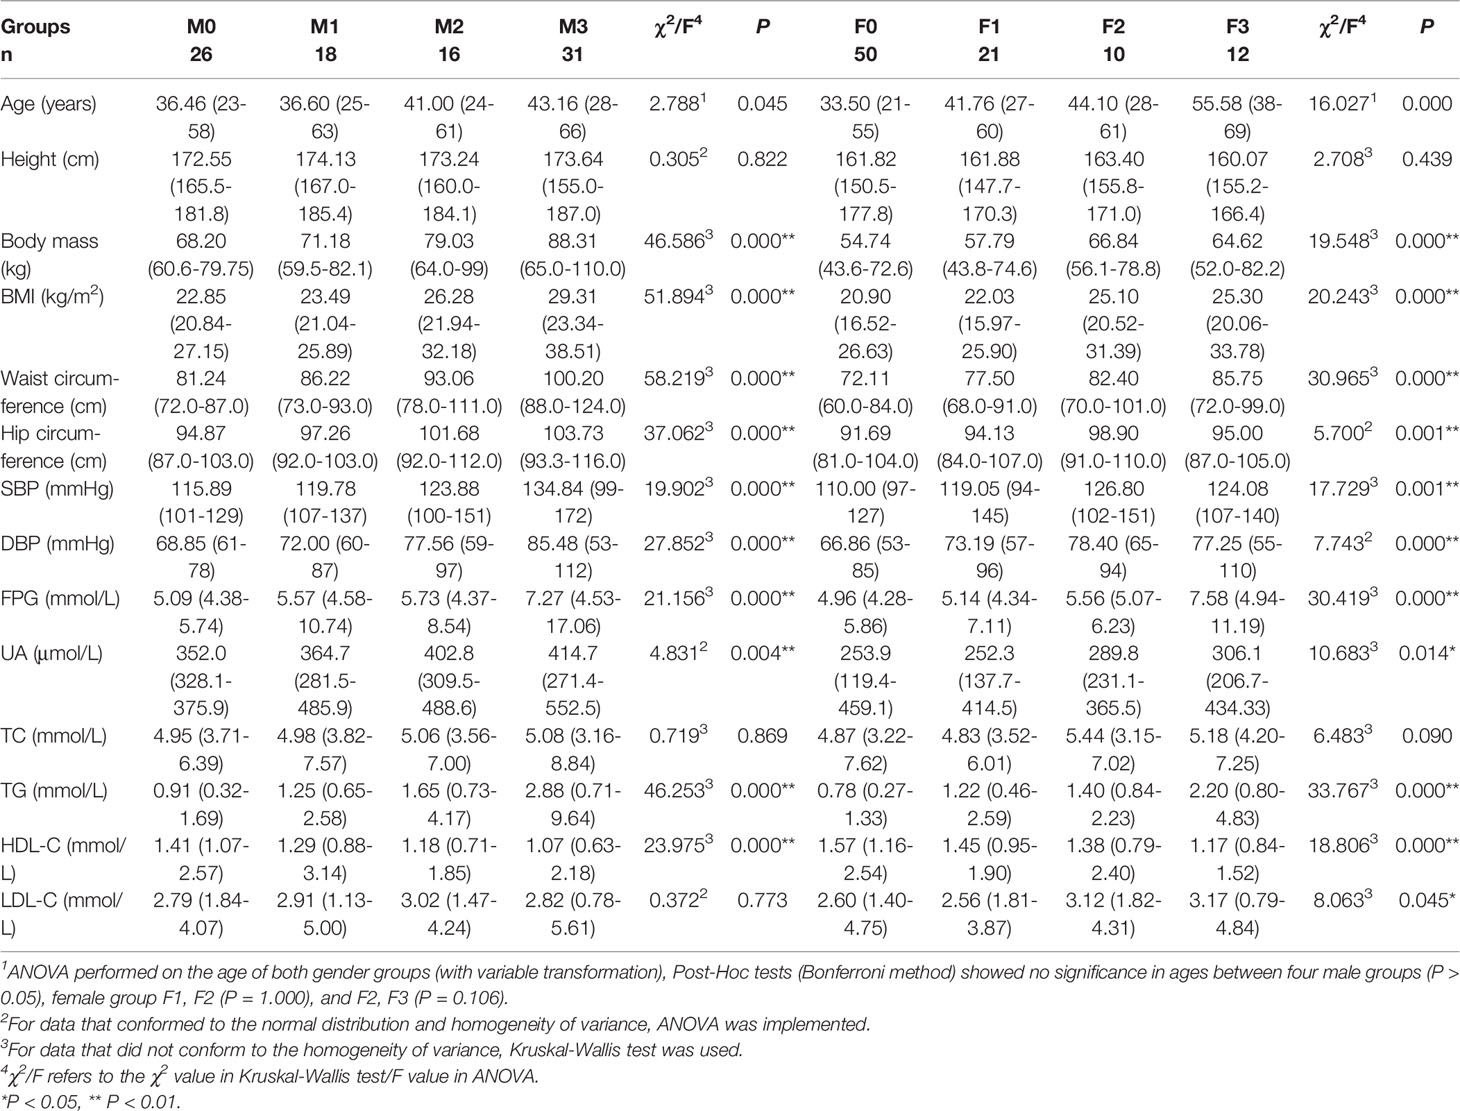
Table 1 Baselines of age, measurement and laboratory data in groups (mean, minimum-maximum).
3.2 Characteristics of Tmean of 6 ROI in Different Gender Groups
Compared with females, males had higher mean temperatures in the areas of face, palms and dorsum of feet, and lower mean temperature in anterior trunk (P<0.05). These diversities indicated that gender difference significantly influences Tmean of each ROI. Therefore, it is necessary to discuss characteristics of each ROI grouping by gender (Figure 3 and Supplementary Table 1).
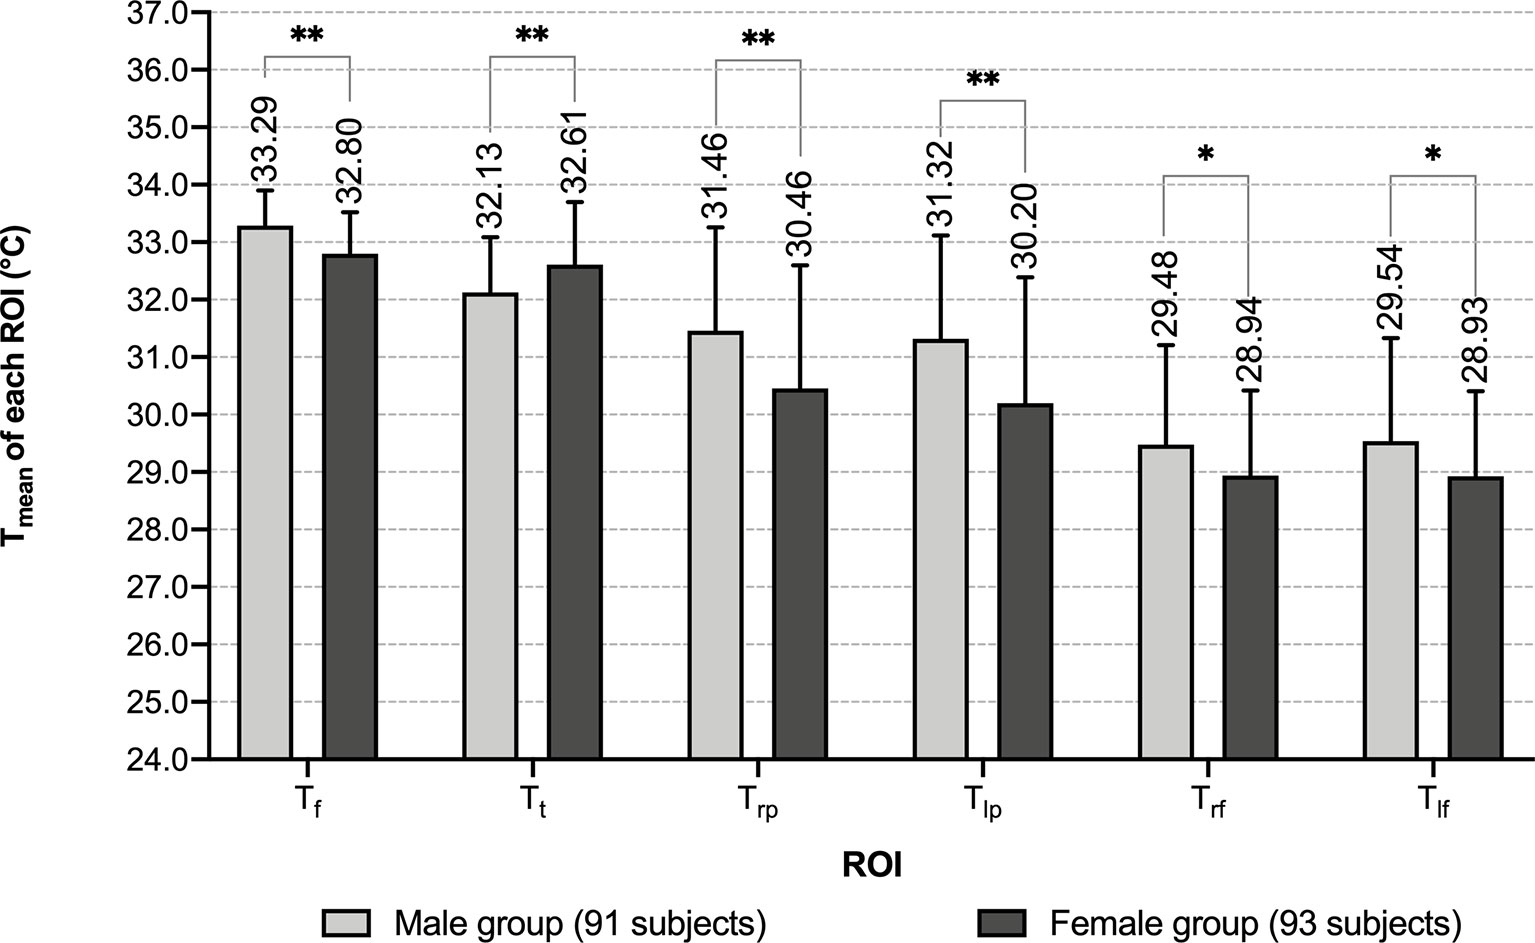
Figure 3 Comparison of Tmean of each ROI between different genders. *: P < 0.05 **: P < 0.01.
3.2.1 Characteristics of Tmean of ROI in Male Groups
Within each male group, mean temperature exhibited a decreasing trend in the order of the face, anterior trunk, bilateral palms, bilateral dorsum of feet, and the differences among these temperature values were significant (P<0.01) (Table 2 and Figure 4). With the increase of the number of abnormal metabolic indexes, Tt decreased successively from group M0 to M3. In Tmean of other ROIs, slightly increasing trends with no significant difference in the order of M0, M1 & M2, M3 can be recognized (Table 2 and Figure 5). When focusing on the differences between group M0 and M3, MS males had higher mean temperature in their left palms and lower mean temperature in their anterior trunks (P<0.05) (Supplementary Table 2).
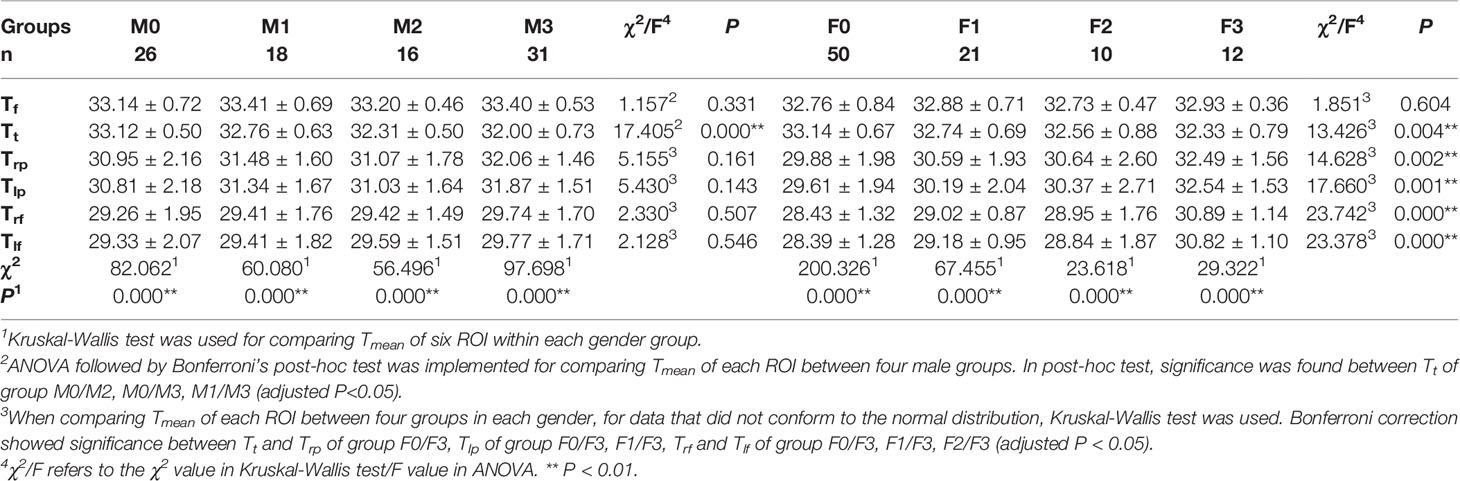
Table 2 Comparison of Tmean of each ROI among four groups in each gender .
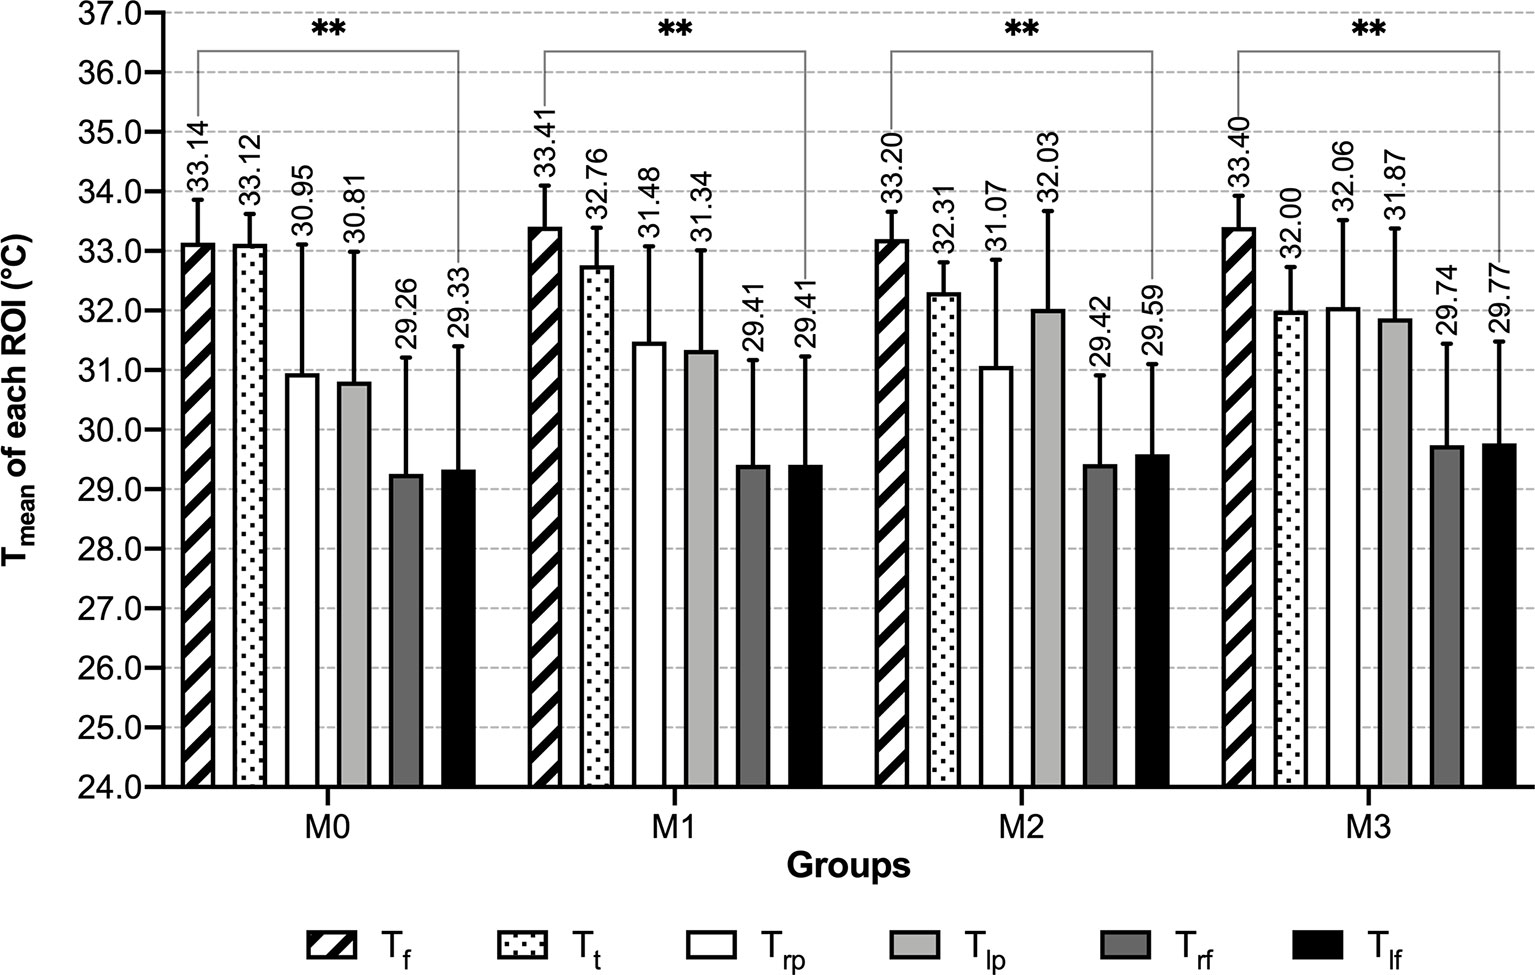
Figure 4 Tmean of each ROI of male groups - grouped by number of abnormal indexes. **: P < 0.01.
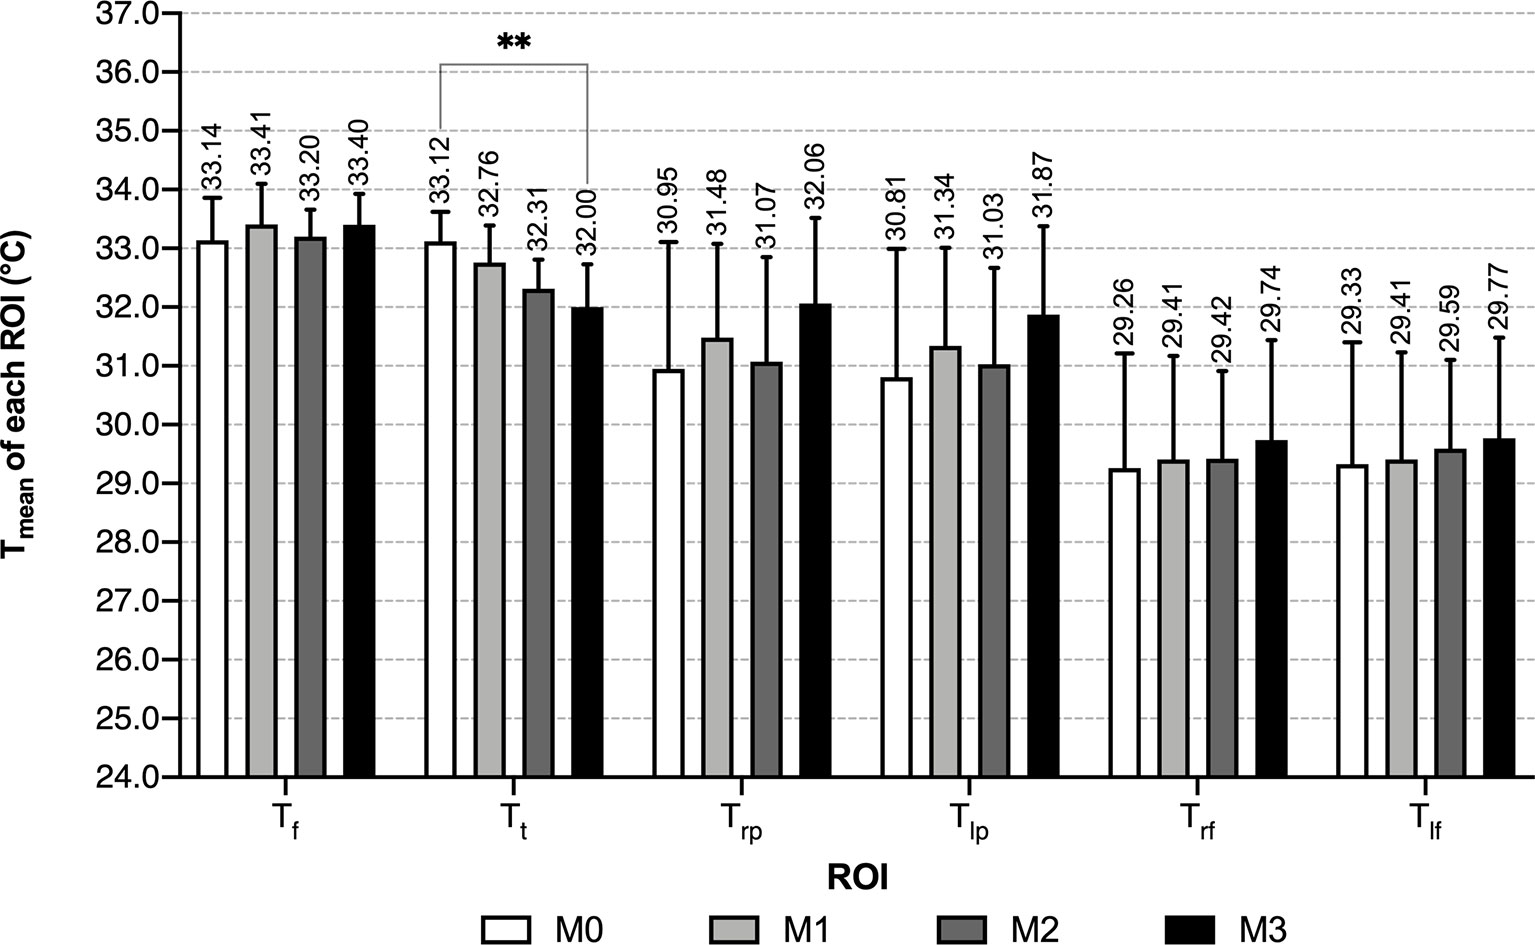
Figure 5 Tmean of each ROI of male groups - grouped by ROI. **: P < 0.01.
3.2.2 Characteristics of Tmean of 6 ROI in Female Groups
In female groups, characteristics of the temperature distribution of each ROI differ between groups with the different numbers of abnormal indexes. Along with the increase of abnormal metabolic indexes, the Tmean of bilateral palms and dorsum of feet increased, while the Tmean of anterior trunk decreased. In the normal group, the anterior trunk had the highest mean temperature, followed by the face, then palms and feet; in groups with 1 or 2 abnormal indexes, Tt became lower than Tf; in the MS group, Tt continuously decreased, and Tmean of the palms increased to a level slightly higher than Tt (Table 2 and Figure 6). Tf was the only ROI that showed no significant differences among the four female groups (Table 2 and Figure 7). Compared with the normal female group, female MS patients had higher mean temperature in their bilateral palms and dorsum of feet, lower mean temperature in their anterior trunks (P<0.01) (Supplementary Table 2).
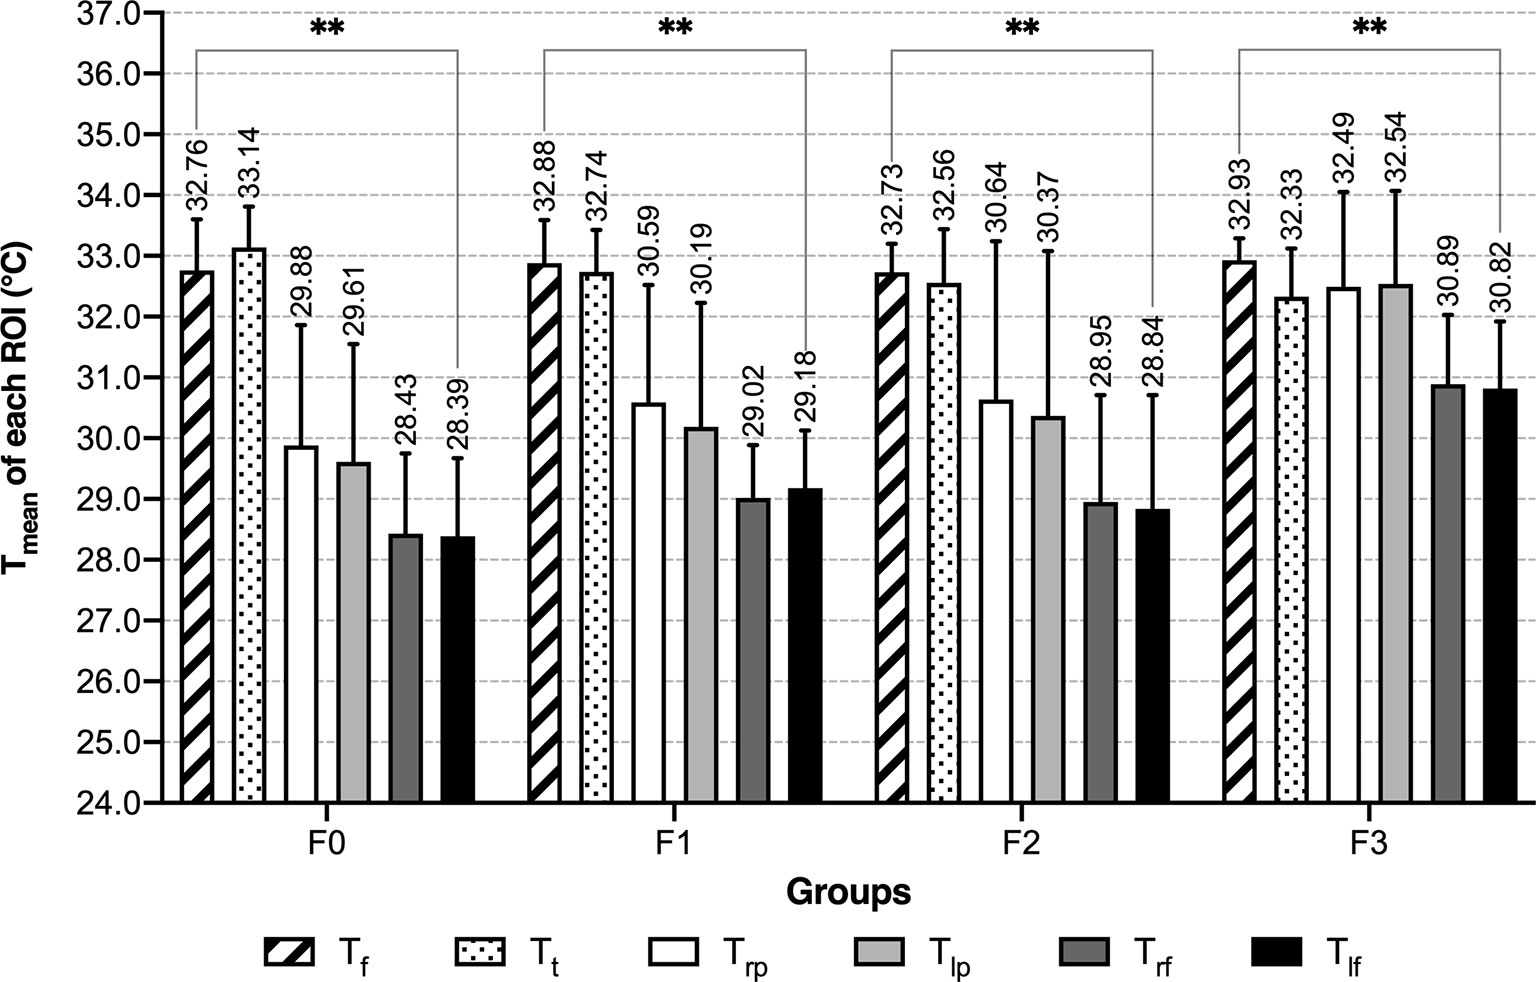
Figure 6 Tmean of each ROI of female groups - grouped by number of abnormal indexes. **: P < 0.01.
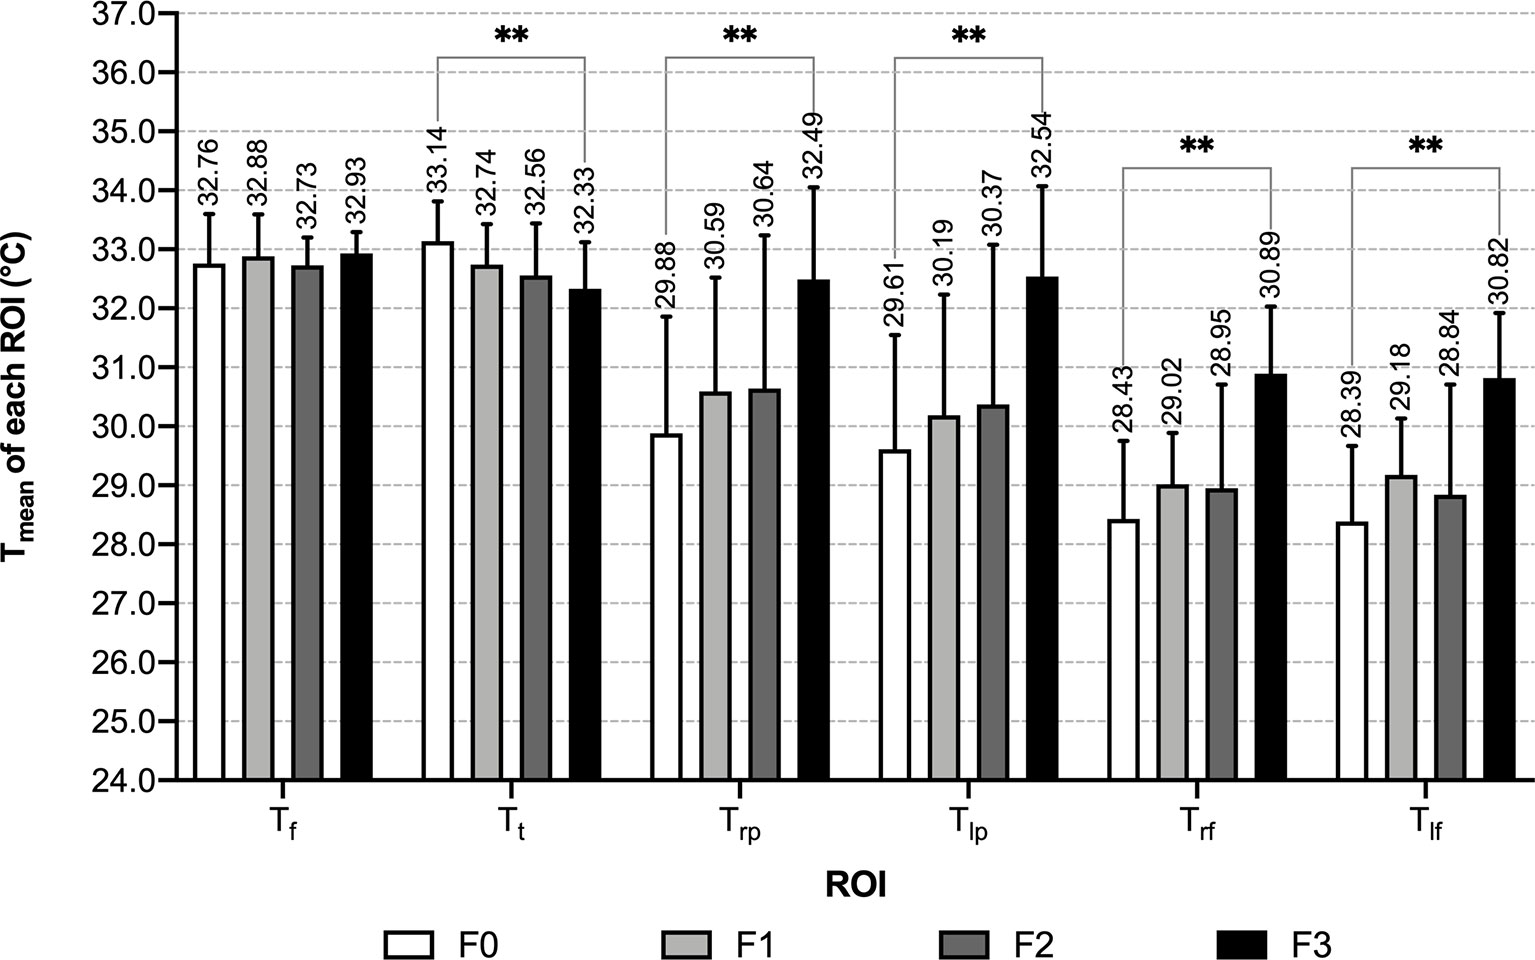
Figure 7 Tmean of each ROI of female groups - grouped by ROI. **: P < 0.01.
3.3 Correlation Analysis and Linear Regression Between Mean Temperature of ROI and Measurement Data & Laboratory Data
3.3.1 Male Participants
For male participants, the results of correlation analysis showed positive correlations between Tf and DBP (r=0.256, P=0.014), Trp & Tlp and BMI (with r-values of 0.239 and 0.234, respectively, P<0.05) and negative correlations between Tt and SBP, DBP, UA, TG, hip circumference, body mass, BMI and waist circumference (Supplementary Table 3). Unary linear regression was done between Tf & DBP, Trp & BMI and Tlp & BMI (Supplementary Table 4 and Supplementary Figure 1), details on the regression equations were listed in Supplementary Data.
3.3.2 Female Participants
Correlation analysis on Tmean of each ROI and measurement & laboratory data of female participants are shown in Table 3. Multiple stepwise regression was carried out between Tmean and correlated indexes, details on the regression equations were listed in Supplementary Data.
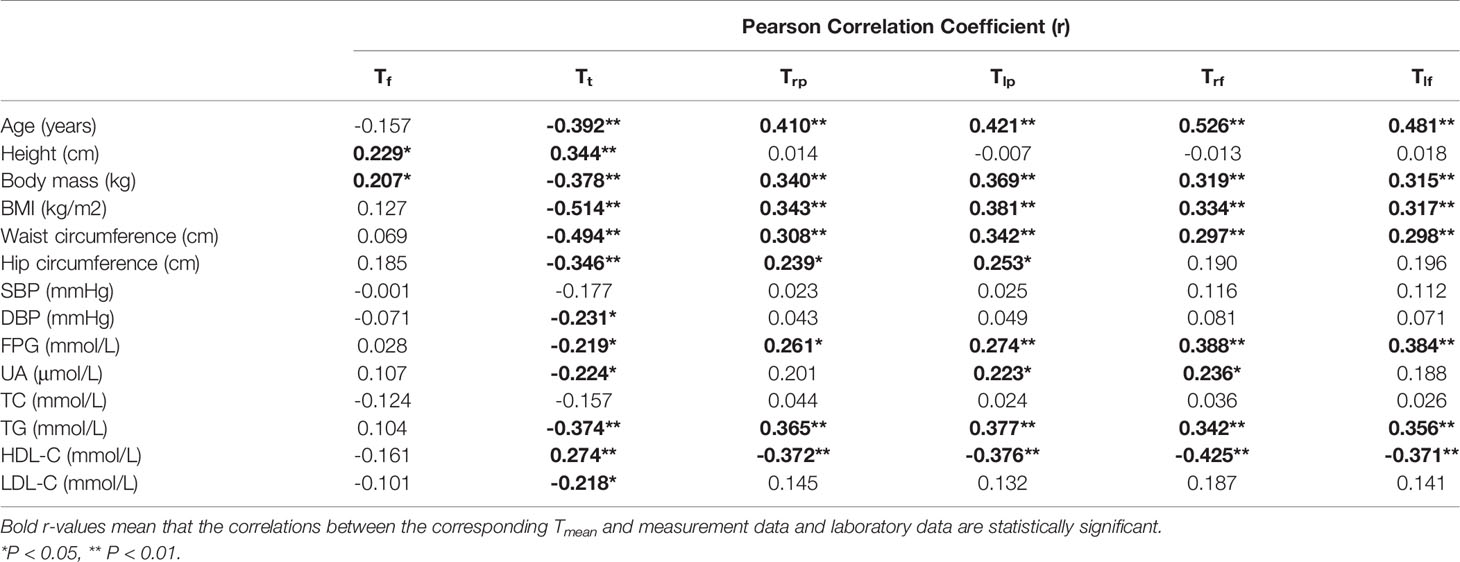
Table 3 Pearson correlation analysis between Tmean of each ROI and measurement data & laboratory data in female groups.
4 Discussion
Our study demonstrated that: With the increasing number of abnormal metabolic indexes, the mean temperature gradually increased in the face, bilateral palms and dorsum of feet, and decreased in the anterior trunk. And for the MS patients, the temperature of the anterior trunk and bilateral palms became approximated. This specific tendency may indicate the severity of metabolic disorders.
The gender difference in temperature distribution was the basis of our subsequent analysis. In this study, there were obvious gender differences that the mean temperatures of face, palms and dorsum of feet were significantly higher in males than in females, while the mean temperature of anterior trunk showed the contrary characteristic. Several studies have also reported gender differences in temperature distribution. A study on healthy participants showed that the mean temperature of the chest was significantly higher in women than in men, while in the other analyzed body surface areas, including back, abdomen, and four limbs (anterior and posterior), the mean temperatures were significantly lower in women, which may be related to less skeletal muscle and thicker subcutaneous fat in females (20). Since we did not separate the anterior trunk region into chest and abdomen, the temperature characteristics of the anterior trunk of these two studies are not comparable, while the results that males have higher temperature in palms and dorsum of feet are consistent with this study. Another study found lower mean temperatures in the trunk and four limbs in the female group, which may have a bearing on higher body fat rates in females (21). The result of the lower mean temperature of the anterior trunk in females did not conform to our study. Consequently, further researches refer to the gender difference in body surface temperature distribution with a more detailed delimitation of ROI remain to be done.
The features of the thermal maps of the MS population were the key points of our study. And we did observe specific characteristic changes in the thermal maps of the MS population. There were few articles in allusion to the characteristic of infrared thermography of the MS population. Still, several studies on thermal characteristics of obesity, hyperlipidemia, hyperglycemia and hypertension have been done. Eduardo Borba Neves et al. (21) have discovered that, in males, the temperature in hands (anterior and posterior) had a tendency of increasing along with the body fat rate (BF%). Besides, BF% had a negative correlation with temperature in the anterior trunk, which was basically consistent with the results of our study. Eun-Mo Song et al. (22) found that the visceral fat area (VFA) was negatively correlated with the temperature of the acupoint CV4, which is located in the lower abdomen. This also corroborated the correlation between obesity and the decrease of temperature in the abdomen. Thiruvengadam J et al. (12) demonstrated that HDL was negatively correlated with the surface temperature of the left hand and anterior feet, which coincide with the conclusion of this study that severer metabolic disorder leads to higher mean temperature in palms and dorsum of feet. Aleck Ovechkin et al. (23) found the body surface temperature of the “Yin-Tang” acupuncture point which is located in the forehead negatively correlates with the severity of intracranial hypertension syndrome. This observation suggests varied temperature distribution characteristics of the face in hypertension patients compared with normal ones. While in this study, no change in the mean temperature of the face was found in MS participants, suggesting changes in body surface temperature of certain diseases might take place in some particular small areas, which could be covered when chosen ROIs are quite bigger. In summary, the characteristics of higher mean temperatures in palms and dorsum of feet, and lower mean temperature in the anterior trunk might be results of multiple pathological mechanisms as above. Studies on one particular metabolic disorder like hyperlipidemia, hypertension, and hyperglycemia may help in understanding the underlying mechanism of characteristic changes. However, clinical trials on large scales are still in lack, which conduces to a more accurate interpretation of the thermography characteristic of MS.
Through correlation analysis and linear regression, in both male and female groups, we found a positive correlation between the mean temperature of the palms and BMI, and negative correlations between mean temperature of the trunk and DBP, UA, TG, waist circumference, hip circumference, weight and BMI. These patterns can be consistent with the above-mentioned law of increasing palm temperature and decreasing trunk temperature with the aggravation of metabolic abnormalities. The unique results in male groups are: a positive correlation between Tf and DBP, and a negative correlation between Tt and SBP. In females, the unique results are: Tf was positively correlated with height and weight, the mean temperature of palms and dorsum of feet was positively correlated with hip circumference, UA, weight, BMI, waist circumference, FPG, TG and age, negatively correlated with HDL-C, and the average temperature of the trunk was negatively correlated with FPG, LDL-C, age and height. In general, the correlation between Tt and multiple metabolic indexes is obvious regardless of gender. While the mean temperature of palms and dorsum of feet showed correlations with a sizable amount of indexes only in the female group, and correlated with age at the same time. Given the uneven age baseline of female subjects, the relationship between palms and feet temperature and metabolic abnormalities still needs to be verified based on more homogeneous sample studies.
5 Limitations
It is also of note that heterogeneity was found among the age of four female groups. The average age of the female MS group was 55.58 ± 10.431 years old, mostly in perimenopausal and postmenopausal stages (start at 47.5 years old on average (24)). The particular age of this group may be due to the prevalence increase of MS in perimenopausal and postmenopausal women. A meta-analysis carried out by Hallajzadeh et al. (25) found the prevalence of MS among postmenopausal women was 37.17% and the pooled OR for MS in postmenopausal women in comparison with the premenopausal was 3.54. In perimenopausal and postmenopausal women, decreased estradiol level attenuates the protective effect of estradiol, which may account for the inclination of carbohydrate and lipid metabolism disorder and contribute to the development of MS (26, 27). However, due to the small sample size of this group, there remains the possibility that the sampling error led to the elder age of women in this group. Accordingly, further study with an enlarged sample size is necessary.
Owing to the retrospective nature of this study, the results could be influenced by time, temperature, humidity and state of equipment, etc. Due to the lack of research on MS using IRT, the sample size was not calculated in advance. While we calculated the sample size afterward based on the results of this study. Except for the comparison of Tlp between M0 and M3, Tt between F0 and F3, Trf and Tlf between F2 and F3, the statistical powers of the other comparisons were higher than 0.80. Moreover, the sample size and age of each group were not evenly distributed, which may also have some bearing on the outcome. A methodological problem is that we did not capture the thermograph of the dorsum of feet in a vertical angle, for the retrospective nature, also. This could affect the output temperatures with camera (28), while since all of the thermographs were captured in approximate angles, the tendency of temperature changes we observed is still advisable.
6 Conclusion
This work was a pilot study of temperature characteristics in the MS population, and it proved the feasibility of screening and evaluating metabolic disorders through IRT. The key findings of this work were the gender difference in temperature distribution, the sequences of the mean temperature of the face, anterior trunk, palms and dorsum of feet in subjects of different metabolic conditions, the trends of the temperature changes in the above body parts with increasing number of abnormal metabolic indexes, and the certain differences in mean temperature of these body parts between the normal group and MS group. And the secondary findings are the correlations between measurement or laboratory data related to metabolic disorders and the mean temperature of different body parts. With the popularization of IRT and the deepening of the research, this correlation may help screen patients with metabolic disorders, further postponing the development of diseases.
Data Availability Statement
The raw data supporting the conclusions of this article will be made available by the authors, without undue reservation.
Ethics Statement
The studies involving human participants were reviewed and approved by Ethics Committee of Dongzhimen Hospital. The patients/participants provided their written informed consent to participate in this study.
Author Contributions
All authors developed the concept for the study. Y-hX and W-zZ offered the design of this manuscript. RC provided suggestions. M-jG and Z-jC conducted the experiment. H-zX drafted the manuscript. B-yJ did literature search. B-hM provided technical support on the software in this study and guided the revision process of this manuscript. Y-cS reviewed the manuscript and made corrections. All authors contributed to the article and approved the submitted version.
Funding
This work was supported by State Administration of Traditional Chinese Medicine JB063 programme and the Fundamental Research Funds for the Central Universities 2020-JYB-ZDGG-117 programme.
Conflict of Interest
Author RC is employed by Beijing Wholelife Medical Science Co., Ltd.
The remaining authors declare that the research was conducted in the absence of any commercial or financial relationships that could be construed as a potential conflict of interest.
Publisher’s Note
All claims expressed in this article are solely those of the authors and do not necessarily represent those of their affiliated organizations, or those of the publisher, the editors and the reviewers. Any product that may be evaluated in this article, or claim that may be made by its manufacturer, is not guaranteed or endorsed by the publisher.
Acknowledgments
We would like to thank Prof. Wen-xue Hong from College of Electrical Engineering, Yanshan University, for his support in medical infrared imaging technology during this study.
Supplementary Material
The Supplementary Material for this article can be found online at: https://www.frontiersin.org/articles/10.3389/fendo.2022.851369/full#supplementary-material
References
1. Kassi E, Pervanidou P, Kaltsas G, Chrousos G. Metabolic Syndrome: Definitions and Controversies. BMC Med (2011) 9:48. doi: 10.1186/1741-7015-9-48
2. Mottillo S, Filion KB, Genest J, Joseph L, Pilote L, Poirier P, et al. The Metabolic Syndrome and Cardiovascular Risk a Systematic Review and Meta-Analysis. J Am Coll Cardiol (2010) 56(14):1113–32. doi: 10.1016/j.jacc.2010.05.034
3. Marcotte-Chénard A, Deshayes TA, Ghachem A, Brochu M. Prevalence of the Metabolic Syndrome Between 1999 and 2014 in the United States Adult Population and the Impact of the 2007-2008 Recession: An NHANES Study. Appl Physiol Nutr Metab = Physiol Appliquee Nutr Metabolisme (2019) 44(8):861–8. doi: 10.1139/apnm-2018-0648
4. Li R, Li W, Lun Z, Zhang H, Sun Z, Kanu JS, et al. Prevalence of Metabolic Syndrome in Mainland China: A Meta-Analysis of Published Studies. BMC Public Health (2016) 16:296. doi: 10.1186/s12889-016-2870-y
5. National Health Commission of the People’s Republic of China. Statistical Yearbook of Health and Family Planning of China 2017 Edition. Beijing: Peking Union Medical College Press (2017).
6. National Health Commission of the People’s Republic of China. Statistical Yearbook of Health and Family Planning of China 2013 Edition. Beijing: Peking Union Medical College Press (2013).
7. 2018 Chinese Guidelines for the Management of Hypertension. Chin J Cardiovasc Med (2019) 2401(1):002. doi: 10.3969/j.issn.1007-5410
8. Chinese Diabetes Society. Guidelines for Prevention and Treatment of Type 2 Diabetes in China (2017 Edition). Chin J Diabetes Mellitus (2018) 10(1):4–67. doi: 10.3760/cma.j.issn.1674-5809.2018.01.002
9. Li JH, Wang LM, Mi SQ, Zhang M, Wang LH, et al. Awareness Rate, Treatment Rate and Control Rate of Dyslipidemia in Chinese Adults, 2010. Chin J Prev Med (2012) 46(8):687–91. doi: 10.3760/cma.j.issn.0253-9624.2012.08.004
10. Tattersall GJ. Infrared Thermography: A Non-Invasive Window Into Thermal Physiology. Comp Biochem Physiol A Mol Integr Physiol (2016) 202:78–98. doi: 10.1016/j.cbpa.2016.02.022
11. Lahiri BB, Bagavathiappan S, Jayakumar T, Philip J. Medical Applications of Infrared Thermography: A Review. Infrared Phys Technol (2012) 55(4):221–35. doi: 10.1016/j.infrared.2012.03.007
12. Thiruvengadam J, Anburajan M, Menaka M, Venkatraman B. Potential of Thermal Imaging as a Tool for Prediction of Cardiovascular Disease. J Med Phys (2014) 39(2):98–105. doi: 10.4103/0971-6203.131283
13. Hinds T, McEwan I, Perkes J, Dawson E, Ball D, George K. Effects of Massage on Limb and Skin Blood Flow After Quadriceps Exercise. Med Sci Sports Exercise (2004) 36(8):1308–13. doi: 10.1249/01.MSS.0000135789.47716.DB
14. Sivanandam S, Anburajan M, Venkatraman B, Menaka M, Sharath D. Medical Thermography: A Diagnostic Approach for Type 2 Diabetes Based on Non-Contact Infrared Thermal Imaging. Endocrine (2012) 42(2):343–51. doi: 10.1007/s12020-012-9645-8
15. Jalil B, Hartwig V, Moroni D, Salvetti O, Benassi A, Jalil Z, et al. A Pilot Study of Infrared Thermography Based Assessment of Local Skin Temperature Response in Overweight and Lean Women During Oral Glucose Tolerance Test. J Clin Med (2019) 8(2):260. doi: 10.3390/jcm8020260
16. Thiruvengadam J, Mariamichael A. A Preliminary Study for the Assessment of Hypertension Using Static and Dynamic IR Thermograms. Biomed Technik Biomed Eng (2018) 63(2):197–206. doi: 10.1515/bmt-2016-0237
17. Law J, Morris DE, Izzi-Engbeaya C, Salem V, Coello C, Robinson L, et al. Thermal Imaging Is a Noninvasive Alternative to PET/CT for Measurement of Brown Adipose Tissue Activity in Humans. J Nucl Med (2018) 59(3):516–22. doi: 10.2967/jnumed.117.190546
18. Brasil S, Renck AC, de Meneck F, Brioschi ML, Costa EF, Teixeira MJ. A Systematic Review on the Role of Infrared Thermography in the Brown Adipose Tissue Assessment. Rev Endocr Metab Disord (2020) 21(1):37–44. doi: 10.1007/s11154-020-09539-8
19. Chinese Diabetes Society. Chinese Guideline for the Prevention and Treatment of Type 2 Diabetes Mellitus (2017 Edition). Chin J Diabetes Mellitus (2018) 10(1):4–67. doi: 10.3760/cma.j.issn.1674-5809.2018.01.003
20. Chudecka M, Lubkowska A. Thermal Maps of Young Women and Men. Infrared Phys Technol (2015) 69:81–7. doi: 10.1016/j.infrared.2015.01.012
21. Neves EB, Salamunes ACC, de Oliveira RM, Stadnik AMW. Effect of Body Fat and Gender on Body Temperature Distribution. J Therm Biol (2017) 70(Pt B):1–8. doi: 10.1016/j.jtherbio.2017.10.017
22. Song EM, Kim EJ, Kim KW, Cho JH, Song MY. Correlation Between Abdominal Fat Distribution and Abdominal Temperature in Korean Premenopausal Obese Women. J Korean Med (2013) 34(2):1–9. doi: 10.13048/jkm.13001
23. Ovechkin A, Kim KS, Lee JW, Lee SM. Thermo-Visual Evaluation of the Yin-Tang Acupuncture Point for Intracranial Hypertension Syndrome. Am J Chin Med (2003) 31(3):455–66. doi: 10.1142/S0192415X03001041
24. McNamara M, Batur P, DeSapri KT. In the Clinic. Perimenopause. Ann Internal Med (2015) 162(3):ITC1–15. doi: 10.7326/AITC201502030
25. Hallajzadeh J, Khoramdad M, Izadi N, Karamzad N, Almasi-Hashiani A, Ayubi E, et al. Metabolic Syndrome and its Components in Premenopausal and Postmenopausal Women: A Comprehensive Systematic Review and Meta-Analysis on Observational Studies. Menopause (2018) 25(10):1155–64. doi: 10.1097/GME.0000000000001136
26. Iorga A, Cunningham CM, Moazeni S, Ruffenach G, Umar S, Eghbali M. The Protective Role of Estrogen and Estrogen Receptors in Cardiovascular Disease and the Controversial Use of Estrogen Therapy. Biol Sex Differences (2017) 8(1):33. doi: 10.1186/s13293-017-0152-8
27. Barros RPA, Gustafsson JÅ. Estrogen Receptors and the Metabolic Network. Cell Metab (2011) 14(3):289–99. doi: 10.1016/j.cmet.2011.08.005
Keywords: metabolic syndrome, infrared thermography, temperature, evaluation method, hypertension, hyperglycemia, abdominal obesity
Citation: Gao M-j, Xue H-z, Cai R, Jiang B-y, Mi B-h, Chen Z-j, Shi Y-c, Xiao Y-h and Zhang W-z (2022) A Preliminary Study on Infrared Thermograph of Metabolic Syndrome. Front. Endocrinol. 13:851369. doi: 10.3389/fendo.2022.851369
Received: 09 January 2022; Accepted: 24 February 2022;
Published: 12 April 2022.
Edited by:
Ozra Tabatabaei-Malazy, Tehran University of Medical Sciences, IranReviewed by:
Solaleh Emamgholipour, Tehran University of Medical Sciences, IranNoushin Fahimfar, Tehran University of Medical Sciences, Iran
Seyed Pezhman Madani, Iran University of Medical Sciences, Iran
Copyright © 2022 Gao, Xue, Cai, Jiang, Mi, Chen, Shi, Xiao and Zhang. This is an open-access article distributed under the terms of the Creative Commons Attribution License (CC BY). The use, distribution or reproduction in other forums is permitted, provided the original author(s) and the copyright owner(s) are credited and that the original publication in this journal is cited, in accordance with accepted academic practice. No use, distribution or reproduction is permitted which does not comply with these terms.
*Correspondence: Yong-hua Xiao, d2F0ZXJfYXF1YUBzaW5hLmNvbQ==; Wen-zheng Zhang, end6Nzg1N0BzaW5hLmNvbQ==
†These authors have contributed equally to this work and share first authorship