- 1Department of Ophthalmology, Shanghai Tongji Hospital of Tongji University, Laboratory of Clinical Visual Science of Tongji Eye Institute, School of Medicine, Tongji University, Shanghai, China
- 2Department of Biochemistry and Molecular Biology, Tongji University School of Medicine, Shanghai, China
- 3Business School and Science School, University of Auckland, Auckland, New Zealand
- 4Department of Human Genetics, Tongji University School of Medicine, Shanghai, China
- 5Department of Pharmacology, Tongji University School of Medicine, Shanghai, China
- 6Department of Endocrinology, Tongji Hospital of Tongji University, Shanghai, China
Diabetic kidney disease (DKD) is a long-term major microvascular complication of uncontrolled hyperglycemia and one of the leading causes of end-stage renal disease (ESDR). The pathogenesis of DKD has not been fully elucidated, and effective therapy to completely halt DKD progression to ESDR is lacking. This study aimed to identify critical molecular signatures and develop novel therapeutic targets for DKD. This study enrolled 10 datasets consisting of 93 renal samples from the National Center of Biotechnology Information (NCBI) Gene Expression Omnibus (GEO). Networkanalyst, Enrichr, STRING, and Cytoscape were used to conduct the differentially expressed genes (DEGs) analysis, pathway enrichment analysis, protein-protein interaction (PPI) network construction, and hub gene screening. The shared DEGs of type 1 diabetic kidney disease (T1DKD) and type 2 diabetic kidney disease (T2DKD) datasets were performed to identify the shared vital pathways and hub genes. Strepotozocin-induced Type 1 diabetes mellitus (T1DM) rat model was prepared, followed by hematoxylin & eosin (HE) staining, and Oil Red O staining to observe the lipid-related morphological changes. The quantitative reverse transcription-polymerase chain reaction (qRT-PCR) was conducted to validate the key DEGs of interest from a meta-analysis in the T1DKD rat. Using meta-analysis, 305 shared DEGs were obtained. Among the top 5 shared DEGs, Tmem43, Mpv17l, and Slco1a1, have not been reported relevant to DKD. Ketone body metabolism ranked in the top 1 in the KEGG enrichment analysis. Coasy, Idi1, Fads2, Acsl3, Oxct1, and Bdh1, as the top 10 down-regulated hub genes, were first identified to be involved in DKD. The qRT-PCR verification results of the novel hub genes were mostly consistent with the meta-analysis. The positive Oil Red O staining showed that the steatosis appeared in tubuloepithelial cells at 6 w after DM onset. Taken together, abnormal ketone body metabolism may be the key factor in the progression of DKD. Targeting metabolic abnormalities of ketone bodies may represent a novel therapeutic strategy for DKD. These identified novel molecular signatures in DKD merit further clinical investigation.
Introduction
The prevalence of diabetes and its related complications are increasing significantly globally. Diabetic kidney disease (DKD), a devastating long-term major microvascular complication of uncontrolled hyperglycemia, affects a large population worldwide. The prevalence of diabetes is projected to reach 578 million cases by 2030 in the world, 30 to 40% of which develop DKD (1). DKD is one of the principal causes of end-stage renal disease (ESDR) worldwide, and the disease progression contributes to irreversible damage to the kidney, impaired quality of life, and premature death (2–4). Although extensive studies focus on the DKD mechanism and oxidative stress, end-products of glycation, autophagy, and apoptosis have been identified to be involved in the pathogenesis of DKD, the exact mechanism of DKD remains to be elucidated (5–8). Currently, the effective therapy to completely halt DKD progression to ESDR is lacking.
Bioinformatics is a new field of biological research aiming to synthesize mathematical, statistical, and computational methods to process biological data. Many public repositories, such as Gene Expression Omnibus (GEO) and ArrayExpress, provide an enormous quantity of data generated by genomic sequencing and microarray chips and comprehensive analyses can be performed by integrating multiple studies to achieve biological understanding. Integrative bioinformatics analysis with larger sample sizes and more minor potential biases is superior to finding new molecular signatures (9). Different bioinformatics analyses for DKD have been reported (10–18). The datasets involved in those studies are either from type 1 diabetic kidney disease (T1DKD) (10–13) or type 2 kidney disease (T2DKD) samples (14–16). Some genes, such as connective tissue growth factor (CTGF) (10), complement 3 (C3) (12), complement 5 (C5) (12), cyclin b2 (Ccnb2) (14), and nuclear receptor subfamily 1 group I member 2 (Nr1i2) (14), have been identified to be molecular signatures and showed great potential as therapeutic targets. In 2020, systematic integrated analysis of genetic and epigenetic variation in DKD patients was reported, and functional annotation suggested the role of inflammation, specifically, apoptotic cell clearance and complement activation in kidney disease development (17). More recently, Gao et al. performed integrative bioinformatics analysis of 3 human datasets associated with early T2DKD (pathologic stages I-III), glomerular DKD, and tubular DKD, respectively, and identified 7 candidate genes (SPARC, POSTN, LUM, KNG1, FN1, VCAN, PTPRO) significantly associated with the progression of DKD (18).
The accelerator hypothesis for diabetes is emerging, which argues that type 1 diabetes mellitus (T1DM) and type 2 diabetes mellitus (T2DM) are the same disorder of insulin resistance set against different genetic backgrounds (19). Based on that, we proposed that there should be key shared pathways and potential targets involved in the pathogenesis of both T1DKD and T2DKD. Unlike previous studies that focused on a single type of DKD, the present study enrolled more datasets of T1DKD and T2DKD, which were integrated with suitable meta-analysis to deeply mine shared molecular mechanism underlying T1DKD and T2DKD. The shared DEGs for T1DKD and T2DKD were used to perform the pathway enrichment analysis and hub gene screening. The study aims to identify novel molecular signatures and therapeutic targets for DKD. Understanding the crucial pathways in DKD could provide a new vision into DKD mechanism study and facilitate the development of novel therapeutic strategies.
Materials and Methods
Data Collection
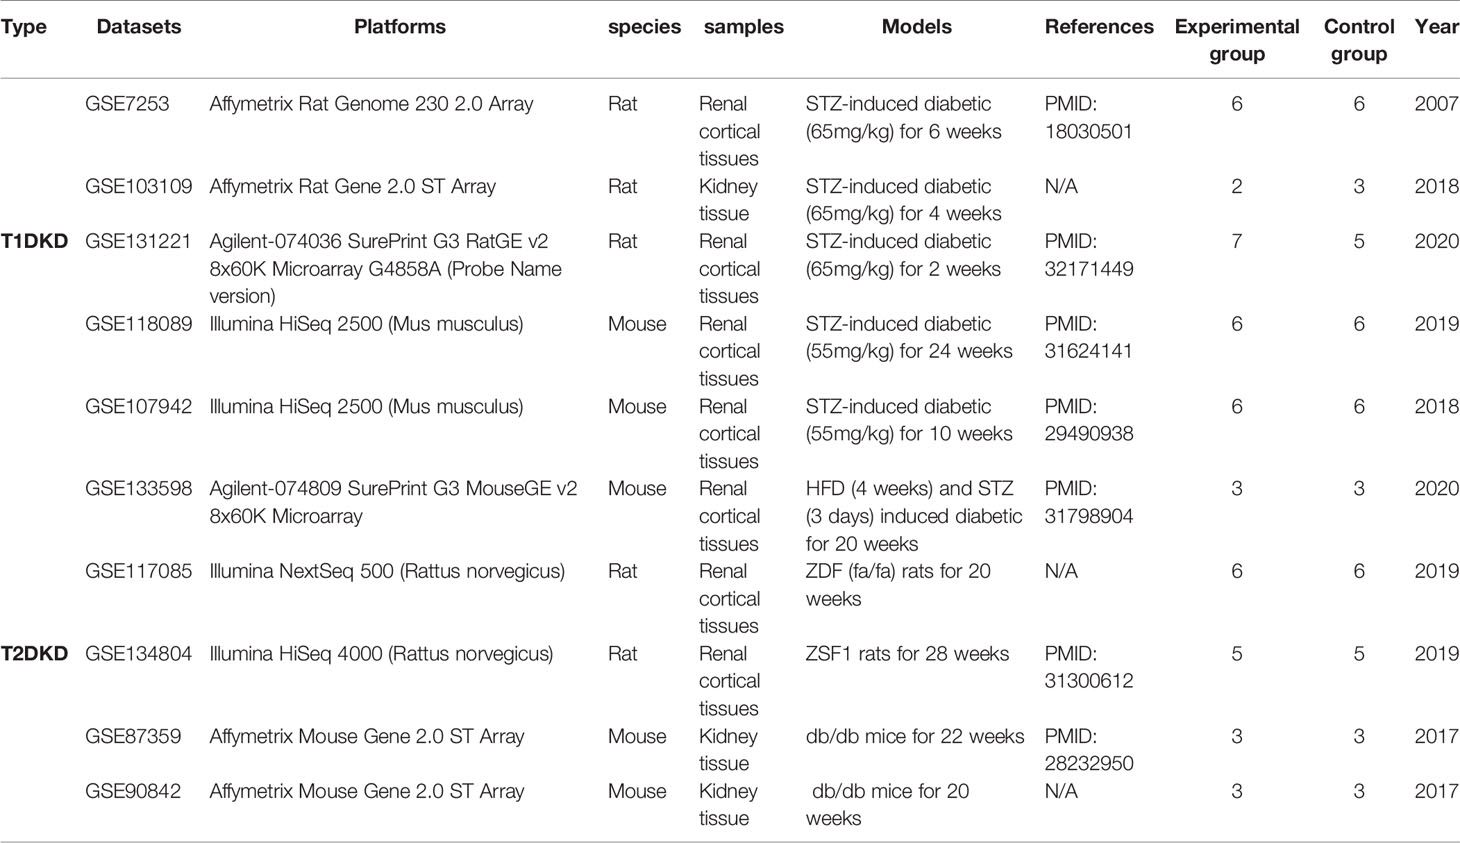
Datasets related to rodent T1DKD and T2DKD were obtained from the National Center of Biotechnology Information (NCBI) GEO. Table 1 showed the detailed information of datasets, and the inclusion-exclusion criteria are described as followed: (i) all samples are kidney tissues, (ii)datasets should include the control groups and experimental groups, and (iii) the datasets should have an appropriate sample size (the sample size of the experimental group is greater than 2, and the sample size of the control group is greater than 2).
Data Preprocessing
Based on the platform annotation information, probe IDs from different microarray and sequencing platforms were converted to Entrez gene IDs. The mean gene expression value was obtained for the probe mapping to the same gene. After log2 transformation and normalization, the datasets were subsequently subjected to the well-established ComBat procedures to reduce potential study-specific batch effects, and invalid samples were deleted (20). The results were visually presented through the principal component analysis (PCA).
Differentially Expressed Genes (DEGs) Analysis
The meta-analysis was performed with Networkanalyst using Fisher’s combined probability test (Fisher’s method) (21). Fisher’s method can combine extreme value probabilities (p-values) from several independent tests bearing upon the same overall hypothesis and evaluate the significance using chi-squared tests. An adjusted p-value less than 0.05 was considered statistically significant to select DEGs.
Functional Annotation and Enrichment Analysis
The Enrichr database (http://amp.pharm.mssm.edu/Enrichr/) was used to analyze and visualize Gene Ontology (GO) terms and the Kyoto Encyclopedia of Genes and Genomes (KEGG) pathways for functional annotation and pathway enrichment analysis of the DEGs (22). To determine the role of the DEGs in human disease, Enrichr was also used to visualize the clinic databases, including ClinVar and GWAS.
Protein-Protein Interaction (PPI) Network Construction and Hub Gene Screening
The Search Tool for the Retrieval of Interacting Genes (STRING; http://string-db.org/) database was used to establish the PPI networks (23). The hub genes were identified using the CytoHuba plugin in Cytoscape software (version 3.6.1) and Maximal Clique Centrality (MCC) algorithm was selected to identify hub genes in this study (24, 25).
T1DM Rat Model Preparation
Male Sprague‐Dawley rats weighing 180 to 200g were purchased from Slaccas (Shanghai, China), which were used to prepare a diabetic rat model by a single intraperitoneal injection of streptozotocin (STZ, 65 mg/kg body wt) in 0.1 mol/l citrate buffer (pH 4.5). Only males were used because female rats were less sensitive to STZ (26). Totally, 42 rats were used in this experiment. All rats were weighed and randomly divided into 5 groups for specific time points, including after DM onset 3d (6 rats), 1w (12 rats), 2w (12 rats), 4w (6 rats), and 6w (6 rats), half as control and half as experimental group. Rats were sacrificed at specified time points above, respectively. Rats receiving an injection of an equal volume of 0.1 mol/l citrate buffer were used as normal controls. According to our previous work (27), the model was successfully established when the blood glucose level was higher than 16.7mmol/L for three consecutive days. Some kidneys of rats were stored in 4% paraformaldehyde (PFA) in phosphate buffer solution (PBS), and the others were stored at -80°C for subsequent experiments.
HE Staining
Kidney tissues fixed in 4% PFA were dehydrated, embedded in paraffin, and cut into 4 μm thick sections. Sections treated with hematoxylin & eosin (HE) staining kit (Sangon Biotech Co., Ltd.NO. E607318) were observed under a light microscope (Olympus, BX53M) at high magnification.
Oil Red O Staining of Neutral Fat
The 0.5% (w/w) stock solution of Oil Red O (ORO, Sangon Biotech Co., Ltd. NO. E607319) was prepared by adding ORO to a 98%(v/v) isopropyl solution (Sangon Biotech Co., Ltd NO. A507048), which was then filtered through filter paper. Then the filtrate was added to double distilled water to prepare a 60%(v/v) ORO-isopropyl solution (working solution), and the working solution was filtered for the second time by using a 45μm filter. The sections were first put at room temperature for 10 min and then soaked in isopropyl for pretreatment of about 30 sec. The sections were stained by covering the working solution for 30 min, which were then rinsed with 60% (v/v) isopropyl solution and double distilled water successively. Nuclear staining was performed using Mayer′s hematoxylin (Sangon Biotech Co., Ltd. NO. E607317) for 30 sec. Finally, the sections were rinsed under running tap water until they turned blue and were observed under a light microscope (Olympus, BX53M).
Quantitative Reverse Transcription Polymerase Chain Reaction (qRT-PCR)
Total RNA was extracted from rat kidney tissue with Trizol (Vazyme Inc., Nanjing, China, R401-01) and quantified by NanoDrop2000/2000c spectrophotometer (Thermo Fisher Scientific, US). The cDNA was synthesized using the reverse transcription kit (Vazyme Inc., Nanjing, China, R101-01). The primers for specific genes were designed by primer design tools, the RealTime PCR Tool in INTEGRATED DNA TECHNOLOGIES (www.idtdna.com/site/order/menu). The primer-BLAST in the NCBI website (https://www.ncbi.nlm.nih.gov/tools/primer-blast/index.cgi) was performed to examine the amplification specificity for primers. qRT-PCR was performed according to the manufacturer’s instructions (Vazyme Inc., Nanjing, China, Q221-01). PCR program was as followed: 95°C for 5 min, 95°C for 10 sec, 55°C for 30 sec, 72°C for 10 sec, 40 cycles. The relative quantification of mRNA levels was calculated based on the 2−ΔΔCt method (28), and ACTB was used as an internal control.
Statistical Analysis
Results were presented as the mean ± Standard Error of Mean (SEM). Statistical analyses were carried out with SPSS 17.0 statistical software (SPSS, Inc., Chicago, IL, USA). The student’s t‐test was used for the statistical significance analysis. A p-value <0.05 was considered to be statistically significant. qPCR figures were prepared with GraphPad Prism 9 (GraphPad Software, Inc., San Diego, CA, USA).
Results
Identification of DEGs of Interest
The meta-analysis flowchart was shown in Figure 1A. Before DEGs analysis, the data should be normalized. The quality reports of the individual datasets were shown in Figure S1 (before data normalization) and S2 (after data normalization). As shown in Figures S1K, L, the samples were tightly clustered mainly according to the original studies. After batch effect correction, the resulting PCA plot demonstrated that the clustering was primarily based on normal control and DKD groups (Figures 1B, C), which manifested that the adjusted batch datasets could be used for further analysis.
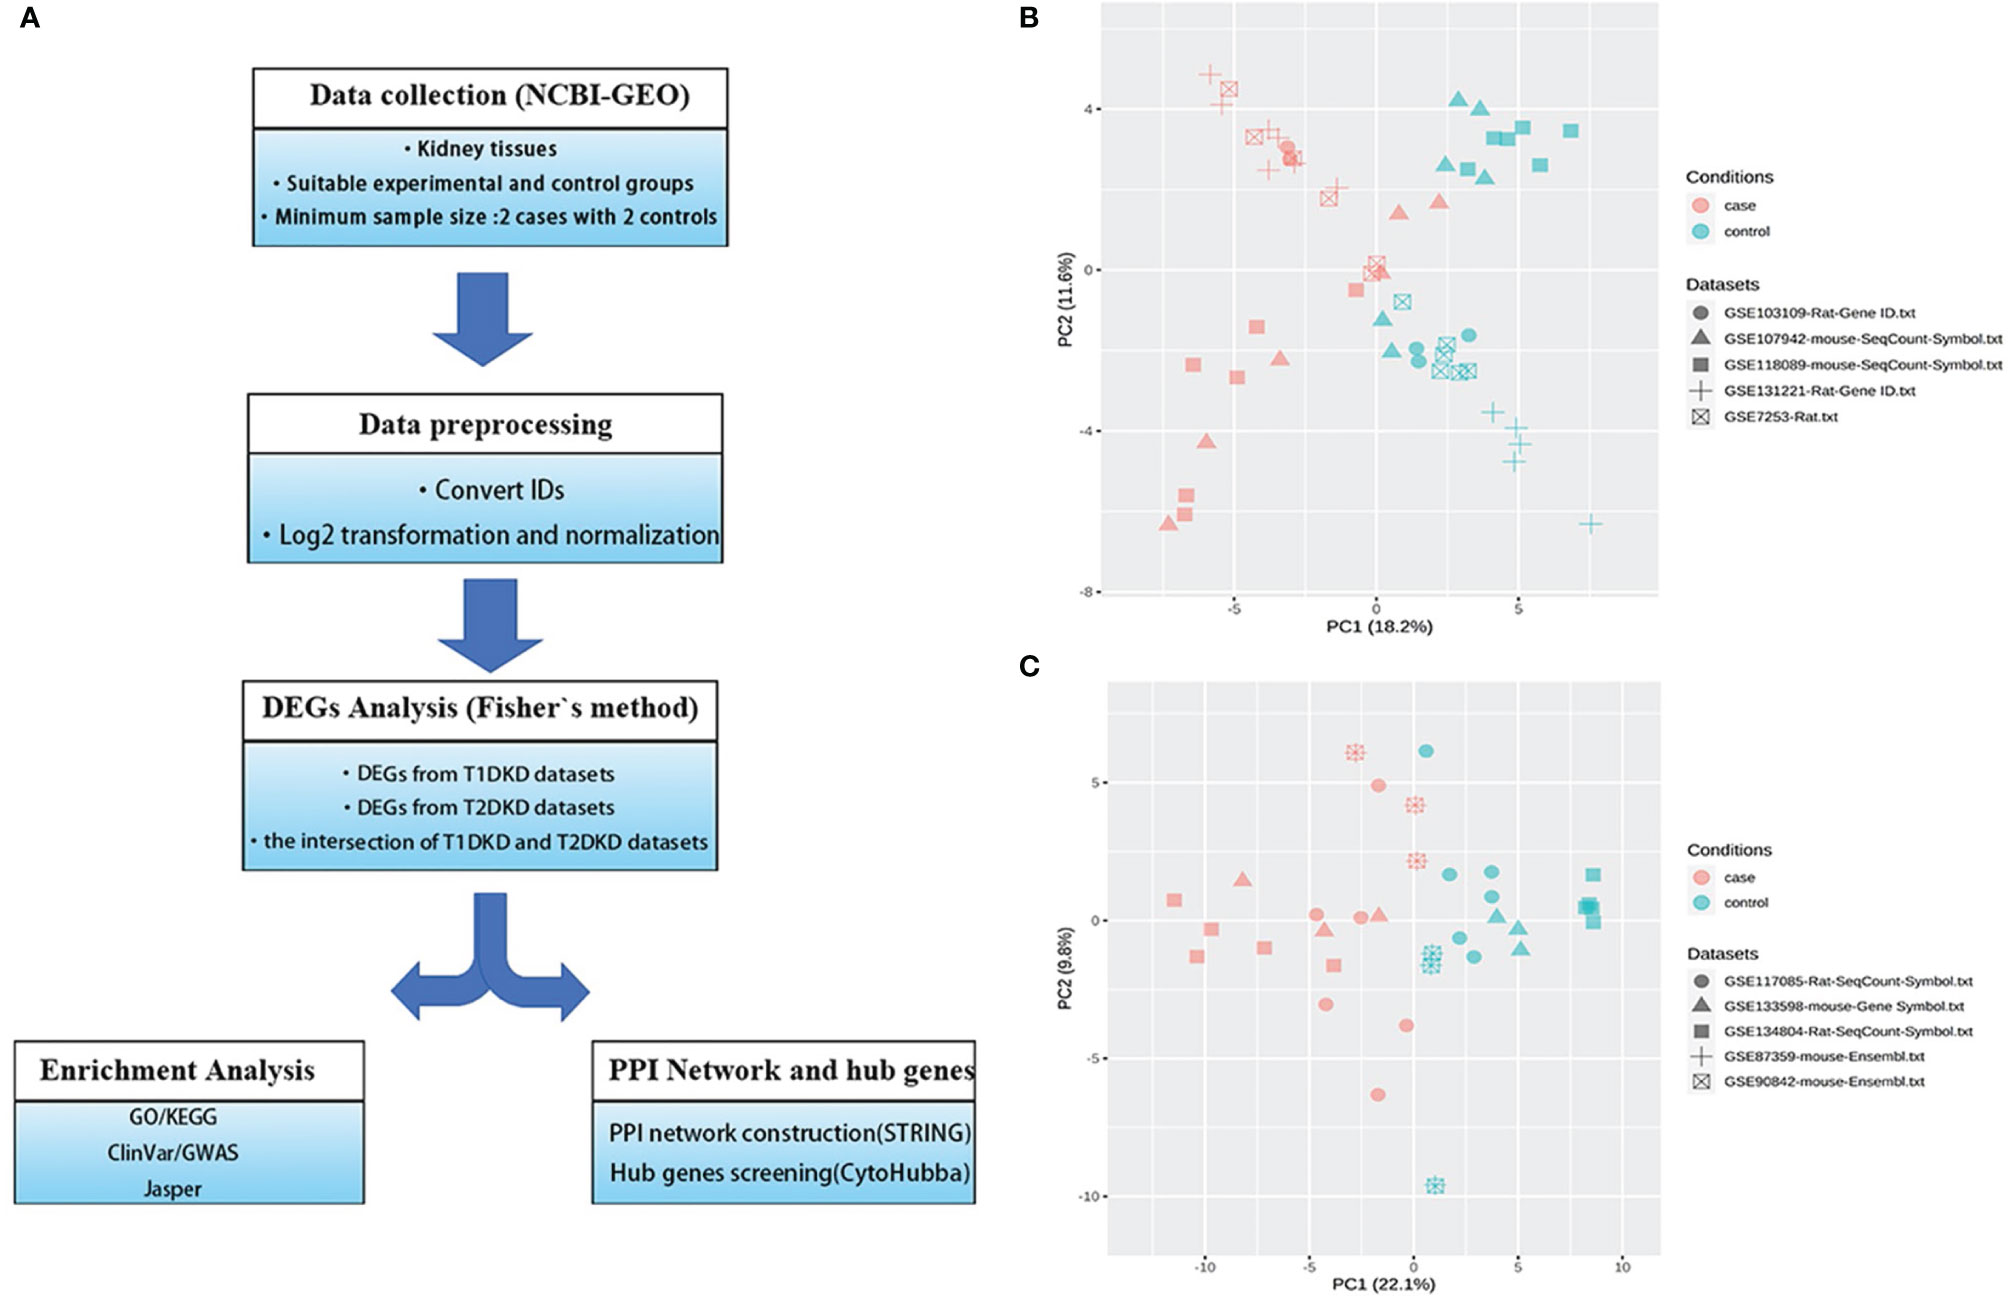
Figure 1 Data collection and processing: (A) The Meta-analysis flowchart. The main methods in each stage are described in the corresponding parentheses. (B, C) Principal component analysis (PCA) of the combined datasets after batch effect correction. All samples are represented by different symbols with shapes according to their studies and colors based on their experimental conditions. (B) T1DKD datasets. (C) T2DKD datasets.
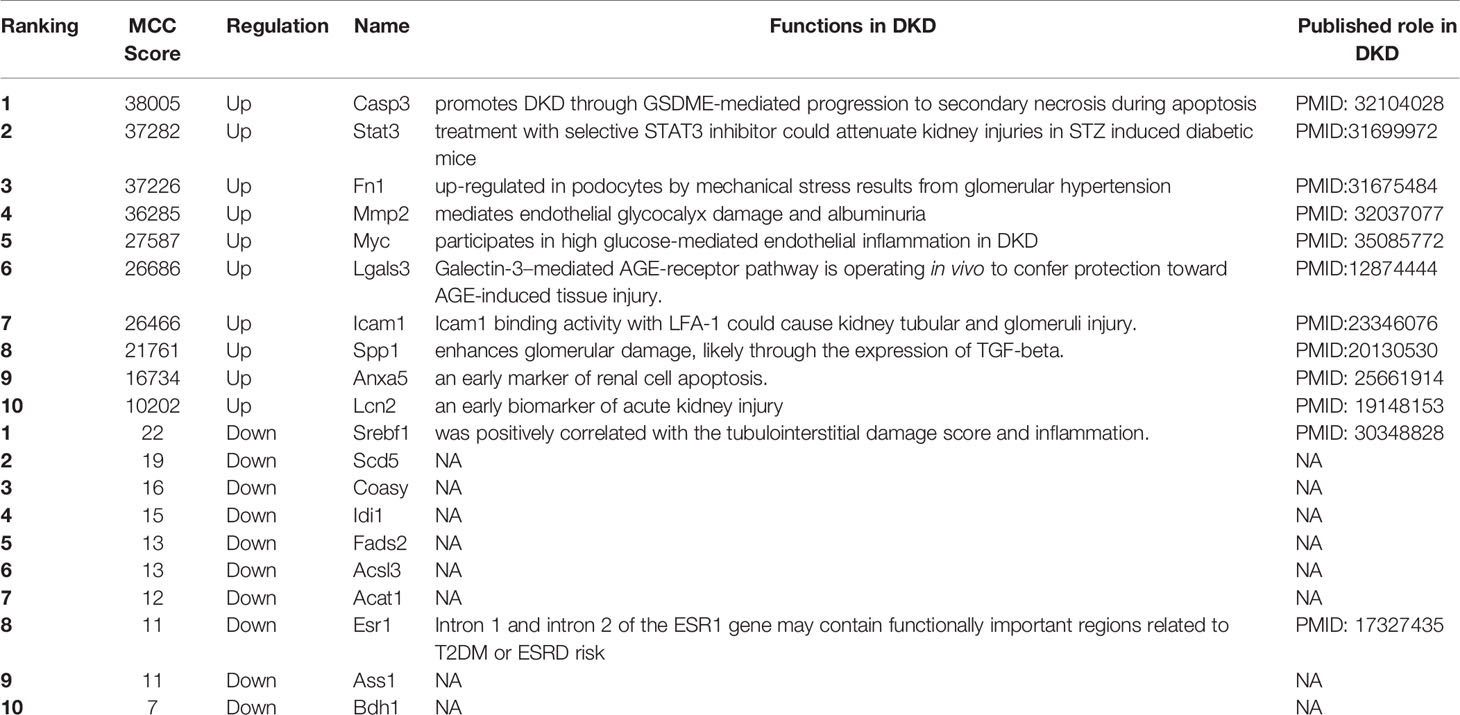
According to Fisher’s method, 633 up-regulated genes and 620 down-regulated genes were found in T1DKD datasets. The heatmap of DEGs in T1DKD was shown in Figure S3A and the detailed information of the top 5 DEGs were shown in Supplementary Table 1. 806 up-regulated genes and 529 down-regulated genes were found in T2DKD datasets. The heatmap of DEGs in T2DKD was shown in Figure S3B and the detailed information of the top 5 DEGs were shown in Supplementary Table 2. Importantly, 305 shared DEGs were obtained from T1DKD and T2DKD datasets, including 151 up-regulated genes and 154 down-regulated genes. The Venn diagrams of the shared DEGs and the expression heatmaps were shown in Figure 2. The detailed information for the most significant shared genes were shown in Table 2. The shared up-regulated genes included Cdkn1a, Sulf2, Ephx1, Plk2, etc., and the shared down-regulated genes included Igfbp4, Mthfr, Nrep, etc. Unexpectedly, some shared DEGs (Tmem43, Mpv17l, Slco1a1, etc.) with statistical significance have not been reported before in DKD relevant-related studies.
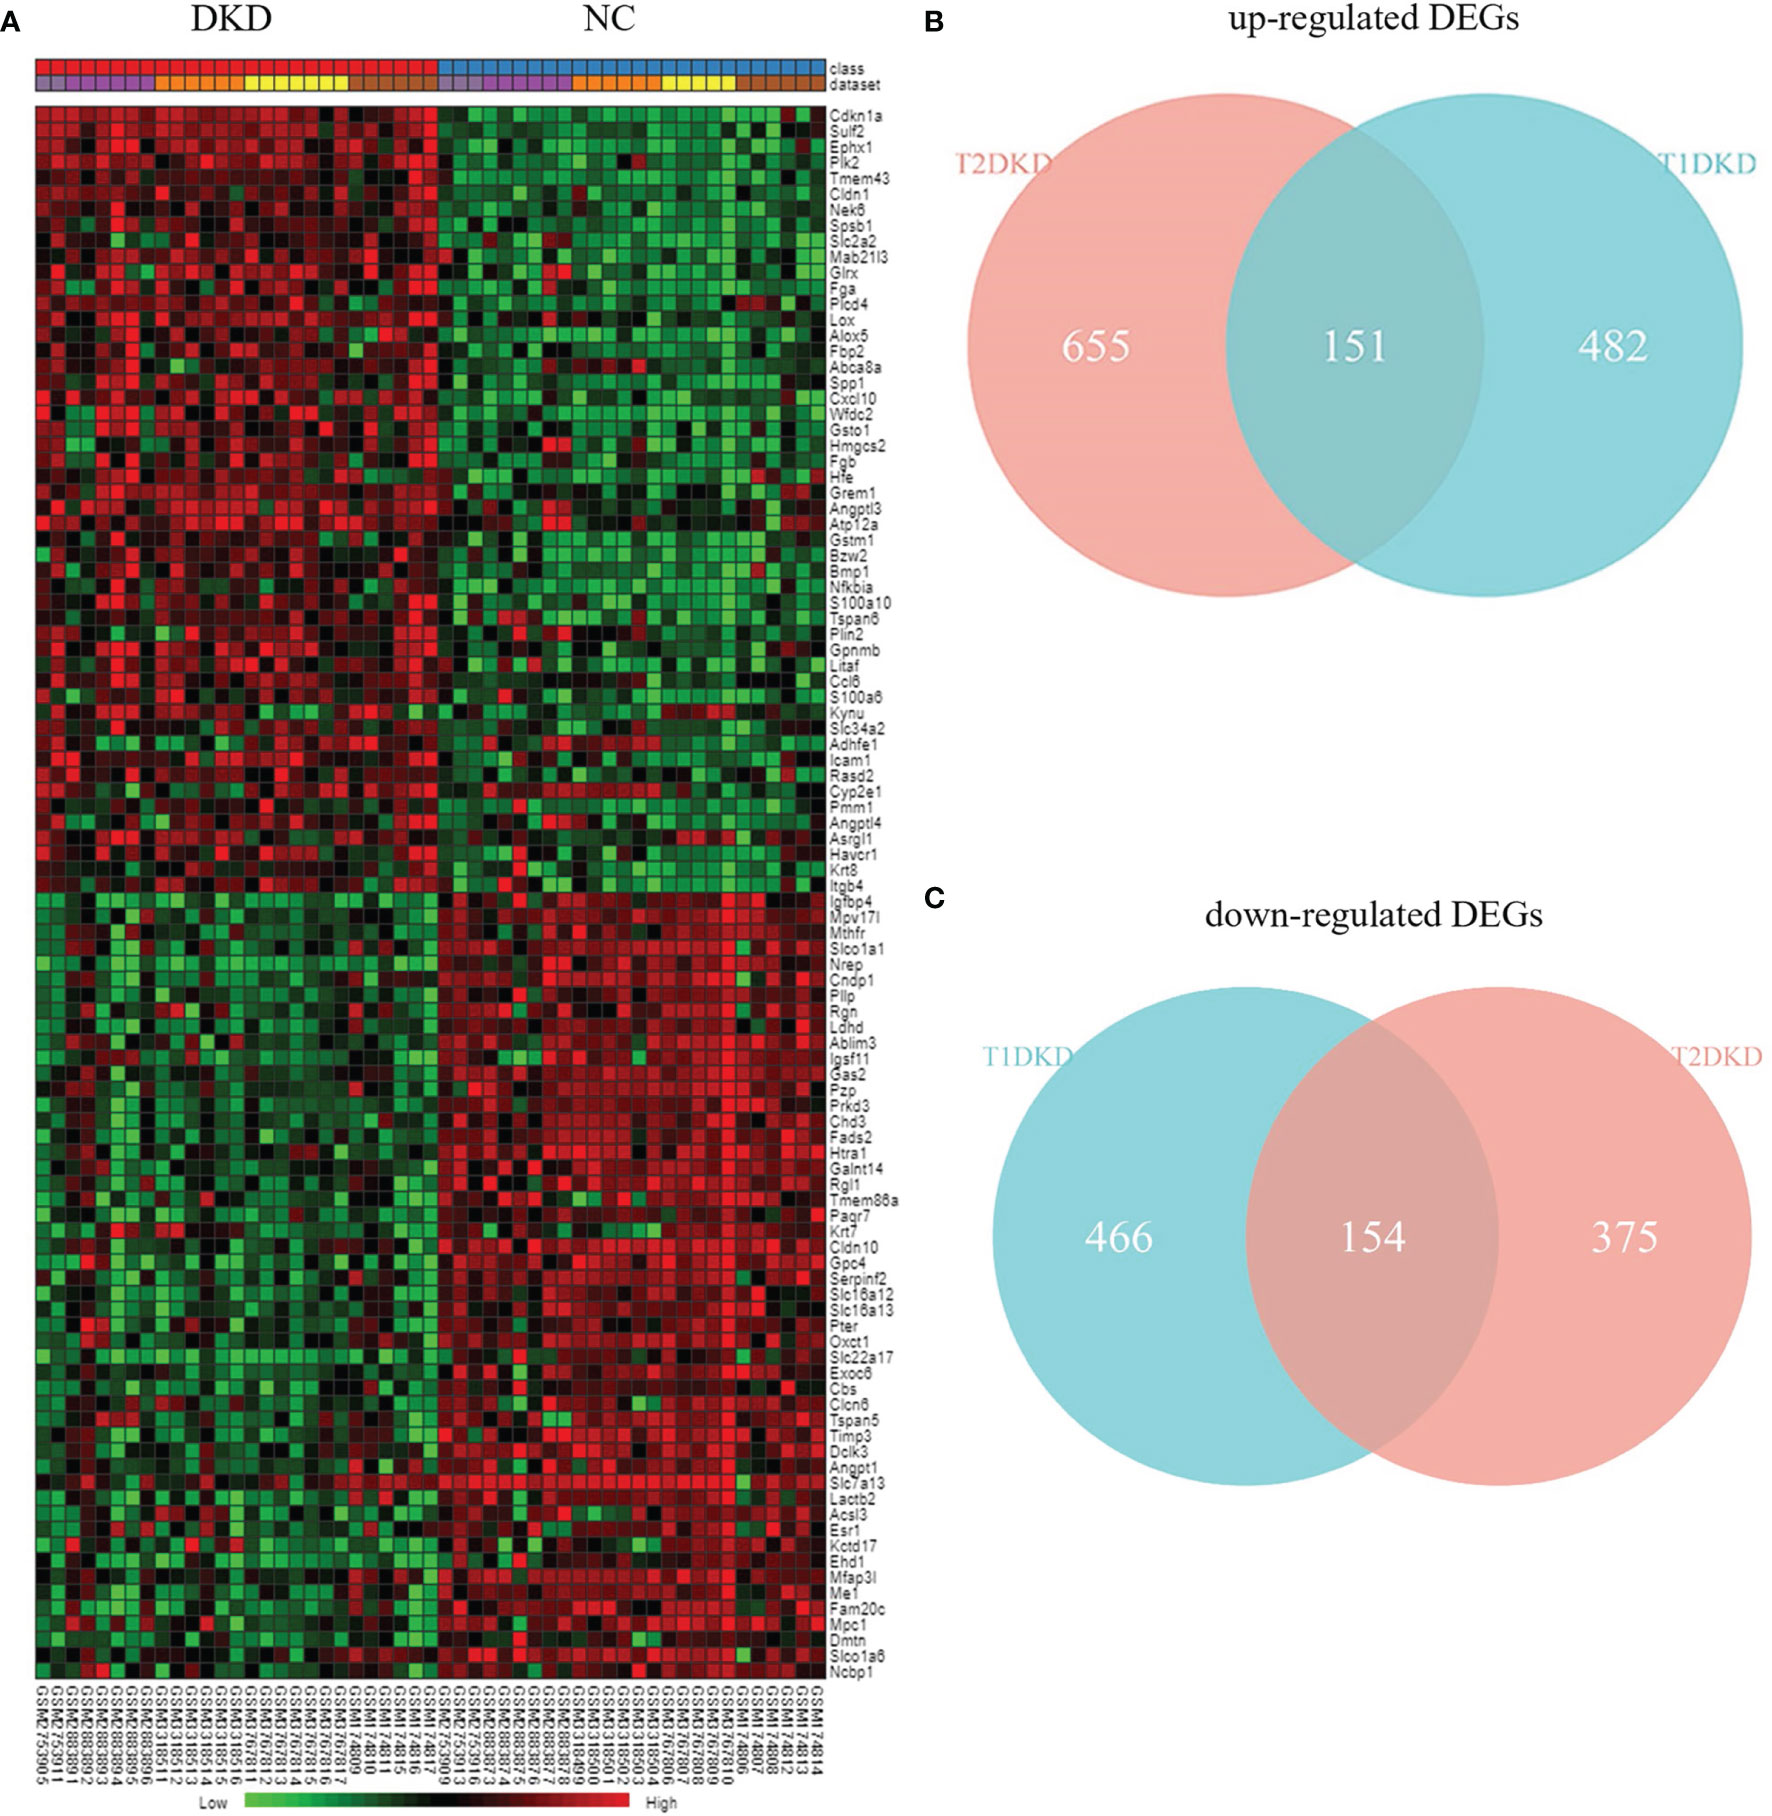
Figure 2 Differentially expressed genes analysis: (A) Heatmap of the top 50 shared up- and down-regulated genes identified during meta-analysis. (B) Venn diagrams of the shared up-regulated DEGs in TIDKD and T2DKD datasets. (C) Venn diagrams of the shared down-regulated DEGs in TIDKD and T2DKD datasets.
The Obtainment of Enriched GO Terms and Key Pathways
Based on the shared DEGs in T1DKD and T2DKD datasets, the GO terms and KEGG pathways were enriched and the top 10 terms were shown in Figure 3. In the biological process (BP), the shared DEGs were mainly enriched in the dicarboxylic acid metabolic process and the alpha-amino acid metabolic process in the biological process (Figure 3A). In molecular function (MF), DEGs were mainly enriched in oxidoreductase activity (acting on CH-OH group of donors, NAD/NADP as acceptor) (Figure 3B). As for the cellular component (CC) group, DEGs were mainly enriched in the mitochondrial matrix (Figure 3C). The Venn diagrams of all significant GO common to T2DKD and T1DKD were shown in Figure S4. In the KEGG pathway, unexpectedly, synthesis and degradation of ketone bodies ranked first (Figure 3D). The heatmap of involved genes, Bdh1, Oxct1, Hmgcs2, and Acat1, were presented in Figure 3K. In the results of GWAS analysis, the top 1 was blood metabolite levels and total cholesterol levels were also enriched significantly (Figure 3E). Diabetes mellitus type 2 was significantly enriched in the Clinvar database (Figure 3F) and NK2 Homeobox 8 (NKX2-8, human) was enriched in the JASPAR database (Figure 3G).
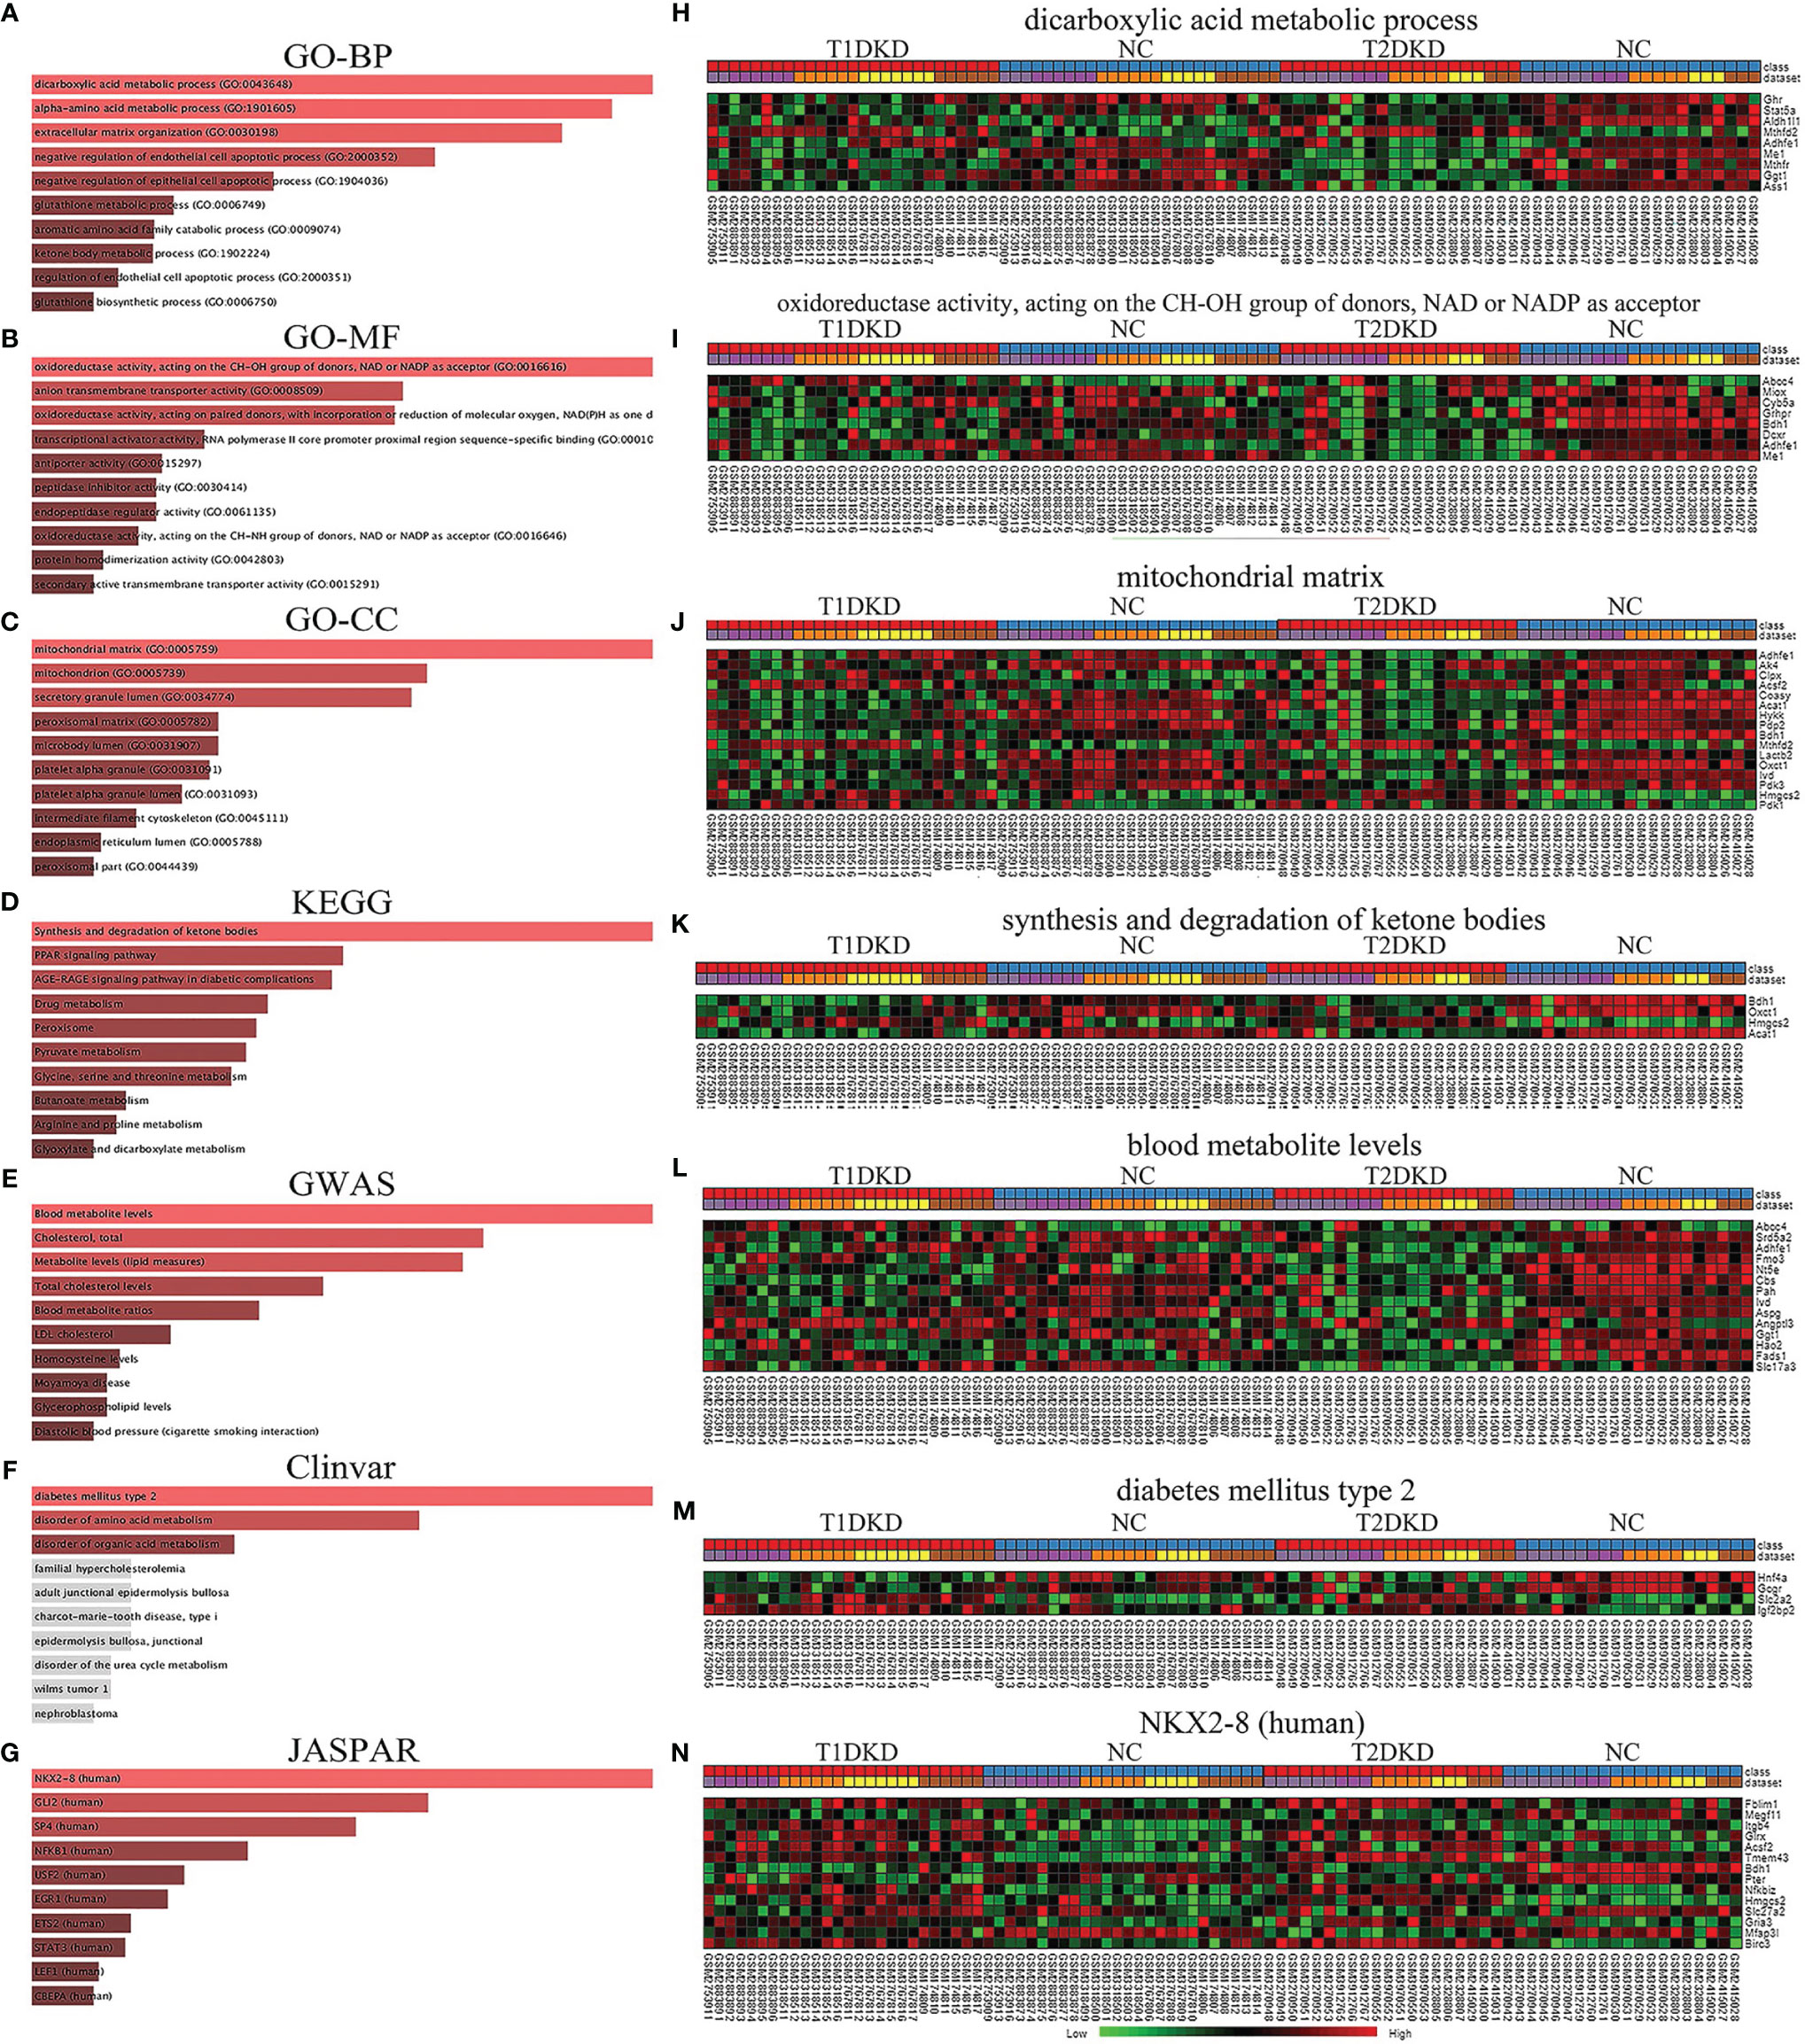
Figure 3 Functional annotation and enrichment analysis of the shared DEGs in T1DKD and T2DKD datasets obtained by meta-analysis: (A-G) Functional annotation and enrichment analysis results in Enrichr. (A) GO-BP; (B) GO-MF; (C) GO-CC; (D) KEGG; (E) GWAS; (F) Clinvar; (G) JASPAR. (H–N) Heatmaps of genes enriched in each top1 term.
Identification of Hub Genes
The human PPI network based on the shared up-and down-regulated DEGs in T1DKD and T2DKD datasets was constructed (Figures 4A, D), and the hub genes screened with Maximal Clique Centrality (MCC) algorithm were shown in Figures 4B, E. The Venn diagrams of the shared hub genes were shown in Figures 4C, F. The detailed information about the top 10 hub genes were shown in Table 3. The top 10 shared up-regulated hub genes included Casp3, stat3, fn1, Mmp2, Myc, Lgals3, Icam1, Spp1, Anxa5, and Lcn2, all of which have been reported to be involved in DKD before. Among the top 10 shared down-regulated hub genes, 8 hub genes, Scd5, Coasy, Idi1, Fads2, Acsl3, Acat1, Ass1, Bdh1, except Srebf1 and Esr1, were novel to DKD study.
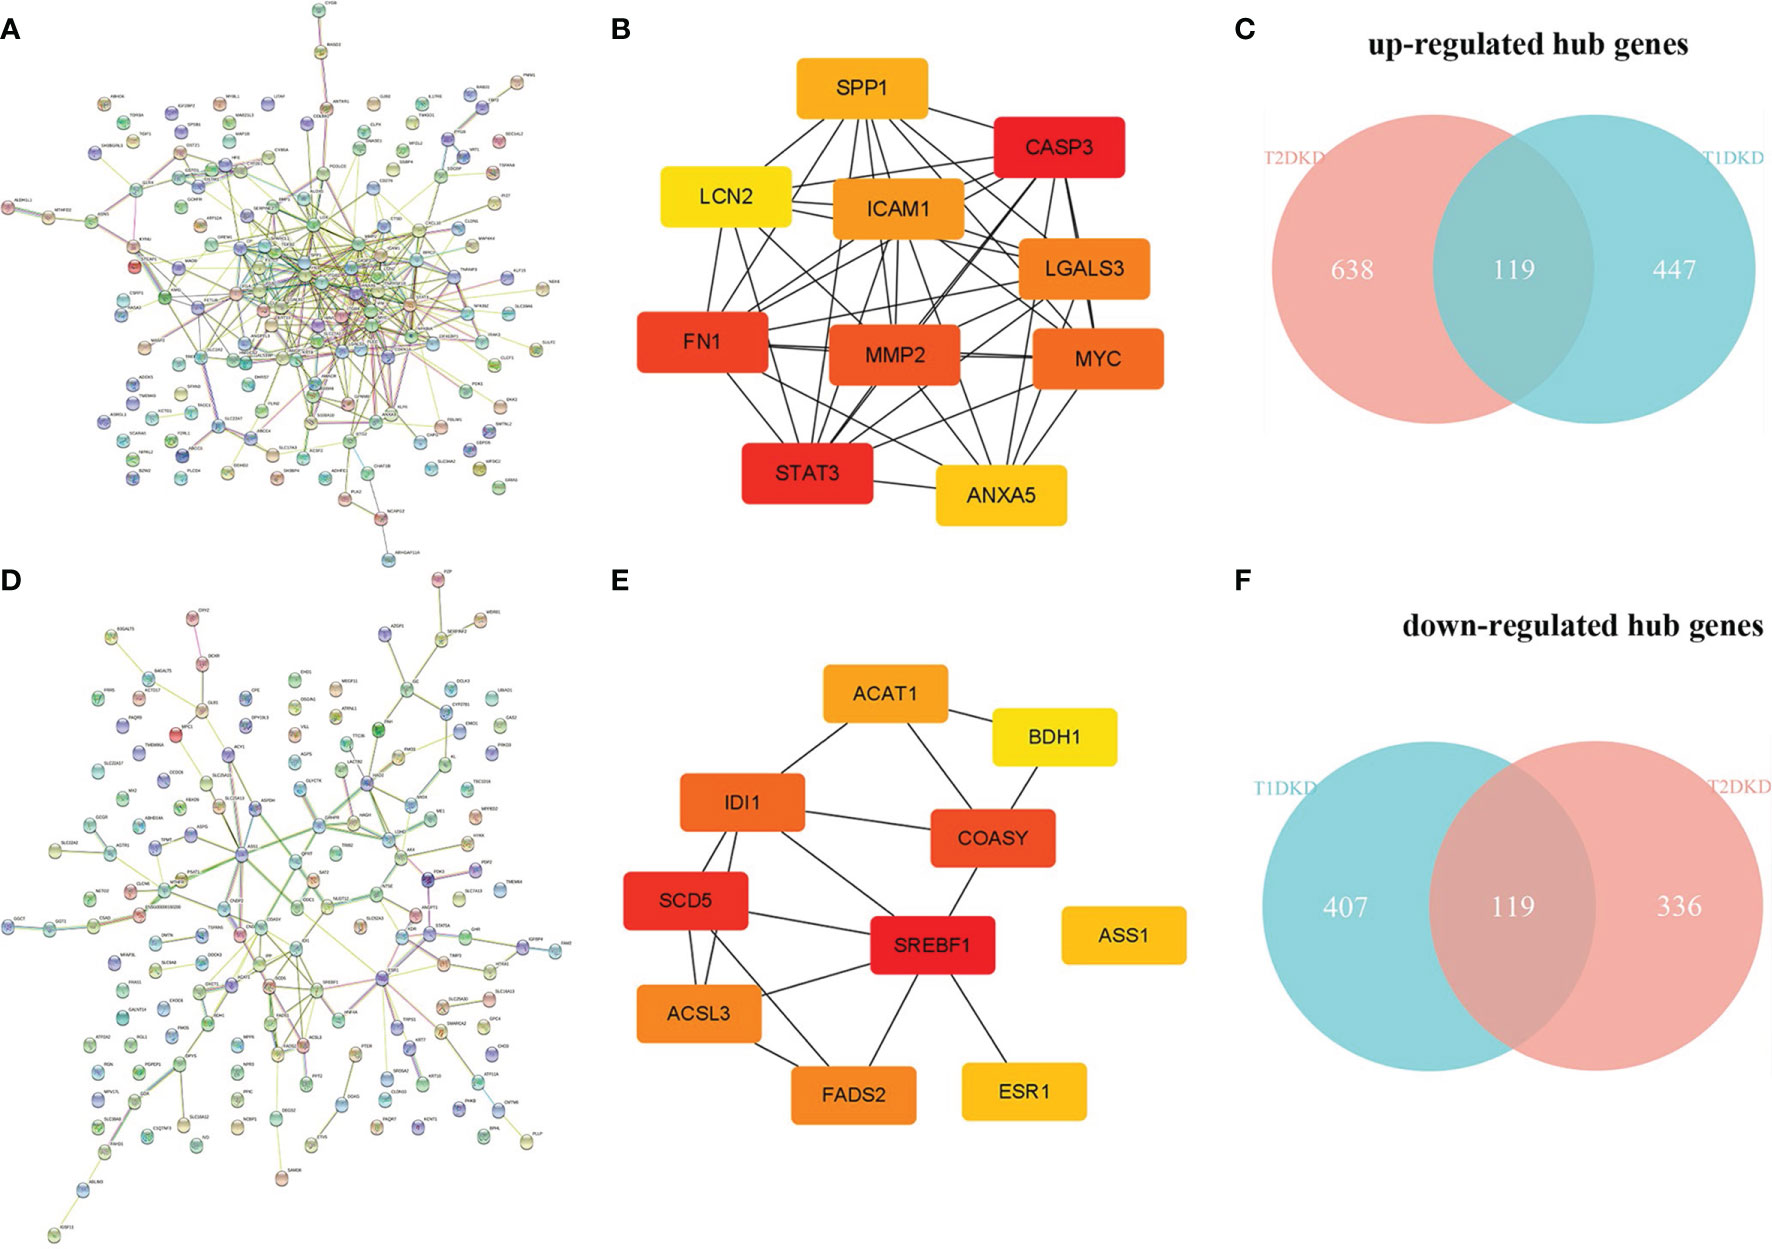
Figure 4 Protein-protein interaction (PPI) network construction and hub gene screening: (A) The PPI network constructed with the shared up-regulated DEGs. (B) Top 10 up-regulated hub genes. (C) Venn diagram of the shared up-regulated hub genes. (D) The PPI network constructed with the shared down-regulated DEGs. (E) Top 10 down-regulated hub genes. (F) Venn diagram of the shared down-regulated hub genes.
Morphological Changes of Kidney by HE Staining and Oil Red O Staining
HE staining and Oil Red O staining was performed to examine the morphological changes and lipid droplet deposits in STZ-induced T1DM rats. As shown in Figure 5A, in the early stage of DKD (2w), glomeruli in T1DM rats seemed to have no abnormality under light microscopy, characterized with minimal change nephropathy. Tubuloepithelial cell hypertrophy developed at 4w after the onset of T1DM and lipid droplets were observed in epithelial cells of the renal tubules at 6w after the onset of T1DM (Figure 5B), suggesting that steatosis appeared in tubuloepithelial cells of T1DM.
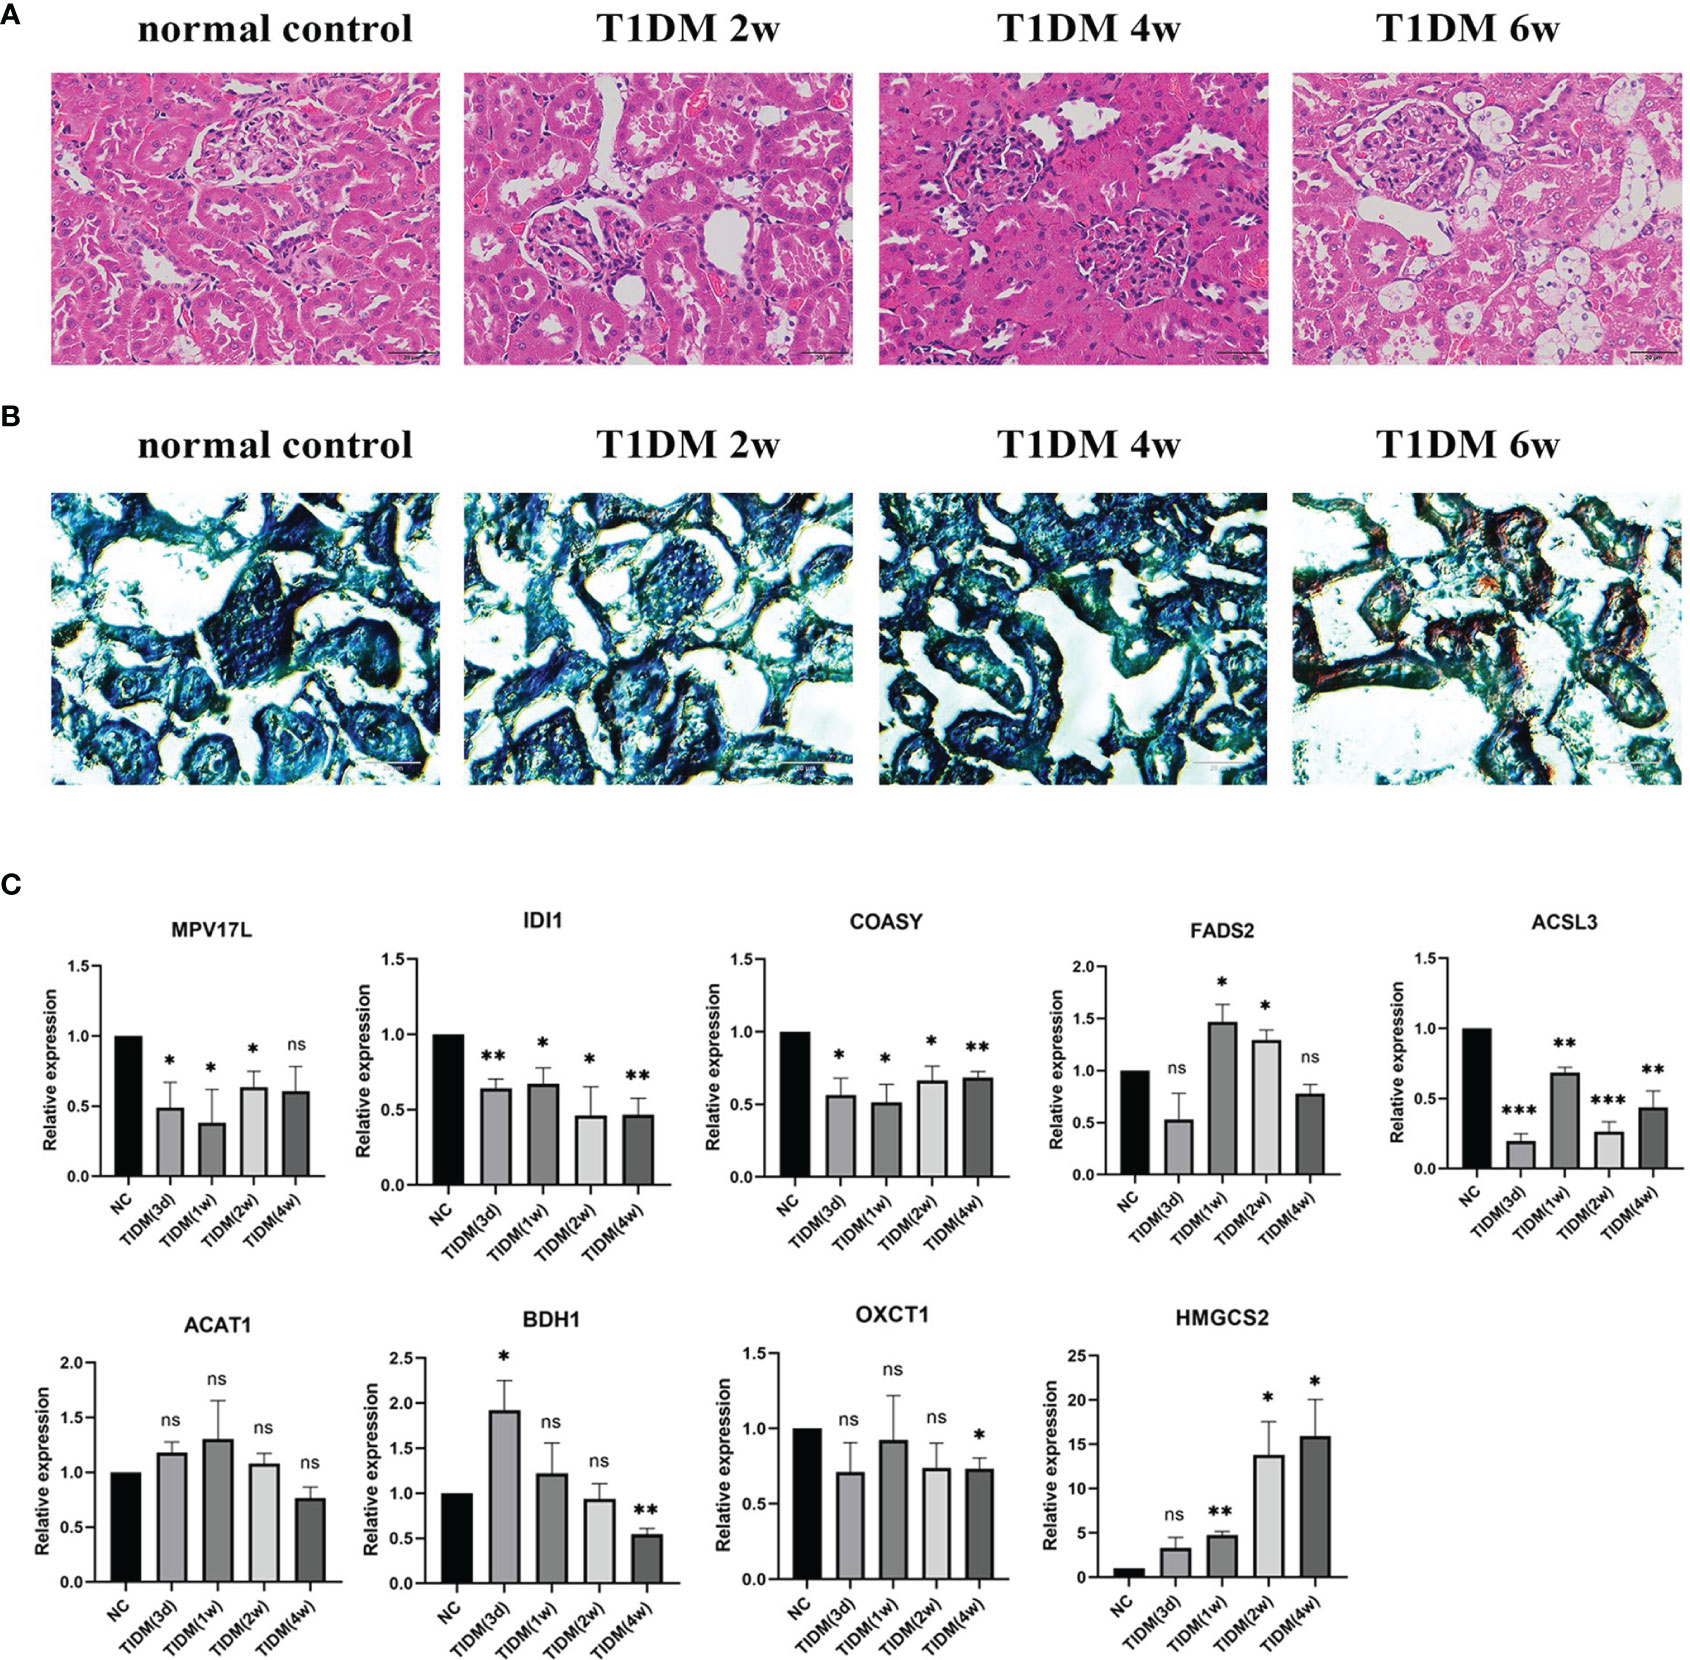
Figure 5 Morphological changes of kidney and qPCR confirmation in T1DM rats: (A) Hematoxylin & eosin (HE) staining of renal tissue. (B) Oil Red O staining of renal tissue. (C) The mRNA expression level of some genes of interest in T1DKD rats. Data are presented as means ± SEM of at least three independent experiments. *p < 0.05, **p < 0.01, ***p < 0.001, and ns, no significance, versus the control with the same treatment (Student’s t-test).
Confirmation of DEGs of Interest at mRNA Level
The qRT-PCR results (Figure 5C) showed that in T1DM rats, the mRNA expression levels of Idi1, Acsl3, Coasy, Oxct1, Bdh1, and Mpv17l were significantly down-regulated, and the expression of Fads2 and Hmgcs2 were significantly up-regulated at specific time points. The comparison details of meta-analysis and qRT-PCR results are shown in Table 4. The mRNA expression levels of most DEGs of interest in diabetic rats, except Fads2 and Acat1, were consistent with the meta-analysis.

Table 4 Meta-analysis details and experimental results of the shared hub genes unpublished relative to DKD and DEGs of interest in T1DKD rats.
Discussion
Here, we performed an integrative meta-analysis to identify novel vital pathways and molecular signatures for T1DKD and T2DKD, followed by verification in T1DM rats at the transcriptional level. Because T2DKD datasets were derived from a variety of T2DM models, including high-fat diet (HFD) and STZ-induced diabetic rats, ZDF (fa/fa) rats, ZSF1 rats, and db/db mice, experimental verification of meta-analysis results in T2DKD rats was not explored. Nonetheless, this research will provide a new perspective on DKD mechanism research and therapy strategy.
Novel Molecular Signatures and Potential Therapeutic Targets for DKD
Unlike previous studies, the present study discovered new molecular signatures for the first time, including Mpv17l, Idi1, Coasy, Fads2, Acsl3, Bdh1, and Oxct1. Mpv17l is a transmembrane protein that has previously been linked to peroxisomal reactive oxygen species metabolism and a close homolog of Mpv17, a protein found in the inner mitochondrial membrane protein Mpv17 (29). Mpv17l and HtrA2 complex is critical for mitochondrial oxidative stress sensing and protection from ROS-induced mitochondrial dysfunction. Mpv17 deletion causes proteinuric kidney disease in mice (30). Mpv17l was also linked to the development of early-onset glomerulosclerosis (31) and could modulate antioxidant enzyme expression (32). Mpv17l was found to be down-regulated in both T1DKD and T2DKD rats in a meta-analysis, and the result was confirmed at the transcriptional level in T1DM rats (Figure 5C). Oxidative stress has been considered one of the critical mechanisms in the pathogenesis of DKD. Down-regulated Mpv17l in DKD may connect with the increased level of ROS in DKD.
Idi1 is a protein-coding gene that encodes a peroxisomal-localized enzyme called isopentenyl-diphosphate delta isomerase 1. It was reported to catalyze the process of mevalonic acid conversion into farnesyl diphosphate (FPP), and ultimately, cholesterol (33). In 1997, the enzyme was found to be targeted to peroxisomes (34). However, many studies about Idi1 and its product have focused on yeast, plants, etc., and very little research has been done on mammals. Idi1 is closely associated with sterol metabolism and the down-regulation of Idi1 was confirmed at the transcriptional level in T1DM rats in our study (Figure 5C). Nevertheless, the current studies have not concluded a link between this gene and the pathogenic process of DKD. Idi1 deserves in-depth study in DKD.
Coasy is a bifunctional protein that carries out the last two steps in the biosynthesis of coenzyme A (CoA) from pantothenic acid (35). Previous studies relevant to Coasy mainly focused on neurodegenerative disease in the central nervous system (36–38). Also, abnormal regulated CoA metabolism in the liver and skeletal muscle likely contributed to the diabetic phenotype of the leptin-deficient mice (39). The down-regulation of Coasy in our results (Figure 5C) indicated the possible disruption of CoA synthesis, which might influence the multiple metabolism process, such as sterol, fatty acid, and ketone body in DKD.
The delta-6 desaturase (D6D) enzyme, encoded by the Fads2 gene, is one of the two rate-limiting enzymes that convert the polyunsaturated fatty acid (PUFA) precursors – α-linolenic (ALA, 18:3n-3) and linoleic acid (LA, 18:2n-6) to their individual metabolites, eicosapentaenoic acid/docosahexaenoic acid (EPA/DHA) and arachidonic acid (AA, 20:4n-6). Alterations in the D6D enzyme activity alter fatty acid profiles and are associated with metabolic and inflammatory diseases (40). Fads2 was critical for maintaining body long-chain polyunsaturated fatty acid (LC-PUFA) homeostasis (41). Moreover, LC-PUFA metabolism was associated with the crucial pathways, including the PPAR signaling pathway, spliceosome and protein processing in the endoplasmic reticulum pathway, and candidate kinase targets. The dysregulation of Fads2 may be related to abnormal lipid metabolism in DKD. In our study, the mRNA expression of Fads2 increased in T1DM rats, which was inconsistent with the result in the meta-analysis (Figure 5C), probably resulting from different time points of sampling and the small sample size.
Acsl3 is an isozyme of the long-chain fatty-acid-coenzyme A ligase family. It converts free long-chain fatty acids into fatty acyl-CoA esters and plays a crucial role in lipid biosynthesis and fatty acid degradation. Acsl3 is highly expressed in the brain and preferentially utilizes myristate, arachidonate, and eicosapentaenoate as substrates. TNF-α induced up-regulation of Acsl3, and Acsl3 was required for TNF-α-induced lipid droplet formation in endothelial cells exposed to oleic acid, and Acsl3 showed a modest suppression of TNF-α-mediated secretion of PGE2 (42). Acsl3 was shown to promote endogenous fatty acid oxidation (FAO) (43). The down-regulation expression of Acsl3 in the meta-analysis was validated in T1DKD rats using qRT-PCR (Figure 5C). We hypothesize that the decreased expression of Acsl3 may lead to an elevated level of FFA and disruption of FAO. Thus, Acsl3 may be considered as a potential therapeutic target for DKD.
Synthesis and Degradation of Ketone Bodies and Lipid Metabolism
Interestingly, synthesis and degradation of ketone bodies ranked the top 1, followed by the PPAR signal pathway from KEGG pathway enrichment analysis (Figure 3D). Although extrahepatic ketogenesis is controversial, the kidney has shown great potential as a ketogenic organ. In 2011, Zhang et al. found that diabetic kidneys exhibited excess ketogenic activity resulting from increased HMGCS2 expression in T2DM (44). Since then, there have been few reports of renal ketogenesis. It is well-accepted that the kidney can excrete and resorb liver-derived ketone bodies from the bloodstream, and beta-hydroxybutyrate (βOHB), the primary form of ketone body, is metabolized by the proximal tubule (45). In 2003, Guh et al. first demonstrated βOHB effected on human proximal tubule cells (HK-2 cells) in terms of cellular growth inhibition and collagen production in a dose-dependent way (46), which may lead to tubulointerstitial fibrosis in DKD. However, in the last few years, more studies focused on the role of ketogenesis in mediating the renal protective effects in diabetes. In 2017, Yi et al. noted that renal ketogenesis could resist oxidation via SIRT3 activation in the context of the HFD (47). Ketogenesis is affected by multiple factors, including endocrine regulation, transcriptional regulation, posttranslational modifications, and biochemical regulation (48). As the primary anabolic hormone, insulin suppresses lipolysis in adipose tissue, thus depriving ketogenesis of its substrate (49). PPAR signal pathway, especially PPARα, also plays a role in fatty acid oxidation and ketogenesis (50).
The dysregulation of ketone body metabolism related genes was identified in T1DKD and T2DKD with the down-regulation of Acat1, Oxct1, Bdh1, and the up-regulation of expression of Hmgcs2 by meta-analysis. Hmgcs2, the critical enzyme for ketone body anabolism, condenses acetyl-CoA with acetoacetyl-CoA to form HMG-CoA (51). Acat1 is Acetyl-CoA acetyltransferase that is also involved in ketone body anabolism. Oxct1 is a homodimeric mitochondrial matrix enzyme that plays a central role in extrahepatic ketone body catabolism by catalyzing the reversible transfer of coenzyme A from succinyl-CoA to acetoacetate. Bdh1 catalyzes the interconversion of acetoacetate and βOHB, the two major ketone bodies produced during fatty acid catabolism (52), and Bdh1 was identified as one of the top ten down-regulated hub genes in this study. According to the previous study, βOHB has a primarily anti-inflammatory effect, but high quantities of ketone bodies, notably acetoacetate, may have a pro-inflammatory effect (53). The down-regulation of Bdh1 resulted in acetoacetate accumulation and βOHB decrease in the diabetic kidney, which might contribute to a pro-inflammatory state in DKD. In the present study, the up-regulation expression of Hmgcs2 and the down-regulation expression of Bdh1 and Oxct1 were validated in T1DKD rats by qRT-PCR. Combined with previous studies, we propose an imbalance between the up-regulated ketogenic activity and down-regulated ketolytic activity in diabetic kidneys, which indicated that the diabetic kidney was more likely to work as a ketogenic organ rather than a ketolytic organ. Hmgcs2 and Oxct1, as the key enzymes involved in ketone body metabolism, may be considered potential therapeutic targets. Acat1, one of the top 10 shared down-regulated hub genes, probably has a vital role in both T1DKD and T2DKD. However, the expression of Acat1 in T1DKD rats was not significantly down-regulated compared to the normal group, and its clinic value in the treatment of DKD remains to be elucidated.
In summary, using the meta-analysis approach, for the first time, we identified the novel molecular signatures for DKD, Mpv17l, Idi1, Coasy, Oxct1, Fads2, Bdh1, and Acsl3. Meanwhile, we found that abnormal ketone body metabolism may play a pivotal role in the pathogenesis of DKD. This study deepened our understanding of the molecular mechanism underlying DKD, and targeting metabolic abnormalities of ketone bodies may represent a novel therapeutic strategy for DKD.
Data Availability Statement
The datasets presented in this study can be found in online repositories. The names of the repository/repositories and accession number(s) can be found in the article/Supplementary Material.
Ethics Statement
The animal study was reviewed and approved by ARVO Statement for the Use of Animals in Ophthalmic and Vision Research and The Guides for the Care and Use of Animals (National Research Council and Tongji University) (Permit Number: TJmed-010-32).
Author Contributions
LL, YL, and GX conceived, developed, and mentored the project. MD, YW, and JY performed the experiments. JZ, HT, JingX, CJ, FG, and JW provided technical support and analyzed the data. HJ conducted the statistical analysis using R. MD, YW, JY, and LL wrote the manuscript. All authors read and approved the final manuscript.
Funding
This work was supported by grant obtained from the Ministry of Science and Technology of China (2020YFA0113101) and the Fundamental Research Funds for the Central Universities (22120220009).
Conflict of Interest
The authors declare that the research was conducted in the absence of any commercial or financial relationships that could be construed as a potential conflict of interest.
Publisher’s Note
All claims expressed in this article are solely those of the authors and do not necessarily represent those of their affiliated organizations, or those of the publisher, the editors and the reviewers. Any product that may be evaluated in this article, or claim that may be made by its manufacturer, is not guaranteed or endorsed by the publisher.
Supplementary Material
The Supplementary Material for this article can be found online at: https://www.frontiersin.org/articles/10.3389/fendo.2022.843721/full#supplementary-material
References
1. International Diabetes Federation. IDF Diabetes Atlas (2019). Brussels, Belgium: International Diabetes Federation. Available at: http://www.idf.org/diabetesatlas (Accessed November 25, 2019).
2. Koye DN, Magliano DJ, Nelson RG, Pavkov ME. The Global Epidemiology of Diabetes and Kidney Disease. Adv Chronic Kidney Dis (2018) 25,2:121–32. doi: 10.1053/j.ackd.2017.10.011
3. Schena FP, Gesualdo L. Pathogenetic Mechanisms of Diabetic Nephropathy. J Am Soc Nephrol: JASN (2005) 16 Suppl 1:S30–3. doi: 10.1681/asn.2004110970
4. Rao KSS, Kaptoge S, Thompson A, Di Angelantonio E, Gao P, Sarwar N, et al. Diabetes Mellitus, Fasting Glucose, and Risk of Cause-Specific Death. New Engl J Med (2011) 364,9:829–41. doi: 10.1056/NEJMoa1008862
5. Forbes JM, Coughlan MT, Cooper ME. Oxidative Stress as a Major Culprit in Kidney Disease in Diabetes. Diabetes (2008) 57,6:1446–54. doi: 10.2337/db08-0057
6. Sanajou D, Ghorbani HA, Argani H, Aslani S. AGE-RAGE Axis Blockade in Diabetic Nephropathy: Current Status and Future Directions. Eur J Pharmacol (2018) 833:158–64. doi: 10.1016/j.ejphar.2018.06.001
7. Liu W-J, Huang WF, Ye L, Chen RH, Yang C, Wu HL, et al. The Activity and Role of Autophagy in the Pathogenesis of Diabetic Nephropathy. Eur Rev Med Pharmacol Sci (2018) 22,10:3182–9. doi: 10.26355/eurrev_201805_15079
8. Tsai Y-C, Kuo MC, Hung WW, Wu LY, Wu PH, Chang WA, et al. High Glucose Induces Mesangial Cell Apoptosis Through miR-15b-5p and Promotes Diabetic Nephropathy by Extracellular Vesicle Delivery. Mol Ther: J Am Soc Gene Ther (2020) 28,3:963–74. doi: 10.1016/j.ymthe.2020.01.014
9. Lee YH. An Overview of Meta-Analysis for Clinicians. Korean J Internal Med (2018) 33,2:277–83. doi: 10.3904/kjim.2016.195
10. Langer WJ, Devish K, Carmines PK, Lane PH. Prepubertal Onset of Diabetes Prevents Expression of Renal Cortical Connective Tissue Growth Factor. Pediatr Nephrol (Berlin Germany) (2008) 23,2:275–83. doi: 10.1007/s00467-007-0642-8
11. Brennan EP, Mohan M, McClelland A, Tikellis C, Ziemann M, Kaspi A, et al. Lipoxins Regulate the Early Growth Response-1 Network and Reverse Diabetic Kidney Disease. J Am Soc Nephrol: JASN (2018) 29,5:1437–48. doi: 10.1681/ASN.2017101112
12. Tan SM, Ziemann M, Thallas-Bonke V, Snelson M, Kumar V, Laskowski A, et al. Complement C5a Induces Renal Injury in Diabetic Kidney Disease by Disrupting Mitochondrial Metabolic Agility. Diabetes (2020) 69,1:83–98. doi: 10.2337/db19-0043
13. Hasegawa S, Tanaka T, Saito T, Fukui K, Wakashima T, Susaki EA, et al. The Oral Hypoxia-Inducible Factor Prolyl Hydroxylase Inhibitor Enarodustat Counteracts Alterations in Renal Energy Metabolism in the Early Stages of Diabetic Kidney Disease. Kidney Int (2020) 97,5:934–50. doi: 10.1016/j.kint.2019.12.007
14. Zhang H, Zhao T, Li Z, Yan M, Zhao H, Zhu B, et al. Transcriptional Profile of Kidney From Type 2 Diabetic Db/Db Mice. J Diabetes Res (2017) 2017:8391253. doi: 10.1155/2017/8391253
15. Li X-Q, Chang DY, Chen M, Zhao MH. Deficiency of C3a Receptor Attenuates the Development of Diabetic Nephropathy. BMJ Open Diabetes Res Care (2019) 7,1:e000817. doi: 10.1136/bmjdrc-2019-000817
16. Zhou X, Muise ES, Haimbach R, Sehbat IK, Zhu Y, Liu Y, et al. PAN-AMPK Activation Improves Renal Function in a Rat Model of Progressive Diabetic Nephropathy. J Pharmacol Exp Ther (2019) 371,1:45–55. doi: 10.1124/jpet.119.258244
17. Sheng X, Qiu C, Liu H, Gluck C, Hsu JY, He C, et al. Systematic Integrated Analysis of Genetic and Epigenetic Variation in Diabetic Kidney Disease. Proc Natl Acad Sci United States America (2020) 117,46:29013–24. doi: 10.1073/pnas.2005905117
18. Gao Z, S A, Li XM, Li XL, Sui LN. Identification of Key Candidate Genes and Chemical Perturbagens in Diabetic Kidney Disease Using Integrated Bioinformatics Analysis. Front Endocrinol (2021) 12:721202:721202. doi: 10.3389/fendo.2021.721202
19. Karalliedde J, Gnudi L. Diabetes Mellitus, a Complex and Heterogeneous Disease, and the Role of Insulin Resistance as a Determinant of Diabetic Kidney Disease. Nephrol Dial Transplant: Off Publ Eur Dialysis Transplant Assoc - Eur Renal Assoc (2016) 31,2:206–13. doi: 10.1093/ndt/gfu405
20. Johnson WE, LI C, Rabinovic A. Adjusting Batch Effects in Microarray Expression Data Using Empirical Bayes Methods. Biostatistics (Oxford England) (2007) 8,1:118–27. doi: 10.1093/biostatistics/kxj037
21. Zhou G, Soufan O, Ewald J, Hancock R, Basu N, Xia J. NetworkAnalyst 3.0: A Visual Analytics Platform for Comprehensive Gene Expression Profiling and Meta-Analysis. Nucleic Acids Res (2019) 47, W1:W234–41. doi: 10.1093/nar/gkz240
22. Kuleshov MV, Jones MR, Rouillard AD, Fernandez NF, Duan Q, Wang Z, et al. Enrichr: A Comprehensive Gene Set Enrichment Analysis Web Server 2016 Update. Nucleic Acids Res (2016) 44,W1:W90–7. doi: 10.1093/nar/gkw377
23. Szklarczyk D, Gable AL, Lyon D, Junge A, Wyder S, Huerta-Cepas J, et al. STRING V11: Protein-Protein Association Networks With Increased Coverage, Supporting Functional Discovery in Genome-Wide Experimental Datasets. Nucleic Acids Res (2019) 47,D1:D607–13. doi: 10.1093/nar/gky1131
24. Chin C-H, Chen SH, Wu HH, Ho CW, Ko MT, Lin CY. Cytohubba: Identifying Hub Objects and Sub-Networks From Complex Interactome. BMC Syst Biol (2014) 8 Suppl 4:S11. doi: 10.1186/1752-0509-8-S4-S11
25. Shannon P, Markiel A, Ozier O, Baliga NS, Wang JT, Ramage D, et al. Cytoscape: A Software Environment for Integrated Models of Biomolecular Interaction Networks. Genome Res (2003) 13,11:2498–504. doi: 10.1101/gr.1239303
26. Furman BL. Streptozotocin-Induced Diabetic Models in Mice and Rats. Curr Protoc Pharmacol (2015) 70:5.47.1–5.47.20. doi: 10.1002/0471141755.ph0547s70
27. Wang J, Zhang J, Chen X, Yang Y, Wang F, Li W, et al. miR-365 Promotes Diabetic Retinopathy Through Inhibiting Timp3 and Increasing Oxidative Stress. Exp Eye Res (2018) 168:89–99. doi: 10.1016/j.exer.2017.11.006
28. Livak KJ, Schmittgen TD. Analysis of Relative Gene Expression Data Using Real-Time Quantitative PCR and the 2(-Delta Delta C(T)) Method. Methods (San Diego Calif) (2001) 25,4:402–8. doi: 10.1006/meth.2001.1262
29. Iida R, Yasuda T, Tsubota E, Matsuki T, Kishi K. Cloning, Mapping, Genomic Organization, and Expression of Mouse M-LP, a New Member of the Peroxisomal Membrane Protein Mpv17 Domain Family. Biochem Biophys Res Commun (2001) 283,2:292–6. doi: 10.1006/bbrc.2001.4769
30. Weiher H, Noda T, Gray DA, Sharpe AH, Jaenisch R. Transgenic Mouse Model of Kidney Disease: Insertional Inactivation of Ubiquitously Expressed Gene Leads to Nephrotic Syndrome. Cell (1990) 62,3:425–34. doi: 10.1016/0092-8674(90)90008-3
31. Iida R, Yasuda T, Tsubota E, Takatsuka H, Masuyama M, Matsuki T, et al. M-LP, Mpv17-Like Protein, has a Peroxisomal Membrane Targeting Signal Comprising a Transmembrane Domain and a Positively Charged Loop and Up-Regulates Expression of the Manganese Superoxide Dismutase Gene. J Biol Chem (2003) 278,8:6301–6. doi: 10.1074/jbc.M210886200
32. Iida R, Yasuda T, Tsubota E, Takatsuka H, Matsuki T, Kishi K. Human Mpv17-Like Protein is Localized in Peroxisomes and Regulates Expression of Antioxidant Enzymes. Biochem Biophys Res Commun (2006) 344,3:948–54. doi: 10.1016/j.bbrc.2006.04.008
33. Popják G. Conversion of Mevalonic Acid Into Prenyl Hydrocarbons as Exemplified by the Synthesis of Squalene. Biochem Soc Symp (1970) 29:17–33.
34. Paton VG, Shackelford JE, Krisans SK. Cloning and Subcellular Localization of Hamster and Rat Isopentenyl Diphosphate Dimethylallyl Diphosphate Isomerase. A PTS1 Motif Targets the Enzyme to Peroxisomes. J Biol Chem (1997) 272,30:18945–50. doi: 10.1074/jbc.272.30.18945
35. Zhyvoloup A, INemazanyy I, Babich A, Panasyuk G, Pobigailo N, Vudmaska M, et al. Molecular Cloning of CoA Synthase. The Missing Link in CoA Biosynthesis. J Biol Chem (2002) 277,25:22107–10. doi: 10.1074/jbc.C200195200
36. Dusi S, Valletta L, Haack TB, Tsuchiya Y, Venco P, Pasqualato S, et al. Exome Sequence Reveals Mutations in CoA Synthase as a Cause of Neurodegeneration With Brain Iron Accumulation. Am J Hum Genet (2014) 94,1:11–22. doi: 10.1016/j.ajhg.2013.11.008
37. Nishioka K, Oyama G, Yoshino H, Li Y, Matsushima T, Takeuchi C, et al. High Frequency of Beta-Propeller Protein-Associated Neurodegeneration (BPAN) Among Patients With Intellectual Disability and Young-Onset Parkinsonism. Neurobiol Aging (2015) 36,5:2004.e9–2004.e15. doi: 10.1016/j.neurobiolaging.2015.01.020
38. Horvath R, Lewis-Smith D, Douroudis K, Duff J, Keogh M, Pyle A, et al. SCP2 Mutations and Neurodegeneration With Brain Iron Accumulation. Neurology (2015) 85,21:1909–11. doi: 10.1212/WNL.0000000000002157
39. Leonardi R, Rock CO, Jackowski S. Pank1 Deletion in Leptin-Deficient Mice Reduces Hyperglycaemia and Hyperinsulinaemia and Modifies Global Metabolism Without Affecting Insulin Resistance. Diabetologia (2014) 57,7:1466–75. doi: 10.1007/s00125-014-3245-5
40. Robinson LE, Buchholz AC, Mazurak VC. Inflammation, Obesity, and Fatty Acid Metabolism: Influence of N-3 Polyunsaturated Fatty Acids on Factors Contributing to Metabolic Syndrome. Appl Physiol Nutr Metab = Physiol Appl Nutr Metabol (2007) 32,6:1008–24. doi: 10.1139/H07-087
41. Zhao Y, Yang G, Wu N, Cao X, Gao J. Integrated Transcriptome and Phosphoproteome Analyses Reveal That Fads2 is Critical for Maintaining Body LC-PUFA Homeostasis. J Proteomics (2020) 229:103967. doi: 10.1016/j.jprot.2020.103967
42. Jung HS, Shimizu-Albergine M, Shen X, Kramer F, Shao D, Vivekanandan-Giri A, et al. TNF-α Induces Acyl-CoA Synthetase 3 to Promote Lipid Droplet Formation in Human Endothelial Cells. J Lipid Res (2020) 61,1:33–44. doi: 10.1194/jlr.RA119000256
43. Schoors S, Bruning U, Missiaen R, Queiroz KC, Borgers G, Elia I, et al. Fatty Acid Carbon is Essential for dNTP Synthesis in Endothelial Cells. Nature (2015) 520,7546:192–7. doi: 10.1038/nature14362
44. Zhang D, Yang H, Kong X, Wang K, Ma X, Yan X, et al. Proteomics Analysis Reveals Diabetic Kidney as a Ketogenic Organ in Type 2 Diabetes. Am J Physiol Endocrinol Metab (2011) 300,2:E287–95. doi: 10.1152/ajpendo.00308.2010
45. Ferrier B, Martin M, Janbon B, Baverel G. Transport of Beta-Hydroxybutyrate and Acetoacetate Along Rat Nephrons: A Micropuncture Study. Am J Physiol (1992) 262,5 Pt 2:F762–9. doi: 10.1152/ajprenal.1992.262.5.F762
46. Guh J-Y, Chuang TD, Chen HC, Hung WC, Lai YH, Shin SJ, et al. Beta-Hydroxybutyrate-Induced Growth Inhibition and Collagen Production in HK-2 Cells are Dependent on TGF-Beta and Smad3. Kidney Int (2003) 64,6:2041–51. doi: 10.1046/j.1523-1755.2003.00330.x
47. Yi W, Xie X, Du M, Bu Y, Wu N, Yang H, et al. Green Tea Polyphenols Ameliorate the Early Renal Damage Induced by a High-Fat Diet via Ketogenesis/SIRT3 Pathway. Oxid Med Cell Longevity (2017) 2017:9032792. doi: 10.1155/2017/9032792
48. Grabacka M, Pierzchalska M, Dean M, Reiss K. Regulation of Ketone Body Metabolism and the Role of Pparα. Int J Mol Sci (2016) 17,12:2093. doi: 10.3390/ijms17122093
49. Alberti KG, Johnston DG, Gill A, Barnes AJ, Orskov H. Hormonal Regulation of Ketone-Body Metabolism in Man. Biochem Soc Symp (1978) 43:163–82.
50. Hong F, Pan S, Guo Y, Xu P, Zhai Y. PPARs as Nuclear Receptors for Nutrient and Energy Metabolism. Mol (Basel Switzerland) (2019) 24:14 2545. doi: 10.3390/molecules24142545
51. Rojnueangnit K, Maneechai P, Thaweekul P, Piriyanon P, Khositseth S, Ittiwut C, et al. Expanding Phenotypic and Mutational Spectra of Mitochondrial HMG-CoA Synthase Deficiency. Eur J Med Genet (2020) 63,12:104086. doi: 10.1016/j.ejmg.2020.104086
52. Adami P, Duncan TM, McIntyre JO, Carter CE, Fu C, Melin M, et al. Monoclonal Antibodies for Structure-Function Studies of (R)-3-Hydroxybutyrate Dehydrogenase, a Lipid-Dependent Membrane-Bound Enzyme. Biochem J (1993) 292(Pt 3):863–72. doi: 10.1042/bj2920863
Keywords: diabetic kidney disease, bioinformatics, ketone body metabolism, Mpv17l, HMGCS2, BDH1
Citation: Diao M, Wu Y, Yang J, Liu C, Xu J, Jin H, Wang J, Zhang J, Gao F, Jin C, Tian H, Xu J, Ou Q, Li Y, Xu G and Lu L (2022) Identification of Novel Key Molecular Signatures in the Pathogenesis of Experimental Diabetic Kidney Disease. Front. Endocrinol. 13:843721. doi: 10.3389/fendo.2022.843721
Received: 26 December 2021; Accepted: 28 February 2022;
Published: 30 March 2022.
Edited by:
Nehal Mohsen Elsherbiny, Mansoura University, EgyptReviewed by:
Alsamman M. Alsamman, Mohammed VI Polytechnic University, MoroccoSergey Shityakov, ITMO University, Russia
Copyright © 2022 Diao, Wu, Yang, Liu, Xu, Jin, Wang, Zhang, Gao, Jin, Tian, Xu, Ou, Li, Xu and Lu. This is an open-access article distributed under the terms of the Creative Commons Attribution License (CC BY). The use, distribution or reproduction in other forums is permitted, provided the original author(s) and the copyright owner(s) are credited and that the original publication in this journal is cited, in accordance with accepted academic practice. No use, distribution or reproduction is permitted which does not comply with these terms.
*Correspondence: Lixia Lu, OTg3MzhAdG9uZ2ppLmVkdS5jbg==; Guotong Xu, Z3R4dUB0b25namkuZWR1LmNu; Ying Li, bGl5aW5nYmFuZzIwMTFAMTYzLmNvbQ==
†These authors have contributed equally to this work and share the first authorship
‡These authors have contributed equally to this work
 Meng Diao
 Yimu Wu
 Jialu Yang
 Caiying Liu2
 Juan Wang
 Furong Gao
 Haibin Tian
 Qingjian Ou
 Ying Li