
95% of researchers rate our articles as excellent or good
Learn more about the work of our research integrity team to safeguard the quality of each article we publish.
Find out more
ORIGINAL RESEARCH article
Front. Endocrinol. , 02 February 2022
Sec. Obesity
Volume 13 - 2022 | https://doi.org/10.3389/fendo.2022.830012
This article is part of the Research Topic Endocrine and Metabolic Consequences of Childhood Obesity View all 16 articles
 Dieter Furthner1,2†Christian-Heinz Anderwald2,3,4†Peter Bergsten5Anders Forslund6Joel Kullberg7Håkan Ahlström7
 Hannes Manell5Iris Ciba6Harald Mangge8Katharina Maruszczak2,9Pia Koren2,9Sebastian Schütz2,9
 Susanne Maria Brunner10Anna Maria Schneider2,9
 Daniel Weghuber2,9*
 Katharina Mörwald2,9
Background: Attenuated insulin-sensitivity (IS) is a central feature of pediatric non-alcoholic fatty liver disease (NAFLD). We recently developed a new index, single point insulin sensitivity estimator (SPISE), based on triglycerides, high-density-lipoprotein and body-mass-index (BMI), and validated by euglycemic-hyperinsulinemic clamp-test (EHCT) in adolescents. This study aims to assess the performance of SPISE as an estimation of hepatic insulin (in-)sensitivity. Our results introduce SPISE as a novel and inexpensive index of hepatic insulin resistance, superior to established indices in children and adolescents with obesity.
Materials and Methods: Ninety-nine pubertal subjects with obesity (13.5 ± 2.0 years, 59.6% males, overall mean BMI-SDS + 2.8 ± 0.6) were stratified by MRI (magnetic resonance imaging) into a NAFLD (>5% liver-fat-content; male n=41, female n=16) and non-NAFLD (≤5%; male n=18, female n=24) group. Obesity was defined according to WHO criteria (> 2 BMI-SDS). EHCT were used to determine IS in a subgroup (n=17). Receiver-operating-characteristic (ROC)-curve was performed for diagnostic ability of SPISE, HOMA-IR (homeostatic model assessment for insulin resistance), and HIRI (hepatic insulin resistance index), assuming null hypothesis of no difference in area-under-the-curve (AUC) at 0.5.
Results: SPISE was lower in NAFLD (male: 4.8 ± 1.2, female: 4.5 ± 1.1) than in non-NAFLD group (male 6.0 ± 1.6, female 5.6 ± 1.5; P< 0.05 {95% confidence interval [CI]: male NAFLD 4.5, 5.2; male non-NAFLD 5.2, 6.8; female NAFLD 4.0, 5.1, female non-NAFLD 5.0, 6.2}). In males, ROC-AUC was 0.71 for SPISE (P=0.006, 95% CI: 0.54, 0.87), 0.68 for HOMA-IR (P=0.038, 95% CI: 0.48, 0.88), and 0.50 for HIRI (P=0.543, 95% CI: 0.27, 0.74). In females, ROC-AUC was 0.74 for SPISE (P=0.006), 0.59 for HOMA-IR (P=0.214), and 0.68 for HIRI (P=0.072). The optimal cutoff-level for SPISE between NAFLD and non-NAFLD patients was 5.18 overall (Youden-index: 0.35; sensitivity 0.68%, specificity 0.67%).
Conclusion: SPISE is significantly lower in juvenile patients with obesity-associated NAFLD. Our results suggest that SPISE indicates hepatic IR in pediatric NAFLD patients with sensitivity and specificity superior to established indices of hepatic IR.
The prevalence of non-alcoholic fatty liver disease (NAFLD) in children and adolescents is on the rise, hence emerging as one of the crucial healthcare challenges of our time (1–3). A systematic review by Anderson et al. in 2015 reported a prevalence of up to 34% in juveniles with obesity, being more common in males (4).
NAFLD is regarded as the manifestation of the metabolic syndrome in liver (5–7). Although the causative pathophysiological background of NAFLD in pediatric patients still needs further investigation, NAFLD has repeatedly been linked to obesity and insulin resistance (IR) as well as other comorbidities in adults as well as juveniles (8–11). Fang et al. (9) described a “multiple-hit hypothesis” leading to NAFLD, in which fat accumulation and consequently systemic and specifically hepatic insulin resistance play a major role.
Up to date, various mathematically calculable indices of hepatic IR have been developed, among which some indices can be obtained from just a single fasting blood draw (such as the homeostatic assessment index, HOMA-IR), whereas for other indices multiple blood draws are required, possibly representing a more “dynamic” state (such as the Hepatic Insulin Resistance Index, HIRI) (11–18). Recently, Bedogni et al. developed fatty liver prediction models based on Body-Mass-Index (BMI) or waist circumference, alanine aminotransferase, Homeostatic Model Assessment, triglycerides and uric acid to diagnose fatty liver in children with obesity (19). Previously, we developed a simple and inexpensive index, called the “Single Point Insulin Sensitivity Estimator” (SPISE), validated against the gold standard for assessing insulin sensitivity, the hyperinsulinemic-euglycemic clamp test (17), in an adult as well as in a juvenile cohort (20). This index consists of anthropometric as well as laboratory parameters, which enables clinicians to easily diagnose insulin resistance in pediatric patients, whose care calls for non-invasive and broadly accessible tools.
Based upon these considerations, the current study aimed to compare the performance of SPISE to established indices of hepatic IR in pediatric NAFLD-patients with obesity.
Patients (n = 99) were recruited in an obesity specialist clinic in Salzburg (Austria) as part of the BETA JUDO study (BETA cell function in JUvenile Diabetes and Obesity, FP7-HEALTH-2011-two-stage, project number: 279153). Inclusion criteria were age 10-18 years and overweight or obesity according to the WHO criteria (BMI-SDS > 1). Written informed consent was obtained by all caregivers if patients were under the age of 18 years. Exclusion criteria were lack of consent or any chronic liver disease (such as hepatitis B and C). Patients did not report any alcohol intake. Height and bodymass were assessed by means of a standardized, calibrated scale (Seca, Hamburg, Germany). BMI and BMI-SDS were calculated according to the WHO 2006-2007 reference population (21). Waist circumference (cm), hip circumference (cm) and neck circumference (cm) were measured using a flexible tape. Blood pressure was measured twice, using a standardized clinical aneroid sphygmomanometer (Philips patient monitor MP30, Amsterdam, The Netherlands), and the mean value was recorded. Puberty staging was done according to Tanner (by a physician) and all subjects included into this study were staged as pubertal (Tanner II-IV).
After an overnight fast, all patients underwent a standardized oral glucose tolerance test (OGTT, 1.75 g glucose/kg body mass) over 180 minutes as previously described (22, 23). OGTT was performed according to standard procedures by setting an intravenous line in an antecubital vein and subsequent blood draws were performed via this line at nine different time points after glucose challenge.
Uric acid, triglycerides, HDL cholesterol, total cholesterol and liver transaminases were measured using an enzymatic photometric test (Modular Analytics System, P-Modul 917, Roche Diagnostics, Vienna, Austria). The evaluation of LDL cholesterol also required an enzymatic photometric test using Integra Manual by Roche Diagnostics. Apolipoprotein (A2) and apolipoprotein (B) as well as high-sensitive CRP were examined by an immunologic turbidimetric test (COBAS- Integra, Roche Diagnostics, Vienna, Austria) and interleukin 6 by an enzyme-linked immunosorbent assay (Modular Analytics System, E-Modul by Roche Diagnostics). Leptin and adiponectin were determined manually using ELISA (Human Leptin ELISA, Biovendor, Brno, Czech Republic; Quantikine ELISA, Human Total Adiponectin/Acrp30 Immunoassay, R&D Systems, Inc., Minneapolis, MN, USA). HbA1c was measured by reversed-phase chromatography and lipoprotein (a) by a turbidimetric test (COBAS- Integra, Roche Diagnostics, Vienna, Austria). Samples underwent immediate centrifugation at 2500g for 10 minutes at 4°C, subsequently aliquoted and frozen at -80°C. Plasma was consecutively used for analyses of insulin, proinsulin and C-peptide in the central lab in Uppsala. Single-plex ELISA-kits for each analyte were used (Mercodia AB®, Uppsala, Sweden).
Euglycemic-hyperinsulinemic clamp tests were used to determine insulin sensitivity within an interval of maximally 3 to 4 weeks after the OGTT and after an overnight fast. The euglycemic clamp glucose target was calculated as the mean value of 3 fasting plasma glucose measurements. The glucose clamp target was set to 80 mg/dL (4.44 mmol/L) in case of a value above 80 mg/dL, and in case of a value above 100 mg/dL (5.55 mmol/L) the clamp goal was 100 mg/dL. Clamp tests were performed for 120 min, with primed-continuous regular insulin infusion [40 mU insulin * min-1 * (m2 total body surface area)-1]. Blood samples for the determination of serum insulin and C-peptide were drawn at 0 and 120 minutes and the glucose disposal rate (M-value; milligrams per kilogram per minute) was calculated (20, 24–26).
MRI-examinations were performed to determine liver fat content (LFC) and volumes of abdominal visceral adipose tissue (VAT) and subcutaneous adipose tissue (SAT) as previously described (23). All exams were performed using 1.5T clinical MRI-systems from Philips Medical System (Amsterdam, The Netherlands) after a light meal and in close proximity to the OGTT. Water-fat imaging techniques were used throughout. The scans were done over 16 cm along the craniocaudal axis and centered on the L1 vertebra. The adipose tissue volumes were determined using a fully automated segmentation method that uses a filtering technique to separate VAT from SAT. Liver fat image reconstruction was done by a multi-resolution version of a method that employs a whole-image optimization approach (27). A single operator trained by an experienced radiologist performed the measurements by manual segmentation in the axial slices of the water images using the software ImageJ (version 1.42q, http://rsbweb.nih.gov/ij/).
Patients with NAFLD had a liver fat content >5%, as measured by MRI. This has previously been described and a close relation between histopathological changes and liver fat fraction in MR-imaging has been promoted by various groups (28–34).
Hepatic insulin resistance was analyzed using Homeostatic Model Assessment or HOMA-IR [22.5/fasting insulin * fasting glucose], the Single Point Insulin Sensitivity Estimator or SPISE [600 * HDL-cholesterol0,185/(Triglycerides0,2 × BMI1,338)], and the Hepatic Insulin Resistance Index [(Glucose AUC0–30) x (Insulin AUC0–30)] (11–18, 20).
Descriptive data analysis showed results with mean and standard deviation for continuous variables and number and percentages for categorical variables. Pearson correlation was calculated to show linear dependencies. Receiver operating characteristic (ROC) curves were calculated showing sensitivity (true positive rate) and 1 – specificity (false positive rate) for each threshold of the indicator variable. Graphical representation was combined with area under the curve (AUC) as numerical measure indicating the classification quality. AUC was calculated using trapezoidal rule. The null hypothesis H0: AUC = 0.5 (indicating random classification) was tested using the Wilcoxon Mann Whitney test (H1: AUC > 0.5). Cutoff levels for SPISE were obtained using the maximum of the Youden index (= sensitivity + specificity – 1) (35). All results are presented along with 95%- confidence intervals. Significance was assumed at p<0.05. Due to exploratory analysis, p-values are not corrected for multiple testing. All calculations were done with R (The R Project, Version 3.6.0, Linz, Austria).
A total of 99 patients with obesity were included into this study (male: 59.4%, female: 40.4%). The age of patients was 13.5 ± 2.0 years. Further group characteristics on anthropometric and biochemical parameters are shown in Table 1.
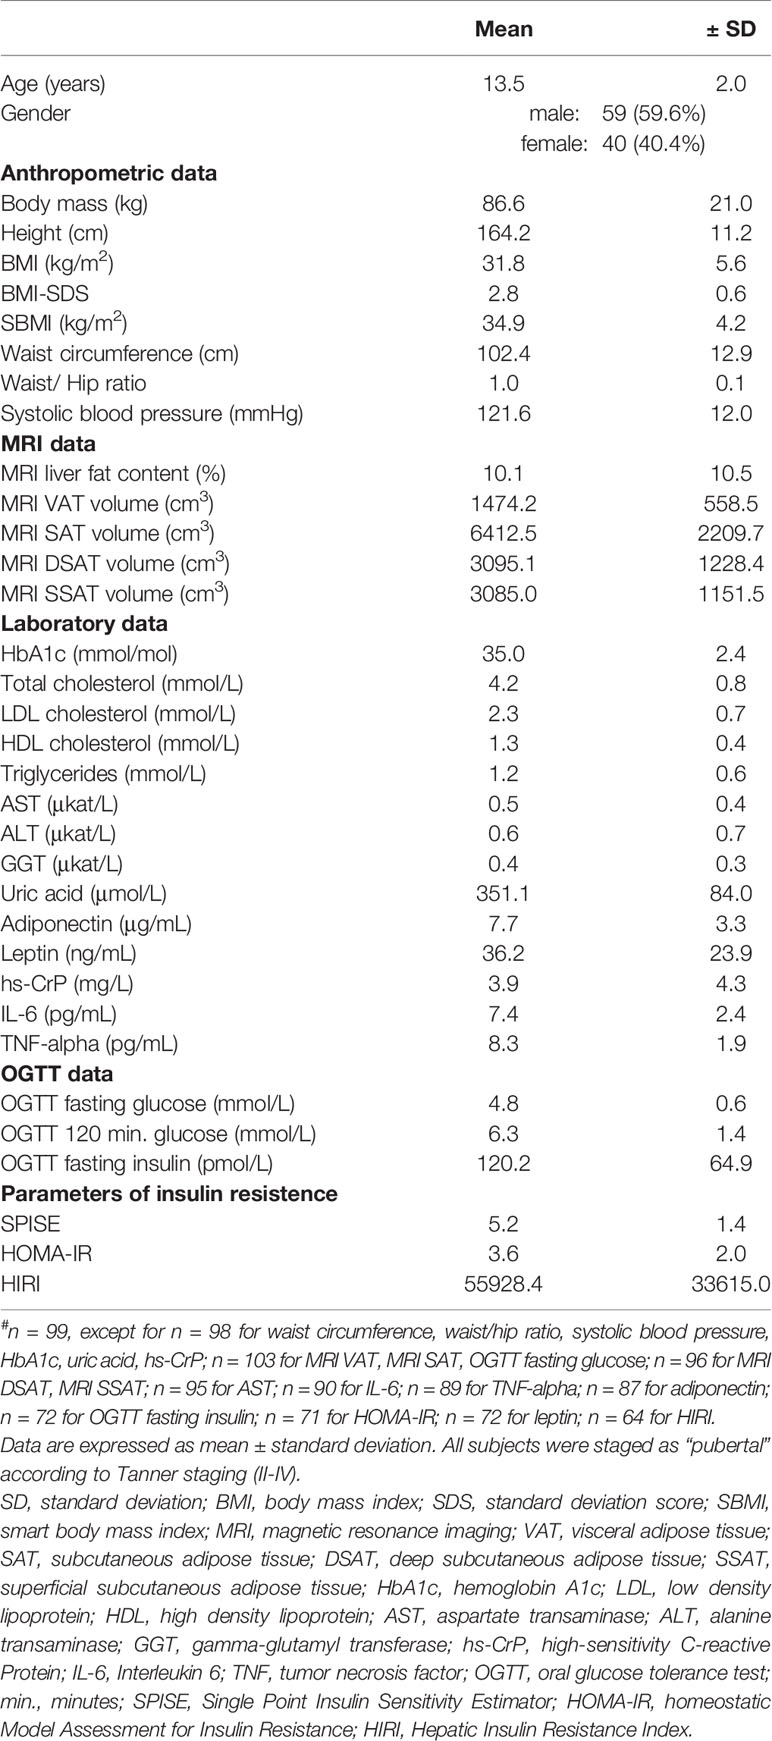
Table 1 Descriptive data of all patients (n = 99#).
Patients were further categorized into the ones with and the ones without NAFLD, as defined by MRI-measured liver fat content. They were separated into male and female groups with 41 male and 16 female NAFLD patients as well as 18 male and 24 female non-NAFLD patients. Ages ranged between 12.7 ± 2.2 and 14.3 ± 2.4 years respectively (details see Table 2). Liver fat content was highest in the male NAFLD group (15.9 ± 11.9% {confidence interval [CI]: 12.1 - 19.6%}) in comparison to all non-NAFLD patients (male non-NAFLD 3.0 ± 1.0%, P<0.001 {95% confidence interval [CI]: 2.5, 3.5%}; female non-NAFLD 3.1 ± 0.9%, P<0.001 {95% confidence interval [CI]: 2.7, 3.4%}). Liver fat content in female NAFLD patients was 13.5 ± 9.7% (P<0.600 {95% confidence interval [CI]: 8.3, 18.7%}). Further details of anthropometric and biochemical parameters are shown in Table 2. SPISE was lower in NAFLD (male: 4.8 ± 1.2, female: 4.5 ± 1.1) than in non-NAFLD group (male 6.0 ± 1.6, female 5.6 ± 1.5; P< 0.05 {95% confidence interval [CI]: male NAFLD 4.5, 5.2; male non-NAFLD 5.2, 6.8; female NAFLD 4.0, 5.1; female non-NAFLD 5.0, 6.2}).
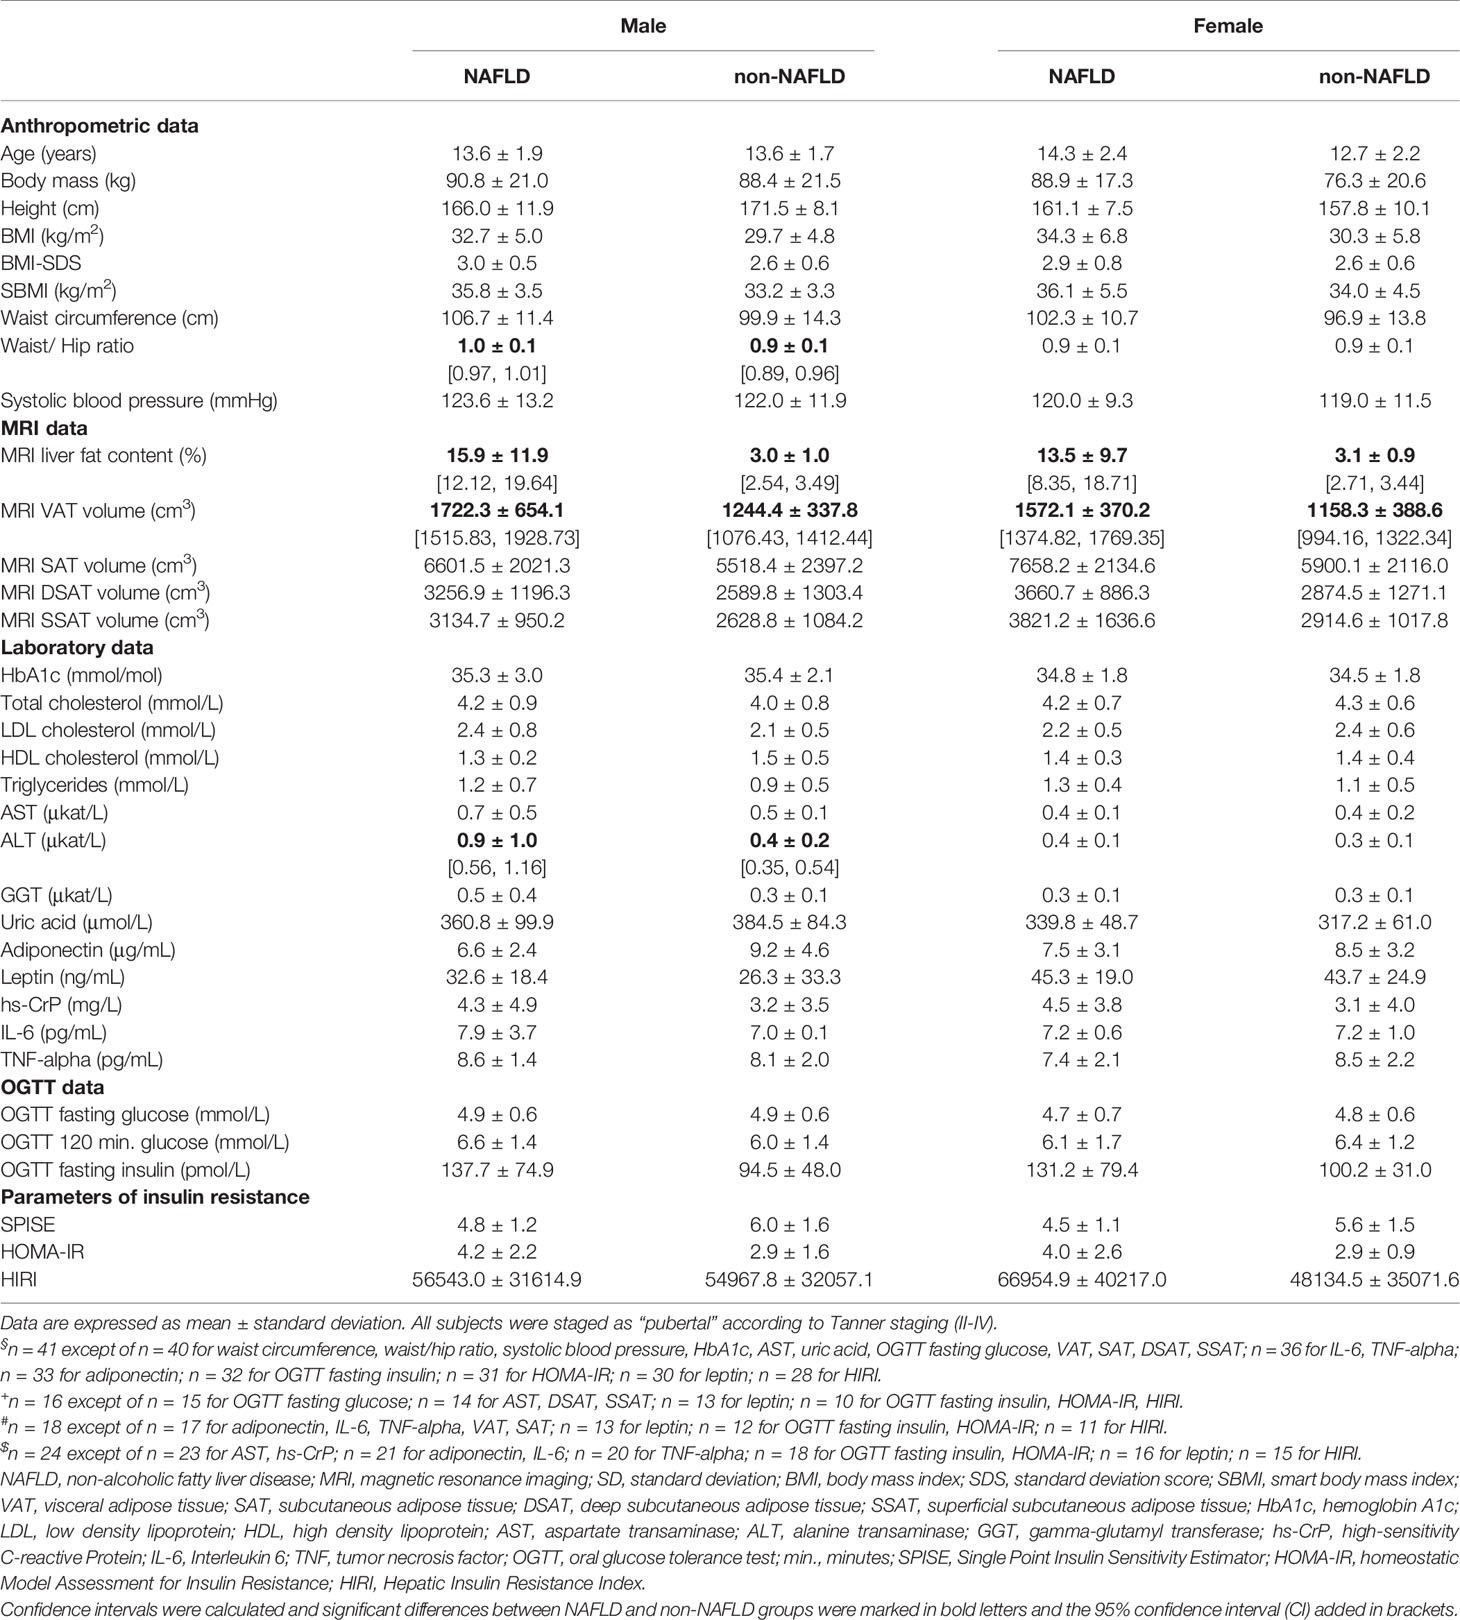
Table 2 Descriptive data of NAFLD (male n = 41§, female n = 16+) and non-NAFLD patients (male n = 18#, female n = 24$). NAFLD was defined as liver fat content > 5% according to MRI).
In a subgroup analysis in Table 3, considering NAFLD according to grade of steatosis as measured via MRI, SPISE was significantly lower in patients with higher NAFLD grades respectively more steatosis (non-NAFLD compared to NAFLD grades 1-4: P<0.001). Figure 1 compared the performance of SPISE, HOMA-IR and HIRI in different steatosis grades. SPISE as well as HOMA-IR and HIRI were not significantly different in higher steatosis grades (2-4).
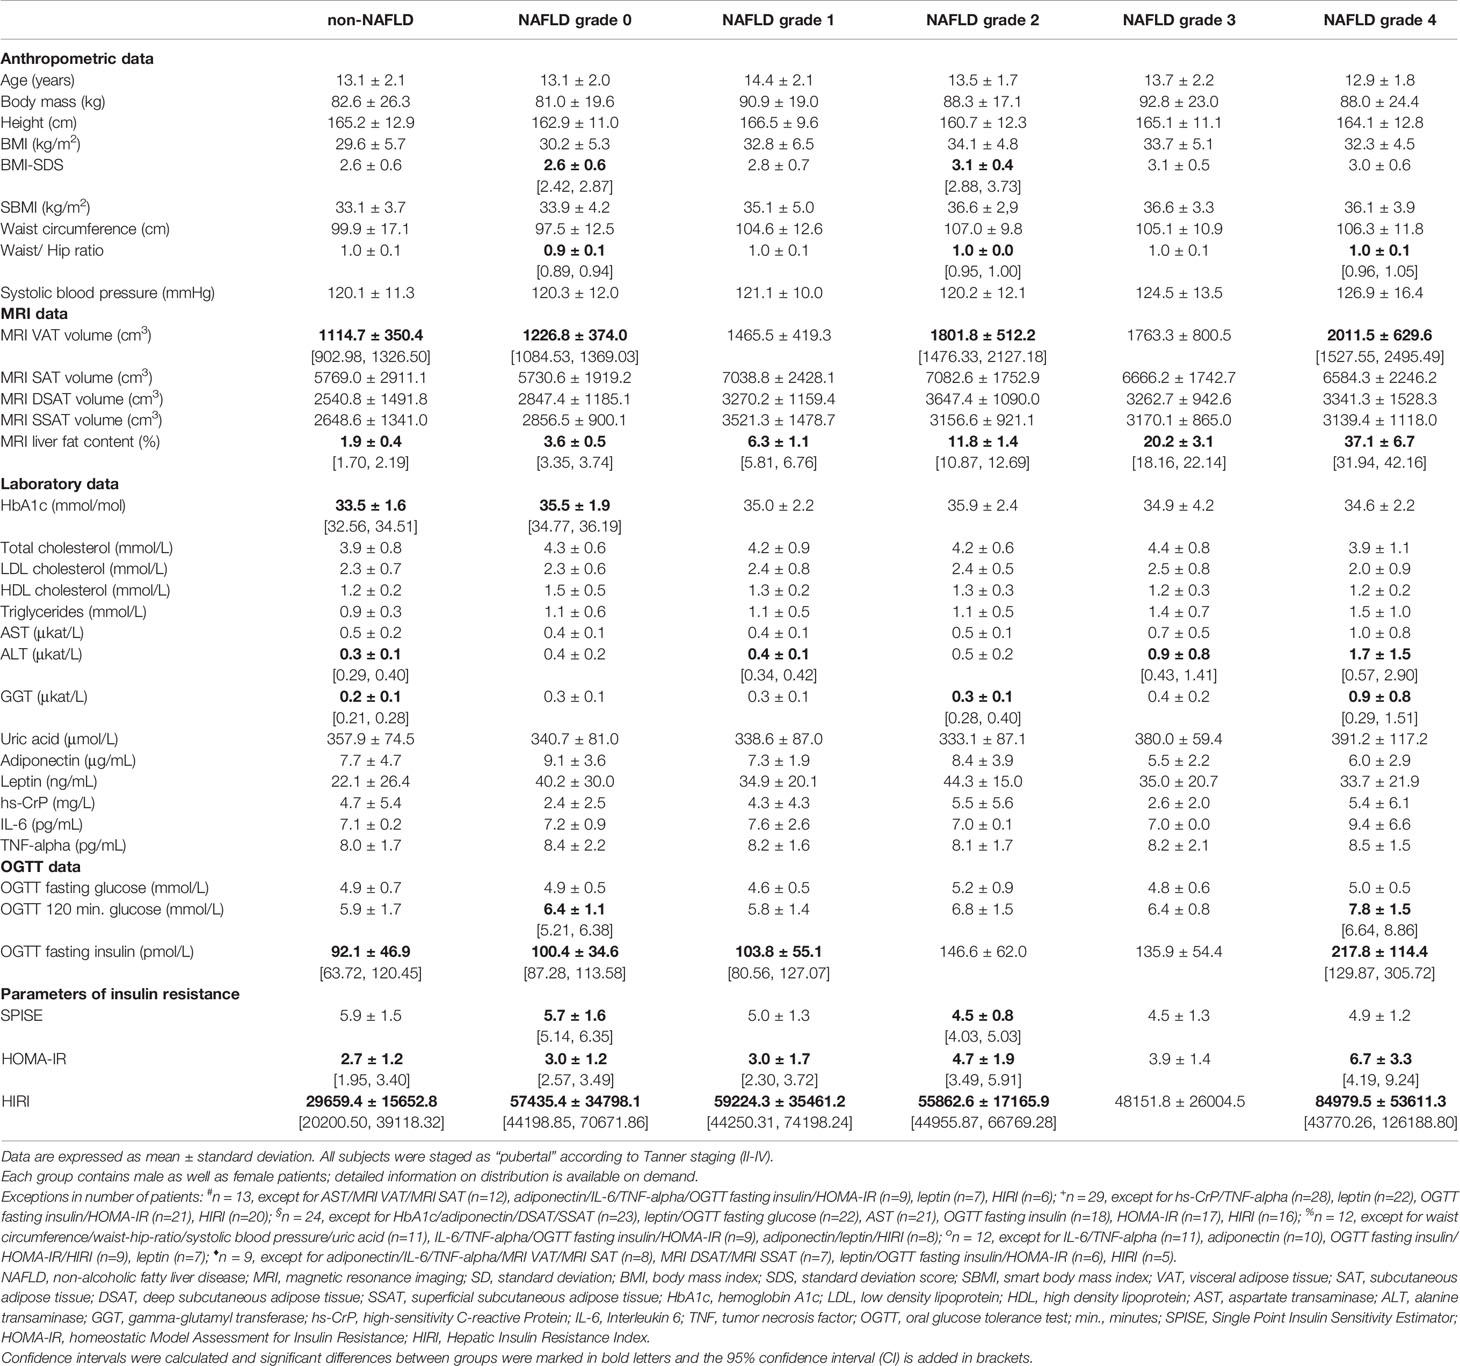
Table 3 Descriptive data of NAFLD and non-NAFLD subjects according to grades of steatosis: non-NAFLD#: liver fat content (LFC) < 2.6%; grade 0+: LFC 2.6 - ≤5%; grade 1§: LFC >5 - ≤9.2%; grade 2%: LFC >9.2 - ≤15.1%; grade 3 o: LFC >15.1 - ≤26.8%; grade 4♦: LFC >26.8%. Non-NAFLD in this study was defined as a LFC ≤5%, therefore it comprises of following groups in the table: non-NAFLD and NAFLD grade 0.
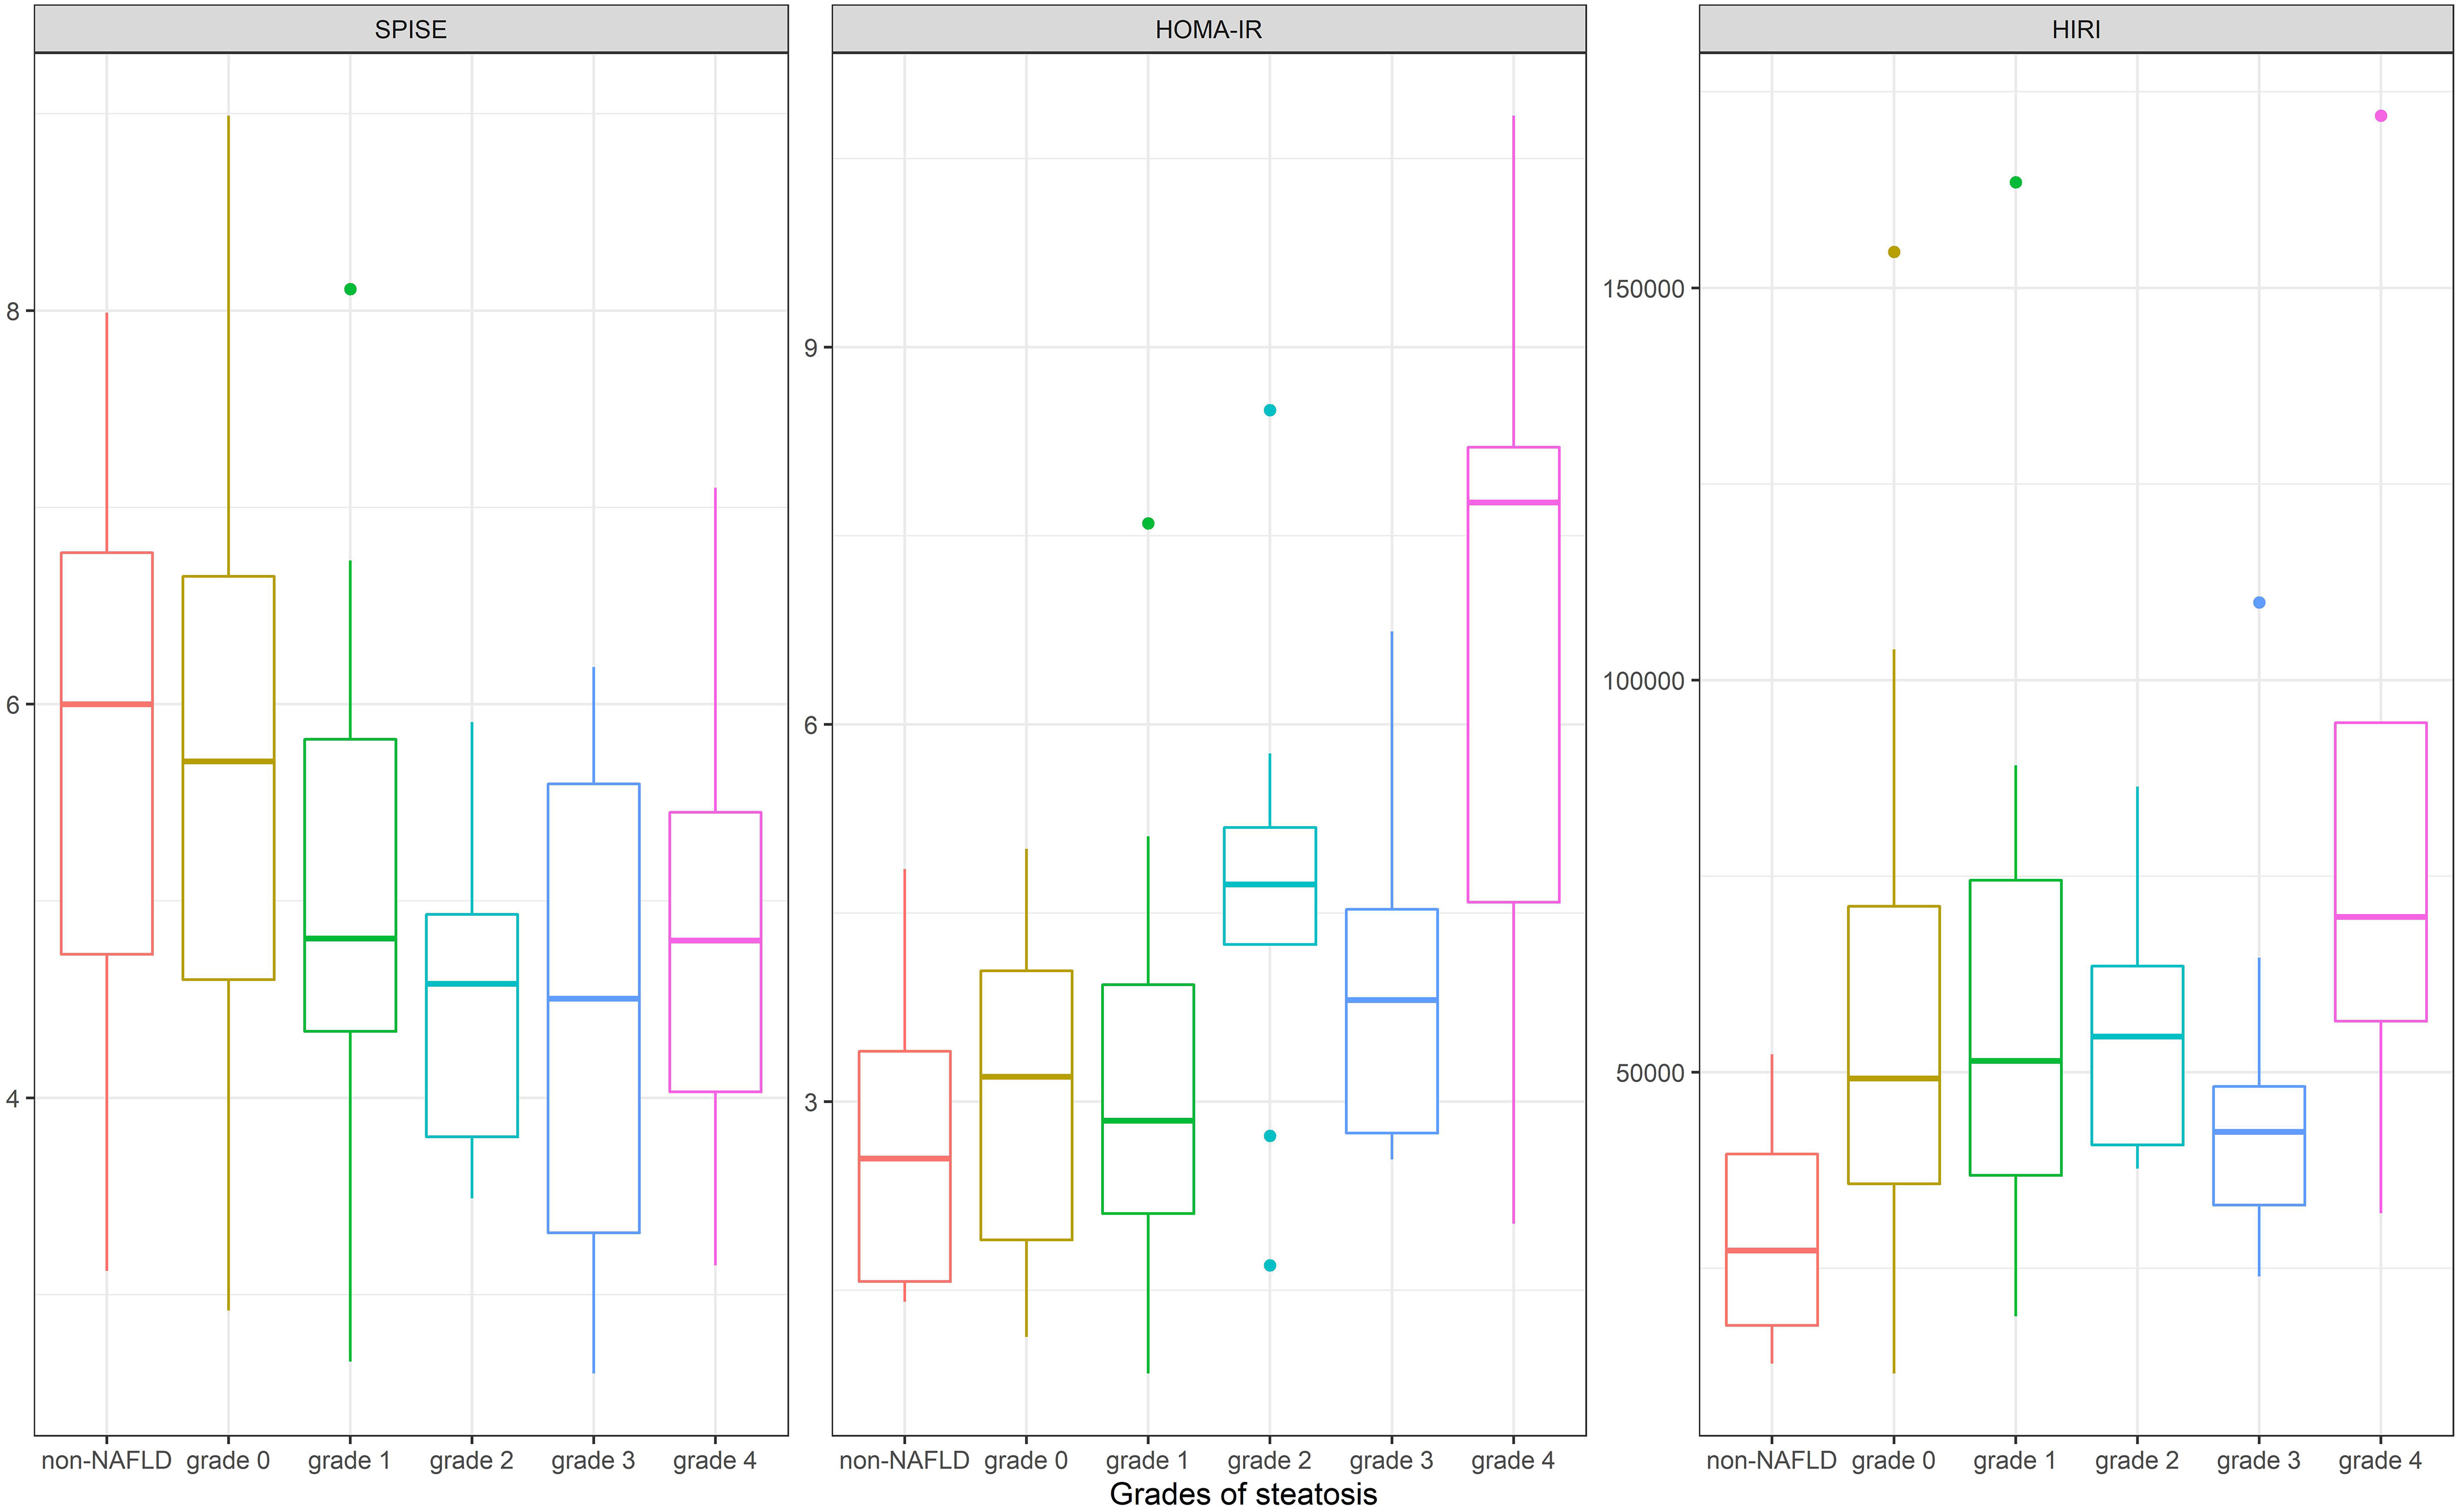
Figure 1 Comparison of the performance of SPISE, HOMA-IR and HIRI according to different steatosis grades [non-NAFLD: liver fat content (LFC) < 2.6%; grade 0: LFC 2.6 - ≤5%; grade 1: LFC >5 - ≤9.2%; grade 2: LFC >9.2 - ≤15.1%; grade 3 : LFC >15.1 - ≤26.8%; grade 4: LFC >26.8%]. SPISE, Single Point Insulin Sensitivity Estimator; HOMA-IR, homeostatic Model Assessment for Insulin Resistance; HIRI, Hepatic Insulin Resistence Index; NAFLD, Non-alcoholic fatty liver disease; LFC, Liver fat content.
We performed hyperinsulinemic clamp tests (n=17) and used calculated M-values as excepted means to estimate insulin sensitivity. As shown in Table 4, the correlation of M-values and SPISE (r = 0.49) is significantly greater than between M-values and HOMA-IR (r = 0.11) or, respectively, HIRI (r = -0.32).
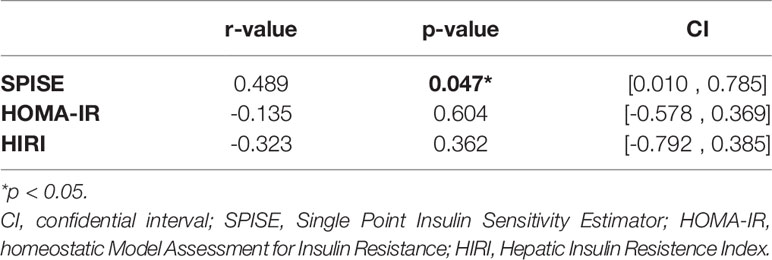
Table 4 Pearson correlation coefficients (r) for the relation of M-value (100-120 min.) as derived from euglycemic clamp method and hepatic insulin resistance indices (n = 17).
Finally, we analyzed ROC-curves in male as well as female patients for SPISE, HOMA-IR, and HIRI (Figures 2, 3). In male patients, ROC-curve showed AUC of 0.71 for SPISE (P=0.006, 95% CI: 0.54, 0.87), 0.68 for HOMA-IR (P=0.038, 95% CI: 0.48, 0.88), and 0.50 for HIRI (P=0.543, 95% CI: 0.27, 0.74). In female patients, ROC-AUC was 0.74 for SPISE (P=0.006, 95% CI: 0.58, 0.90), 0.59 for HOMA-IR (P=0.214, 95% CI: 0.32, 0.87), and 0.68 for HIRI (P=0.072, 95% CI: 0.46, 0.90). SPISE seemed to perform better in female patients compared to males (0.74 vs. 0.71 in males), but when comparing ROC-curves the difference was not significant (p=0.814).
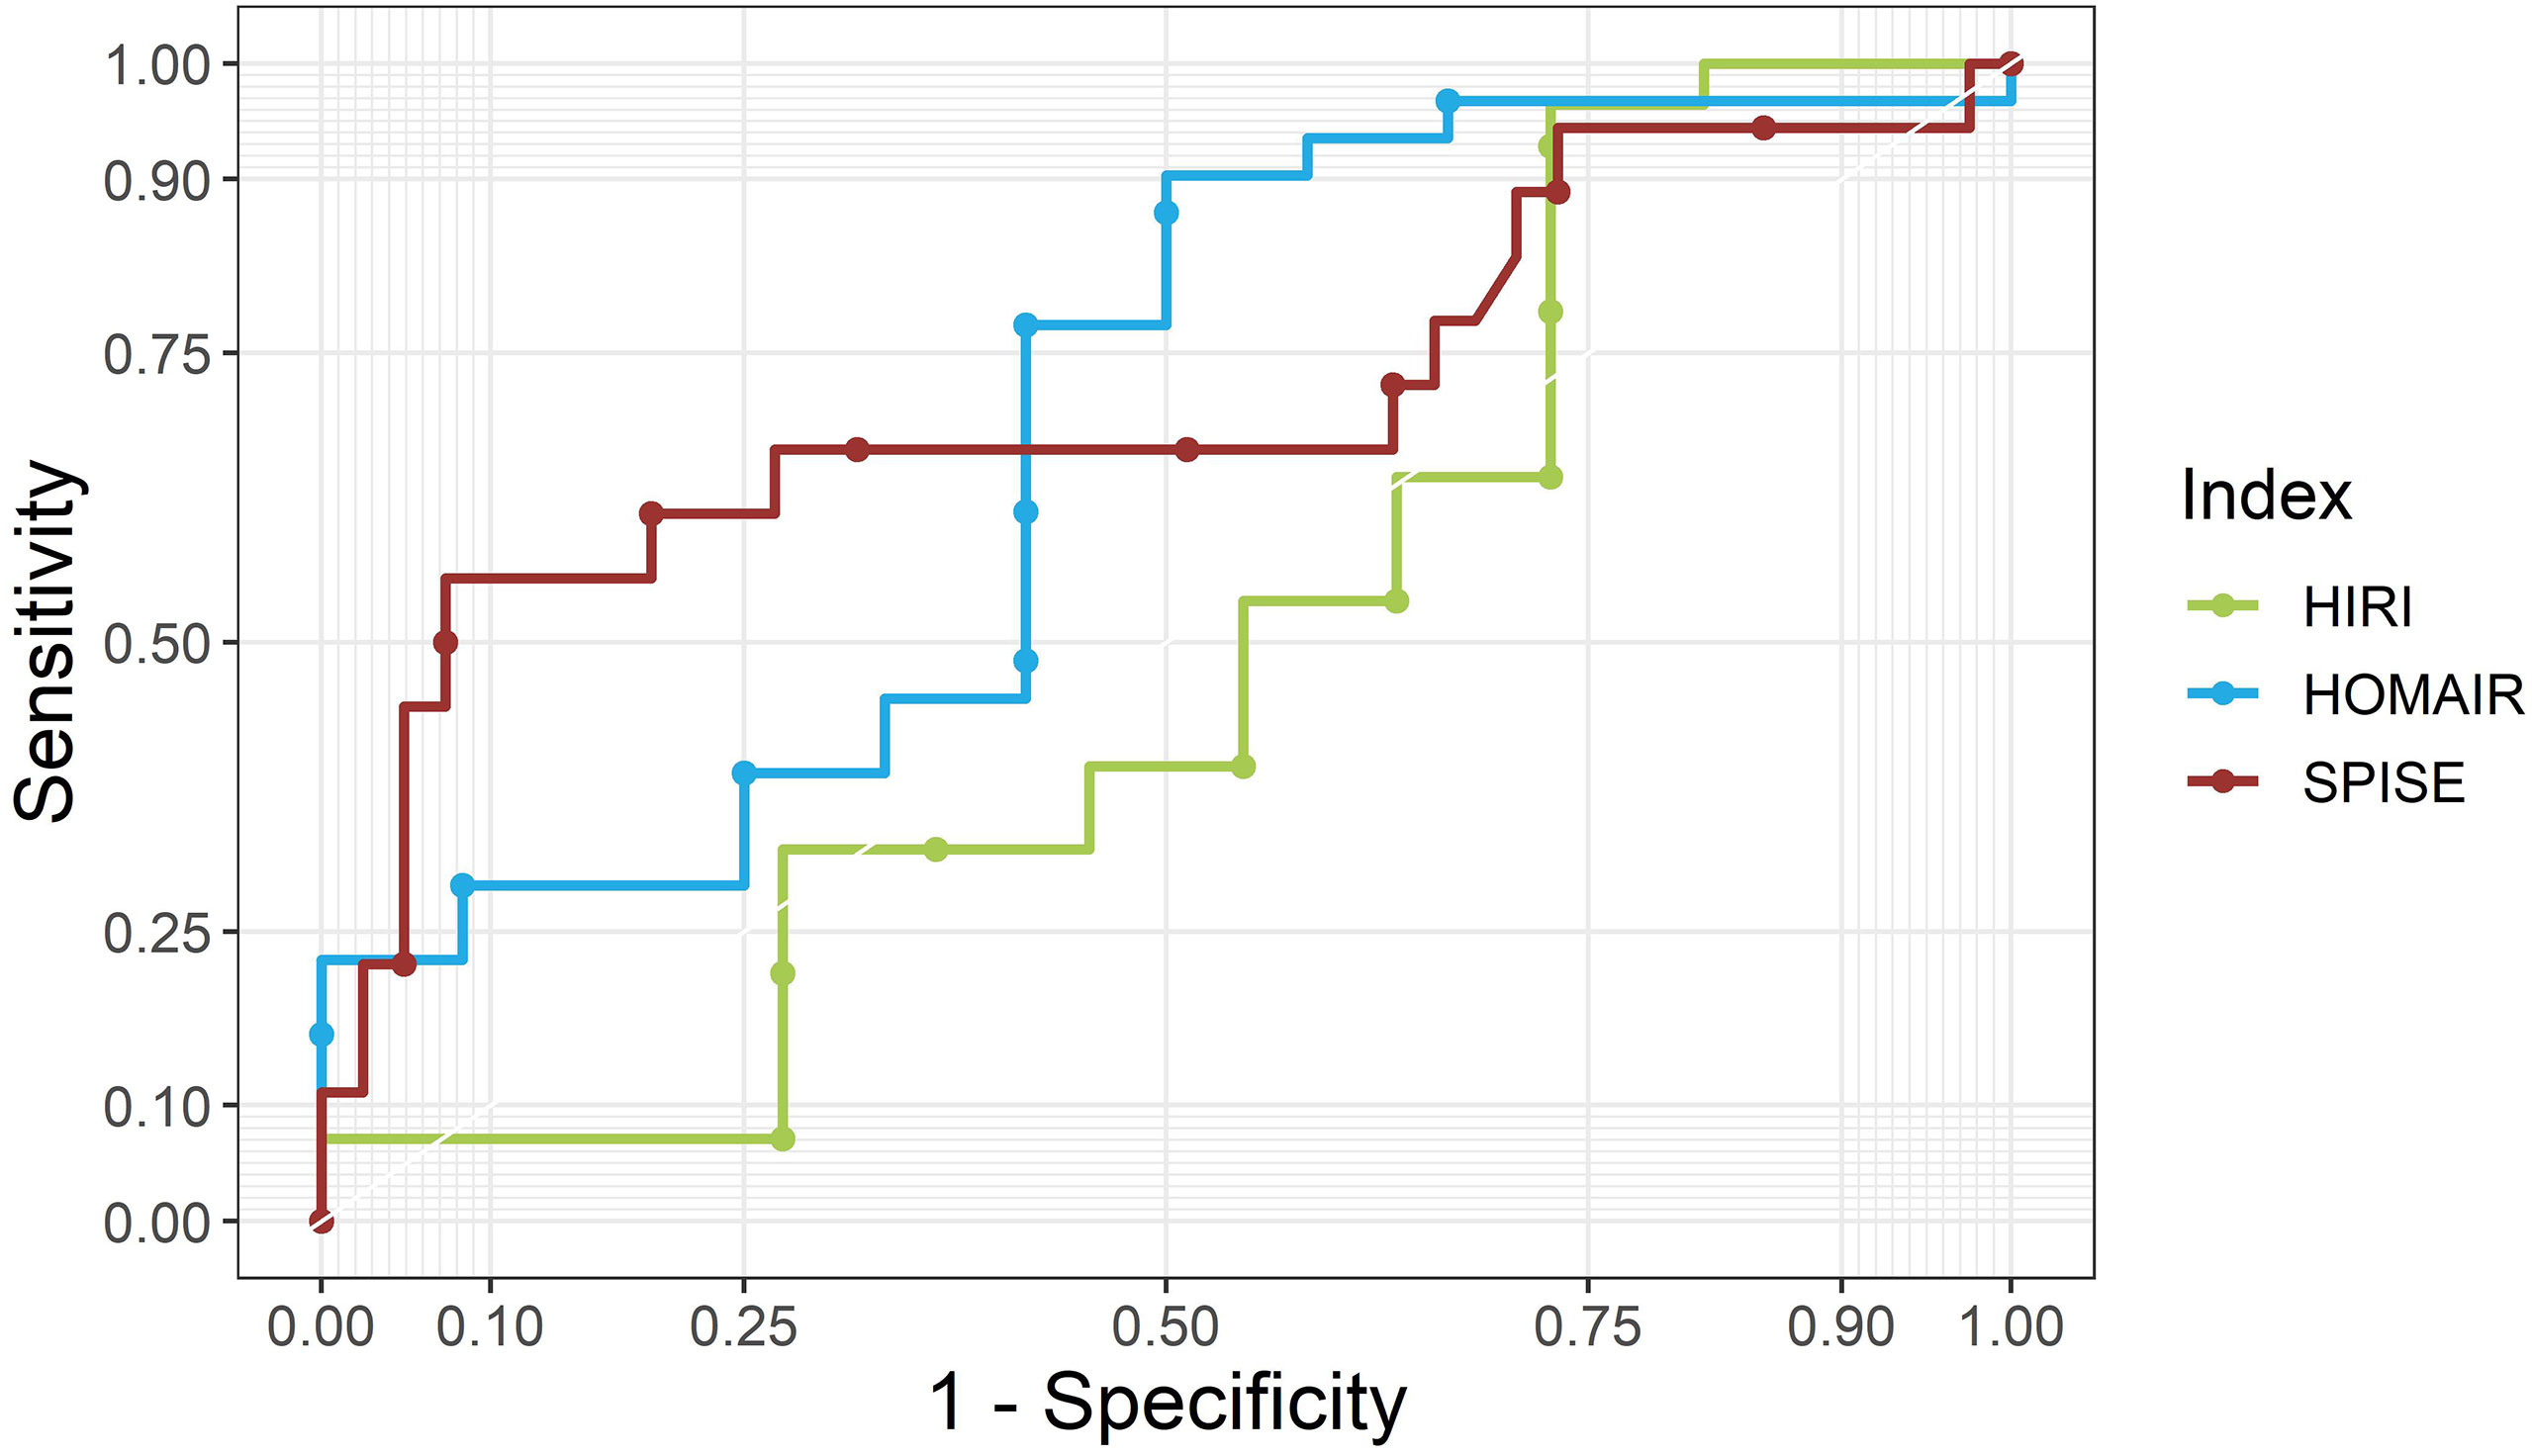
Figure 2 ROC curves for SPISE, HOMA-IR and HIRI for male patients. SPISE, Single Point Insulin Sensitivity Estimator; HOMA-IR, homeostatic Model Assessment for Insulin Resistance; HIRI, Hepatic Insulin Resistence Index.
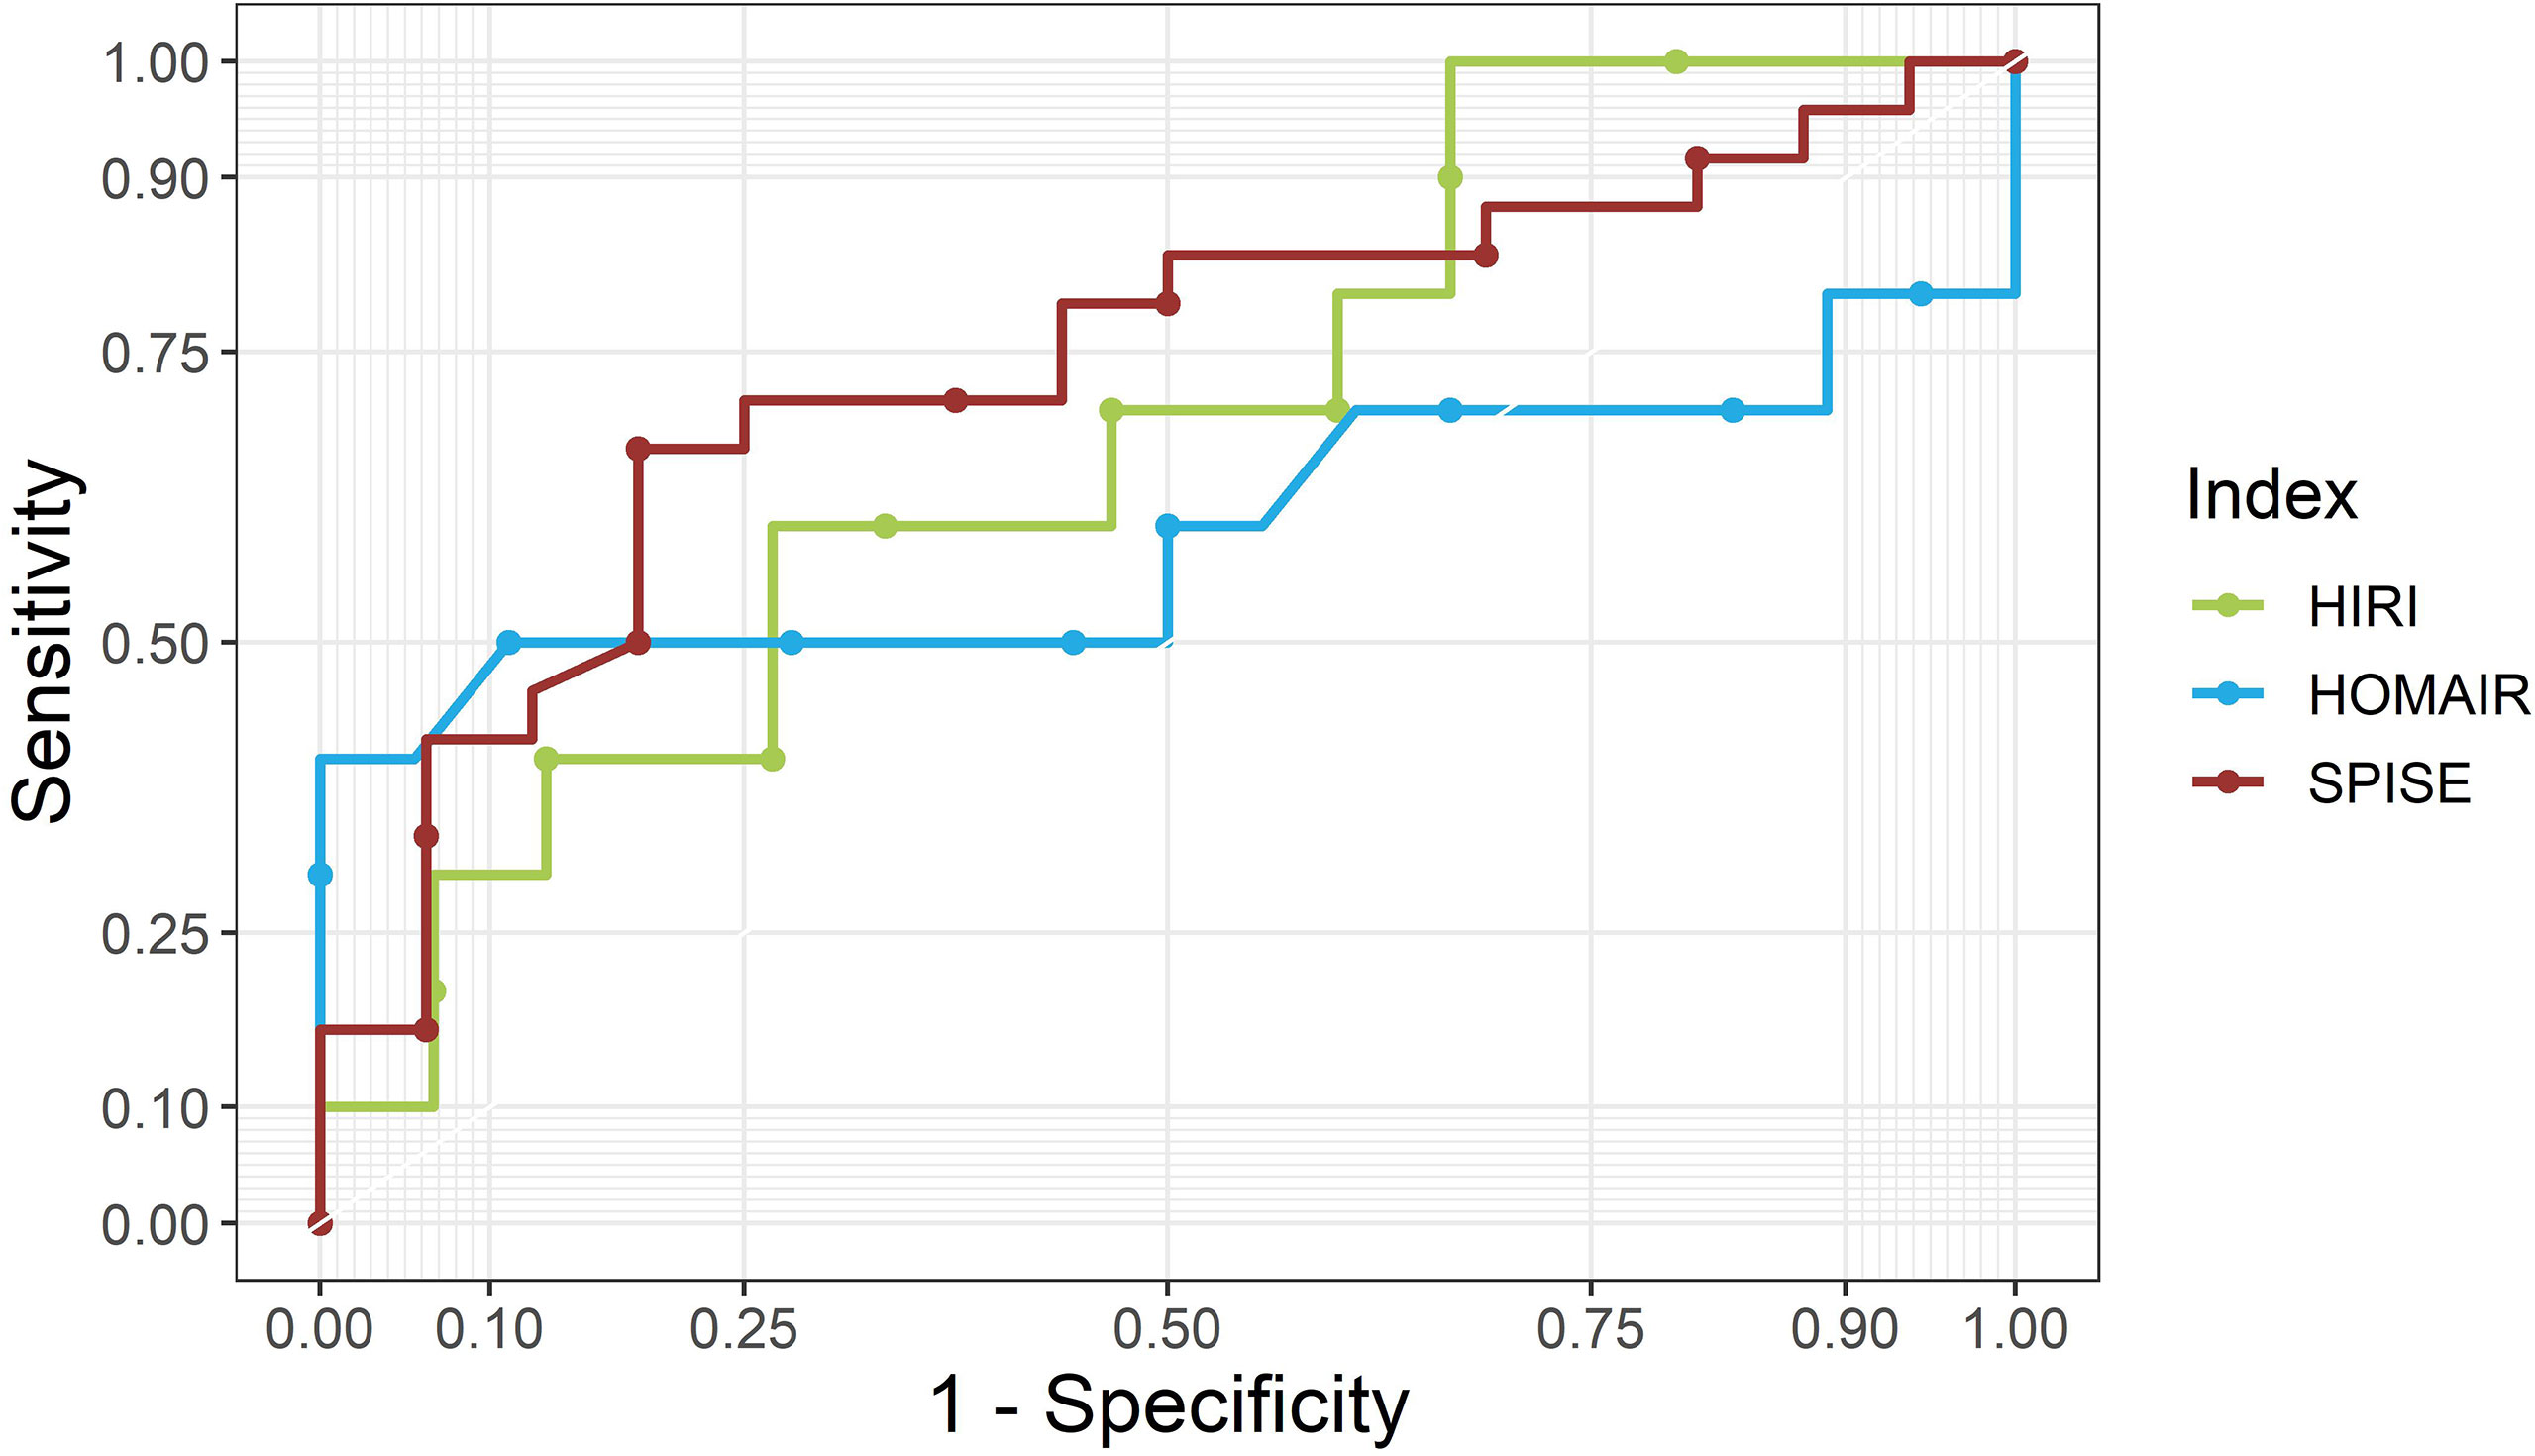
Figure 3 ROC curves for SPISE, HOMA-IR and HIRI for female patients. SPISE, Single Point Insulin Sensitivity Estimator; HOMA-IR, homeostatic Model Assessment for Insulin Resistance; HIRI, Hepatic Insulin Resistence Index.
The optimal cutoff level for SPISE between NAFLD and non-NAFLD patients was 5.18 overall (Youden index: 0.35; sensitivity 0.68%, specificity 0.67%). When looking at different NAFLD grades, as shown in Table 3, the optimal cutoff level was described as following: SPISE > 5.18 between non-NAFLD and NAFLD grades 1-2 (Youden index: 0.36; sensitivity 0.69%, specificity 0.67%), SPISE > 5.79 between non-NAFLD and NAFLD grades 3-4 (Youden index: 0.38; sensitivity 0.86%, specificity 0.52%) respectively.
The current study aimed to compare the performance of SPISE as an estimation of hepatic impaired insulin sensitivity in children and adolescents with obesity. The main finding of this study is that SPISE indicates hepatic IR in pediatric patients with sensitivity and specificity superior as compared to established indices of hepatic IR.
Childhood obesity and its comorbidities show a rising prevalence worldwide (1, 2), implicating that an early identification of these diseases is of utmost importance in order to achieve better patient outcomes. Among these comorbidities, NAFLD has been associated with a metabolic deterioration as early as during childhood (8–10). NAFLD predictive risk factors in childhood were demonstrated to include increased waist circumference, elevated waist-to-hip ratio, elevated total cholesterol, triglycerides, fasting insulin, HOMA-IR as well as elevated glucose and insulin concentration in an OGTT (36). Previously, the best independent predictive risk factor for diagnosing NAFLD in non-diabetic children with obesity was suggested to be fasting insulin >18.9 μIU/ml (36). However, fasting insulin and HOMA-IR levels vary considerably depending on the type of insulin assay (37, 38). Hence, multiple surrogate markers of IR have formerly emerged (20, 39, 40).
Among these, the SPISE was developed as an easy and affordable tool for the evaluation of whole-body insulin sensitivity, which is comparable to clamp-derived M-value in sensitivity as well as specificity (19). Several studies have evaluated the SPISE in adult as well as juvenile populations (20, 41–46). Correa-Burrows et al. assessed SPISE for its validity in diagnosing cardiometabolic risks, namely IR and metabolic syndrome, in post-pubertal Hispanic adolescents. SPISE was found to be accurate for the prediction of IR in both groups, with cutoff values of 5.0 (males) and 6.0 (females) indicating IR (41). Similarly, a cutoff value of 5.82 for prediction of IR in metabolic syndrome was determined by Dudi et al. in a north Indian adult population. SPISE was thereby shown to discriminate well between cases and controls (42). More recently, a study analysed data from 909 Italian children with overweight and obesity and normal weight controls undergoing metabolic evaluations. Two-hundred children who were overweight or obese were assessed longitudinally for on average of 6.5 years (range 3.5-10). At follow-up, lower basal SPISE strongly predicted the development of abnormal glucose metabolism (AUROC curve: 0.83 [0.72-0.94] regardless of age, sex, fasting/120 mins glucose and insulin at baseline (46). Of interest, SPISE-IR (=10/SPISE) was also a predictor of coronary heart disease and type 2 diabetes in a group of elderly Swedish men (44).
To the best of our knowledge, SPISE has so far not been assessed in children and adolescents with NAFLD. Our results are perfectly in line with data from the Yale Pediatric NAFLD cohort showing that intrahepatic lipid accumulation is associated with reduced insulin clearance and hepatic insulin sensitivity in youths with obesity, irrespective of their ethnic background (11).
Insulin resistance was shown to be indicative of histological severity of liver disease in adults with obesity (47, 48). Additionally, HOMA-IR was an independent predictor of advanced liver fibrosis in nondiabetic Japanese adults with NAFLD (49). Recently, Bedogni et al. developed two multivariable models, using single anthropometric as well as laboratory parameters (BMI or waist circumference, ALT, HOMA-IR, triglycerides and uric acid) (19). Both models were demonstrated to identify fatty liver, as diagnosed via ultrasonography (19). However, SPISE may offer an easier and therefore more accessible identification of patients with hepatic insulin resistance. Additionally, a radiologic diagnosis via MRI allowed us a much more accurate assessment of liver fat content compared to ultrasonography (28–34, 50).
As described before, SPISE is based on BMI, fasting HDL-cholesterol and triglyceride levels. Hepatic lipid accumulation is closely related to the development of IR (51). Elevated ceramide concentrations, together with their significant correlation with IR parameters in pediatric patients with obesity, were suggested to be associated with molecular pathways involved in insulin signaling impairment strongly linked to the pathogenesis of NAFLD (52). In addition, hepatic expression of genes associated with IR may drive NAFLD development and progression. Thus, genes which can promote intrahepatic fat accumulation, dysregulation of the lipid metabolism, lipotoxicity, and activation of cell survival pathways including activation of cell proliferation and differentiation pathways, were shown to allow classification of adult NASH (Nonalcoholic steatohepatitis)-with-fibrosis patients separately from mild-NAFL (nonalcoholic fatty liver) and NASH patients (53). In agreement with this, TG/HDL-C (triglyceride/HDL-cholesterol) ratio was reported to be useful to identify children and adolescents at high risk of NAFLD (54). This is also in accordance with data demonstrating that the fasting triglyceride-to glucose index was linked to increasing severity of hepatic steatosis and the presence of liver fibrosis in adults with NAFLD and more closely related to NAFLD and liver fibrosis compared to HOMA-IR after adjustment for confounding factors (55).
NAFLD is an exclusion diagnosis and can progress (NASH and fibrosis) if undiagnosed and untreated. A uniform international consent for screening for NAFLD in juvenile obesity does not exist. AASLD Guidance does not recommend screening for NAFLD in children with obesity due to “paucity of evidence” (56). In contrast, NASPGHAN advocates screening by alanine aminotransferase (ALT), but does not recommend ultrasound (US) due to low sensitivity in all children with overweight and obesity and additional risk factors at age 9-11 years (50). Both methods combined seem favorable as ALT might be normal or slightly elevated and US sensitivity diminishes in children where hepatic fat accumulation remains below 30% (57). Up to now, the gold standard in diagnosing fibrosis is liver biopsy, which nevertheless resembles an invasive, complex and time-consuming method (58). Several studies have analyzed non-invasive markers of liver steatosis and fibrosis in order to bypass this method. Kulkarni et al. identified a model of several non-invasive parameters that could predict NAFLD induced fibrosis (59). Above all, it seems that a combination of anthropometric, laboratory as well as radiologic methods might improve the practicability and exactitude of diagnosing NAFLD induced fibrosis in pediatric obesity (60, 61).
A major strength of this study was the inclusion of both MRI and clamp data in a pediatric cohort. The lack of histological data does not allow us to discriminate between simple steatosis and differing degrees of fibrosis. However, Schwimmer et al. showed a positive correlation between MRI-estimated liver proton density fat fraction and steatosis grades by liver histology (34), which underscores the need to identify patients more readily in clinical practice. In addition, we do not have detailed information on the distribution of ethnicities in our collective, although the majority of our patients is white. This might be important, as differences in IR between ethnicities have been described repeatedly (62, 63). Further, due to its cross-sectional design, our data do not allow us to draw any conclusions on the performance of the SPISE in the evolution of NAFLD longitudinally. However, in order to increase the homogeneity of our cohort, we included data of pubertal patients only (Tanner stages II-IV) and employed robust techniques to assess liver fat content and IR. Due to a limited sample size further studies will be needed in order to validate our findings in larger pediatric cohorts. This would allow more detailed analyses of SPISE cutoffs in children with different pubertal stages and degrees of obesity.
In conclusion, in a clinical setting the early diagnosis of NAFLD is of utmost importance, since its progression to fibrosis has substantial impact on overall morbidity in the pediatric population and morbidity and mortality in later life. Thus, additional simple surrogates of hepatic insulin resistance aiding in the clinical diagnosis of NAFLD are needed. SPISE outperformed established indices of hepatic insulin resistance when compared to M-values derived from hyperinsulinemic clamp tests in both males and females. Although neither index (SPISE, HOMA-IR, HIRI) allowed a differentiation of steatosis-grades within the NAFLD group, SPISE may represent an easy surrogate of hepatic insulin resistance in children with overweight or obesity to be used as a screening tool for hepatic risk assessment on a large scale and in longitudinal studies.
The original contributions presented in the study are included in the article/supplementary material. Further inquiries can be directed to the corresponding author.
The ethical approvals for the study and necessary amendments were obtained from the ethical committees of Uppsala University (Uppsala Regional Ethics Committee, registration numbers 2010/036 and 2012/318) as well as Salzburg University (Ethics Committee Salzburg 2012/1544). The study was carried out according to the Declaration of Helsinki, following an agreement of good clinical practice. The study physician informed the patients and controls and their families personally and written consent was consequently obtained from children/adolescents and parents separately. Written informed consent to participate in this study was provided by the participants’ legal guardian/next of kin.
DF, CHA, HMangge, HManell, PK, SS, DW and KMö conceived and designed the analysis, contributed data, performed the analyses and wrote the paper. KMö, SMB and KMa collected samples and data. PB, AF, JK, HA and AMS collected additional data and contributed to this manuscript.
This paper was written as part of the Beta-JUDO (Beta-cell function in Juvenile Diabetes and Obesity) consortium, which was carried out during 2012-2017 within the European FP7-HEALTH-2011-two-stage (project number: 279153). DW has received consultant fees from Novo Nordisk. HA and JK are cofounders, stock owners and employees of Antaros Medical, Mölndal/Sweden.
The authors declare that the research was conducted in the absence of any commercial or financial relationships that could be construed as a potential conflict of interest.
All claims expressed in this article are solely those of the authors and do not necessarily represent those of their affiliated organizations, or those of the publisher, the editors and the reviewers. Any product that may be evaluated in this article, or claim that may be made by its manufacturer, is not guaranteed or endorsed by the publisher.
1. Nittari G, Scuri S, Petrelli F, Pirillo I, di Luca NM, Grappasonni I. Fighting Obesity in Children From European World Health Organization Member States. Epidemiological Data, Medical-Social Aspects, and Prevention Programs. Clin Ter (2019) 170(3):223–30. doi: 10.7417/CT.2019.2137
2. Sharma V, Coleman S, Nixon J, Sharples L, Hamilton-Shield J, Rutter H, et al. A Systematic Review and Meta-Analysis Estimating the Population Prevalence of Comorbidities in Children and Adolescents Aged 5 to 18 Years. Obes Rev (2019) 20(10):1341–9. doi: 10.1111/obr.12904
3. Araújo AR, Rosso N, Bedogni G, Tiribelli C, Bellentani S. Global Epidemiology of Non-Alcoholic Fatty Liver Disease/Non-Alcoholic Steatohepatitis: What We Need in the Future. Liver Int (2018) 38(1):47–51. doi: 10.1111/liv.13643
4. Anderson EL, Howe LD, Jones HE, Higgins JP, Lawlor DA, Fraser A. The Prevalence of Non-Alcoholic Fatty Liver Disease in Children and Adolescents: A Systematic Review and Meta-Analysis. PloS One (2015) 10(10):140908. doi: 10.1371/journal.pone.0140908
5. Katsiki N, Perez-Martinez P, Anagnostis P, Mikhailidis DP, Karagiannis A. Is Nonalcoholic Fatty Liver Disease Indeed the Hepatic Manifestation of Metabolic Syndrome? Curr Vasc Pharmacol (2018) 16(3):219–27. doi: 10.2174/1570161115666170621075619
6. D'Adamo E, Castorani V, Nobili V. The Liver in Children With Metabolic Syndrome. Front Endocrinol (Lausanne) (2019) 10:514. doi: 10.3389/fendo.2019.00514
7. Nobili V, Alisi A, Valenti L, Miele L, Feldstein AE, Alkhouri N. NAFLD in Children: New Genes, New Diagnostic Modalities and New Drugs. Nat Rev Gastroenterol Hepatol (2019) 16(9):517–30. doi: 10.1038/s41575-019-0169-z
8. Younossi Z, Anstee QM, Marietti M, Hardy T, Henry L, Eslam M, et al. Global Burden of NAFLD and NASH: Trends, Predictions, Risk Factors and Prevention. Nat Rev Gastroenterol Hepatol (2018) 15(1):11–20. doi: 10.1038/nrgastro.2017.109
9. Fang YL, Chen H, Wang CL, Liang L. Pathogenesis of Non-Alcoholic Fatty Liver Disease in Children and Adolescence: From "Two Hit Theory" to "Multiple Hit Model". World J Gastroenterol (2018) 24(27):2974–83. doi: 10.3748/wjg.v24.i27.2974
10. El Hadi H, Di Vincenzo A, Vettor R, Rossato M. Cardio-Metabolic Disorders in Non-Alcoholic Fatty Liver Disease. Int J Mol Sci (2019) 20(9):2215. doi: 10.3390/ijms20092215
11. Tricò D, Galderisi A, Mari A, Polidori D, Galuppo B, Pierpont B, et al. Intrahepatic Fat, Irrespective of Ethnicity, is Associated With Reduced Endogenous Insulin Clearance and Hepatic Insulin Resistance in Obese Youths: A Cross-Sectional and Longitudinal Study From the Yale Pediatric NAFLD Cohort. Diabetes Obes Metab (2020) 22(9):1628–38. doi: 10.1111/dom.14076
12. Gutch M, Kumar S, Razi SM, Gupta KK, Gupta A. Assessment of Insulin Sensitivity/ Resistance. Indian J Endocrinol Metab (2013) 19(1):160–4. doi: 10.4103/2230-8210.146874
13. Yeckel CW, Weiss R, Dziura J, Taksali SE, Dufour S, Burgert TS, et al. Validation of Insulin Sensitivity Indices From Oral Glucose Tolerance Test Parameters in Obese Children and Adolescents. J Clin Endocrinol Metab (2004) 89(3):1096–101. doi: 10.1210/jc.2003-031503
14. Stumvoll M, Mitrakou A, Pimenta W, Jenssen T, Yki-Jarvinen H, Van Haeften T, et al. Use of the Oral Glucose Tolerance Test to Assess Insulin Release and Insulin Sensitivity. Diabetes Care (2000) 23(3):295–301. doi: 10.2337/diacare.23.3.295
15. Disse E, Bastard JP, Bonnet F, Maitrepierre C, Peyrat J, Louche-Pelissier C, et al. A Lipid-Parameter-Based Index for Estimating Insulin Sensitivity and Identifying Insulin Resistance in a Healthy Population. Diabetes Metab (2008) 34(5):457–63. doi: 10.1016/j.diabet.2008.02.009
16. Abdul-Ghani MA, Matsuda M, Balas B, DeFronzo RA. Muscle and Liver Insulin Resistance Indexes Derived From the Oral Glucose Tolerance Test. Diabetes Care (2007) 30:89–94. doi: 10.2337/dc06-1519
17. DeFronzo RA, Tobin JD, Andres R. Glucose Clamp Technique: A Method for Quantifying Insulin Secretion and Resistance. Am J Physiol (1979) 237(3):214–23. doi: 10.1152/ajpendo.1979.237.3.E214
18. Matthews DR, Hosker JP, Rudenski AS, Naylor BA, Treacher DF, Turner RC. Homeostasis Model Assessment: Insulin Resistance and Beta-Cell Function From Fasting Plasma Glucose and Insulin Concentrations in Man. Diabetologia (1985) 28(7):412–9. doi: 10.1007/BF00280883
19. Bedogni G, Tamini S, Caroli D, Cicolini S, Domenicali M, Sartorio A. Development and Internal Validation of Fatty Liver Prediction Models in Obese Children and Adolescents. J Clin Med (2021) 10(7):1470. doi: 10.3390/jcm10071470
20. Paulmichl K, Hatunic M, Højlund K, Jotic A, Krebs M, Mitrakou A, et al. Modification and Validation of the Triglyceride-To-HDL Cholesterol Ratio as a Surrogate of Insulin Sensitivity in White Juveniles and Adults Without Diabetes Mellitus: The Single Point Insulin Sensitivity Estimator (SPISE). Clin Chem (2016) 62(9):1211–9. doi: 10.1373/clinchem.2016.257436
21. de Onis M, Onyango AW, Borghi E, Siyam A, Nishida C, Siekmann J. Development of a WHO Growth Reference for School-Aged Children and Adolescents. Bull World Health Organ (2007) 85(9):660–7. doi: 10.2471/blt.07.043497
22. Forslund A, Staaf J, Kullberg J, Ciba I, Dahlbom M, Bergsten P. Uppsala Longitudinal Study of Childhood Obesity: Protocol Description. Pediatrics (2014) 133:386–93. doi: 10.1542/peds.2013-2143
23. Staaf J, Labmayr V, Paulmichl K, Manell H, Cen J, Ciba I, et al. Pancreatic Fat Is Associated With Metabolic Syndrome and Visceral Fat But Not Beta-Cell Function or Body Mass Index in Pediatric Obesity. Pancreas (2017) 46(3):358–65. doi: 10.1097/MPA.0000000000000771
24. Anderwald C, Pfeiler G, Nowotny P, Anderwald-Stadler M, Krebs M, Bischof MG, et al. Glucose Turnover and Intima Media Thickness of Internal Carotid Artery in Type 2 Diabetes Offspring. Eur J Clin Invest (2008) 38(4):227–37. doi: 10.1111/j.1365-2362.2008.01932.x
25. Anderwald C, Brabant G, Bernroider E, Horn R, Brehm A, Waldhäusl W, et al. Insulin-Dependent Modulation of Plasma Ghrelin and Leptin Concentrations is Less Pronounced in Type 2 Diabetic Patients. Diabetes (2003) 52(7):1792– 8. doi: 10.2337/diabetes.52.7.1792
26. Anderwald CH, Tura A, Gessl A, Smajis S, Bieglmayer C, Marculescu R, et al. Whole-Body Insulin Sensitivity Rather Than Body-Mass-Index Determines Fasting and Post-Glucose-Load Growth Hormone Concentrations. PloS One (2014) 9(12):115–84. doi: 10.1371/journal.pone.0115184
27. Berglund J, Kullberg J. Three-Dimensional Water/Fat Separation and T 2* Estimation Based on Whole-Image Optimization—Application in Breathhold Liver Imaging at 1. 5 T Magn Reson Med (2012) 67(6):1684–93. doi: 10.1002/mrm.23185
28. Weghuber D, Roden M, Franz C, Chmelik M, Torabia S, Nowotny P, et al. Vascular Function in Obese Children With Non-Alcoholic Fatty Liver Disease. Int J Pediatr Obes (2011) 6(2):120–7. doi: 10.3109/17477161003792580
29. Burgert TS, Taksali SE, Dziura J, Goodman TR, Yeckel CW, Papademetris X, et al. Alanine Aminotransferase Levels and Fatty Liver in Childhood Obesity: Associations With Insulin Resistance, Adiponectin, and Visceral Fat. J Clin Endocrinol Metab (2006) 91(11):4287–94. doi: 10.1210/jc.2006-1010
30. Szczepaniak LS, Nurenberg P, Leonard D, Browning JD, Reingold JS, Grundy S, et al. Magnetic Resonance Spectroscopy to Measure Hepatic Triglyceride Content: Prevalence of Hepatic Steatosis in the General Population. Am J Physiol Endocrinol Metab (2005) 288(2):462–8. doi: 10.1152/ajpendo.00064.2004
31. Di Martino M, Pacifico L, Bezzi M, Di Miscio R, Sacconi B, Chiesa C, et al. Comparison of Magnetic Resonance Spectroscopy, Proton Density Fat Fraction and Histological Analysis in the Quantification of Liver Steatosis in Children and Adolescents. World J Gastroenterol (2016) 22(39):8812–9. doi: 10.3748/wjg.v22.i39.8812
32. Schwimmer JB, Dunn W, Norman GJ, Pardee PE, Middleton MS, Kerkar N, et al. SAFETY Study: Alanine Aminotransferase Cutoff Values Are Set Too High for Reliable Detection of Pediatric Chronic Liver Disease. Gastroenterology (2010) 138(4):1357–64. doi: 10.1053/j.gastro.2009.12.052
33. Manning P, Murphy P, Wang K, Hooker J, Wolfson T, Middleton MS, et al. Liver Histology and Diffusion-Weighted MRI in Children With Nonalcoholic Fatty Liver Disease: A MAGNET Study. J Magn Reson Imaging (2017) 46(4):1149–58. doi: 10.1002/jmri.25663
34. Schwimmer JB, Middleton MS, Behling C, Newton KP, Awai HI, Paiz MN, et al. Magnetic Resonance Imaging and Liver Histology as Biomarkers of Hepatic Steatosis in Children With Nonalcoholic Fatty Liver Disease. Hepatology (2015) 61(6):1887–95. doi: 10.1002/hep.27666
35. Youden WJ. Index for Rating Diagnostic Tests. Cancer (1950) 3(1):32–5. doi: 10.1002/1097-0142(1950)3:1<32::aid-cncr2820030106>3.0.co;2-3
36. Prokopowicz Z, Malecka-Tendera E, Matusik P. Predictive Value of Adiposity Level, Metabolic Syndrome, and Insulin Resistance for the Risk of Nonalcoholic Fatty Liver Disease Diagnosis in Obese Children. Can J Gastroenterol Hepatol (2018) 2018:9465784. doi: 10.1155/2018/9465784
37. Marcovina S, Bowsher RR, Miller WG, Staten M, Myers G, Caudill SP, et al. Standardization of Insulin Immunoassays: Report of the American Diabetes Association Workgroup. Clin Chem (2007) 53(4):711–6. doi: 10.1373/clinchem.2006.082214
38. Sapin R. Insulin Immunoassays: Fast Approaching 50 Years of Existence and Still Calling for Standardization. Clin Chem (2007) 53(5):810–2. doi: 10.1373/clinchem.2006.084012
39. Singh B, Saxena A. Surrogate Markers of Insulin Resistance: A Review. World J Diabetes (2010) 1(2):36–47. doi: 10.4239/wjd.v1.i2.36
40. Mosimah CI, Lilly C, Forbin AN, Murray PJ, Pyles L, Elliot E, et al. Early Testing of Insulin Resistance: A Tale of Two Lipid Ratios in a Group of 5th Graders Screened by the Coronary Artery Risk Detection in Appalachian Communities Project (CARDIAC Project). World J Pediatr (2019) 15(4):398–404. doi: 10.1007/s12519-018-00225-z
41. Correa-Burrows P, Blanco E, Gahagan S, Burrows R. Validity Assessment of the Single-Point Insulin Sensitivity Estimator (SPISE) for Diagnosis of Cardiometabolic Risk in Post-Pubertal Hispanic Adolescents. Sci Rep (2020) 10(1):14399. doi: 10.1038/s41598-020-71074-y
42. Dudi P, Goyal B, Saxena V, Rabari K, Mirza AA, Naithani M, et al. Single Point Insulin Sensitivity Estimator as an Index for Insulin Sensitivity for Metabolic Syndrome: A Study in North Indian Population. J Lab Physicians (2019) 11(3):244–8. doi: 10.4103/jlp.jlp_163_18
43. Miyakoshi T, Sagesaka H, Sato Y, Hirbayashi K, Koike H, Yamashita K, et al. Reappraisal of Attenuated Insulin Sensitivity in the Evolution of Non-Alcoholic Fatty Liver Disease. Eur J Clin Nutr (2019) 73(5):770–5. doi: 10.1038/s41430-018-0246-3
44. Cederholm J, Zethelius B. SPISE and Other Fasting Indexes of Insulin Resistance: Risks of Coronary Heart Disease or Type 2 Diabetes. Comparative Cross-Sectional and Longitudinal Aspects. Ups J Med Sci (2019) 124(4):265–72. doi: 10.1080/03009734.2019.168058328
45. Sagesaka H, Sato Y, Someya Y, Tamura Y, Shimodaira M, Miyakoshi T, et al. Type 2 Diabetes: When Does It Start? J Endocr Soc (2018) 2(5):476–84. doi: 10.1210/js.2018-00071
46. Barchetta I, Dule S, Bertoccini L, Cimini FA, Sentinelli F, Bailetti D, et al. The Single-Point Insulin Sensitivity Estimator (SPISE) Index is a Strong Predictor of Abnormal Glucose Metabolism in Overweight/Obese Children: A Long-Term Follow-Up Study. J Endocrinol Invest (2021) 45(1):43–51. doi: 10.1007/s40618-021-01612-6
47. Coccia F, Testa M, Guarisco G, Di Cristofano C, Silecchia G, Leonetti F, et al. Insulin Resistance, But Not Insulin Response, During Oral Glucose Tolerance Test (OGTT) is Associated to Worse Histological Outcome in Obese NAFLD. Nutr Metab Cardiovasc Dis (2020) 30(1):106–13. doi: 10.1016/j.numecd.2019.08.001
48. Lazar MV, Eapen M, Nair HR, Siyad I, Gopalakrishna R. Correlation Between Insulin Resistance and Liver Histology in Patients With Nonalcoholic Steatohepatitis With and Without Obesity. Indian J Gastroenterol (2020) 39(1):42–9. doi: 10.1007/s12664-020-01024-z
49. Fujii H, Imajo K, Yoneda M, Nakahara T, Hyogo H, Takahashi H, et al. Japan Study Group of Nonalcoholic Fatty Liver Disease. HOMA-IR: An Independent Predictor of Advanced Liver Fibrosis in Nondiabetic Non-Alcoholic Fatty Liver Disease. J Gastroenterol Hepatol (2019) 34(8):1390–5. doi: 10.1111/jgh.14595
50. Vos M, Abrams SH, Barlow SE, Caprio S, Daniels SR, Kohli R, et al. NASPGHAN Clinical Practice Guideline for the Diagnosis and Treatment of Nonalcoholic Fatty Liver Disease in Children: Recommendations From Expert Committee on NAFLD (ECON) and the North American Society of Pediatric Gastroenterology, Hepatology and Nutrition (NASPGHAN). J Pediatr Gastroenterol Nutr (2017) 64(2):319–34. doi: 10.1097/MPG.0000000000001482
51. Özcabı B, Demirhan S, Akyol M, Öztürkmen Akay H, Güven A. Lipid Accumulation Product is a Predictor of Nonalcoholic Fatty Liver Disease in Childhood Obesity. Korean J Pediatr (2019) 62(12):450–5. doi: 10.3345/kjp.2019.00248
52. Wasilewska N, Bobrus-Chociej A, Harasim-Symbor E, Tarasów E, Wojtkowska M, Chabowski A, et al. Increased Serum Concentration of Ceramides in Obese Children With Nonalcoholic Fatty Liver Disease. Lipids Health Dis (2018) 17(1):216. doi: 10.1186/s12944-018-0855-9
53. Chatterjee A, Basu A, Das K, Singh P, Mondal D, Bhattacharya B, et al. Hepatic Transcriptome Signature Correlated With HOMA-IR Explains Early Nonalcoholic Fatty Liver Disease Pathogenesis. Ann Hepatol (2020) 19(5):472–81. doi: 10.1016/j.aohep.2020.06.009
54. Pacifico L, Bonci E, Andreoli G, Romaggioli S, Di Miscio R, Lombardo CV, et al. Association of Serum Triglyceride-to-HDL Cholesterol Ratio With Carotid Artery Intima-Media Thickness, Insulin Resistance and Nonalcoholic Fatty Liver Disease in Children and Adolescents. Nutr Metab Cardiovasc Dis (2014) 24(7):737–43. doi: 10.1016/j.numecd.2014.01.010
55. Guo W, Lu J, Qin P, Li X, Zhu W, Wu J, et al. The Triglyceride-Glucose Index Is Associated With the Severity of Hepatic Steatosis and the Presence of Liver Fibrosis in Non-Alcoholic Fatty Liver Disease: A Cross-Sectional Study in Chinese Adults. Lipids Health Dis (2020) 19(1):218. doi: 10.1186/s12944-020-01393-6
56. Chalasani N, Younossi Z, Lavine JE, Charlton M, Cusi K, Rinella M, et al. The Diagnosis and Management of Nonalcoholic Fatty Liver Disease: Practice Guidance From the American Association for the Study of Liver Diseases. Hepatology (2018) 67(1):328–57. doi: 10.1002/hep.29367
57. Mencin AA, Lavine JE. Advances in Pediatric Nonalcoholic Fatty Liver Disease. Pediatr Clin North Am (2011) 58(6):1375–92. doi: 10.1016/j.pcl.2011.09.005
58. Vajro P, Lenta S, Socha P, Dhawan A, McKiernan P, Baumann U, et al. Diagnosis of Nonalcoholic Fatty Liver Disease in Children and Adolescents: Position Paper of the ESPGHAN Hepatology Committee. J Pediatr Gastroenterol Nutr (2012) 54(5):700–13. doi: 10.1097/MPG.0b013e318252a13f
59. Kulkarni S, Naz N, Gu H, Stoll JM, Thompson MD, DeBosch BJ. A Clinical Model to Predict Fibrosis on Liver Biopsy in Paediatric Subjects With Nonalcoholic Fatty Liver Disease. Clin Obes (2021) 11(5):e12472. doi: 10.1111/cob.12472
60. Ooi GJ, Earnest A, Kemp WW, Burton PR, Laurie C, Majeed A, et al. Evaluating Feasibility and Accuracy of Non-Invasive Tests for Nonalcoholic Fatty Liver Disease in Severe and Morbid Obesity. Int J Obes (2018) 42(11):1900–11. doi: 10.1038/s41366-018-0007-3
61. Lee EH, Kim JY, Yang HR. Relationship Between Histological Features of Nonalcoholic Fatty Liver Disease and Ectopic Fat on Magnetic Resonance Imaging in Children and Adolescents. Front Pediatr (2021) 10:685795(9). doi: 10.3389/fped.2021.685795
62. Martos-Moreno G, Martínez-Villanueva J, González-Leal R, Chowen JA, Argente J. Sex, Puberty, and Ethnicity Have a Strong Influence on Growth and Metabolic Comorbidities in Children and Adolescents With Obesity: Report on 1300 Patients (the Madrid Cohort). Pediatr Obes (2019) 14(12):12565. doi: 10.1111/ijpo.12565
Keywords: insulin resistance, pediatric obesity, hepatic insulin resistance index, HOMA-IR, receiver-operating-characteristic curve
Citation: Furthner D, Anderwald CH, Bergsten P, Forslund A, Kullberg J, Ahlström H, Manell H, Ciba I, Mangge H, Maruszczak K, Koren P, Schütz S, Brunner SM, Schneider AM, Weghuber D and Mörwald K (2022) Single Point Insulin Sensitivity Estimator in Pediatric Non-Alcoholic Fatty Liver Disease. Front. Endocrinol. 13:830012. doi: 10.3389/fendo.2022.830012
Received: 06 December 2021; Accepted: 06 January 2022;
Published: 02 February 2022.
Edited by:
Aneta Monika Gawlik, Medical University of Silesia, PolandReviewed by:
David Thivel, Clermont, FranceCopyright © 2022 Furthner, Anderwald, Bergsten, Forslund, Kullberg, Ahlström, Manell, Ciba, Mangge, Maruszczak, Koren, Schütz, Brunner, Schneider, Weghuber and Mörwald. This is an open-access article distributed under the terms of the Creative Commons Attribution License (CC BY). The use, distribution or reproduction in other forums is permitted, provided the original author(s) and the copyright owner(s) are credited and that the original publication in this journal is cited, in accordance with accepted academic practice. No use, distribution or reproduction is permitted which does not comply with these terms.
*Correspondence: Daniel Weghuber, ZC53ZWdodWJlckBzYWxrLmF0
†These authors have contributed equally to this work and share first authorship
Disclaimer: All claims expressed in this article are solely those of the authors and do not necessarily represent those of their affiliated organizations, or those of the publisher, the editors and the reviewers. Any product that may be evaluated in this article or claim that may be made by its manufacturer is not guaranteed or endorsed by the publisher.
Research integrity at Frontiers
Learn more about the work of our research integrity team to safeguard the quality of each article we publish.