- 1Department of Endocrinology and Metabolism, Endocrine Institute, and Liaoning Provincial Key Laboratory of Endocrine Diseases, The First Hospital of China Medical University, Shenyang, China
- 2Department of Endocrinology and Metabolism, The Third Affiliated Hospital of Jinzhou Medical University, Jinzhou, China
Thyroid hormone is critical during the development of vertebrates and affects the function of many organs and tissues, especially the intestine. Triiodothyronine (T3) is the active form and can bind to thyroid hormone nuclear receptors (TRs) to play a vital role in the development of vertebrates. The resistance to thyroid hormone α, as seen in patients, has been mimicked by the ThraE403X mutation. To investigate the mechanisms underlying the effect of TRα1 on intestinal development, the present study employed proteomic analysis to identify differentially expressed proteins (DEPs) in the distal ileum between homozygous ThraE403X/E403X and wild-type Thra+/+ mice. A total of 1,189 DEPs were identified, including 603 upregulated and 586 downregulated proteins. Proteomic analysis revealed that the DEPs were highly enriched in the metabolic process, the developmental process, the transporter of the nutrients, and the intestinal immune system-related pathway. Of these DEPs, 20 proteins were validated by parallel reaction monitoring analysis. Our intestinal proteomic results provide promising candidates for future studies, as they suggest novel mechanisms by which TRα1 may influence intestinal development, such as the transport of intestinal nutrients and the establishment of innate and adaptive immune barriers of the intestine.
Introduction
Thyroid hormone (TH) production is a tightly regulated process controlled by a classic negative feedback loop involving the hypothalamus, the pituitary gland, and the thyroid, which has led to the common name hypothalamus–pituitary–thyroid axis. Thyroxine (T4) and triiodothyronine (T3) are synthesized and secreted by thyroid gland follicular cells. T3, as the active metabolite of the thyroid hormone, is known to be important for the normal development and life of adult vertebrates, especially during the regulatory period of post-embryonic birth (1–3). T3 exerts its effects via thyroid hormone receptors (TRs), which are members of the nuclear hormone receptor protein superfamily (4, 5) and are known as T3-modulated transcription factors (6). T3 can activate or inhibit T3 target genes by regulating the activity of TRs (6, 7). In mammals, the diversity of TR proteins is encoded by the two genes THRA and THRB (6, 8) through the use of different promoters and/or alternative splicing (9, 10). There are four isoforms encoded by each of the TRα locus (TRα1, TRα2, TRΔα1, and TRΔα2) (11–13) and the TRβ locus (TRβ1, TRβ2, TRβ3, and TRΔβ3) (13–15).
In the past few decades, researchers have found that the intestine is one of the target organs of TH action (16, 17). First, TH was reported to be one of the essential regulators of gastrointestinal development during the progression of amphibian metamorphosis (18). Then, mouse studies reported that mutations in TRα resulted in intestinal defects, such as shorter villi, reduced apoptosis of the villi, reduced cell proliferation of the crypts, and decreased sucrase, lactase, and aminopeptidase enzymatic activities of the intestine (1, 19, 20). Recently, our group established a new TRα mutant mouse model (ThraE403X/E403X mouse), and we observed that the length of the small and large intestine was significantly shorter, the number of epithelial cells was reduced, and the length of the villi and the depth of the crypts were significantly decreased in 3-week-old ThraE403X/E403X mice compared to Thra+/+ mice (21). These findings indicated that TRα1 plays an important role in intestinal development, which could be associated with the short lifespan and impaired postnatal development of ThraE403X/E403X mice.
In the present study, our aim was to further elucidate the molecular mechanisms underlying the effects of TRα1 on intestinal development. To this end, intestinal proteomics and bioinformatics analyses were adopted to identify differentially expressed proteins (DEPs) in the distal ileum between homozygous ThraE403X/E403X (Hom) and wild-type Thra+/+ (Wt) mice.
Materials and Methods
Animal Maintenance and Sample Preparation
Three-week-old male Wt and Hom mice were used in our experiment, which were obtained by crossing heterozygous (ThraE403X/+) mice. The mice were housed in a specific pathogen-free environment at 22 ± 2°C with an automatic 12-h light–dark cycle and free access to food and water. The mice were anesthetized with 1.2 ml/kg of 3% pentobarbital sodium by intraperitoneal injection, and the intestine was dissected along the Treitz ligament, separating the small intestine. The intestines were dissected longitudinally and washed thoroughly with 4°C precooled saline. One centimeter of the distal ileum was placed in a cryopreservation collection tube placed in dry ice during collection and then stored in liquid nitrogen until further protein extraction protocols. Five samples from each genotype (ThraE403X/E403X mice, n = 5; Thra+/+ mice, n = 5) were utilized for the proteomic analysis. All animal experiments were approved by the animal experimentation ethics committee of the China Medical University.
Protein Extraction and Digestion
The process of protein extraction and digestion was performed according to a previously published method (22). The samples were homogenized in liquid nitrogen and thoroughly ground into powder. Then, the cell powder was further homogenized by ultrasonication with lysis buffer containing 1% SDS and 1% protease inhibitor on ice. Then, the samples were gently mixed at room temperature, followed by centrifugation at 12,000 × g for 10 min at 4°C. The supernatant was transferred to a new tube, and the protein concentration was determined with the BCA protein assay kit (Thermo Fisher Scientific, Rockford, IL, USA) according to the manufacturer’s instructions and measured three times with a Multiscan Ascent photometer (Thermo Fisher Scientific, Rockford, IL, USA) at a wavelength of 570 nm.
For protein digestion, equal amounts of sample protein were used, and precooled acetone was used to precipitate the proteins. Then, the proteins were centrifuged at 4,500 × g for 15 min, and the supernatant was discarded and washed twice with cooling acetone. Then, the protein solution was reduced with 5 mM dithiothreitol for 30 min at 56°C and alkylated with 11 mM iodoacetamide for 15 min at room temperature in darkness. The protein solution was diluted by adding 200 mM TEAB. After ultrasonication by the sonicator, trypsin (Thermo Scientific, USA) was used at a 1:50 trypsin-to-protein mass ratio for digestion overnight at 37°C and a 1:100 trypsin-to-protein mass ratio for a second 4-h digestion.
TMT Labeling and HPLC Fractionation
The peptides were desalted using a Strata X C18 SPE column (Phenomenex, USA) and vacuum freeze-dried. The peptides were dissolved in 0.5 M TEAB and labeled with the TMT kit/iTRAQ kit (Thermo Fisher Scientific) according to the manufacturer’s instructions. Then, the TMT/iTRAQ reagent was reconstituted in acetonitrile, the peptides were mixed and incubated for 2 h, and the samples were pooled and vacuum freeze-dried. The peptides were eluted using high-pH reverse-phase HPLC using a Thermo Betasil C18 column (particle size, 5.0 μm; 250 mm × 10.0 mm i.d.; Thermo Fisher Scientific, Waltham, MA, USA). Briefly, the peptides were combined into six fractions and dried by vacuum centrifugation.
LC–MS/MS Analysis
High-resolution mass spectrometry was performed using a Q-exactive mass spectrometer coupled with an EASY-nLC 1000 liquid chromatograph instrument (Thermo Fisher Scientific). The column was inserted in a HPLC Accela instrument (constituted by an autosampler and a 600 pump) and coupled to a Q-exactive mass spectrometer (Thermo Fisher Scientific) for high-resolution mass spectrometry. Mobile phase A was 0.1% formic acid + 2% acetonitrile in water. Mobile phase B was 0.1% formic acid + 2% acetonitrile in water. A gradient of 40 min was run with 9 to 26% solvent B, 40–54 min was run with 26 to 35% solvent B, 54–57 min was run with 35–80% solvent B, and 57-60 min was run with 80% solvent B with a flow rate of 500.00 nl/min. After separation by HPLC, the peptides were ionized by nanospray ionization (NSI) and analyzed by a Q-exactive instrument (Thermo Fisher Scientific). Mass spectrometric detection was carried out on a Q Exactive Orbitrap MS (Thermo Fisher Scientific) equipped with an NSI source operated in positive-ion mode. The spray voltage parameter was set to 2.2 Kv, and the MS data were acquired at the following parameters: MS1 spectra were collected in the range of 400 to 1,500 m/z at 70,000 resolution. MS2 spectra were collected at a fixed 100 m/z at 35,000 resolution. For data-dependent acquisition-MS, the top 20 precursor ions were selected for fragmentation with stepped normalized collision energies of 28%. With an automatic gain control (AGC) target of 5 × 10E4 and a maximum injection time of 50 ms, the dynamic exclusion time was set to 30 s.
Database Search and Quantitative Calculation of Protein
The MS/MS data were recorded and analyzed using Maxquant software, version 1.5.2.8 (Thermo Fisher Scientific). The obtained peptide sequences were searched against the UniProt Mus_musculus_10090 (17,032 sequences) database concatenated with a reverse decoy database. The false discovery rate was adjusted to <0.01.
The raw LC–MS datasets were first searched against the database and converted into matrices containing the reporter intensity of peptides across samples. The relative quantitative value of each protein was then calculated based on these intensity values by the following steps: first, the intensities of peptides (I) across all samples were centralized and transformed into their values of relative quantification (U) in each sample. The formula is as follows: i denotes the sample, and j denotes the peptide. Uij = Iij/mean (Ij); second, to adjust the systematic bias of the identified peptide amount among different samples in the process of mass spectrometry detection, the relative quantitative value of the peptide needed to be corrected by the median value as follows: NRij = Uij/median (Ui); and third, the relative quantitative value of a protein (R) was calculated by the intensity median of its corresponding unique peptides. The formula is listed as follows: Rik = median (NRij, j∈k), where k denotes the protein and j denotes the unique peptides belonging to the protein.
Bioinformatic Analysis
Fold change >1.30 or <0.77 and p <0.05 were set as the significant thresholds for the DEPs. The DEPs were annotated into three categories based on gene ontology (GO) terms, including biological processes, cellular components, and molecular functions.
The protein pathway was annotated via the Kyoto Encyclopedia of Genes and Genomes (KEGG) database. Enrichment analysis was conducted for the KEGG pathway.
Parallel Reaction Monitoring Analysis
To verify the results of the proteomics analyses, 20 DEPs were selected and measured by parallel reaction monitoring analysis (PRM). PRM is a targeted proteomics technology based on high-resolution and high-precision mass spectrometry, which can selectively detect target proteins and target peptides, thus achieving the absolute quantification of target proteins/peptides (23). The protein isolation and trypsinization procedures were conducted as detailed above. The tryptic peptides were dissolved in 0.1% formic acid (solvent A) and directly loaded onto a homemade reversed-phase analytical column. The gradient was comprised of an increase from 6 to 23% solvent B (0.1% formic acid in 98% acetonitrile) over 38 min, 23 to 35% in 14 min, climbing to 80% in 4 min, and then holding at 80% for the last 4 min, all at a constant flow rate of 700 nl/min on an EASY-nLC 1000 UPLC system. The peptides were subjected to an NSI source, followed by tandem mass spectrometry (MS/MS) in Q ExactiveTM Plus (Thermo) coupled online to the UPLC. The electrospray voltage applied was 2.0 kV. The m/z scan range was 350 to 1,000 for full scan, and intact peptides were detected in the Orbitrap at a resolution of 35,000. Peptides were then selected for MS/MS using NCE setting 27, and the fragments were detected in the Orbitrap at a resolution of 17,500. We used a data-independent procedure that alternated between 1 MS scan and 20 MS/MS scans. AGC was set at 3E6 for full MS and 1E5 for MS/MS. The maximum IT was set at 20 ms for full MS and auto for MS/MS. The isolation window for MS/MS was set at 2.0 m/z.
The PRM data were processed using Skyline (v.3.6). For the peptide settings, trypsin [KR/P] was used as the enzyme, and the maximum missed cleavage was set as 2. The peptide length was set as 8–25, variable modification was set as carbamidomethyl on Cys and oxidation on Met, and the maximum variable modification was set as 3. The transition settings were as follows: precursor charges were set as 2 and 3, ion charges were set as 1 and 2, and ion types were set as b, y, and p. The product ions were set from ion 3 to the last ion; the ion match tolerance was set as 0.02 Da.
Statistical Analysis
After filtration, data were subjected to univariate and multivariate analysis to calculate the fold changes between the Thra+/+ and ThraE403X/E403X mice samples. Statistical significance was determined using Fisher’s exact test with Benjamini–Hochberg’s corrected P-value <0.05. Hierarchical clustering analysis was conducted for the DEPs, based on the significant enrichments, using the “heatmap.2” function from the “gplots” R package. The proteomic analysis in our research was supported by Jingjie PTM BioLabs (Hangzhou, China).
Results
Quantitative Proteins
Five mice from each genotype were initially selected (ThraE403X/E403X mice, n = 5; Thra+/+ mice, n = 5). However, the biological repeat analysis showed that one Wt mouse was not reproducible with the other samples in the Wt genotype group, so the data from this sample were removed from the Wt group, leaving four biological replicates in the wild genotype and five biological replicates in the Hom genotype group for proteomic analysis. In total, 247,627 secondary spectrograms were obtained by mass spectrometry analysis. The number of available effective spectrograms was 67,318, and the utilization rate of the spectrograms was 27.2%. A total of 38,475 peptides were identified by spectrogram analysis, among which 37,221 were specific peptide segments. A total of 5,874 proteins were identified, of which 5,010 were quantifiable (Figure 1).
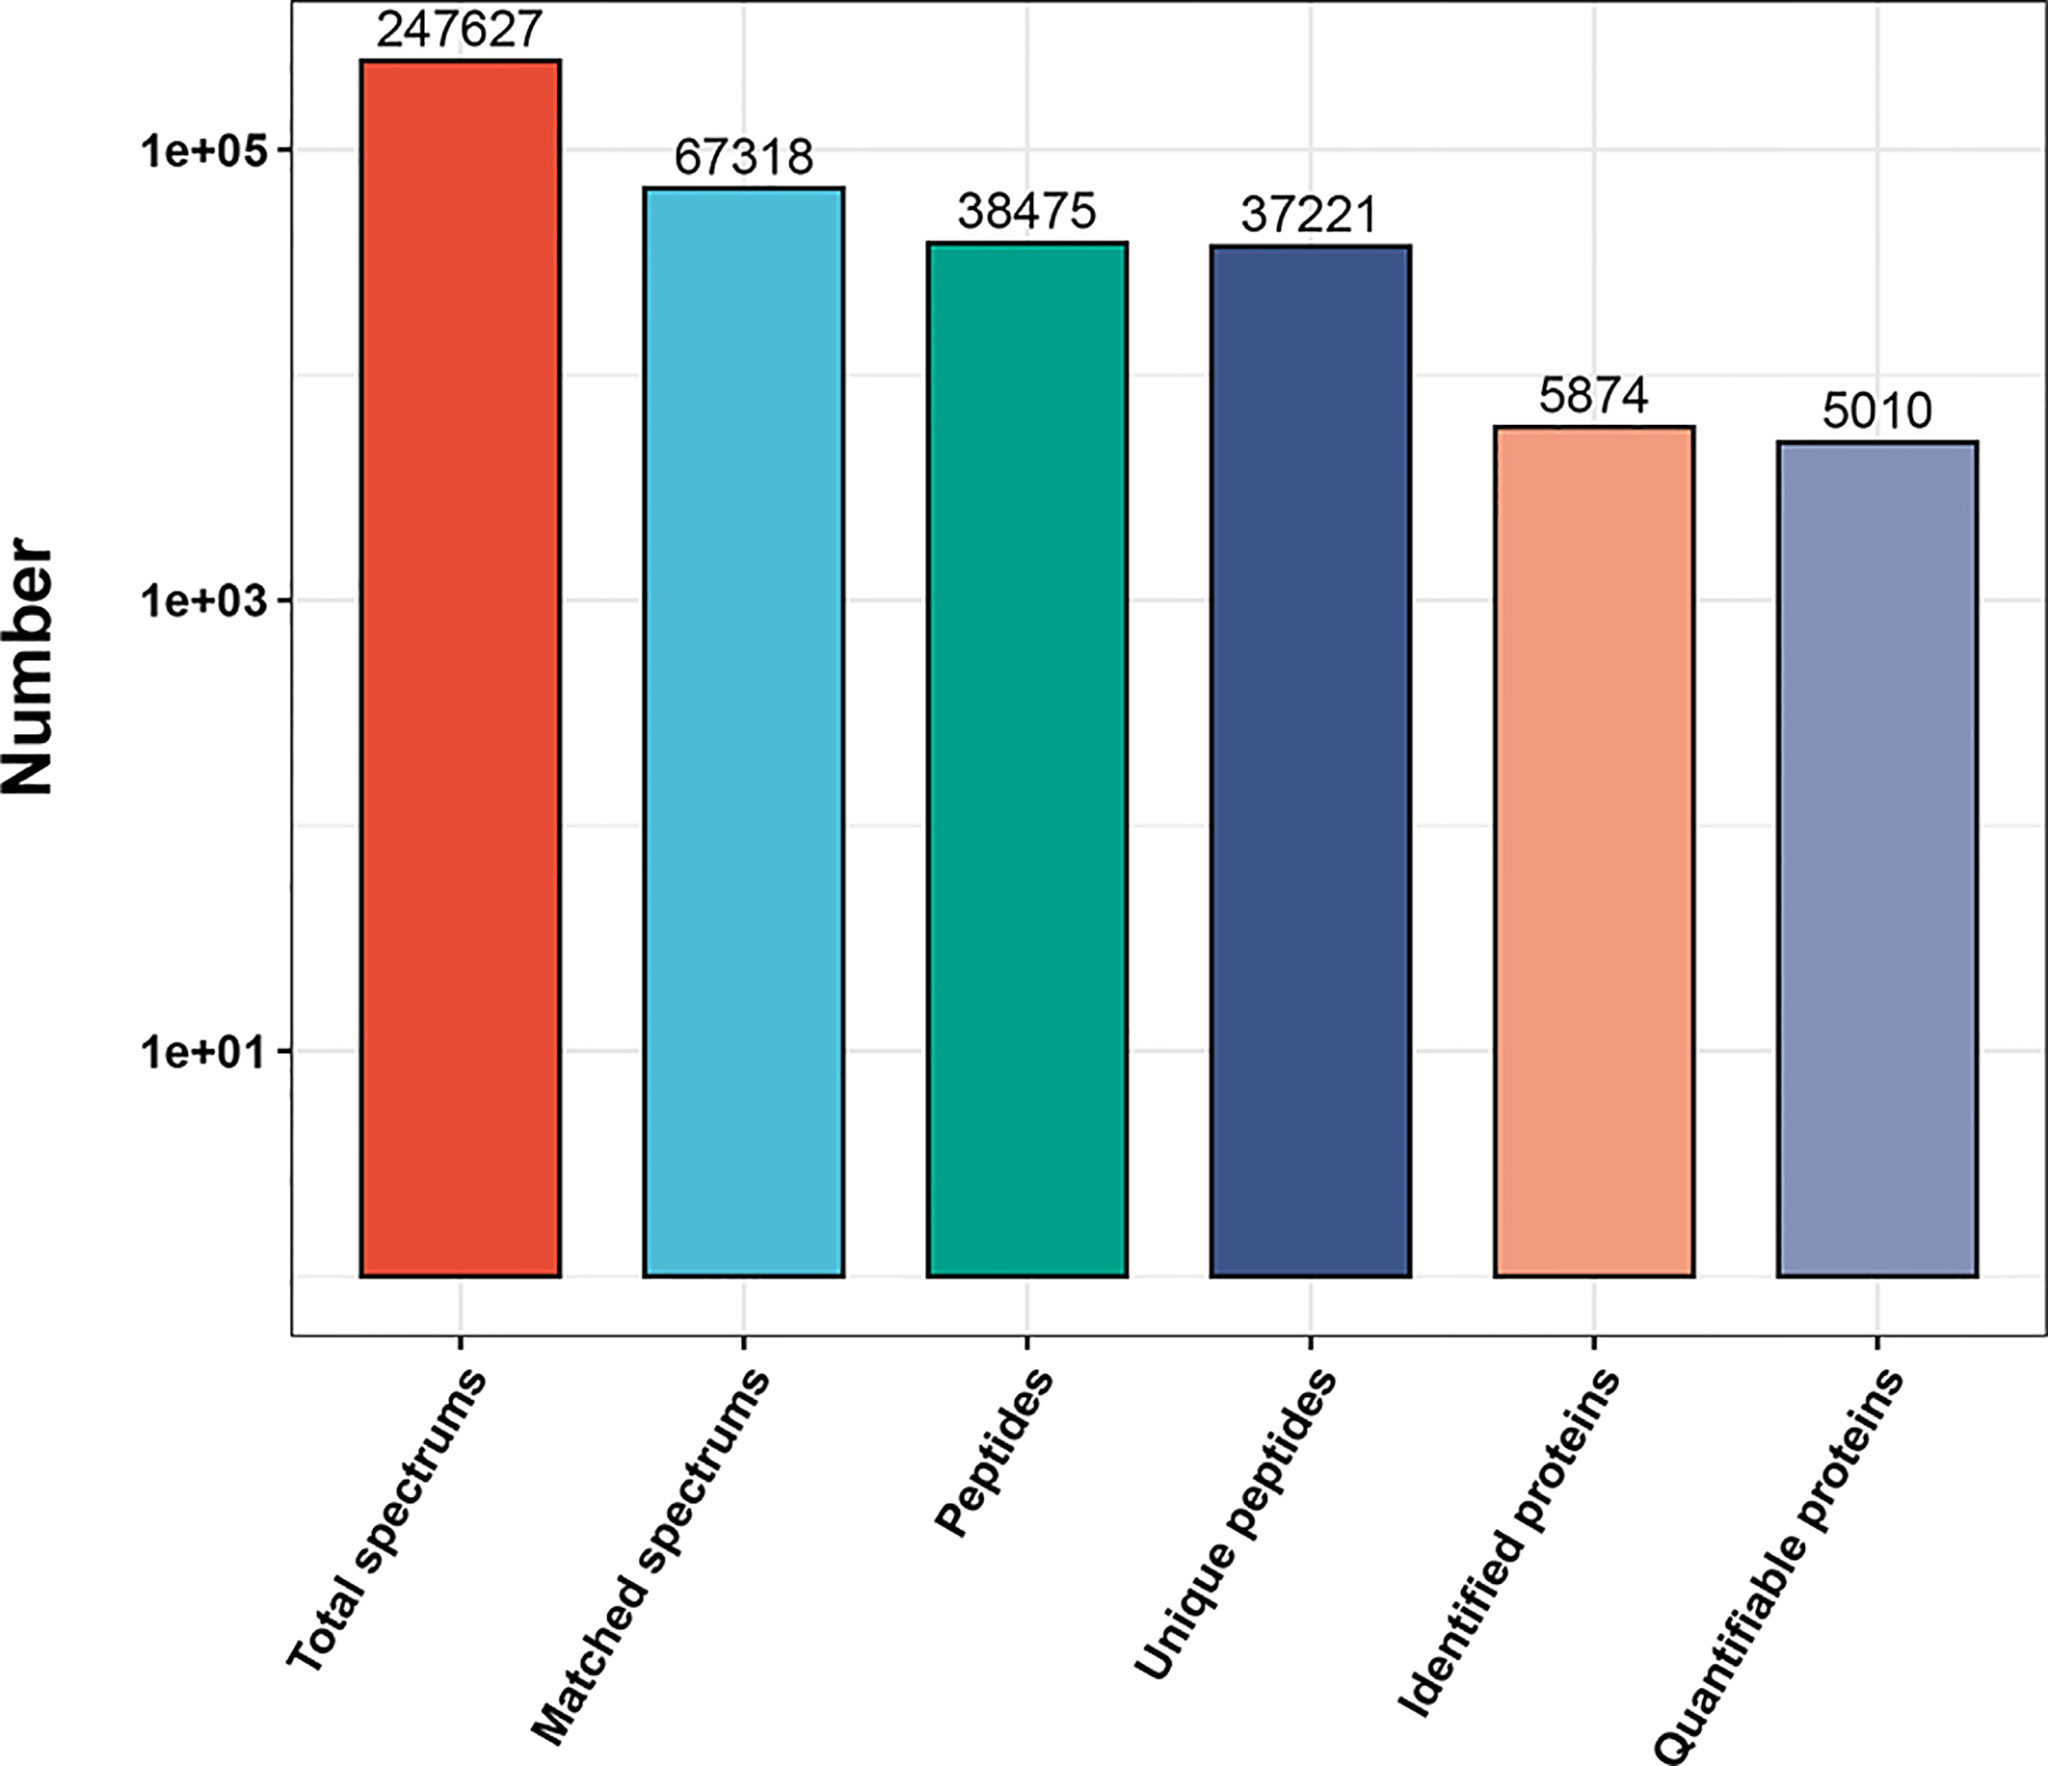
Figure 1 Overview of the mass spectrometry results. Bar plot summarizing the detected peptides and proteins in Wt Thra+/+ (n = 4) and Hom ThraE403X/E403X (n = 5) mice.
DEP Analysis
As shown in Figure 2, compared to Thra+/+mice, 1,189 DEPs were identified in the ThraE403X/E403X mice, including 603 upregulated proteins and 586 downregulated proteins.
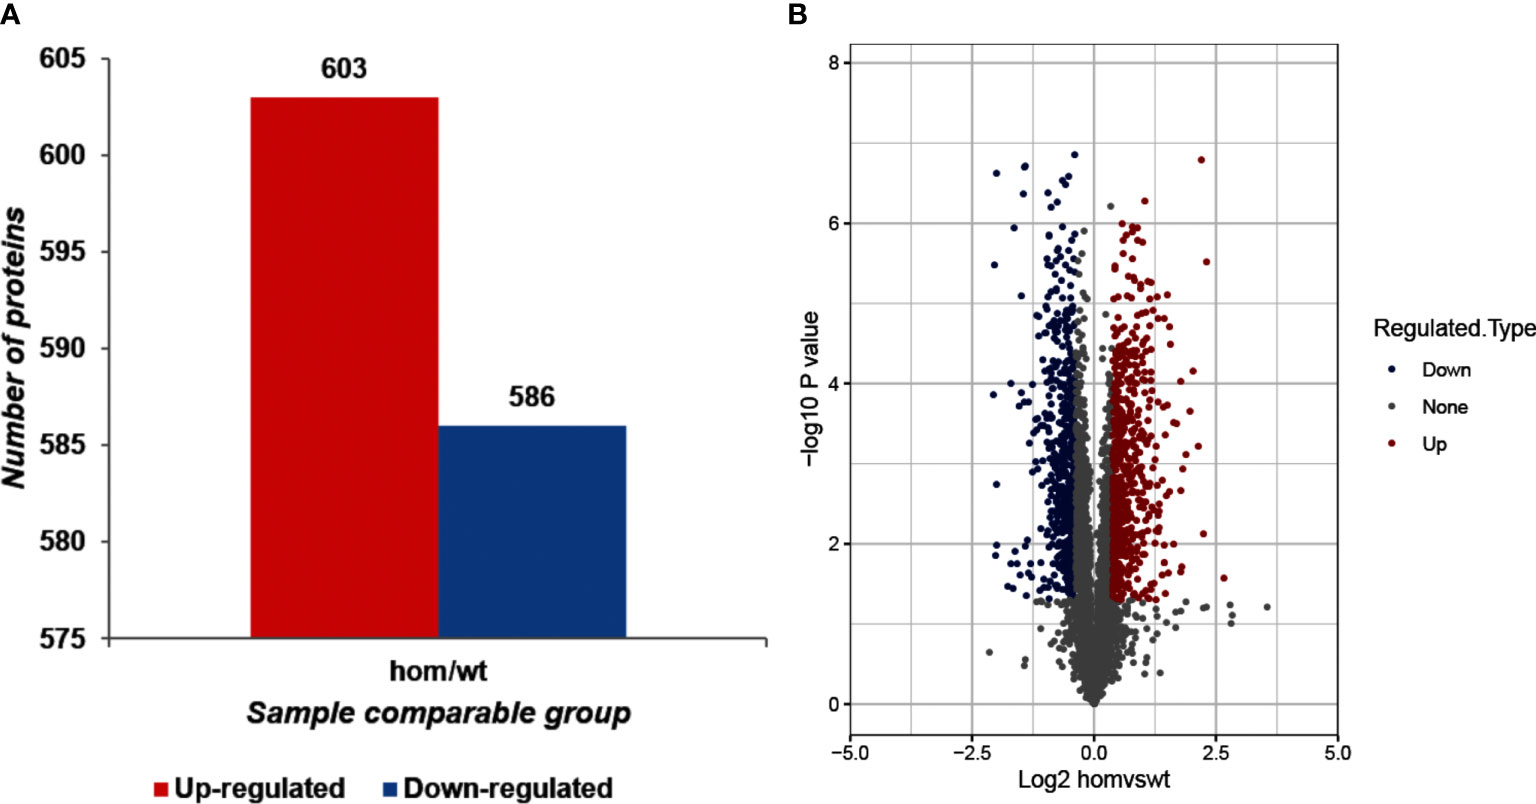
Figure 2 Identification of differentially expressed proteins (DEPs) between ThraE403X/E403X and Thra+/+ mice. (A) The total number of upregulated and downregulated DEPs. The fold change (FC) >1.30 and p-value <0.05 were set as the significant thresholds for the upregulated DEPs. FC <0.77 and p-value <0.05 were set as the significant thresholds for the downregulated DEPs. (B) Volcano plot of the identified DEPs between ThraE403X/E403X (n = 5) and Thra+/+ (n = 4) mice. The x-axis shows the log2 fold change of each protein, and the y-axis shows the p-value of the significant difference test after log10 logarithmic conversion. The red dots denote upregulated DEPs, the blue dots denote downregulated DEPs, and the gray dots denote unchanged proteins.
Functional Enrichment Analysis of the DEPs
In order to find out whether the DEPs have a significant enrichment trend in specific functional categories, we next conducted functional enrichment analysis of the DEPs based upon the gene ontology (GO) and Kyoto Encyclopedia of Genes and Genomes (KEGG) reference databases. Notably, the DEPs were significantly enriched for several relevant GO terms, including metabolic process, developmental process, and transporter activity (Figure 3). The top 20 enriched KEGG pathways are shown in Figure 4. Among them, several nutrient metabolism-related pathways were enriched, such as fatty acid degradation (mmu00071), fatty acid metabolism (mmu0121), fat digestion and absorption (mmu04975), starch and sucrose metabolism (mmu00500), and protein digestion and absorption (mmu04974). Furthermore, the antigen processing and presentation (mmu04612) and intestinal immune network for IgA production (mmu04672) pathways were enriched, and most of the DEPs related to these two pathways were downregulated.
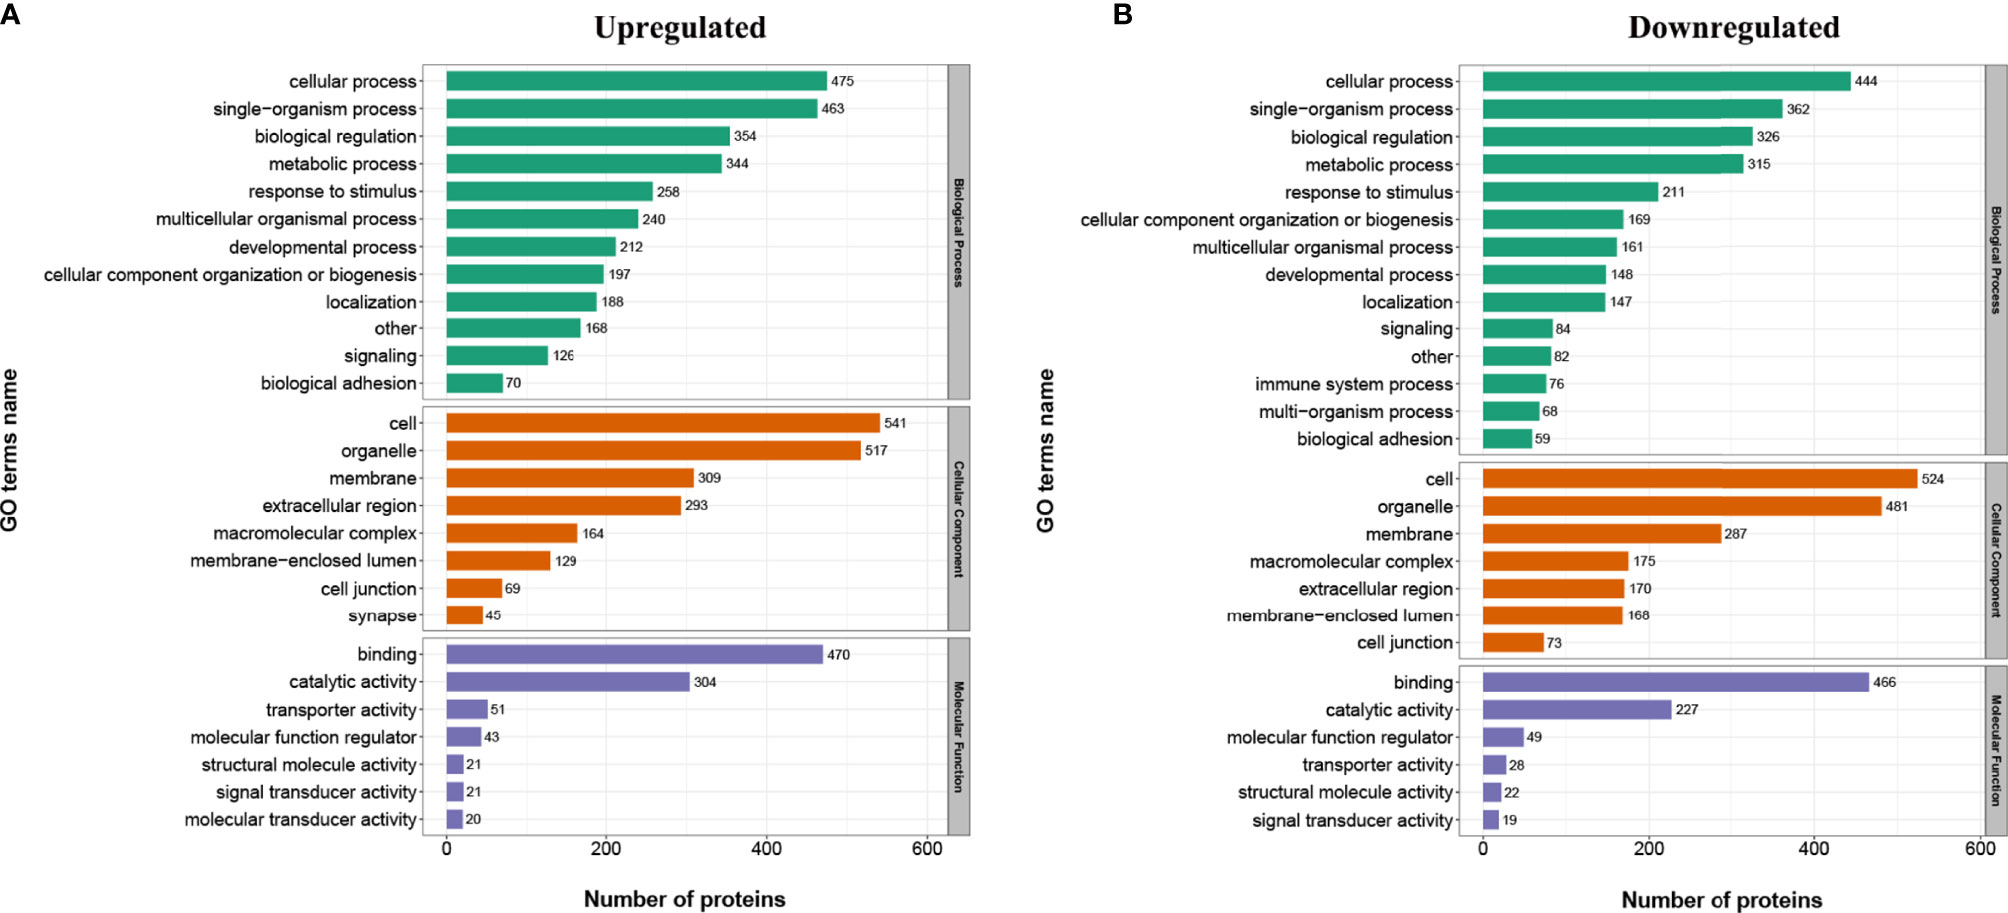
Figure 3 Gene ontology (GO) analysis for the identified differentially expressed proteins (DEPs). The DEPs were annotated into three categories based on GO terms, including biological processes, cellular components, and molecular functions. (A) GO enrichment analysis of the upregulated DEPs. (B) GO enrichment analysis of the downregulated DEPs.
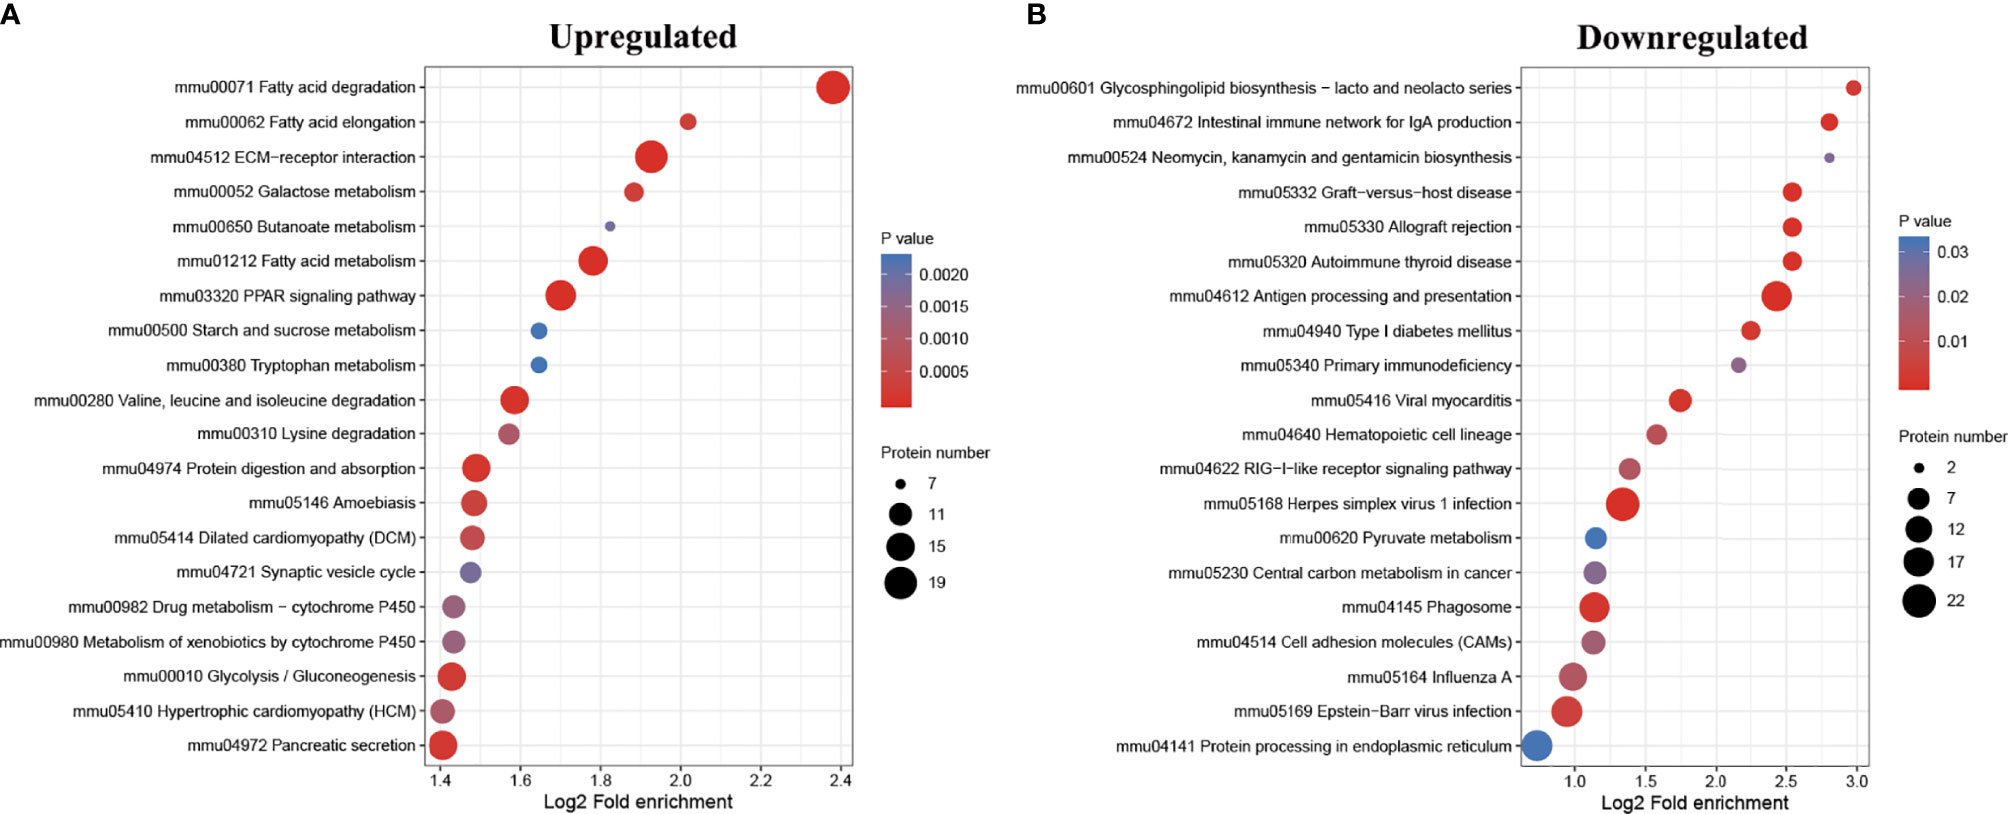
Figure 4 Kyoto Encyclopedia of Genes and Genomes (KEGG) pathway enrichment analysis of the differentially expressed proteins (DEPs). Bubble diagrams displaying the top 20 KEGG pathways for which upregulated (A) and downregulated (B) DEPs were significantly enriched, respectively. The y-axis shows the IDs and the names of the enriched pathways, and the x-axis shows the converted log2 fold enrichment. The size of the bubbles indicates the number of DEPs in each pathway.
Hierarchical Cluster Analysis
According to the degree of the fold change, the DEPs were divided into four groups: severely downregulated (Q1; FC ≤0.667), mildly downregulated (Q2; 0.667 < FC ≤0.769), mildly upregulated (Q3; 1.3 < FC ≤1.5), and severely upregulated (Q4; FC>1.5) (Figure 5A). Some severely downregulated DEPs were enriched for the antigen processing and presentation and intestinal immune network for IgA production pathways (Figure 5B). In the protein domain cluster analysis, some severely downregulated DEPs were enriched for major histocompatibility complex class II (MHC class II), major histocompatibility complex class I (MHC class I), and caspase-like domain (Figure 5C). In the GO cluster analysis, some severely downregulated DEPs were enriched for MHC class II, MHC class I, and immune response GO terms (Figures 5D–F).
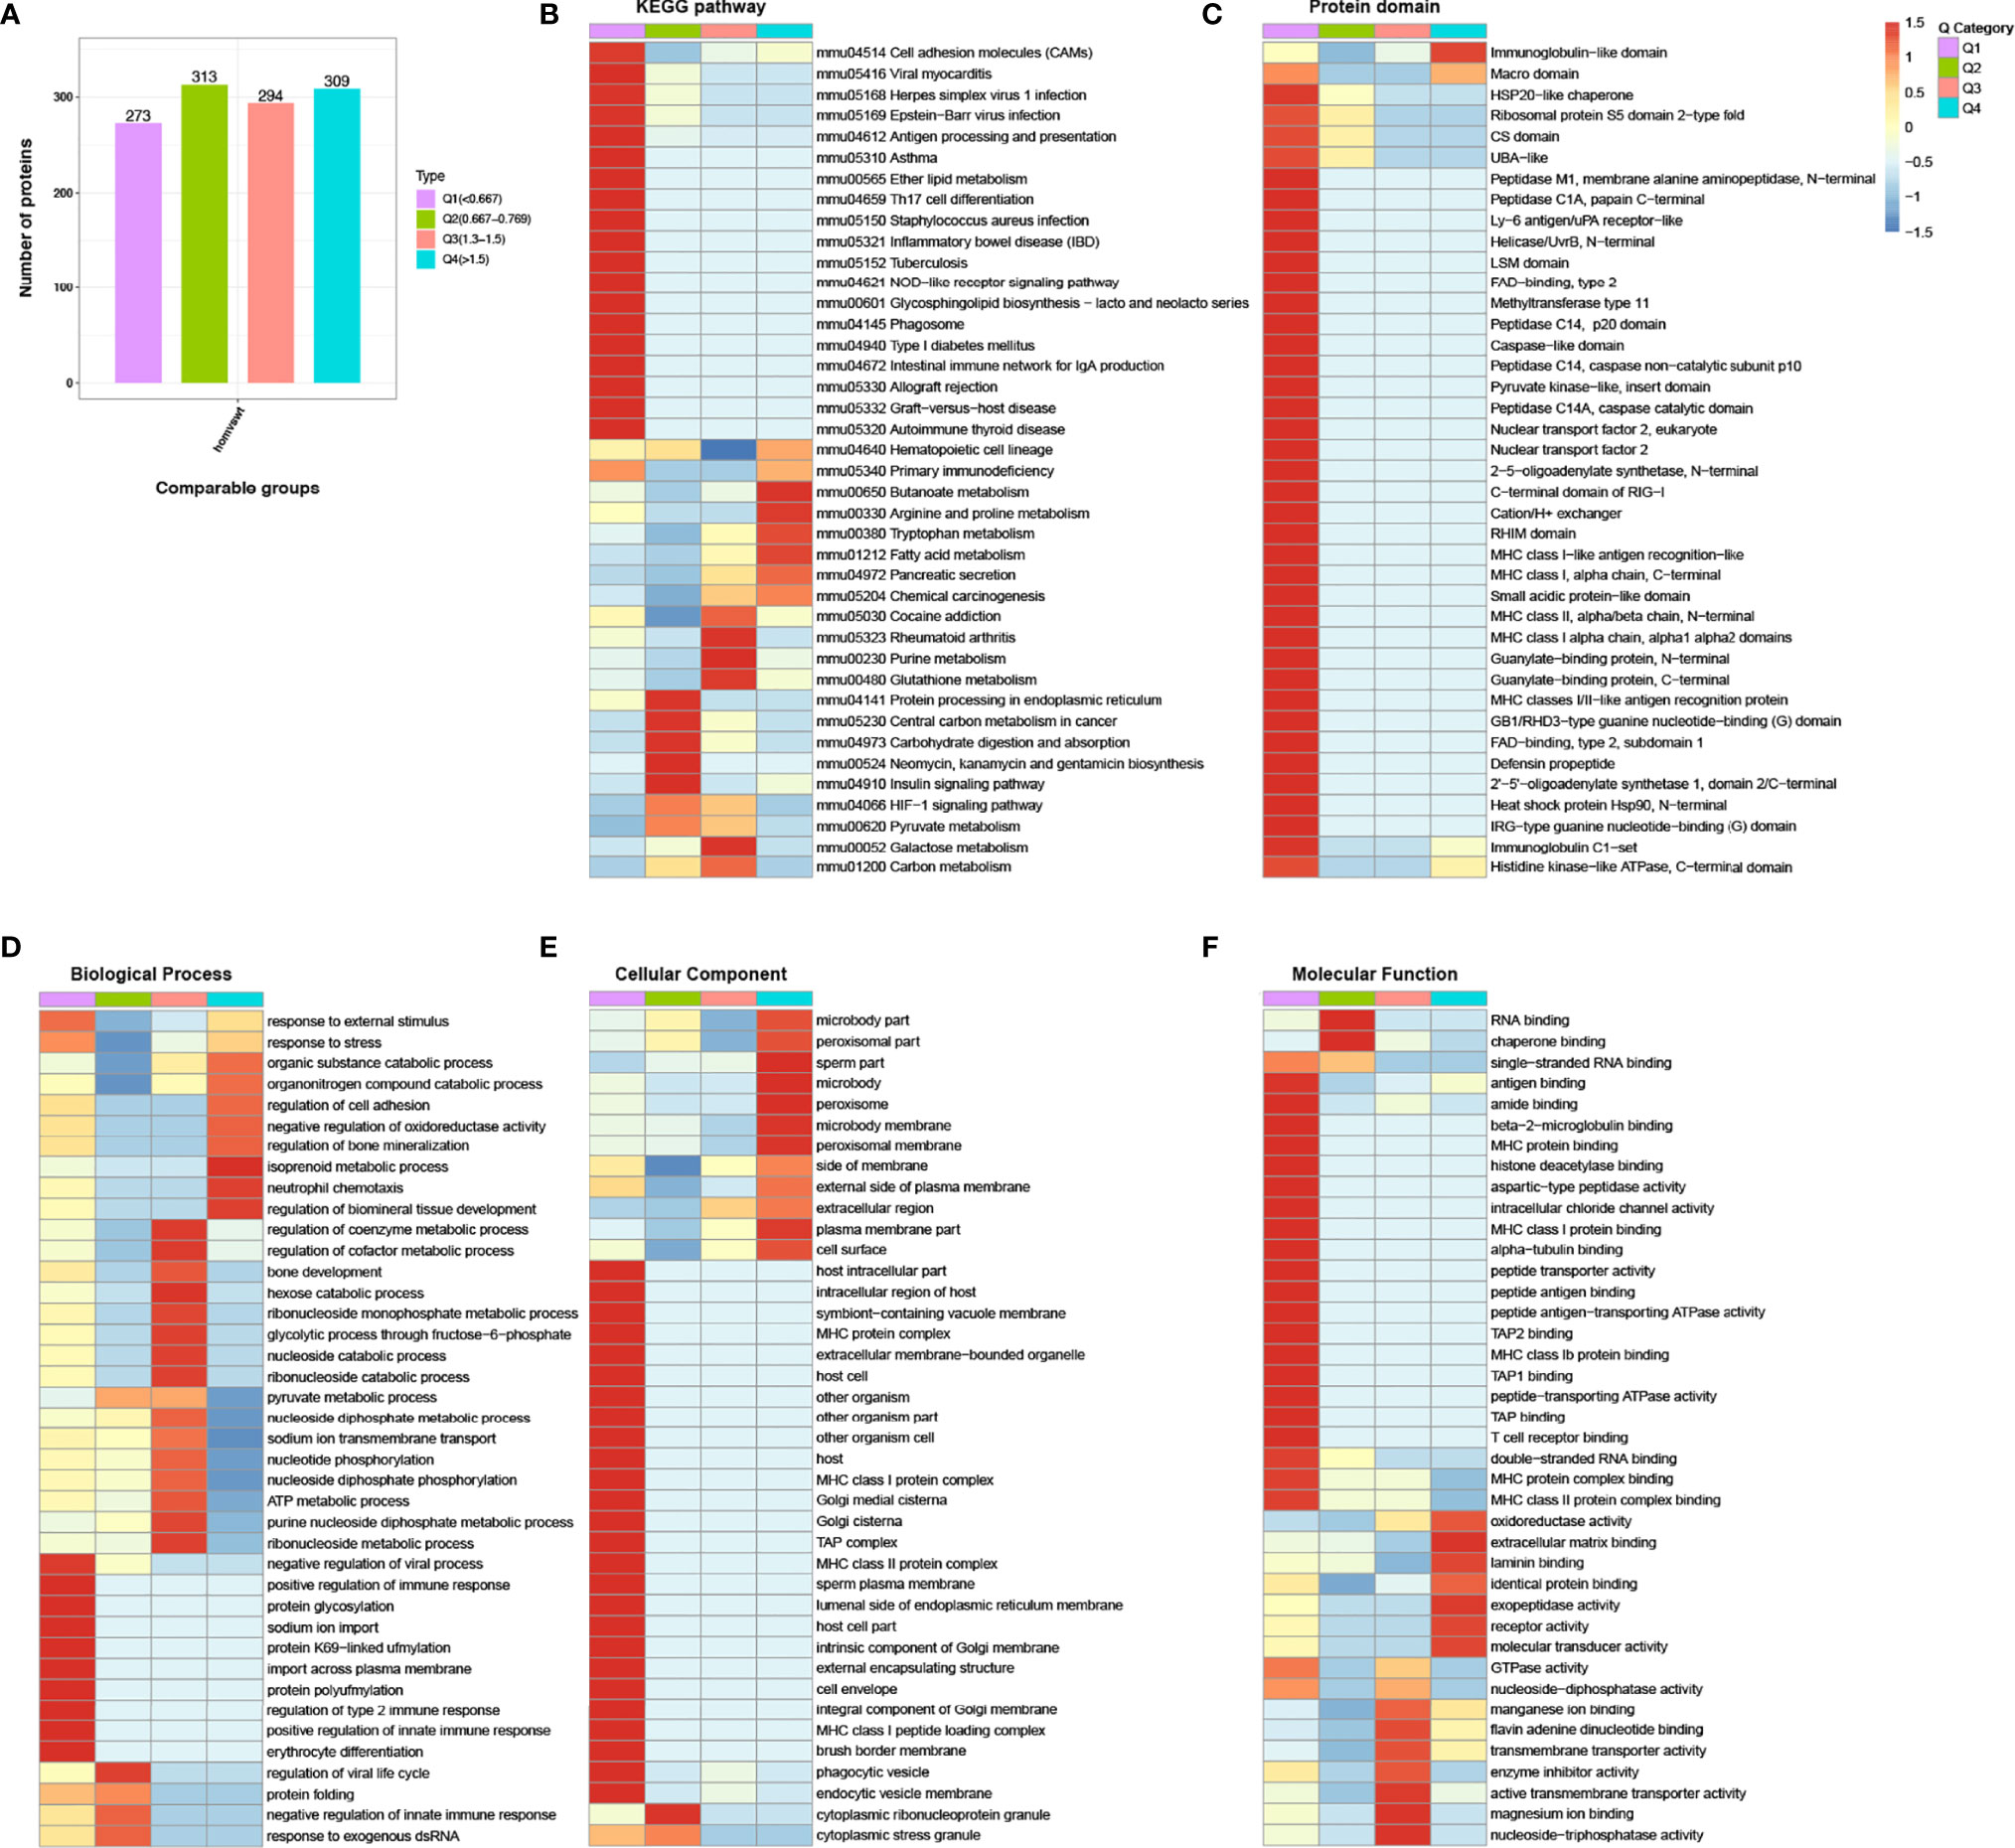
Figure 5 Hierarchical cluster analysis for the differentially expressed proteins (DEPs). (A) Fold change >1.30 or <0.77 and p <0.05 were set as the significant thresholds for the DEPs. According to the degree of fold change (FC), the DEPs were divided into four groups from Q1 to Q4. The different colors indicate the different Q categories: Q1 (FC ≤0.667, severely downregulated), Q2 (0.667 < FC ≤0.769, mildly downregulated), Q3 (1.3 < FC ≤1.5, mildly upregulated), and Q4 (FC>1.5, severely upregulated). (B) The distribution of Q categories in the Kyoto Encyclopedia of Genes and Genomes pathways. (C) The distribution of Q categories for the analysis of the protein domain. (D) The distribution of Q categories for the analysis of the biological process. (E) The distribution of Q categories for the analysis of the cellular component. (F) The distribution of Q categories for the analysis of the molecular function. The red color indicates stronger enrichment. The blue color indicates weaker enrichment.
PRM Validation
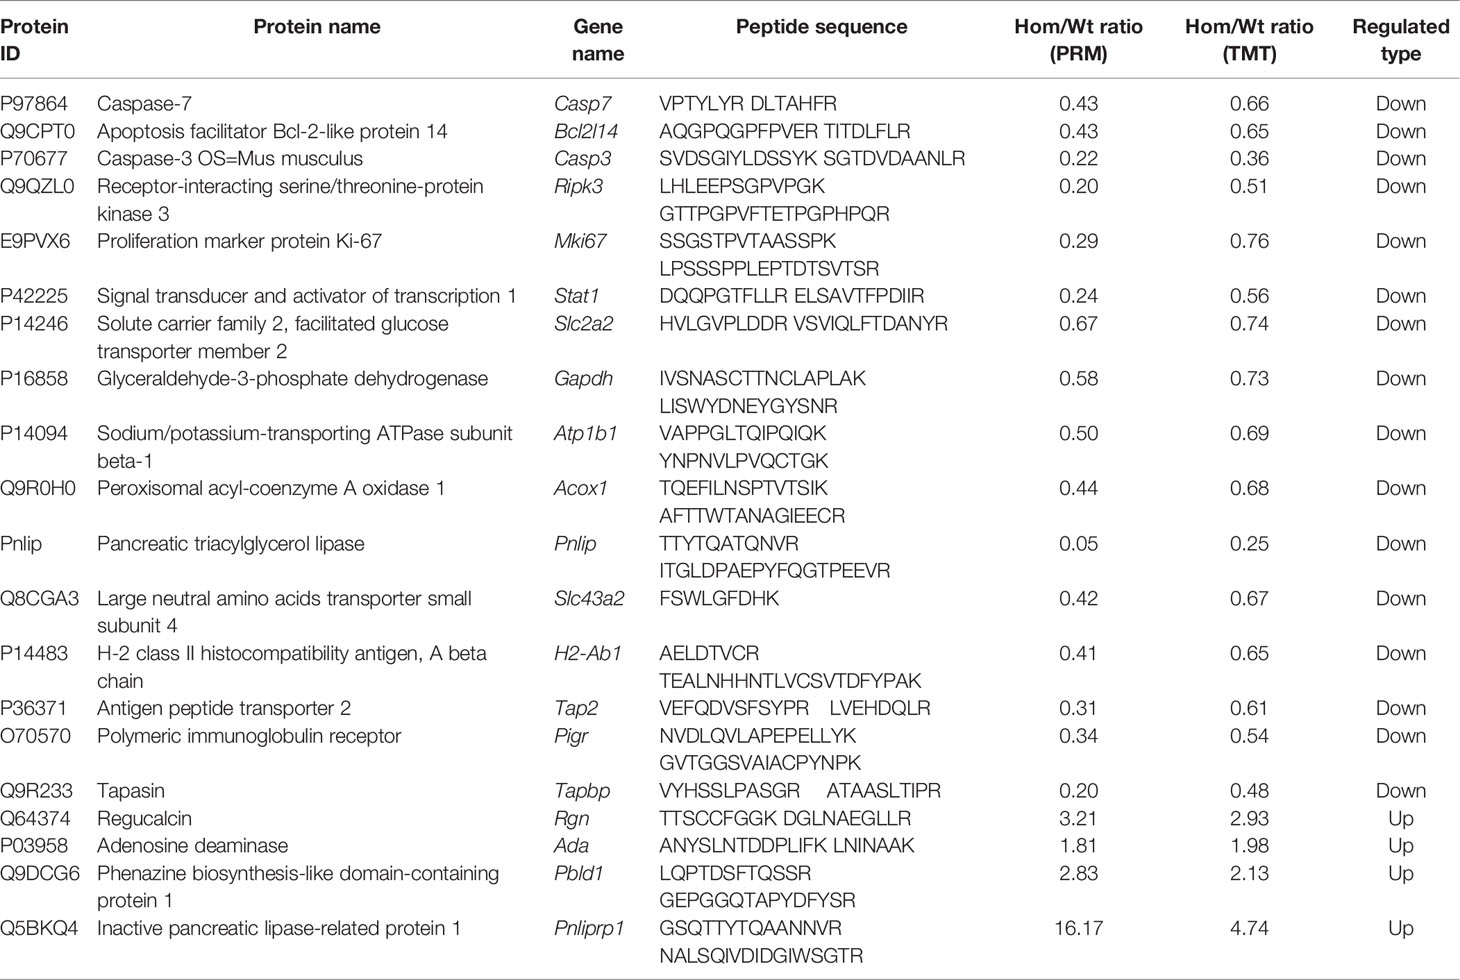
In order to verify our proteomic results, the protein levels of some genes reported to be regulated by T3 and the proteins that were enriched for GO terms or KEGG pathways were selected for parallel reaction monitoring (PRM) analysis. Validation by PRM analysis revealed that 20 proteins were significantly dysregulated in the Hom mice compared to Wt mice (Table 1). These proteins included caspase-3 (Casp3), caspase-7 (Casp7), and receptor-interacting serine/threonine-protein kinase 3 (Ripk3) for the apoptosis; proliferation marker protein Ki-67 (Mki67), regucalcin (Rgn), and adenosine deaminase (Ada) for cell proliferation; glyceraldehyde-3-phosphate dehydrogenase (Gapdh), glucose transporter type 2, liver (Glut-2), sodium/potassium-transporting ATPase subunit beta-1 (Atp1b1), inactive pancreatic lipase-related protein 1 (Pnliprp1), peroxisomal acyl-coenzyme A oxidase 1 (Acox1), pancreatic triacylglycerol lipase (Pnlip), and large neutral amino acid transporter small subunit 4 (Lat4) for nutrient metabolism; H-2 class II histocompatibility antigen, A beta chain (H2-Ab1), antigen peptide transporter 2 (Tap2), and Tapasin (Tapbp) for antigen processing and presentation; and polymeric immunoglobulin receptor (Pigr) for the intestinal immune network for IgA production. The PRM results showed that these candidate DEPs exhibited similar trends to those observed in the proteomic analysis, confirming the reliability of the proteomic data (Figure 6 and Table 1).
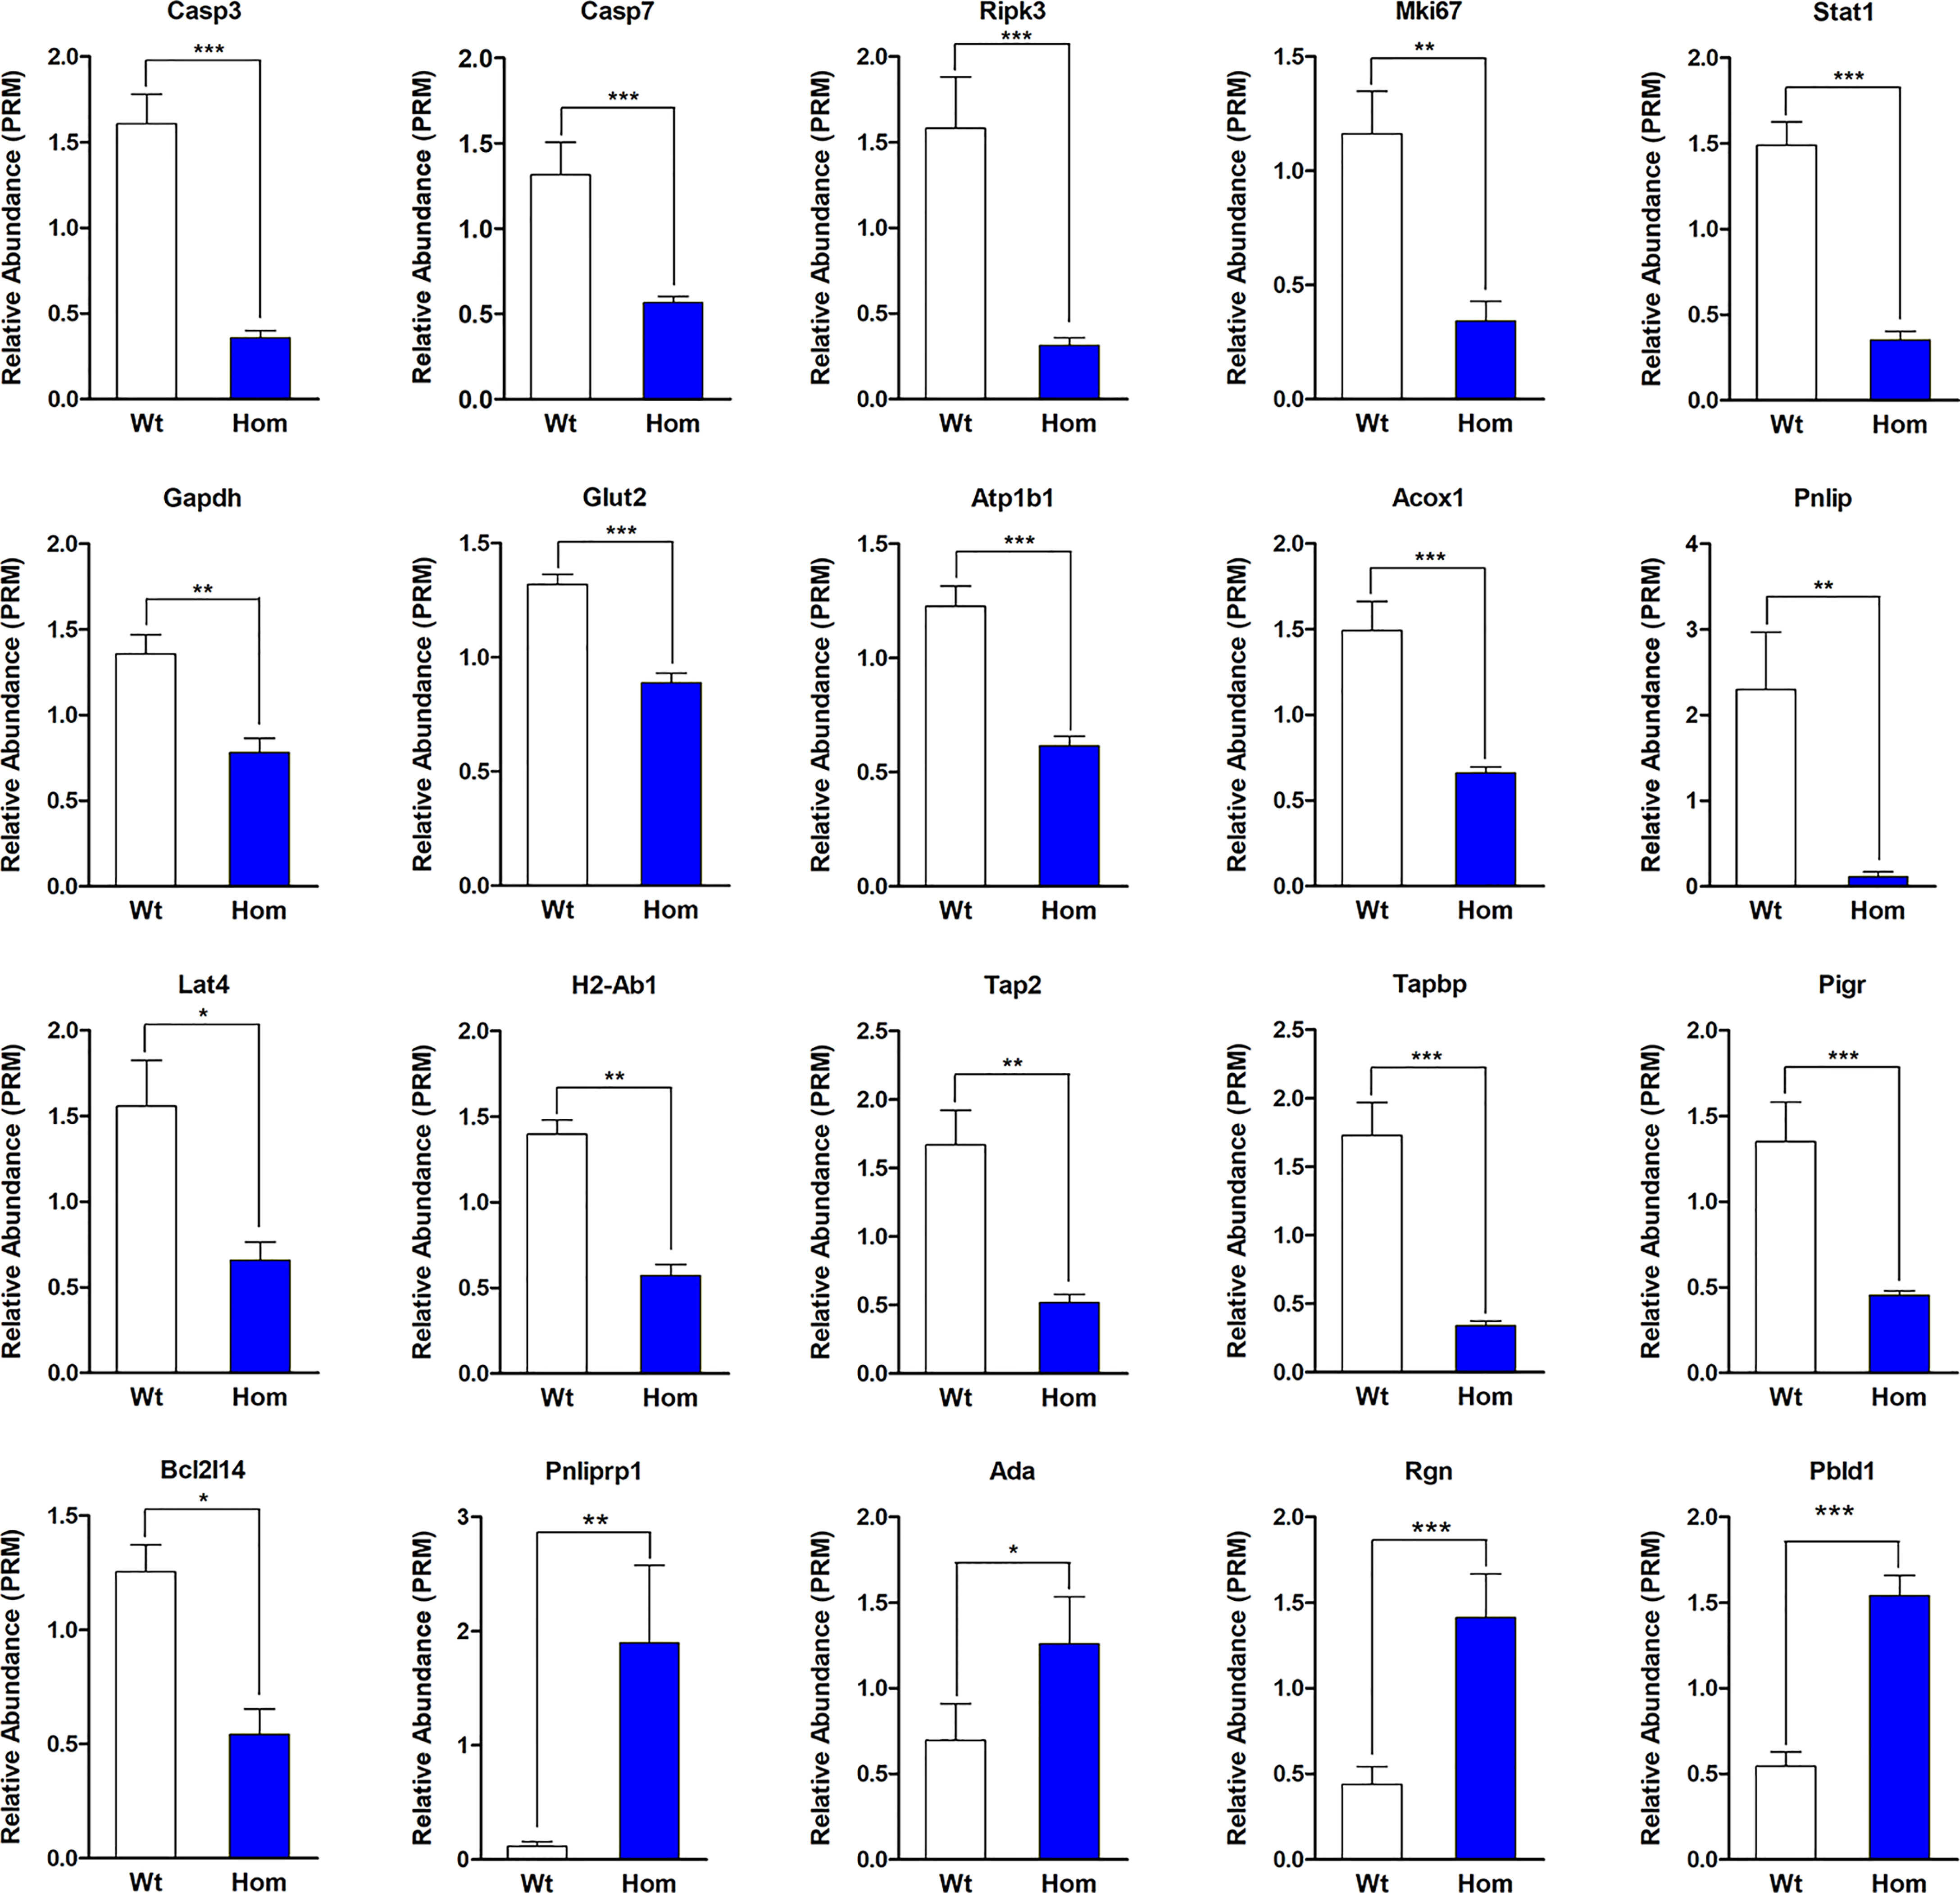
Figure 6 Validation by parallel reaction monitoring analysis. The absolute quantification levels of 20 differentially expressed proteins were evaluated in Thra+/+ (n = 4) and ThraE403X/E403X mice (n = 5). Data are presented as mean ± SEM. Statistical analysis was performed by Student’s t-test. *P < 0.05; **P < 0.01; ***P < 0.001.
Discussion
The small intestine of mammals undergoes a process of intestinal remodeling during lactation to ensure that the intestine can adapt to the transition from milk to a solid diet (24). Wen L et al. and Choi J et al. reported that T3 and TRα have indispensable roles during the intestinal remodeling of amphibian metamorphosis (25, 26). Thra-/- and Thra-/-Thrb-/- (TR double knockout) mutations in Xenopus tropicalis were shown to result in reduced larval epithelial cell apoptosis and reduced adult stem cell formation/proliferation during metamorphosis (27, 28). Similarly, cell proliferation in the crypt was found to be reduced in both Thra knockout mice and Pax8-/- mice (19, 20, 29). Recently, Yunbo Shi et al. reported that cell proliferation in the crypt and apoptosis on the villus were reduced in the adult intestine of ThraPV/+ mice, and they speculated that the decreased cell proliferation in the crypt could lead to less epithelial cell death on the villus (1, 30).
Consistent with these findings, our intestinal proteomics analysis and GO analysis revealed a significant enrichment for the GO term developmental process, while the caspase-like domain was markedly enriched in the protein domain cluster analysis. Casp3, Casp7, and Ripk3, which are involved in the positive regulation of apoptotic processes (31–33), were downregulated. Ada, which inhibits epithelial cell apoptosis at the villous tips (34), was upregulated. Mki67 is a known marker of cell proliferation, and Mki67 was proven to be a T3 positively regulated gene (35–37). Stat1, which is an important transcription factor, is involved in the regulation of cell proliferation (38). Both Mki67 and Stat1 were downregulated in the Hom mice, whereas Rgn, which negatively regulates cell proliferation, was upregulated (39). We speculate that these factors associated with cell proliferation and apoptosis could explain the dysplasia of the villi and the crypts of ThraE403X/E403X mice, but the underlying mechanism needs further investigation.
The small intestine is an important place for the digestion and absorption of nutrients, such as sugars, lipids, and proteins. A previous study reported that sucrase, lactase, and aminopeptidase enzymatic activities were decreased in purified the brush border membrane of the intestine of Thra-/- mice (24). Decreased lactase activity was also observed in the intestine of Pax8-/- mice (29). These results suggest that TRα mutations or thyroid hormone deficiency could affect the metabolism of proteins and carbohydrates.
In the present study, several processes related to nutrient metabolism, such as fatty acid degradation (mmu00071), fatty acid metabolism (mmu0121), fat digestion and absorption (mmu04975), starch and sucrose metabolism (mmu00500), and protein digestion and absorption (mmu04974), were found to be enriched. Glyceraldehyde-3-phosphate dehydrogenase (Gapdh), which is negatively regulated by T3, was downregulated in the homozygous mice and plays a role in glycolysis (40, 41). Glucose transporter type 2 (Glut-2), which is mainly expressed in the intestine and participates in the transcellular transport of glucose in the intestine, was downregulated. It has also been reported that Glut-2 plays an important role in maintaining glucose homeostasis and the development of the pancreas (42). Sodium/potassium-transporting ATPase subunit beta-1(Atp1b1) is a sodium and potassium pump that provides a concentration gradient for the glucose transporters to absorb glucose from the intestinal lumen into the blood (43, 44). Its downregulation may affect the absorption of glucose in the intestine. For lipid metabolism, the triglyceride lipase inhibitor Pnliprp1 was significantly upregulated, suggesting a decreased efficiency of triglyceride digestion and absorption in the ThraE403X/E403X mice (45). Furthermore, Acox1 and Pnlip, which are associated with long fatty acid catabolism and cholesterol absorption (46, 47), were downregulated in the ThraE403X/E403X mice. For amino acid metabolism, the large neutral amino acid transporter small subunit 4 (Lat4) was significantly downregulated. Lat4 is mainly present in the crypts and plays an important role in amino acid (AA) transport across the cellular barrier in intestinal development (48–50). We speculate that these proteins associated with the absorption of nutrients could be associated with the impaired postnatal development of the ThraE403X/E403X mice.
The intestine is the largest lymphoid tissue in the body. A striking feature of the intestinal innate immune system is its ability to generate large amounts of noninflammatory immunoglobulin A (IgA) antibodies, which serve as the first line of host defense against intestinal pathogens (51). Our proteomic results showed that most of the DEPs related to antigen processing and presentation and the intestinal immune network for IgA production pathways were downregulated. Some representative proteins were quantified and validated by PRM. H2-Ab1 plays an important role in the presentation of MHC class II molecular antigens (52–54). Tap2 is a transporter associated with antigen processing (TAP) and acts as a molecular scaffold essential for peptide-MHC class I assembly and antigen presentation in complex with Tap1. Either Tap2 mutation or Tap2 deficiency (Tap2-/-) shows severely reduced expression of human lymphocyte antigen class I proteins on the cell surface, which affects the process by which antigen-presenting cells present antigens to CD8 T and NK cells (55, 56). Tapbp ensures the proper assembly of MHC class I molecules by interacting with TAP, and its function is conserved in both human and mouse cells (57). Pigr binds polymeric IgA at the basolateral surface of epithelial cells and is then transported across the cell to be secreted at the apical surface. Secreted IgA promotes immune exclusion by entrapping dietary antigens and microorganisms in the mucus and functions as a neutralizer of toxins and pathogenic microbes (58). The reduced levels of proteins related to intestinal IgA production and antigen presentation process suggest that the innate and adaptive immune barriers in the intestine could be impaired in ThraE403X/E403X mice.
In conclusion, our intestinal proteomic data indicate that TRα1 may play an important role in intestinal development. Except for the association with cell proliferation and apoptosis along the crypt–villus axis, which have been reported by previous studies, our intestinal proteomic results provide promising candidates for future studies as they suggest novel mechanisms by which TRα1 may influence intestinal development, such as the transport of intestinal nutrients and the establishment of innate and adaptive immune barriers of the intestine.
Data Availability Statement
The datasets presented in this study can be found in online repositories. The names of the repository/repositories and accession number(s) can be found in the article/supplementary material.
Ethics Statement
The animal study was reviewed and approved by the animal experimentation ethics committee of the China Medical University. Written informed consent was obtained from the owners for the participation of their animals in this study.
Author Contributions
YX contributed to methodology and validation. DZ contributed to writing—original draft and review and editing. YL contributed to software and resources. ZS contributed to investigation and resources. XT contributed to formal analysis and validation. WT contributed to supervision and resources. All authors contributed to the article and approved the submitted version.
Funding
This study was supported by Chinese National Natural Science Foundation grants 81970681 and 81570711 to XT.
Conflict of Interest
The authors declare that the research was conducted in the absence of any commercial or financial relationships that could be construed as a potential conflict of interest.
Publisher’s Note
All claims expressed in this article are solely those of the authors and do not necessarily represent those of their affiliated organizations, or those of the publisher, the editors and the reviewers. Any product that may be evaluated in this article, or claim that may be made by its manufacturer, is not guaranteed or endorsed by the publisher.
Acknowledgments
We are very grateful to Pan Wang at Zhejiang University and Yadi Wang at Jinzhou Medical University, who helped us construct the graphs and modify the manuscript. We thank PTM-Biolabs Co., Ltd. (Hangzhou, China) for mass spectrometry analysis and help in preparing the manuscript. We would like to thank the native English-speaking scientists of Elixigen Company (Huntington Beach, CA, USA) for editing our manuscript.
References
1. Bao L, Roediger J, Park S, Fu L, Shi B, Cheng SY, et al. Thyroid Hormone Receptor Alpha Mutations Lead to Epithelial Defects in the Adult Intestine in a Mouse Model of Resistance to Thyroid Hormone. Thyroid (2019) 29(3):439–48. doi: 10.1089/thy.2018.0340
2. Shibata Y, Tanizaki Y, Shi YB. Thyroid Hormone Receptor Beta Is Critical for Intestinal Remodeling During Xenopus Tropicalis Metamorphosis. Cell Biosci (2020) 10:46. doi: 10.1186/s13578-020-00411-5
3. Wen L, Hasebe T, Miller TC, Ishizuya-Oka A, Shi YB. A Requirement for Hedgehog Signaling in Thyroid Hormone-Induced Postembryonic Intestinal Remodeling. Cell Biosci (2015) 5:13. doi: 10.1186/s13578-015-0004-3
4. Lazar MA. Thyroid Hormone Receptors: Multiple Forms, Multiple Possibilities. Endocr Rev (1993) 14(2):184–93. doi: 10.1210/edrv-14-2-184
5. Mendoza A, Hollenberg AN. New Insights Into Thyroid Hormone Action. Pharmacol Ther (2017) 173:135–45. doi: 10.1016/j.pharmthera.2017.02.012
6. Robinson-Rechavi M, Escriva Garcia H, Laudet V. The Nuclear Receptor Superfamily. J Cell Sci (2003) 116(Pt 4):585–6. doi: 10.1242/jcs.00247
7. Paul BD, Fu L, Buchholz DR, Shi YB. Coactivator Recruitment Is Essential for Liganded Thyroid Hormone Receptor to Initiate Amphibian Metamorphosis. Mol Cell Biol (2005) 25(13):5712–24. doi: 10.1128/MCB.25.13.5712-5724.2005
8. Yen PM, Ando S, Feng X, Liu Y, Maruvada P, Xia X. Thyroid Hormone Action at the Cellular, Genomic and Target Gene Levels. Mol Cell Endocrinol (2006) 246(1-2):121–7. doi: 10.1016/j.mce.2005.11.030
9. Lazar MA. Thyroid Hormone Action: A Binding Contract. J Clin Invest (2003) 112(4):497–9. doi: 10.1172/JCI19479
10. Ortiga-Carvalho TM, Sidhaye AR, Wondisford FE. Thyroid Hormone Receptors and Resistance to Thyroid Hormone Disorders. Nat Rev Endocrinol (2014) 10(10):582–91. doi: 10.1038/nrendo.2014.143
11. Koenig RJ, Lazar MA, Hodin RA, Brent GA, Larsen PR, Chin WW, et al. Inhibition of Thyroid Hormone Action by a Non-Hormone Binding c-erbA Protein Generated by Alternative mRNA Splicing. Nature (1989) 337(6208):659–61. doi: 10.1038/337659a0
12. Chassande O, Fraichard A, Gauthier K, Flamant F, Legrand C, Savatier P, et al. Identification of Transcripts Initiated From an Internal Promoter in the c-erbA Alpha Locus That Encode Inhibitors of Retinoic Acid Receptor-Alpha and Triiodothyronine Receptor Activities. Mol Endocrinol (1997) 11(9):1278–90. doi: 10.1210/mend.11.9.9972
13. Milanesi A, Lee JW, Kim NH, Liu YY, Yang A, Sedrakyan S, et al. Thyroid Hormone Receptor α Plays an Essential Role in Male Skeletal Muscle Myoblast Proliferation, Differentiation, and Response to Injury. Endocrinology (2016) 157(1):4–15. doi: 10.1210/en.2015-1443
14. Harvey CB, Bassett JH, Maruvada P, Yen PM, Williams GR. The Rat Thyroid Hormone Receptor (TR) Deltabeta3 Displays Cell-, TR Isoform-, and Thyroid Hormone Response Element-Specific Actions. Endocrinology (2007) 148(4):1764–73. doi: 10.1210/en.2006-1248
15. Williams GR. Cloning and Characterization of Two Novel Thyroid Hormone Receptor Beta Isoforms. Mol Cell Biol (2000) 20(22):8329–42. doi: 10.1128/MCB.20.22.8329-8342.2000
16. Frau C, Godart M, Plateroti M. Thyroid Hormone Regulation of Intestinal Epithelial Stem Cell Biology. Mol Cell Endocrinol (2017) 459:90–7. doi: 10.1016/j.mce.2017.03.002
17. Diaz de Barboza G, Guizzardi S, Tolosa de Talamoni N. Molecular Aspects of Intestinal Calcium Absorption. World J Gastroenterol (2015) 21(23):7142–54. doi: 10.3748/wjg.v21.i23.7142
18. FABRE M, MARESCAUX J. Research on the Sensitivity of the Thyroid Gland of the Tadpole (Rana Temporaria) to Thyreostimuline. C R Seances Soc Biol Fil (1960) 154:1625–8.
19. Fraichard A, Chassande O, Plateroti M, Roux JP, Trouillas J, Dehay C, et al. The T3R Alpha Gene Encoding a Thyroid Hormone Receptor Is Essential for Post-Natal Development and Thyroid Hormone Production. EMBO J (1997) 16(14):4412–20. doi: 10.1093/emboj/16.14.4412
20. Gauthier K, Plateroti M, Harvey CB, Williams GR, Weiss RE, Refetoff S, et al. Genetic Analysis Reveals Different Functions for the Products of the Thyroid Hormone Receptor Alpha Locus. Mol Cell Biol (2001) 21(14):4748–60. doi: 10.1128/MCB.21.14.4748-4760.2001
21. Liang Y, Zhao D, Wang R, Dang P, Xi Y, Zhang D, et al. Generation and Characterization of a New Resistance to Thyroid Hormone Mouse Model With Thyroid Hormone Receptor Alpha Gene Mutation. Thyroid (2021) 31(4):678–91. doi: 10.1089/thy.2019.0733
22. Gang H, Xiao C, Xiao Y, Yan W, Bai R, Ding R, et al. Proteomic Analysis of the Reduction and Resistance Mechanisms of Shewanella Oneidensis MR-1 Under Long-Term Hexavalent Chromium Stress. Environ Int (2019) 127:94–102. doi: 10.1016/j.envint.2019.03.016
23. Peterson AC, Russell JD, Bailey DJ, Westphall MS, Coon JJ. Parallel Reaction Monitoring for High Resolution and High Mass Accuracy Quantitative, Targeted Proteomics. Mol Cell Proteomics (2012) 11(11):1475–88. doi: 10.1074/mcp.O112.020131
24. Plateroti M, Chassande O, Fraichard A, Gauthier K, Freund JN, Samarut J, et al. Involvement of T3Ralpha- and Beta-Receptor Subtypes in Mediation of T3 Functions During Postnatal Murine Intestinal Development. Gastroenterology (1999) 116(6):1367–78. doi: 10.1016/S0016-5085(99)70501-9
25. Wen L, Shibata Y, Su D, Fu L, Luu N, Shi YB. Thyroid Hormone Receptor α Controls Developmental Timing and Regulates the Rate and Coordination of Tissue-Specific Metamorphosis in Xenopus Tropicalis. Endocrinology (2017) 158(6):1985–98. doi: 10.1210/en.2016-1953
26. Choi J, Ishizuya-Oka A, Buchholz DR. Growth, Development, and Intestinal Remodeling Occurs in the Absence of Thyroid Hormone Receptor α in Tadpoles of Xenopus Tropicalis. Endocrinology (2017) 158(6):1623–33. doi: 10.1210/en.2016-1955
27. Tanizaki Y, Shibata Y, Zhang H, Shi YB. Analysis of Thyroid Hormone Receptor α-Knockout Tadpoles Reveals That the Activation of Cell Cycle Program Is Involved in Thyroid Hormone-Induced Larval Epithelial Cell Death and Adult Intestinal Stem Cell Development During Xenopus Tropicalis Metamorphosis. Thyroid (2021) 31(1):128–42. doi: 10.1089/thy.2020.0022
28. Shibata Y, Tanizaki Y, Zhang H, Lee H, Dasso M, Shi YB. Thyroid Hormone Receptor Is Essential for Larval Epithelial Apoptosis and Adult Epithelial Stem Cell Development But Not Adult Intestinal Morphogenesis During Xenopus Tropicalis Metamorphosis. Cells (2021) 10(3):536. doi: 10.3390/cells10030536
29. Flamant F, Poguet AL, Plateroti M, Chassande O, Gauthier K, Streichenberger N, et al. Congenital Hypothyroid Pax8(-/-) Mutant Mice Can Be Rescued by Inactivating the TRalpha Gene. Mol Endocrinol (2002) 16(1):24–32. doi: 10.1210/mend.16.1.0766
30. Bao L, Shi B, Shi YB. Intestinal Homeostasis: A Communication Between Life and Death. Cell Biosci (2020) 10:66. doi: 10.1186/s13578-020-00429-9
31. Küper C, Bartels H, Beck FX, Neuhofer W. Cyclooxygenase-2-Dependent Phosphorylation of the Pro-Apoptotic Protein Bad Inhibits Tonicity-Induced Apoptosis in Renal Medullary Cells. Kidney Int (2011) 80(9):938–45. doi: 10.1038/ki.2011.199
32. Lakhani SA, Masud A, Kuida K, Porter GA Jr, Booth CJ, Mehal WZ, et al. Caspases 3 and 7: Key Mediators of Mitochondrial Events of Apoptosis. Science (2006) 311(5762):847–51. doi: 10.1126/science.1115035
33. Newton K, Dugger DL, Wickliffe KE, Kapoor N, de Almagro MC, Vucic D, et al. Activity of Protein Kinase RIPK3 Determines Whether Cells Die by Necroptosis or Apoptosis. Science (2014) 343(6177):1357–60. doi: 10.1126/science.1249361
34. Migchielsen AA, Breuer ML, van Roon MA, te Riele H, Zurcher C, Ossendorp F, et al. Adenosine-Deaminase-Deficient Mice Die Perinatally and Exhibit Liver-Cell Degeneration, Atelectasis and Small Intestinal Cell Death. Nat Genet (1995) 10(3):279–87. doi: 10.1038/ng0795-279
35. Manzano J, Cuadrado M, Morte B, Bernal J. Influence of Thyroid Hormone and Thyroid Hormone Receptors in the Generation of Cerebellar Gamma-Aminobutyric Acid-Ergic Interneurons From Precursor Cells. Endocrinology (2007) 148(12):5746–51. doi: 10.1210/en.2007-0567
36. Deng SB, Jing XD, Wei XM, Du JL, Liu YJ, Qin Q, et al. Triiodothyronine Promotes the Proliferation of Epicardial Progenitor Cells Through the MAPK/ERK Pathway. Biochem Biophys Res Commun (2017) 486(2):372–7. doi: 10.1016/j.bbrc.2017.03.048
37. Giardino L, Bettelli C, Calzà L. In Vivo Regulation of Precursor Cells in the Subventricular Zone of Adult Rat Brain by Thyroid Hormone and Retinoids. Neurosci Lett (2000) 295(1-2):17–20. doi: 10.1016/S0304-3940(00)01580-9
38. Gaudet P, Livstone MS, Lewis SE, Thomas PD. Phylogenetic-Based Propagation of Functional Annotations Within the Gene Ontology Consortium. Brief Bioinform (2011) 12(5):449–62. doi: 10.1093/bib/bbr042
39. Vaz CV, Marques R, Maia CJ, Socorro S. Aging-Associated Changes in Oxidative Stress, Cell Proliferation, and Apoptosis Are Prevented in the Prostate of Transgenic Rats Overexpressing Regucalcin. Transl Res (2015) 166(6):693–705. doi: 10.1016/j.trsl.2015.08.009
40. Manchado M, Infante C, Asensio E, Cañavate JP. Differential Gene Expression and Dependence on Thyroid Hormones of Two Glyceraldehyde-3-Phosphate Dehydrogenases in the Flatfish Senegalese Sole (Solea Senegalensis Kaup). Gene (2007) 400(1-2):1–8. doi: 10.1016/j.gene.2007.05.008
41. Barroso I, Benito B, Garcí-Jiménez C, Hernández A, Obregón MJ, Santisteban P. Norepinephrine, Tri-Iodothyronine and Insulin Upregulate Glyceraldehyde-3-Phosphate Dehydrogenase mRNA During Brown Adipocyte Differentiation. Eur J Endocrinol (1999) 141(2):169–79. doi: 10.1530/eje.0.1410169
42. Guillam MT, Hümmler E, Schaerer E, Yeh JI, Birnbaum MJ, Beermann F, et al. Early Diabetes and Abnormal Postnatal Pancreatic Islet Development in Mice Lacking Glut-2. Nat Genet (1997) 17(3):327–30. doi: 10.1038/ng1197-327
43. Horisberger JD, Lemas V, Kraehenbühl JP, Rossier BC. Structure-Function Relationship of Na,K-ATPase. Annu Rev Physiol (1991) 53:565–84. doi: 10.1146/annurev.ph.53.030191.003025
44. Wright EM, Loo DD, Hirayama BA. Biology of Human Sodium Glucose Transporters. Physiol Rev (2011) 91(2):733–94. doi: 10.1152/physrev.00055.2009
45. Hecker N, Sharma V, Hiller M. Convergent Gene Losses Illuminate Metabolic and Physiological Changes in Herbivores and Carnivores. Proc Natl Acad Sci USA (2019) 116(8):3036–41. doi: 10.1073/pnas.1818504116
46. Fan CY, Pan J, Chu R, Lee D, Kluckman KD, Usuda N, et al. Hepatocellular and Hepatic Peroxisomal Alterations in Mice With a Disrupted Peroxisomal Fatty Acyl-Coenzyme A Oxidase Gene. J Biol Chem (1996) 271(40):24698–710. doi: 10.1074/jbc.271.40.24698
47. Huggins KW, Camarota LM, Howles PN, Hui DY. Pancreatic Triglyceride Lipase Deficiency Minimally Affects Dietary Fat Absorption But Dramatically Decreases Dietary Cholesterol Absorption in Mice. J Biol Chem (2003) 278(44):42899–905. doi: 10.1074/jbc.M303422200
48. Bodoy S, Martín L, Zorzano A, Palacín M, Estévez R, Bertran J. Identification of LAT4, a Novel Amino Acid Transporter With System L Activity. J Biol Chem (2005) 280(12):12002–11. doi: 10.1074/jbc.M408638200
49. Guetg A, Mariotta L, Bock L, Herzog B, Fingerhut R, Camargo SM, et al. Essential Amino Acid Transporter Lat4 (Slc43a2) Is Required for Mouse Development. J Physiol (2015) 593(5):1273–89. doi: 10.1113/jphysiol.2014.283960
50. Rajendran A, Poncet N, Oparija-Rogenmozere L, Herzog B, Verrey F. Tissue-Specific Deletion of Mouse Basolateral Uniporter LAT4 (Slc43a2) Reveals Its Crucial Role in Small Intestine and Kidney Amino Acid Transport. J Physiol (2020) 598(22):5109–32. doi: 10.1113/JP280234
51. Cerutti A, Rescigno M. The Biology of Intestinal Immunoglobulin A Responses. Immunity (2008) 28(6):740–50. doi: 10.1016/j.immuni.2008.05.001
52. Perraudeau M, Taylor PR, Stauss HJ, Lindstedt R, Bygrave AE, Pappin DJ, et al. Altered Major Histocompatibility Complex Class II Peptide Loading in H2-O-Deficient Mice. Eur J Immunol (2000) 30(10):2871–80. doi: 10.1002/1521-4141(200010)30:10<2871::AID-IMMU2871>3.0.CO;2-B
53. Alfonso C, Han JO, Williams GS, Karlsson L. The Impact of H2-DM on Humoral Immune Responses. J Immunol (2001) 167(11):6348–55. doi: 10.4049/jimmunol.167.11.6348
54. Martin WD, Hicks GG, Mendiratta SK, Leva HI, Ruley HE, Van Kaer L. H2-M Mutant Mice Are Defective in the Peptide Loading of Class II Molecules, Antigen Presentation, and T Cell Repertoire Selection. Cell (1996) 84(4):543–50. doi: 10.1016/S0092-8674(00)81030-2
55. Lapenna A, Omar I, Berger M. A Novel Spontaneous Mutation in the TAP2 Gene Unravels Its Role in Macrophage Survival. Immunology (2017) 150(4):432–43. doi: 10.1111/imm.12694
56. Vitale M, Zimmer J, Castriconi R, Hanau D, Donato L, Bottino C, et al. Analysis of Natural Killer Cells in TAP2-Deficient Patients: Expression of Functional Triggering Receptors and Evidence for the Existence of Inhibitory Receptor(s) That Prevent Lysis of Normal Autologous Cells. Blood (2002) 99(5):1723–9. doi: 10.1182/blood.V99.5.1723
57. Grandea AG 3rd, Comber PG, Wenderfer SE, Schoenhals G, Früh K, Monaco JJ, et al. Sequence, Linkage to H2-K, and Function of Mouse Tapasin in MHC Class I Assembly. Immunogenetics (1998) 48(4):260–5. doi: 10.1007/s002510050430
Keywords: thyroid hormone receptor, intestine, proteomic analysis, bioinformatic, parallel reaction monitoring analysis
Citation: Xi Y, Zhang D, Liang Y, Shan Z, Teng X and Teng W (2022) Proteomic Analysis of the Intestinal Resistance to Thyroid Hormone Mouse Model With Thyroid Hormone Receptor Alpha Mutations. Front. Endocrinol. 13:773516. doi: 10.3389/fendo.2022.773516
Received: 28 September 2021; Accepted: 24 March 2022;
Published: 28 April 2022.
Edited by:
Takashi Yazawa, Asahikawa Medical University, JapanReviewed by:
Yun-Bo Shi, National Institutes of Health (NIH), United StatesYuta Tanizaki, National Institutes of Health (NIH), United States
Copyright © 2022 Xi, Zhang, Liang, Shan, Teng and Teng. This is an open-access article distributed under the terms of the Creative Commons Attribution License (CC BY). The use, distribution or reproduction in other forums is permitted, provided the original author(s) and the copyright owner(s) are credited and that the original publication in this journal is cited, in accordance with accepted academic practice. No use, distribution or reproduction is permitted which does not comply with these terms.
*Correspondence: Xiaochun Teng, dGVuZ3hpYW9jaHVuQDEyNi5jb20=; Weiping Teng, dHdwQHZpcC4xNjMuY29t
 Yue Xi
 Dan Zhang
 Yue Liang
 Zhongyan Shan1
 Xiaochun Teng
 Weiping Teng