 Yu-Lin Shih
 Chin-Chuan Shih2
 Jau-Yuan Chen
- 1Department of Family Medicine, Chang-Gung Memorial Hospital, Taoyuan, Taiwan
- 2General Administrative Department, United Safety Medical Group, New Taipei, Taiwan
- 3College of Medicine, Chang Gung University, Taoyuan, Taiwan
Background: Plasma leptin is considered a risk factor for obesity and cardio-metabolic disease, but the link between serum leptin and renal function is still under evaluation. In our study, we focused on the relationship between serum leptin and renal function, and we investigated the relationship in more detail.
Methods: The 396 middle-aged and elderly Taiwanese adults recruited for our health survey were the subject of our research. All participants agreed to participate and signed a consent form before they joined and completed our study. We divided the participants into three groups according to eGFR tertiles and analyzed the parameters between each group. Then, we used Pearson’s correlation test to investigate the relationship between eGFR levels and cardio-metabolic risk factors with adjustment for age. The scatter plot indicates the trend between serum leptin levels and eGFR levels. Participants were reclassified into three subgroups according to their leptin levels and the bar chart reveals the prevalence of chronic kidney disease (CKD) in each group. Finally, we used multivariate linear regression to evaluate the relationship between serum leptin and eGFR levels with adjustment for age, sex, smoking status, drinking status, body mass index (BMI), uric acid levels, hypertension (HTN), diabetes mellitus (DM), and dyslipidemia.
Results: In our study, we analyzed the data from 396 eligible participants. A total of 41.4% of the participants were male, and the average age of all participants was 64.81 years ( ± 8.78). The participants in the high eGFR group were more likely to have lower serum leptin levels. Furthermore, eGFR values were negatively correlated with serum leptin levels even after adjustment for age. The prevalence of CKD in the high serum leptin group was higher than that in the low serum leptin group. Serum leptin levels showed significant negative correlations with eGFR levels (β=-0.14, p<0.01) in the multivariate linear regression after adjusting for age, sex, smoking status, drinking status, BMI, uric acid levels, HTN, DM, and dyslipidemia.
Conclusion: According to our study, serum leptin levels show a negative relationship with eGFR levels in middle-aged and elderly people in Taiwan. In addition, high serum leptin levels could be an novel marker to survey kidney failure in clinical practices.
1 Introduction
Obesity has a high prevalence in modern society (1). Many chronic diseases, such as cardiovascular diseases or metabolic syndrome, are linked to obesity, and the mechanisms between these chronic diseases and obesity have been described in previous studies (2, 3). On the other hand, CKD is another heavy burden on the health system, especially when patients enter end-stage renal disease. CKD has been considered a risk factor for other chronic diseases, such as coronary artery disease (4). Obesity also has a negative effect on renal function. Studies have revealed that obesity can compromise renal function (5).
Leptin is a small peptide hormone that is mainly released by adipocyte tissue and encoded by the obese (ob) gene (6). The discovery of leptin increases the importance of adipocytes, which were only previously considered as energy storing cells. With leptin, adipocytes play a crucial role in endocrinology (7). Leptin mainly acts as negative feedback to suppress appetite and reduce fat storage (8). The basic physiological function of leptin is controlling energy balance in the body, and the leptin level is positively related to the amount of body adipocyte tissue (9). Moreover, the pathophysiological role of leptin was also revealed by recent studies. For example, leptin resistance can be found in many overweight patients and exacerbates their obesity, which leads to metabolic disorders (10). Moreover, many studies indicate the relationship between obesity and chronic kidney disease, but the pathophysiology between obesity and renal function impairment is underdeveloped (11). In addition, leptin is a small peptide that is cleared by the kidney, so renal function also has an impact on the homeostasis of plasma leptin (12). On the other hands, some studies indicated that leptin can elevate blood pressure (13), trigger inflammation (14), and increase glomeruloslcerosis (15). Those mechanism may explained the relationship between leptin levels and renal function. However, aging is an important risk factor for many chronic disease, including kidney failure. There is no research focus on age population, which is vulnerable to chronic kidney disease. In our community-based study, we investigated leptin, which is considered a biomarker of obesity, in association with CKD in middle-aged and elderly people in northern Taiwan. Our results can provide a potential direction for future research and a possible reference for primary care.
2 Materials and methods
2.1 Study design and participants
This was a cross-sectional and community-based health survey project conducted in 2019 in northern Taiwan, and the participants were all from this project. The health survey project was held in several clinics in different communities, and we chose the candidates in a consecutive manner. Then, the participants were selected from those candidates under including and excluding criteria. The inclusion criteria were as follows: (1) individuals who agreed to participate in the study (2) individuals who lived in the community; (3) individuals between 50 and 85 years of age; (4) individuals who were able to complete a questionnaire; and (5) individuals who can complete examinations. The exclusion criteria were (1) a history of recent heart disease; (2) missing or incomplete data; (3) failing to finish the examination or questionnaire, or (4) withdrawal during the study. The flowchart which we used to select the participants is presented in Figure 1. Every participant was informed and signed an informed consent form before they entered the study. Ultimately, a total of 396 subjects were recruited for our study. All of the participants completed the questionnaire during a face-to-face interview and provided blood and urine samples. This study was approved by the Chang Gung Medical Foundation Institutional Review Board (IRB) (IRB No.: 201801803B0).
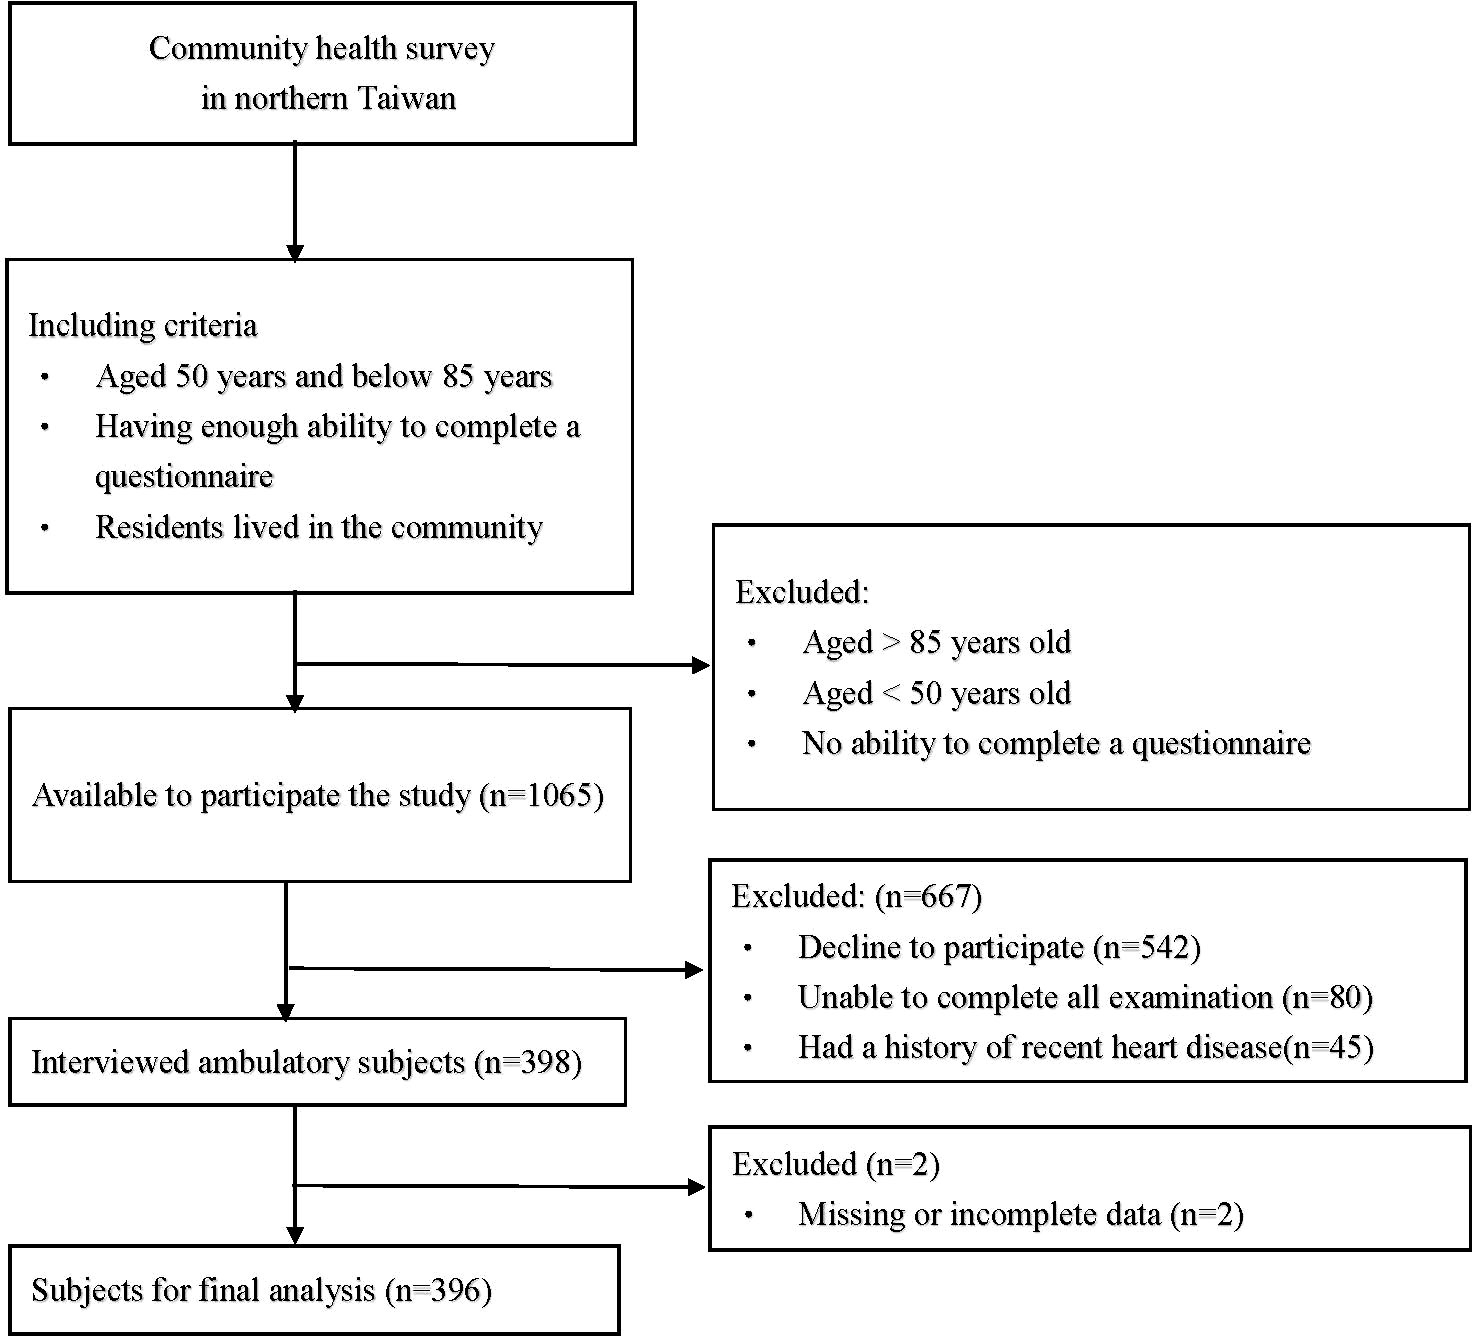
Figure 1 Flow chart of study subjects.
2.2 Data collection and laboratory measurements
The content of the questionnaire included sex, age, drinking status, smoking status, body weight, and body height. The health survey collected hypertension (HTN), diabetes mellitus (DM), and dyslipidemia data. Resting systolic blood pressure (SBP, mmHg) and diastolic blood pressure (DBP, mmHg) were measured at rest at least two times. The following biochemical laboratory parameters were analyzed at the Roche® model lab at Taiwan E&Q Clinical Laboratory: leptin (ng/mL), estimated glomerular filtration rate (eGFR, ml/min/1.73 m2), creatinine (mg/dl), uric acid (mg/dl), fasting plasma glucose (FPG, mg/dl), and triglycerides (mg/dl). The leptin level (ng/mL) was analyzed by Enzyme-linked Immunosorbent Assay using Invitrogen™ Human Leptin. Body mass index (BMI) was calculated as the person’s weight in kilograms divided by the square of their height in meters.
2.3 Definitions of CKD, DM, HTN and dyslipidemia
CKD was defined as the presence of kidney damage (urine ACR ≥30 mg/g) or decreased renal function with an eGFR <60 mL/min/1.73 m2 (31) (16). DM was defined as a fasting plasma glucose level ≥126 mg/dL or the use of oral hypoglycemic agents or insulin therapy (17). HTN was defined as an SBP ≥140 mmHg, a DBP ≥90 mmHg, or the use of treatment for HTN (18). Dyslipidemia was defined as an LDL-C level ≥130 mg/dL, an HDL-C level <40 mg/dL in men or <50 mg/dL in women, a TG level ≥150 mg/dL, a TC level ≥200 mg/dL, or the use of lipid-lowering medication (19).
2.4 Statistical analysis
Participants were divided into three groups according to eGFR level: a low eGFR level group (eGFR < 78.2 ml/min/1.73 m2), middle low eGFR level group (78.2 ml/min/1.73 m2 ≤ eGFR ≤ 94.3 ml/min/1.73 m2), and high eGFR level (94.3 ml/min/1.73 m2 < eGFR) group. In Table 1, we used Shapiro-Wilk normality test to check the normality of continuous data. The continuous variables that were consistent with normal distribution were presented as mean ± [SD], and the p-values were calculated by one-way ANOVA; the continuous variables that did not conform with normal distribution were presented as median (Q1, Q3), and the p-values were derived from Kruskal-Wallis ANOVA; categorical variables are expressed as n (%) and were analyzed by the chi-square test. Pearson’s correlation coefficient was used to analyze correlations between eGFR levels and leptin levels, age, FPG levels, triglyceride levels, SBP, BMI, and uric acid levels; Pearson’s correlation adjusted by age was also performed. The scatter plot illustrates the trend between eGFR and serum leptin levels. In addition, we further calculated the prevalence of CKD according to the three levels of leptin. Finally, a multivariate linear regression was performed to evaluate the association between leptin and eGFR levels after adjusting for age, sex, smoking status, drinking status, BMI, uric acid levels, HTN, DM, and dyslipidemia. In our study, a p value of < 0.05 was considered statistically significant. All statistical analyses were performed using SPSS for Windows (IBM Corp. Released 2011. IBM SPSS Statistics, version 25.0. Armonk, NY: IBM Corp.)
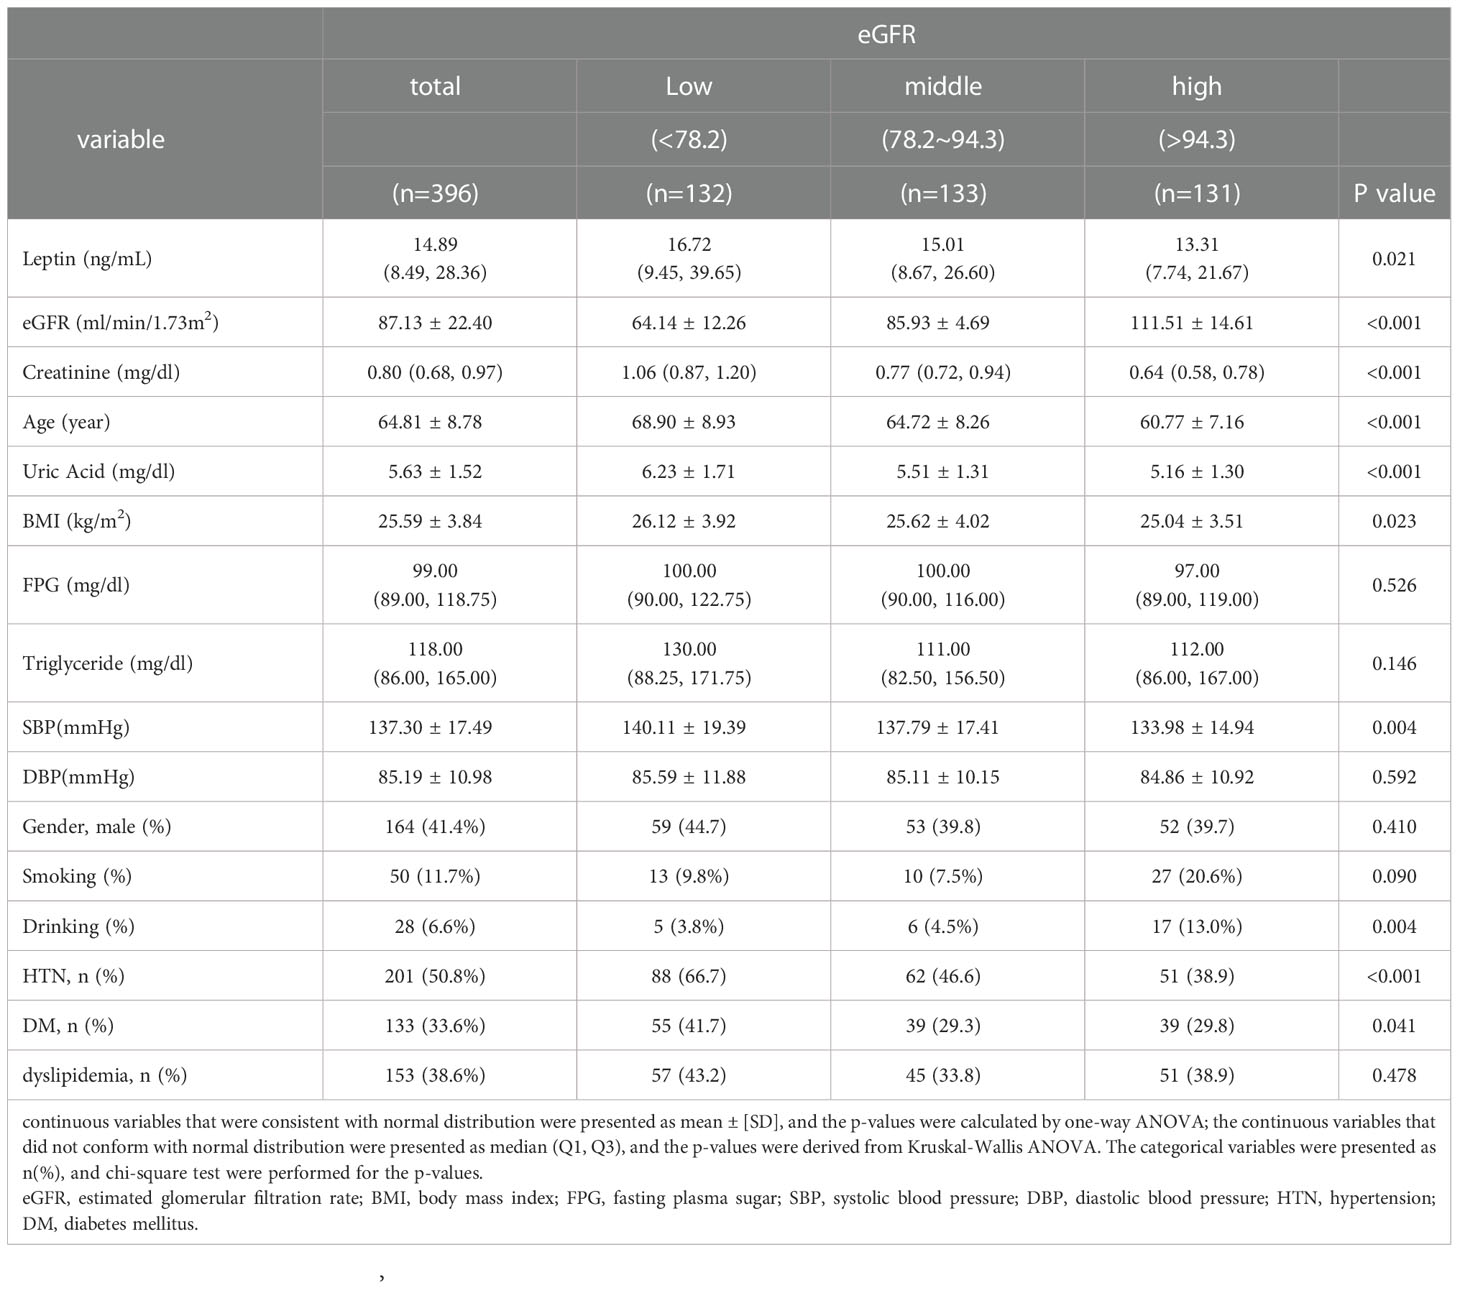
Table 1 General characteristics of the study population according to tertiles of eGFR.
3 Results
The data were collected from middle-aged and elderly people from communities in northern Taiwan. A total of 396 individuals, including 164 (41.4%) men and 232 (58.6%) women with a mean age of 64.81 ± 8.78 years, were enrolled for analysis. Table 1 demonstrates the demographic and clinical characteristics of our study group. The participants were categorized into one of three subgroups according to their eGFR: a low eGFR group (<78.2 ml/min/1.73 m2), middle eGFR group (78.2~94.3 ml/min/1.73 m2), and high eGFR group (>94.3 ml/min/1.73 m2). The average eGFR and leptin levels of our study group were 87.13 ± 22.40 ml/min/1.73 m2 and 14.89 (8.49, 28.36) ng/ml, respectively. There was no statistically significant difference in FPG levels, triglyceride levels, DBP, sex, or dyslipidemia among the low, middle, and high eGFR subgroups. The participants in the low eGFR group were more likely to have a higher leptin concentration, creatinine concentration, age, uric acid concentration, BMI, SBP, possibility of HTN, and possibility of DM.
Table 2 further shows the correlations between eGFR levels and various cardio-reno-metabolic risk factors with Pearson’s correlation. eGFR levels were negatively correlated with leptin levels, age, SBP, BMI, and uric acid levels. eGFR levels did not have a significant relationship with FPG or triglyceride levels in our study. However, only leptin levels, BMI, and uric acid levels remained statistically significant after adjusting for age. Figure 2 shows the relationship between leptin levels and eGFR levels. Pearson’s correlation coefficient was -0.221 with a p value<0.001.
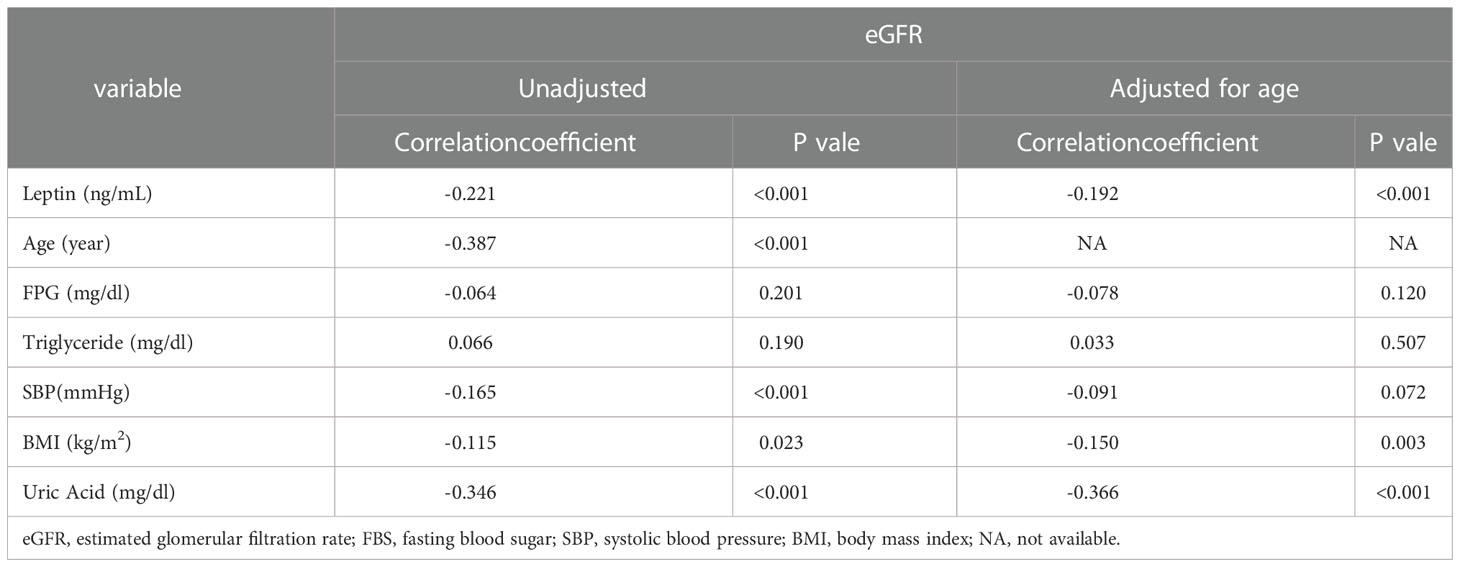
Table 2 The Pearson’s Correlation between eGFR and serum leptin level.
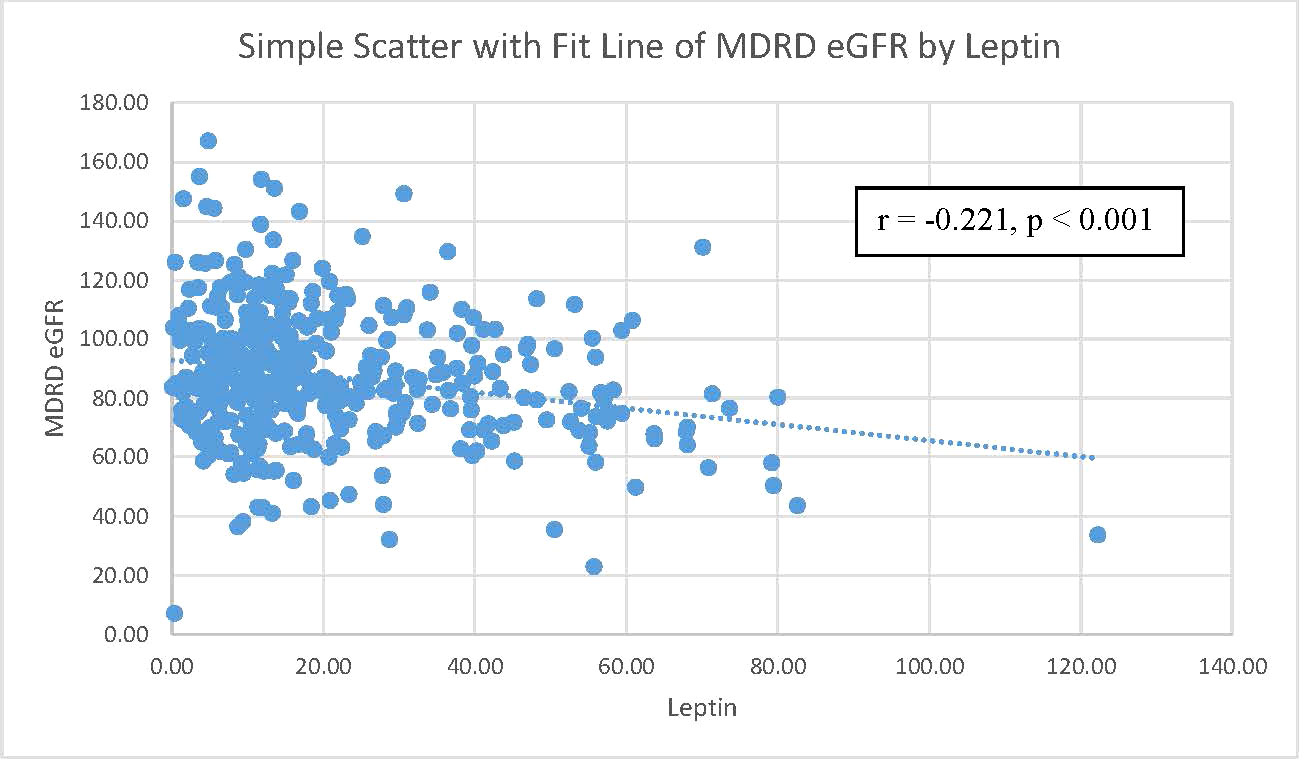
Figure 2 The correlation between MDRD eGFR and leptin level. Notes: a scatterplot of MDRD eGFR by leptin level. The Pearson’s correlation coefficient was 0.221 with a p-value=0.001. MDRD eGFR, Modification of Diet in Renal Disease Study equation estimated glomerular filtration rate.
To investigate the relationship between leptin levels and CKD, we reclassified the participants into three subgroups according to their leptin levels: a low leptin level group (<15.1 ng/mL), middle leptin level group (15.1~57.0 ng/mL), and high leptin level group (>57.0 ng/mL). Then, we calculated the percentage of CKD in each subgroup, and the results are shown in Figure 3. There was a linear increasing trend across leptin tertiles, with a p value for trend of 0.034. The prevalence of CKD risk was significantly greater in the groups with higher leptin levels. The negative relationship between renal function and leptin levels led us to speculate that there is an association between eGFR and leptin levels.
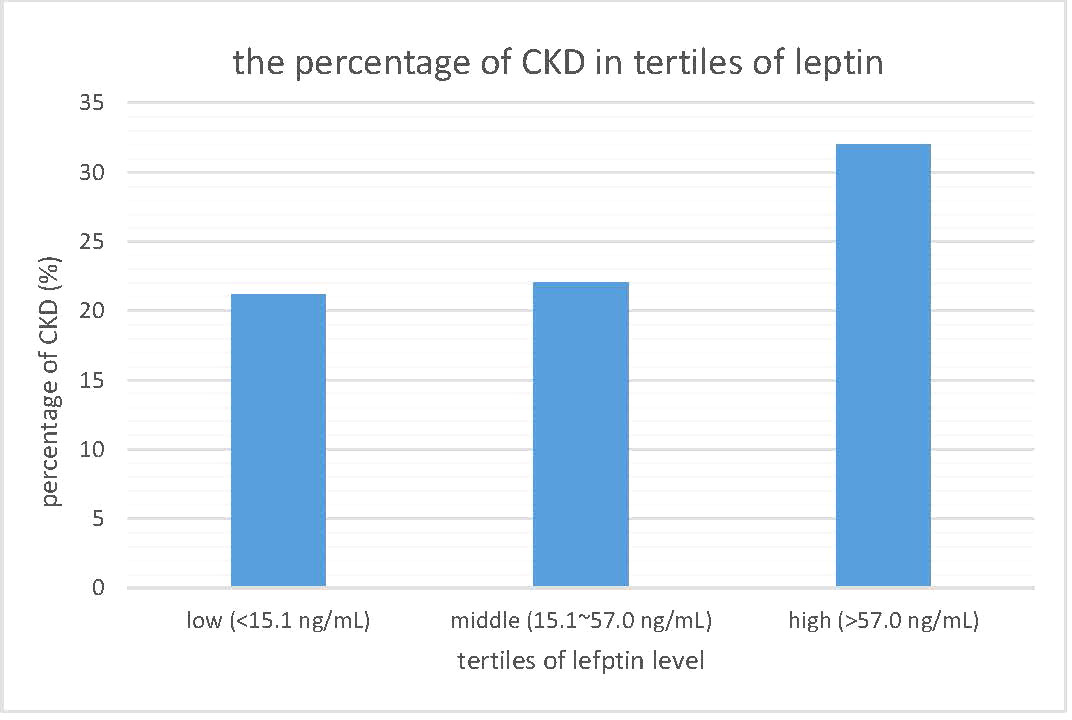
Figure 3 The prevalence of chronic kidney disease in tertiles of leptin level. CKD, chronic kidney disease.
Table 3 presents the association of eGFR and leptin levels, showing that leptin levels were significantly negatively correlated with eGFR levels in both simple and multiple linear regression models that were adjusted. The association persisted even after adjustment for age, sex, smoking status, drinking status, BMI, uric acid levels, HTN, DM, and dyslipidemia.
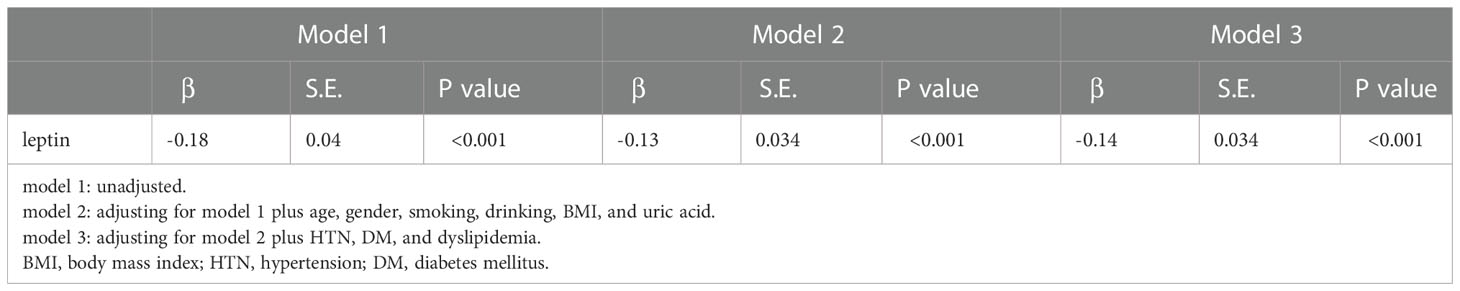
Table 3 Association between leptin and eGFR in multivariate linear regression.
4 Discussion
The eGFR indicates the ability of the kidneys to remove toxins and metabolites, including uric acid and creatinine, which also act as parameters in calculating eGFR (20). A low eGFR will elevate serum creatinine and uric acid. In Table 1, we also found elevated plasma creatinine and uric acid levels in the high plasma leptin group. From a previous medical study, renal function declined steadily with age (21), and our study showed a similar result: the low eGFR group tended to be older. Obesity is another risk factor for renal function impairment (22). There is much research describing how obesity compromises renal function, including lipid toxicity (23), inflammatory stress (24), adipokines (25), and oxidative stress (26). Our research also showed a higher BMI in the low eGFR group. High blood pressure elevates intercapillary flows and causes progressive glomerular damage, followed by in situ inflammation or even microthrombosis. Eventually, elevated blood pressure decreases eGFR levels (27). As shown in Table 1, the lower eGFR group tended to have a higher prevalence of HTN and higher SBP. Our result corresponds with previous studies. DM is another risk factor for renal function impairment (28). As shown in Table 1, the low eGFR group tends to have higher prevalence of DM and this result was mentioned in previous studies, which demonstrates the loss of podocytes, basement membrane disruption and glomerular sclerosis in DM patients (29). Importantly, we noted a statistically significant increase in serum leptin levels in the low eGFR group. This result evoked our curiosity about the relationship between serum leptin levels and renal function.
Table 2 focuses on the relationship between eGFR and other parameters. Pearson’s correlation coefficients are shown in Table 2. eGFR levels were negatively correlated with serum leptin levels, age, SBP, BMI, and uric acid levels. Among these parameters, only serum leptin levels, BMI, and uric acid levels still remained significantly negatively related to eGFR levels. The scatter plot in Figure 2 demonstrates the Pearson’s correlation between serum leptin levels and eGFR levels with a Pearson’s correlation coefficient of -0.221 and a p value <0.001. As shown in Figure 3, we divided participants into three subgroups according to their leptin level: the low leptin level group (<15.1 ng/mL), middle leptin level group (15.1~57.0 ng/mL), and high leptin level group (>57.0 ng/mL). We found that the high serum leptin group tended to have a higher prevalence of CKD. Based on our previous findings, we explored the relationship between eGFR and serum leptin levels while considering other parameters.
As we mentioned in Table 1, there are many parameters that can affect eGFR levels, including creatinine levels, age, uric acid levels, BMI, SBP, HTN, and DM. Obesity has a strong relationship with DM (30), and excessive fat tissue will lead to the secretion of more leptin (31). Taking these relationships into consideration, multivariate linear regression was used (see Table 3) to weight the relationship between eGFR and serum leptin levels with the adjustment of other parameters. After adjusting for age, sex, smoking status, drinking status, BMI, uric acid levels, HTN, DM, and dyslipidemia, serum leptin levels and eGFR levels were still negatively correlated, with a regression coefficient of -0.14 and p value <0.001.
Leptin is a small peptide hormone that is mainly produced by adipocytes and regulates energy homeostasis (32). Moreover, leptin also regulates other physiological functions in peripheral tissue, such as the release of other neurotransmitters (33), the modulation of insulin function (34) and angiogenesis (35), and the modification of the immune system (36). Recent studies also revealed that leptin can be produced by other tissues, including the stomach, skeletal muscles, pituitary gland, and mammary gland (37). The kidney is responsible for leptin clearance (12), and leptin contributes to the pathophysiology of the kidney. Accumulating data indicate that leptin has direct and indirect effects on the kidney, which may deteriorate renal function.
Leptin can elevate sympathetic nervous activity. In an animal model, mice that overexpressed leptin had high blood pressure and increased catecholamine excretion in their urine. Previous research found that the neuron that secretes proopiomelanocortin is also a target of leptin (37). α-melanocyte-stimulating hormone and β-endorphin, which may activate sympathetic activity and mean arterial pressure, are both derived from proopiomelanocortin (38). Hypertension is a risk factor for CKD. Prolonged high blood pressure damages the endothelium and eventually causes glomerulosclerosis, which leads to compromised renal function (39). Indeed, we observed high systolic blood pressure and elevated leptin levels in the low eGFR group.
The kidney is also affected by leptin directly. Further investigation revealed that leptin can induce the messenger ribonucleic acid (mRNA) of transforming-factor-β1 (TGF-β1) and increase the secretion of TGF-β1 in glomerular endothelial cells. Leptin also amplifies the expression of TGF-β1 type II receptors and sensitizes mesangial cells to TGF-β1 (40). Then, TGF-β1 from the glomerular endothelium acts in a paracrine manner to increase the production of collagen from sensitized mesangial cells. Excessive collagen deposition in the extracellular matrix may disrupt the function of the glomerulus and eventually contribute to proteinuria and glomerulosclerosis (41).
Leptin also triggers the inflammatory process, and recent studies have also indicated the regulatory function of leptin on the immune response. Leptin can increase proinflammatory cytokines, including interleukin-1 (IL-1), tumor necrosis factor-α (TNF-α), and interleukin-6 (IL-6) (42, 43). These proinflammatory cytokines in turn trigger adipocytes to secrete more leptin and proinflammatory cytokines, such as TNF-α (44). On the other hand, leptin also regulates T-cell immunity by increasing Th1 cytokine production and suppressing Th2 cytokine production (45). These immunological stimuli cause chronic inflammation in patients with hyperleptinemia. Eventually, the proinflammatory status compromises renal function.
In recent studies, leptin demonstrated the ability to induce the intracellular accumulation of reactive oxygen species (ROS). Leptin causes intracellular accumulation of reactive oxygen species (ROS) (46), which are associated with activation of the JNK/SAPK-dependent pathway and the redox-sensitive transcription factor NF-κB (47). This consequence indicates that leptin plays a major role in the accumulation of ROS in endothelial cells. It is possible that the hyperleptinemia may also trigger renal oxidative stress and leads to kidney damage.
There are several novelties in our research. First, aging is the main risk factor for many chronic diseases, including kidney failure, and the aged populations are vulnerable to kidney failure (48). Previous studies found the relationship between leptin levels and chronic kidney diseases, but we focused on the vulnerable populations, the middle-aged and elderly adults. Plus, we recruited the participants from the community, so our result can truly represent the situation of the middle-aged and elderly population in the community. Our result provide useful information for disease prevention and screening in clinical practices. Second, we designed our research with clear outlet, sufficient sample size, enough and important confounders, and meticulous data analysis. However, our study still had several limitations. Regarding the medication, although we recorded the medication of the participants, many participants can not totally recall their medication, including analgesics. This shortcoming compromised our medication data, so we excluded the data on medication to preserve the integrity of the data during the analysis. Another common limitation is that our participants were all selected from northern Taiwan, so the selection bias should be aware. Future research which uses larger population and includes the medication would make the result more robust.
5 Conclusion
According to our study, serum leptin levels show a negative relationship with eGFR levels in middle-aged and elderly people in Taiwan. In addition, high serum leptin levels could be an novel marker to survey kidney failure in clinical practices.
Data availability statement
The raw data supporting the conclusions of this article will be made available by the authors, without undue reservation.
Ethics statement
The studies involving human participants were reviewed and approved by Chang Gung Medical Foundation Institutional Review Board. The patients/participants provided their written informed consent to participate in this study.
Author contributions
Y-LS and J-YC composed and conducted the study. C-CS helped with data collection. J-YC provided instruction and consultation. Project administration: J-YC and Y-LS. Y-LS processed and analyzed the data. Y-LS and S-Y-FC finished academic writing. Y-LS completed the publication process. All authors contributed to the article and approved the submitted version.
Funding
This study was supported by United Safety Medical Group (USGN2019001).
Acknowledgments
We thank American Journal Experts (https://www.aje.com/) for English language editing.
Conflict of interest
The authors declare that the research was conducted in the absence of any commercial or financial relationships that could be construed as a potential conflict of interest.
Publisher’s note
All claims expressed in this article are solely those of the authors and do not necessarily represent those of their affiliated organizations, or those of the publisher, the editors and the reviewers. Any product that may be evaluated in this article, or claim that may be made by its manufacturer, is not guaranteed or endorsed by the publisher.
References
1. Abella V. Leptin in the interplay of inflammation, metabolism and immune system disorders. Nat Rev Rheumatol (2017) 13(2):100–9. S.-G.-R. doi: 10.1038/nrrheum.2016.209
2. Adya RT. Differential effects of leptin and adiponectin in endothelial angiogenesis. J Diabetes Res (2015) 2015:648239. doi: 10.1155/2015/648239
3. Agrawal SG. Leptin activates human b cells to secrete TNF-α, IL-6, and IL-10 via JAK2/STAT3 and p38MAPK/ERK1/2 signaling pathway. J Clin Immunol (2011) 31(3):472–8. doi: 10.1007/s10875-010-9507-1
4. Al-Goblan AS-A. Mechanism linking diabetes mellitus and obesity. Diabetes Metab Syndr Obesity: Targets Ther (2014) 7:587. doi: 10.2147/DMSO.S67400
5. Amann K, Benz K. Structural renal changes in obesity and diabetes. In: Seminars in nephrology (2013) 33:23–33. doi: 10.1016/j.semnephrol.2012.12.003
6. Bell BB. Differential contribution of POMC and AgRP neurons to the regulation of regional autonomic nerve activity by leptin. Mol Metab (2018) 8:1–12. doi: 10.1016/j.molmet.2017.12.006
7. Briffa JF. Adipokines as a link between obesity and chronic kidney disease. Am J Physiol-Renal Physiol (2013) 305(12):F1629–36. doi: 10.1152/ajprenal.00263.2013
8. Canale MP. Obesity-related metabolic syndrome: Mechanisms of sympathetic overactivity. Int J Endocrinol (2013) 2013:865965. doi: 10.1155/2013/865965
9. Lakkis JI, Weir MR. Obesity and kidney disease. Prog Cardiovasc Dis (2018) 61(2):157–67. doi: 10.1016/j.pcad.2018.07.005
10. Chiang CE. 2015 guidelines of the Taiwan society of cardiology and the Taiwan hypertension society for the management of hypertension. J Chin Med Assoc (2015) 78(1):1–47. doi: 10.1016/j.jcma.2014.11.005
11. Clark KA. Effects of central and systemic administration of leptin on neurotransmitter concentrations in specific areas of the hypothalamus. Am J Physiol-Regul Integr Comp Physiol (2006) 290(2):R306–12. doi: 10.1152/ajpregu.00350.2005
12. Decreased G. Definition and classification of CKD. Kidney Int (2013) 3:19–62. doi: 10.1038/kisup.2012.64
13. Shi Z, Stornetta RL, Stornetta DS, Abbott SB, Brooks VL. The arcuate nucleus: A site of synergism between angiotensin II and leptin to increase sympathetic nerve activity and blood pressure in rats. Neurosci Lett (2022) 785:136773. doi: 10.1016/j.neulet.2022.136773
14. Dessie G, Ayelign B, Akalu Y, Shibabaw T, Molla MD. Effect of leptin on chronic inflammatory disorders: Insights to therapeutic target to prevent further cardiovascular complication. Diabetes Metab Syndr Obesity: Targets Ther (2021) 14:3307. doi: 10.2147/DMSO.S321311
15. Park YC, Lee S, Kim YS, Park JM, Han K, Lee H, et al. Serum leptin level and incidence of CKD: A longitudinal study of adult enrolled in the Korean genome and epidemiology study (KoGES). BMC Nephrol (2022) 23(1):1–9. doi: 10.1186/s12882-022-02795-7
16. Díaz BB, Rodríguez IM, González DA, Pérez MDCR, de León AC. An overview of leptin and the Th1/Th2 balance. Open J Immunol (2014) (2):42–50. doi: 10.4236/oji.2014.42006
17. Dülger HA. Serum levels of leptin and proinflammatory cytokines in patients with gastrointestinal cancer. Int J Clin Pract (2004) 58(6):545–9. doi: 10.1111/j.1368-5031.2004.00149.x
18. Flack JM, Adekola B. Blood pressure and the new ACC/AHA hypertension guidelines. Trends Cardiovasc Med (2020) 30(3):160–4. doi: 10.1016/j.tcm.2019.05.003
19. Friedman J. Leptin at 20: An overview. J Endocrinol (2014) 223(1):T1–8. doi: 10.1530/JOE-14-0405
20. Friedman JM. Leptin and the endocrine control of energy balance. Nat Metab (2019) 1(8):754–64. doi: 10.1038/s42255-019-0095-y
21. Gansevoort RT-R. Chronic kidney disease and cardiovascular risk: Epidemiology, mechanisms, and prevention. Lancet (2013) 382(9889):339–52. doi: 10.1016/S0140-6736(13)60595-4
22. Gheith OF-O. Diabetic kidney disease: World wide difference of prevalence and risk factors. J Nephropharmacol (2016) 5(1):49. doi: 10.4103/1110-9165.197379
23. Grams ME. A meta-analysis of the association of estimated GFR, albuminuria, age, race, and sex with acute kidney injury. Am J Kidney Dis (2015) 66(4):591–601. doi: 10.1053/j.ajkd.2015.02.337
24. Hales CM. Prevalence of obesity among adults and youth: United states, 2015–2016. NCHS Data Brief (US: Centers for Disease Control and Prevention) (2017).
25. Hall JE. Obesity, kidney dysfunction, and inflammation: Interactions in hypertension. Cardiovasc Res (2021) 117(8):1859–76. doi: 10.1093/cvr/cvaa336
26. Han DC, Isono M, Chen S, Casaretto A, Hong SW, Wolf G, et al. Leptin stimulates type I collagen production in db/db mesangial cells: glucose uptake and TGF-β type II receptor expression. Kidney Int (2001) 59(4):1315–23. doi: 10.1046/j.1523-1755.2001.0590041315.x
27. Ichihara AK. Contribution of nonproteolytically activated prorenin in glomeruli to hypertensive renal damage. J Am Soc Nephrol (2006) 17(9):2495–503. doi: 10.1681/ASN.2005121278
28. Izquierdo AG. Leptin, obesity, and leptin resistance: Where are we 25 years later? Nutrients (2019) 11(11):2704. doi: 10.3390/nu11112704
29. Kerner W. Definition, classification and diagnosis of diabetes mellitus. Exp Clin Endocrinol Diabetes (2014) 122(07):384–6. doi: 10.1055/s-0034-1366278
30. Knight SF. Obesity, insulin resistance, and renal function. Microcirculation (2007) 14(4-5):349–62. doi: 10.1080/10739680701283018
31. Korolczuk A. Increased risk of cardiovascular complications in chronic kidney disease: A possible role of leptin. Curr Pharm Des (2014) 20(4):666–74. doi: 10.2174/13816128113199990013
32. Lin CF. Epidemiology of dyslipidemia in the Asia pacific region. Int J Gerontol (2018) 12(1):2–6. doi: 10.1016/j.ijge.2018.02.010
33. Mao SF. Leptin and chronic kidney diseases. J Recept Signal Transduct (2018) 38(2):89–94. doi: 10.1080/10799893.2018.1431278
34. McCarty MF. Adjuvant strategies for prevention of glomerulosclerosis. Med Hypotheses (2006) 67(6):1277–96. doi: 10.1016/j.mehy.2004.11.048
35. Monalisa R. Role of leptin in obesity. Res J Pharm Technol (2015) 8(8):1073–6. doi: 10.5958/0974-360X.2015.00185.7
36. Mount PD. Obesity-related chronic kidney disease–the role of lipid metabolism. Metabolites (2015) 5(4):720–32. doi: 10.3390/metabo5040720
37. Neirynck N, Vanholder R, Schepers E, Eloot S, Pletinck A, Glorieux GN. An update on uremic toxins. Int Urol Nephrol (2013) 45(1):139–50. doi: 10.1007/s11255-012-0258-1
38. Ni XP. Central receptors mediating the cardiovascular actions of melanocyte stimulating hormones. J Hypertens (2006) 24(11):2239–46. doi: 10.1097/01.hjh.0000249702.49854.fa
39. Obradovic MS-M. Leptin and obesity: Role and clinical implication. Front Endocrinol (2021) 12:585887. doi: 10.3389/fendo.2021.585887
40. Zieba DA, Biernat W, Barć J. Roles of leptin and resistin in metabolism, reproduction, and leptin resistance. Domest Anim Endocrinol (2020) 73:106472. doi: 10.1016/j.domaniend.2020.106472
41. Perrini S. Leptin: A marker of renal injury. Internal Emergency Med (2019) 14(4):493–4. doi: 10.1007/s11739-019-02074-8
42. Rehman KA. Leptin: A new therapeutic target for treatment of diabetes mellitus. J Cell Biochem (2018) 119(7):5016–27. doi: 10.1002/jcb.26580
43. Soni AC. Ghrelin, leptin, adiponectin, and insulin levels and concurrent and future weight change in overweight postmenopausal women. Menopause (New York NY) (2011) 18(3):296. doi: 10.1097/gme.0b013e3181f2e611
44. Van Gaal LF. Mechanisms linking obesity with cardiovascular disease. Nature (2006) 444(7121):875–80. doi: 10.1038/nature05487
45. Weil EJ. Podocyte detachment in type 2 diabetic nephropathy. Am J Nephrol (2011) 33(Suppl. 1):21–4. doi: 10.1159/000327047
46. Yadav AK. Role of leptin and adiponectin in insulin resistance. Clin Chim Acta (2013) 417:80–4. doi: 10.1016/j.cca.2012.12.007
47. Zhang BX. Renal thrombotic microangiopathies induced by severe hypertension. Hypertens Res (2008) 31(3):479–83. doi: 10.1291/hypres.31.479
Keywords: leptin, renal function, chronic kidney disease, adipocyte, middle-aged and elderly, obesity
Citation: Shih Y-L, Shih C-C, Chen S-Y-F and Chen J-Y (2022) Elevated serum leptin levels are associated with lower renal function among middle-aged and elderly adults in Taiwan, a community-based, cross-sectional study. Front. Endocrinol. 13:1047731. doi: 10.3389/fendo.2022.1047731
Received: 18 September 2022; Accepted: 12 December 2022;
Published: 23 December 2022.
Edited by:
Paul Kievit, Oregon Health and Science University, United StatesReviewed by:
Evelyn Frias-Toral, Catholic University of Santiago de Guayaquil, EcuadorI-Shiang Tzeng, National Taipei University, Taiwan
Aleksandra Klisic, Primary Health Care Center Podgorica, Montenegro
Copyright © 2022 Shih, Shih, Chen and Chen. This is an open-access article distributed under the terms of the Creative Commons Attribution License (CC BY). The use, distribution or reproduction in other forums is permitted, provided the original author(s) and the copyright owner(s) are credited and that the original publication in this journal is cited, in accordance with accepted academic practice. No use, distribution or reproduction is permitted which does not comply with these terms.
*Correspondence: Jau-Yuan Chen, d2VsaW5zQGNnbWgub3JnLnR3