 Qin Ling1,2†
 Xiao Liu
 Jianyong Ma
 Peng Yu
 Fuwei Liu
 Jun Luo
95% of researchers rate our articles as excellent or good
Learn more about the work of our research integrity team to safeguard the quality of each article we publish.
Find out more
SYSTEMATIC REVIEW article
Front. Endocrinol. , 19 January 2023
Sec. Obesity
Volume 13 - 2022 | https://doi.org/10.3389/fendo.2022.1043169
Background: The triglyceride and glucose (TyG) index is associated with the risk of nonalcoholic fatty liver disease (NAFLD), but the dose−response relationship between them is still unknown. We conducted a comprehensive meta-analysis to study the dose−response association between the TyG index and the risk of NAFLD.
Methods: We systematically searched the Cochrane Library, PubMed, and Embase databases until July 2022 for relevant studies. The robust error meta-regression method was used to investigate the dose−response association between the TyG index and NAFLD. Summary relative risks (ORs) and 95% CIs were estimated by using a random-effects model.
Results: A total of 4 cohort and 8 cross-sectional studies were included, with 28,788 NAFLD cases among the 105,365 participants. A positive association for the risk of NAFLD was observed for each additional unit of the TyG index with a linear association (p=0.82), and the summary OR was 2.84 (95% CI, 2.01-4.01). In the subgroup analyses, a stronger association of the TyG index with NAFLD was shown in females than in males (men: OR=2.97, 95% CI 2.55-3.46, women: OR=4.80, 95% CI 3.90-5.90, Psubgroup<0.001).
Conclusion: The TyG index may be a novel independent risk factor for NAFLD beyond traditional risk factors.
Systematic Review Registration: https://www.crd.york.ac.uk/prospero, identifier (CRD42022347813).
Nonalcoholic fatty liver disease (NAFLD) is currently the most common chronic liver disease worldwide and not only leads to liver cirrhosis, liver failure or even liver cancer but also increases the risk of atherosclerosis and cardiovascular disease (CVD) (1). Therefore, early detection of patients at risk for NAFLD in a simple and effective manner is critical. However, the pathogenesis of NAFLD is still uncertain. The most popular pathomechanism is that insulin resistance (IR) plays a crucial role in the development of NAFLD (2). The triglyceride-glucose (TyG) index is calculated as LN (fasting triglyceride/fasting glucose) (3), which can usually be checked in healthy individuals. A recent study reported that the TyG index may be an alternative and reliable measure of IR. Studies have already pointed out that the TyG index is better in predicting the risk level of NAFLD patients compared with homeostasis model assessment-insulin resistance (4), a common diagnostic means for IR clinically. Zhang et al (5) and Zheng et al (6) published two studies in 2017 and 2018, respectively, both showing that the TyG index may be a predictor of incident NAFLD and concluding that it may be the best test for screening simple NAFLD.
Since then, multiple new studies regarding the relationship between TyG and NAFLD have been published, but the dose−response association between them is still unclear. Therefore, we aimed to evaluate the dose−response relationship between the TyG index and the risk of NAFLD in this study.
We have registered our study in the International Prospective Register of Systematic Reviews (PROSPERO) (https://www.crd.york.ac.uk/PROSPERO-CRD42022347813). As shown in Supplemental Table 1, we conducted this meta-analysis according to the Preferred Reporting Items for Systematic Reviews and Meta-Analyses (PRISMA) statement.
To find all studies on the relationship between the TyG index and NAFLD, we performed an exhaustive literature review through the PubMed and Embase databases and the Cochrane Library until July 18, 2022, and the concrete search strategy is provided in Supplemental Table 2. No date restriction was applied, but the English language and limitation to human studies were needed.
According to the population, intervention, comparison, outcome, and study design (known as the PICOS rules), the included criteria were as follows: (1) participants: adult (age>18 years); (2) comparison: high TyG index versus low TyG index; (3) outcomes: evaluated the relationship between the TyG index and the risk of NAFLD; (4) types of studies: observational studies published as full-length articles; and (5) reported the estimated effect for this association with multivariate analysis and provided useful data for the dose−response analysis. Therefore, studies were excluded for the following reasons: (1) they were reviews, meta-analyses, and congress abstracts; (2) they were abstract-only articles; (3) no relevant data were reported or could not be extracted; and (4) they used languages other than English.
Two investigators (Q-L and X-Y) separately completed the entire process of our study from the screening for included studies to data analysis. We identified the final included articles based on the title, abstract, and full text, and disagreements were resolved through coordination or by a third author (X-L) when necessary. An e-mail requesting the article or information was sent to the author when the article was not available or to obtain additional information for the analyses. Duplicated manuscripts were manually identified.
The following data were extracted by three independent researchers (Q-L, JW-C, Y-X) and examined for each eligible study by a fourth author (X-L): (1) name of first author; (2) year of publication; (3) country or region; (4) follow-up time; (5) baseline characteristics of the subjects (sample size, age, body mass index-BMI and so on); (6) study type; (7) outcome assessment; (8) number and percent of NAFLD incidence; (9) variables of adjustments; (10) TyG index value associated with the dose−response analysis; (11) hazard ratio (HR) or relative risk (RR) or odds ratio (OR) with 95% confidence interval (CI) from the most adjusted model.
The quality of the cross-sectional studies was judged using Joanna Briggs Institute’s critical appraisal checklist, while the cohort studies were evaluated using the Newcastle−Ottawa Scale (NOS). After an evaluation of selection, comparability, and outcomes, the studies were considered high-quality with an NOS of ≥6 stars.
The majority of our included studies reported OR, and the others reported HR, and we uniformly downgraded HR to OR and merged the results. We used the one-stage method of robust error meta-regression (REMR) to fit the dose−response relationship between the TyG index and the risk of NAFLD (7, 8). In addition, we calculated the summary OR of the final results with the natural logarithm of the OR (log [OR]) and its standard error (SElog [OR]). The method of Greenland and Longnecker (9) was applied to compute study-specific slopes (linear trends) and 95% CIs.
Heterogeneity was assessed using the I2 statistics and Cochran Q test (p<0.1); I2>50% was regarded as high heterogeneity. To assess publication bias, a funnel plot, Egger’s test, and Begg’s test were performed. All analyses were performed using Stata 14.0 (Stata Corp LP, College Station, TX, USA) and Review Manager (RevMan) version 5.3 (The Cochrane Collaboration 2014; Nordic Cochrane Centre Copenhagen, Denmark).
We made the process of literature search and screening a flow chart (Figure 1). A total of 1,052 articles were initially retrieved. After reading the title and abstract of the article, 1,011 studies were excluded. We read the full text of the remaining 41 texts, while 28 of them were excluded for the following reasons: a) Focus on other population, exposure, and outcome (n =7) (10–16); b) Without target data (n =13) (17–29); c) Conference Abstract (n=8) (30–37); d) In Chinese (n=1) (38). All the detailed reasons for the excluded studies can be seen in Supplemental Table 3. Finally, 4 cohort studies (6, 39–41) and 8 cross-sectional studies (4, 5, 42–47) were included in the meta-analysis.
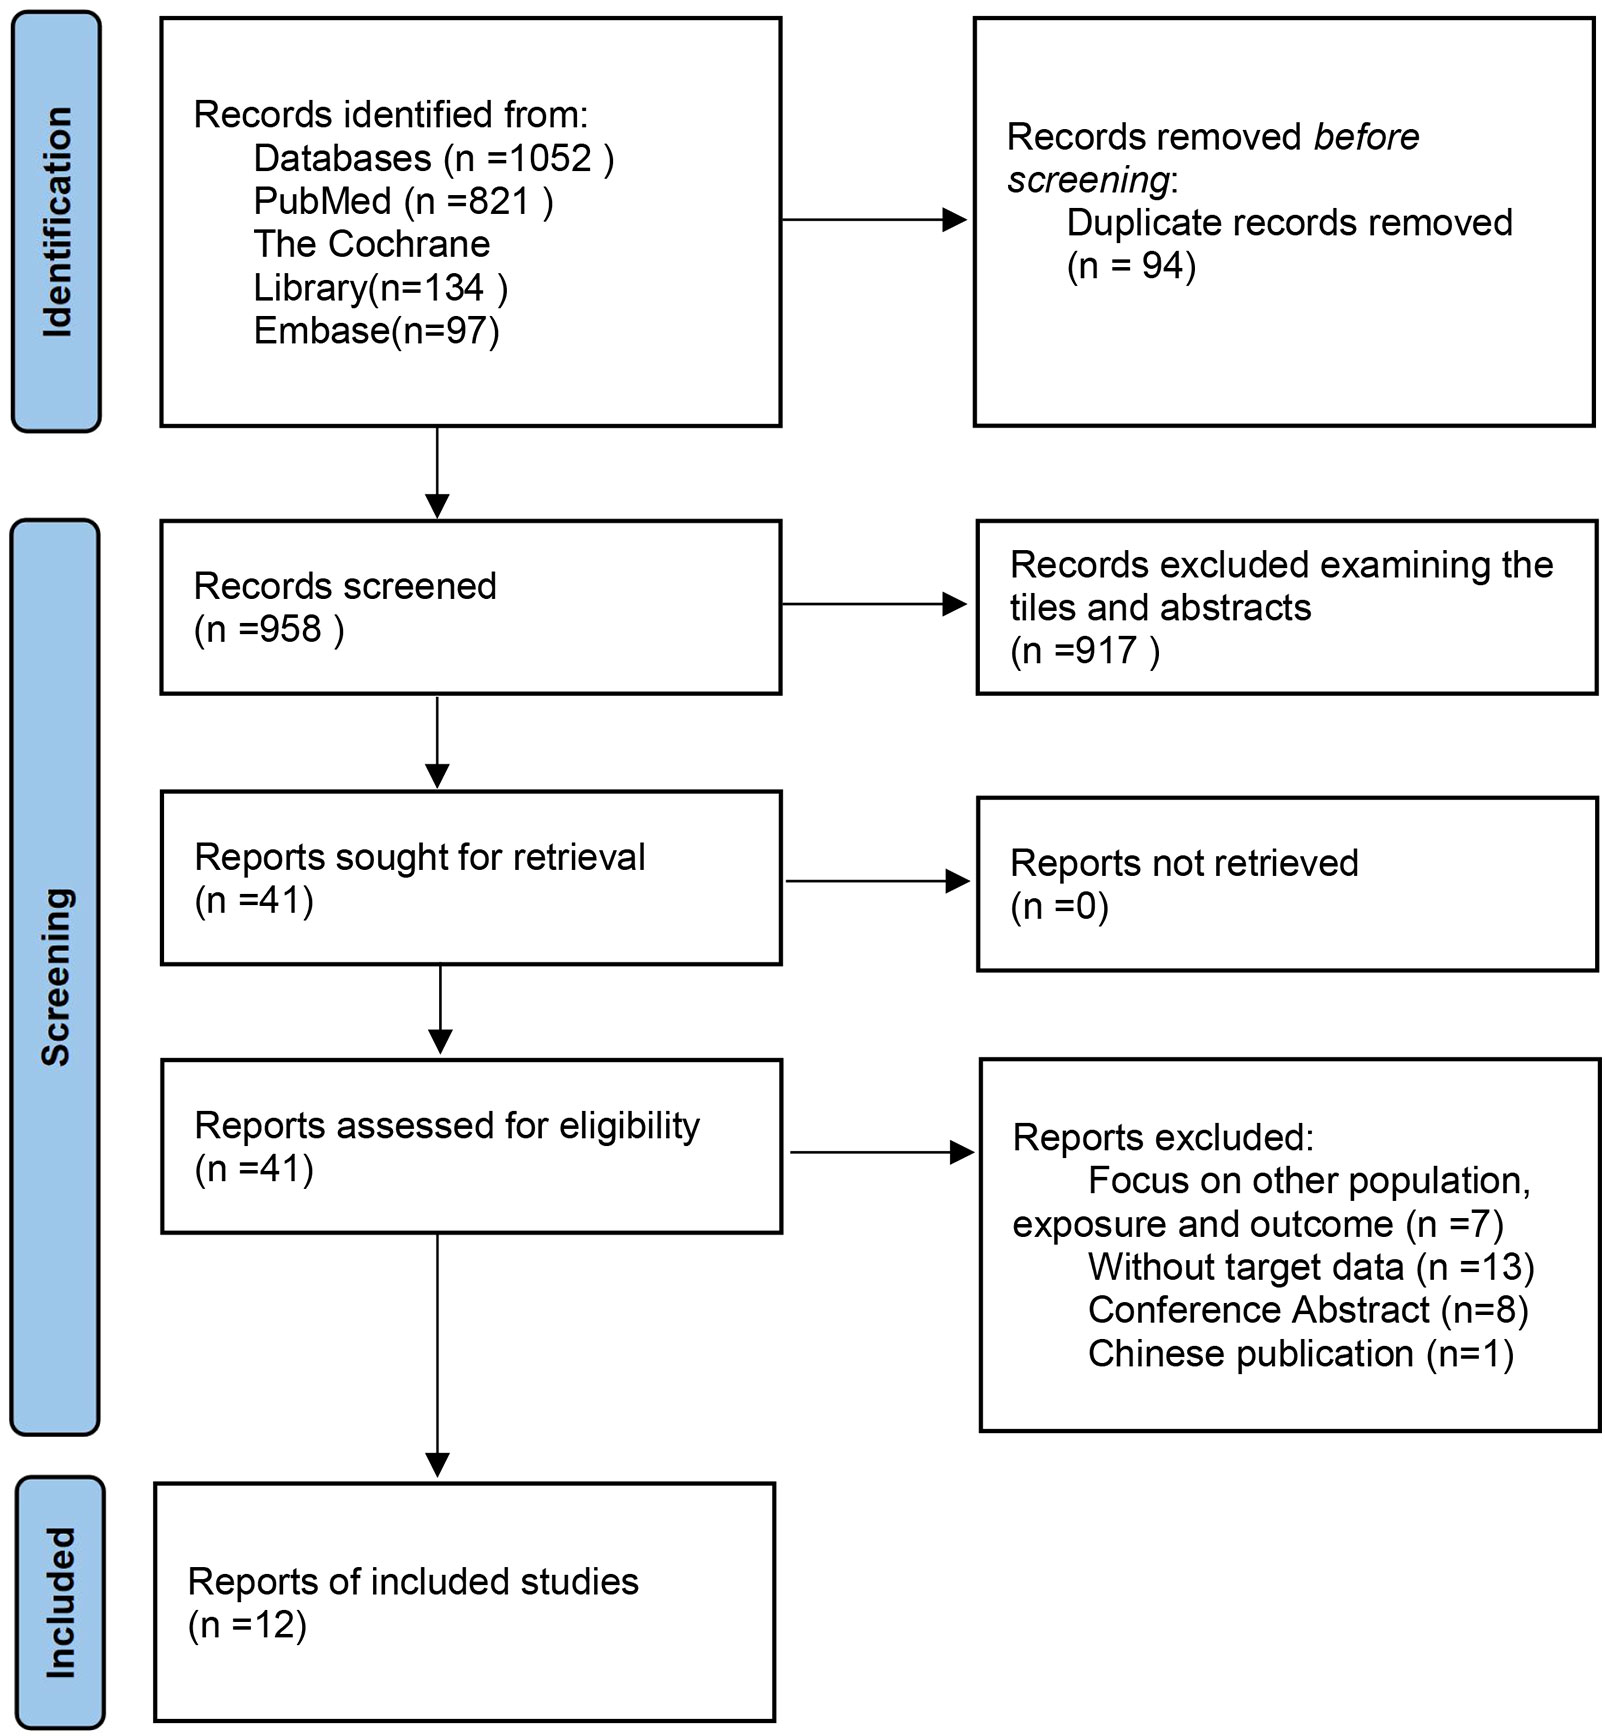
Figure 1 Flow chart of the study selection process.
The concrete characteristics of these included studies are shown in Table 1. Twelve studies with 28,788 NAFLD cases and 105,365 participants were included in this meta-analysis (4–6, 39–47). Overall, the sample sizes of the included studies ranged from 184 to 52,575, while the mean age ranged from 39.9 to 68.9 years. Published between 2017 and 2022, one of them was from America, and one was from Europe (France), while the others were all from Asia.

Table 1 Characteristics of included studies in this meta-analysis.
Among these articles, 8 cross-sectional studies were assessed by the Joanna Briggs Institute critical appraisal checklist (Supplemental Table 4). One of them (42) did not consider confounding factors, and it is not clear whether three of them (4, 43, 45) identified subpopulations by objective criteria. The rest were cohort studies that were evaluated by NOS, all scored as high quality with an NOS of more than 6 stars (Supplemental Table 5).
Ten studies (4, 6, 39–43, 45–47) were included in the dose−response analysis of TyG and NAFLD. The summary OR for each 1-unit increase in TyG was 2.84 (95% CI, 2.01-4.01, I2 = 98%, P<0.001; Figure 2), which suggested that the association between the TyG index and the risk of NAFLD was significant. A positive relationship is shown in Figure 3 between TyG and the risk of NAFLD with evidence of linearity, Pnon-linearity =0.82, which was more than 0.05. Supplementary Table 6 shows the estimated OR derived from the linear curve of dose−response analysis for the TyG index and NAFLD.
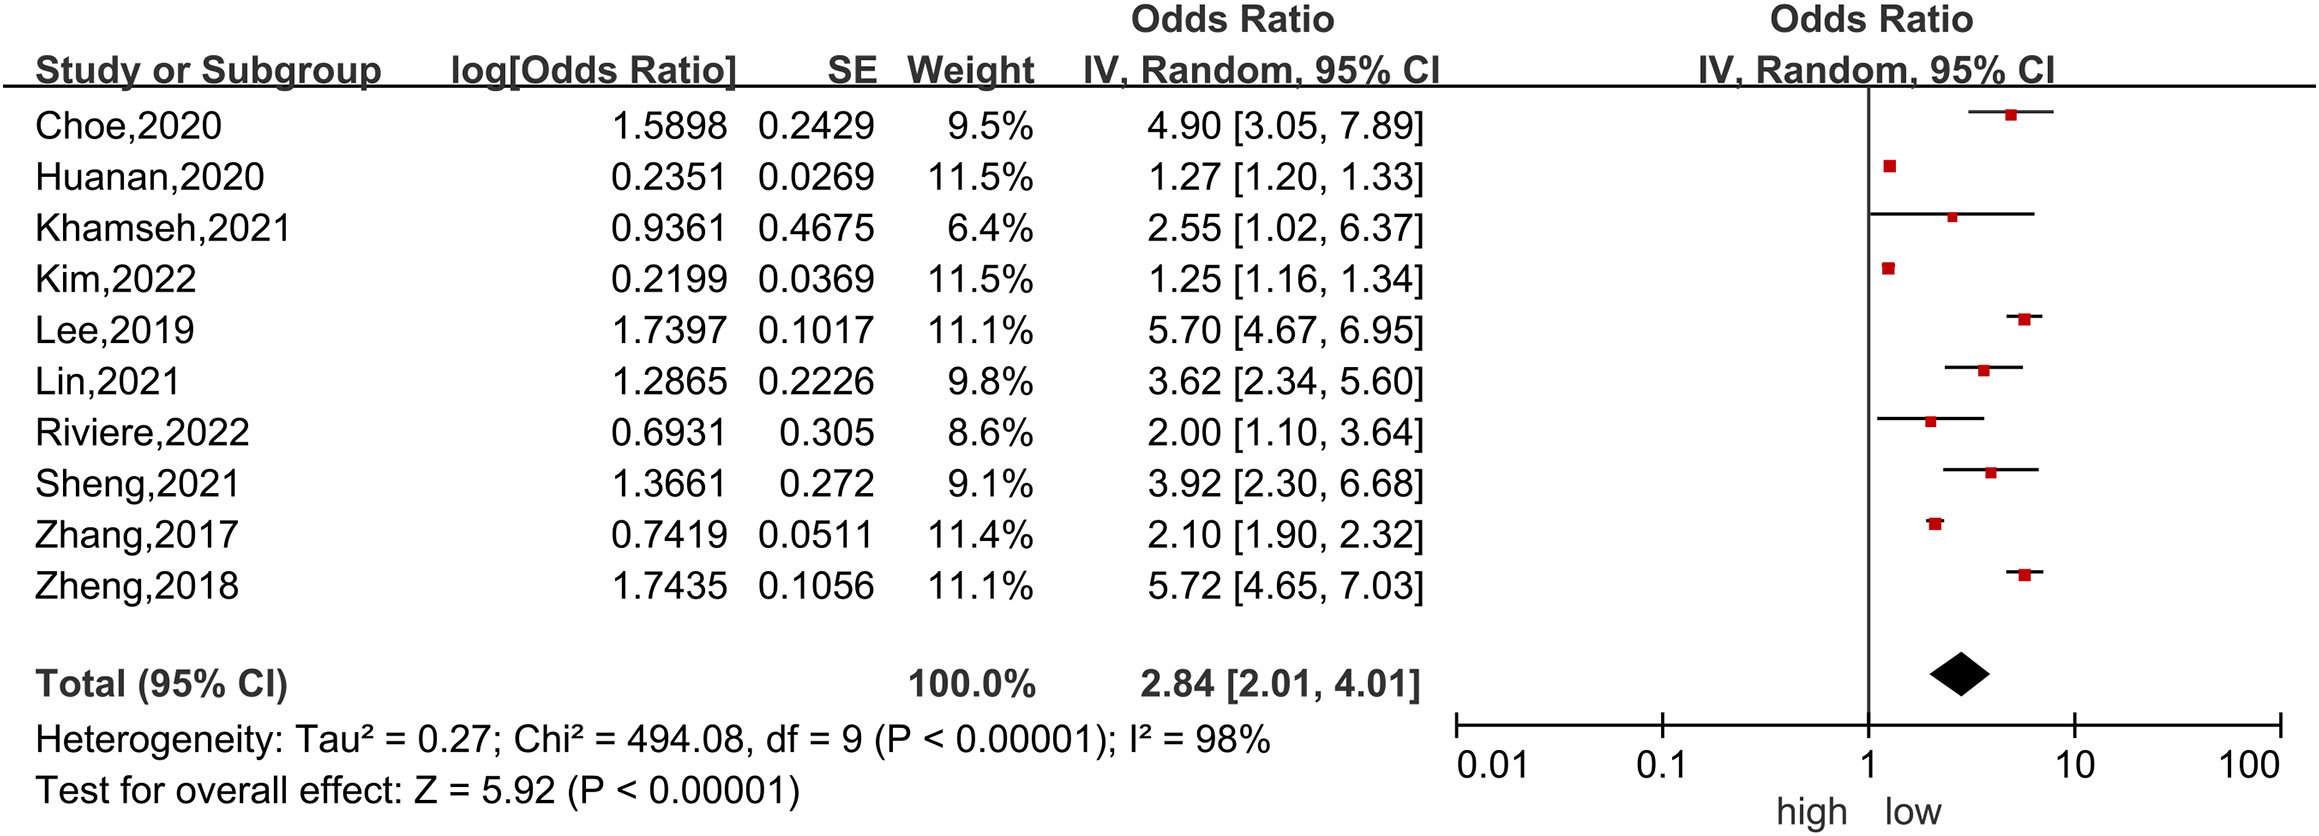
Figure 2 Forest plot of the association between each 1-unit increase in the triglyceride-glucose index and the risk of nonalcoholic fatty liver disease. The black midline indicates the line of no effect. The diamond indicates the pooled estimate. Gray boxes are relative to study size, and the black transverse lines indicate the 95% confidence interval around the effect size estimate.
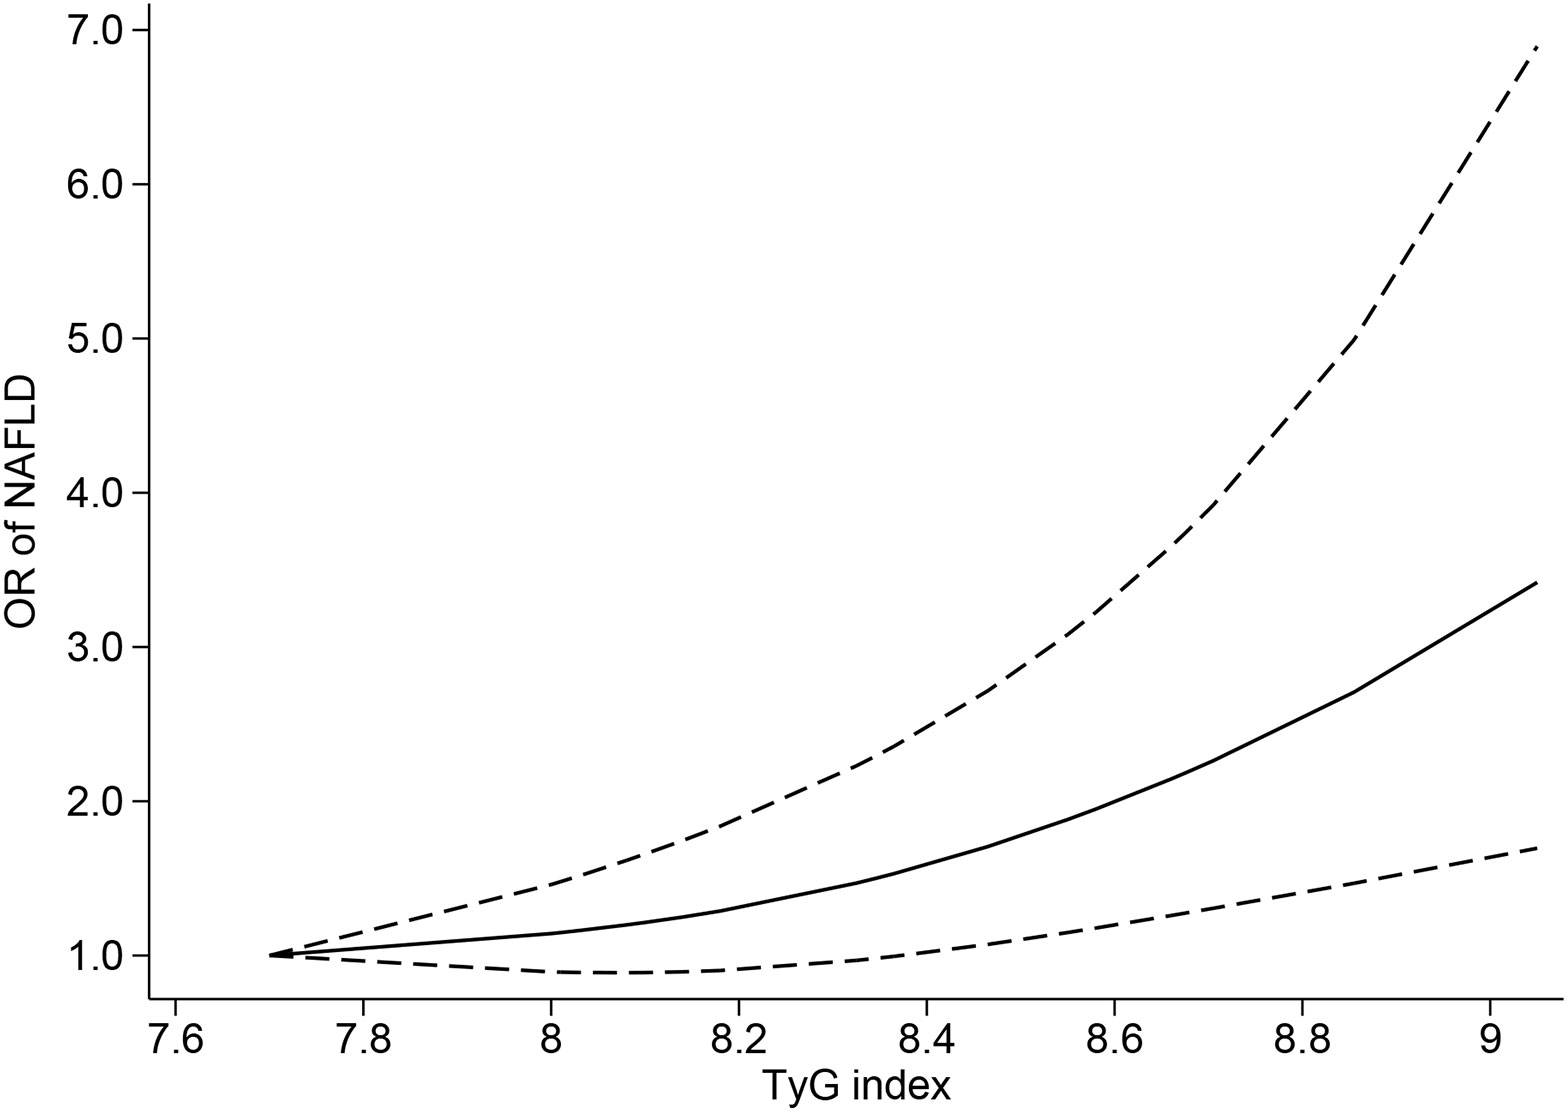
Figure 3 Triglyceride-glucose index and risk of nonalcoholic fatty liver disease, linear dose−response analysis. The solid line and the dashed lines represent the estimated relative risk and the 95% confidence interval, respectively.
The combined results were consistent with the original results when any study was omitted from the sensitivity analysis (Supplementary Figure 1). Some indication of publication bias can be discovered when using Egger’s test (P=0.044) or by inspecting the asymmetrical funnel plot. However, there was no evidence of publication bias shown in Begg’s test (P=0.858) (Supplementary Figure 2). Then, the “trim-and-fill” method was used for the adjustment of publication bias in our analysis. After 3 iterations using the linear method, the data of the five virtual studies were entered; however, the results remained significant (OR=1.52 95% CI, 1.08-2.13).
Subgroup analyses according to age, study design, sample size, BMI and adjustment for confounders are shown in Table 2. Heterogeneity was not evident in the sex-specific groups, suggesting that sex may be a potential source of heterogeneity across the main results. The summary OR for women was 4.80 (95% CI, 3.90-5.90), which was higher than the pooled result for men of 2.97 (95% CI, 2.55-3.46), suggesting a stronger association between the TyG index and NAFLD in females (P<0.001). Additionally, in the subgroup analyses defined by adjustment for confounding factors, a great difference was shown in the group adjusted for BMI, diabetes, and exercise (P<0.001).
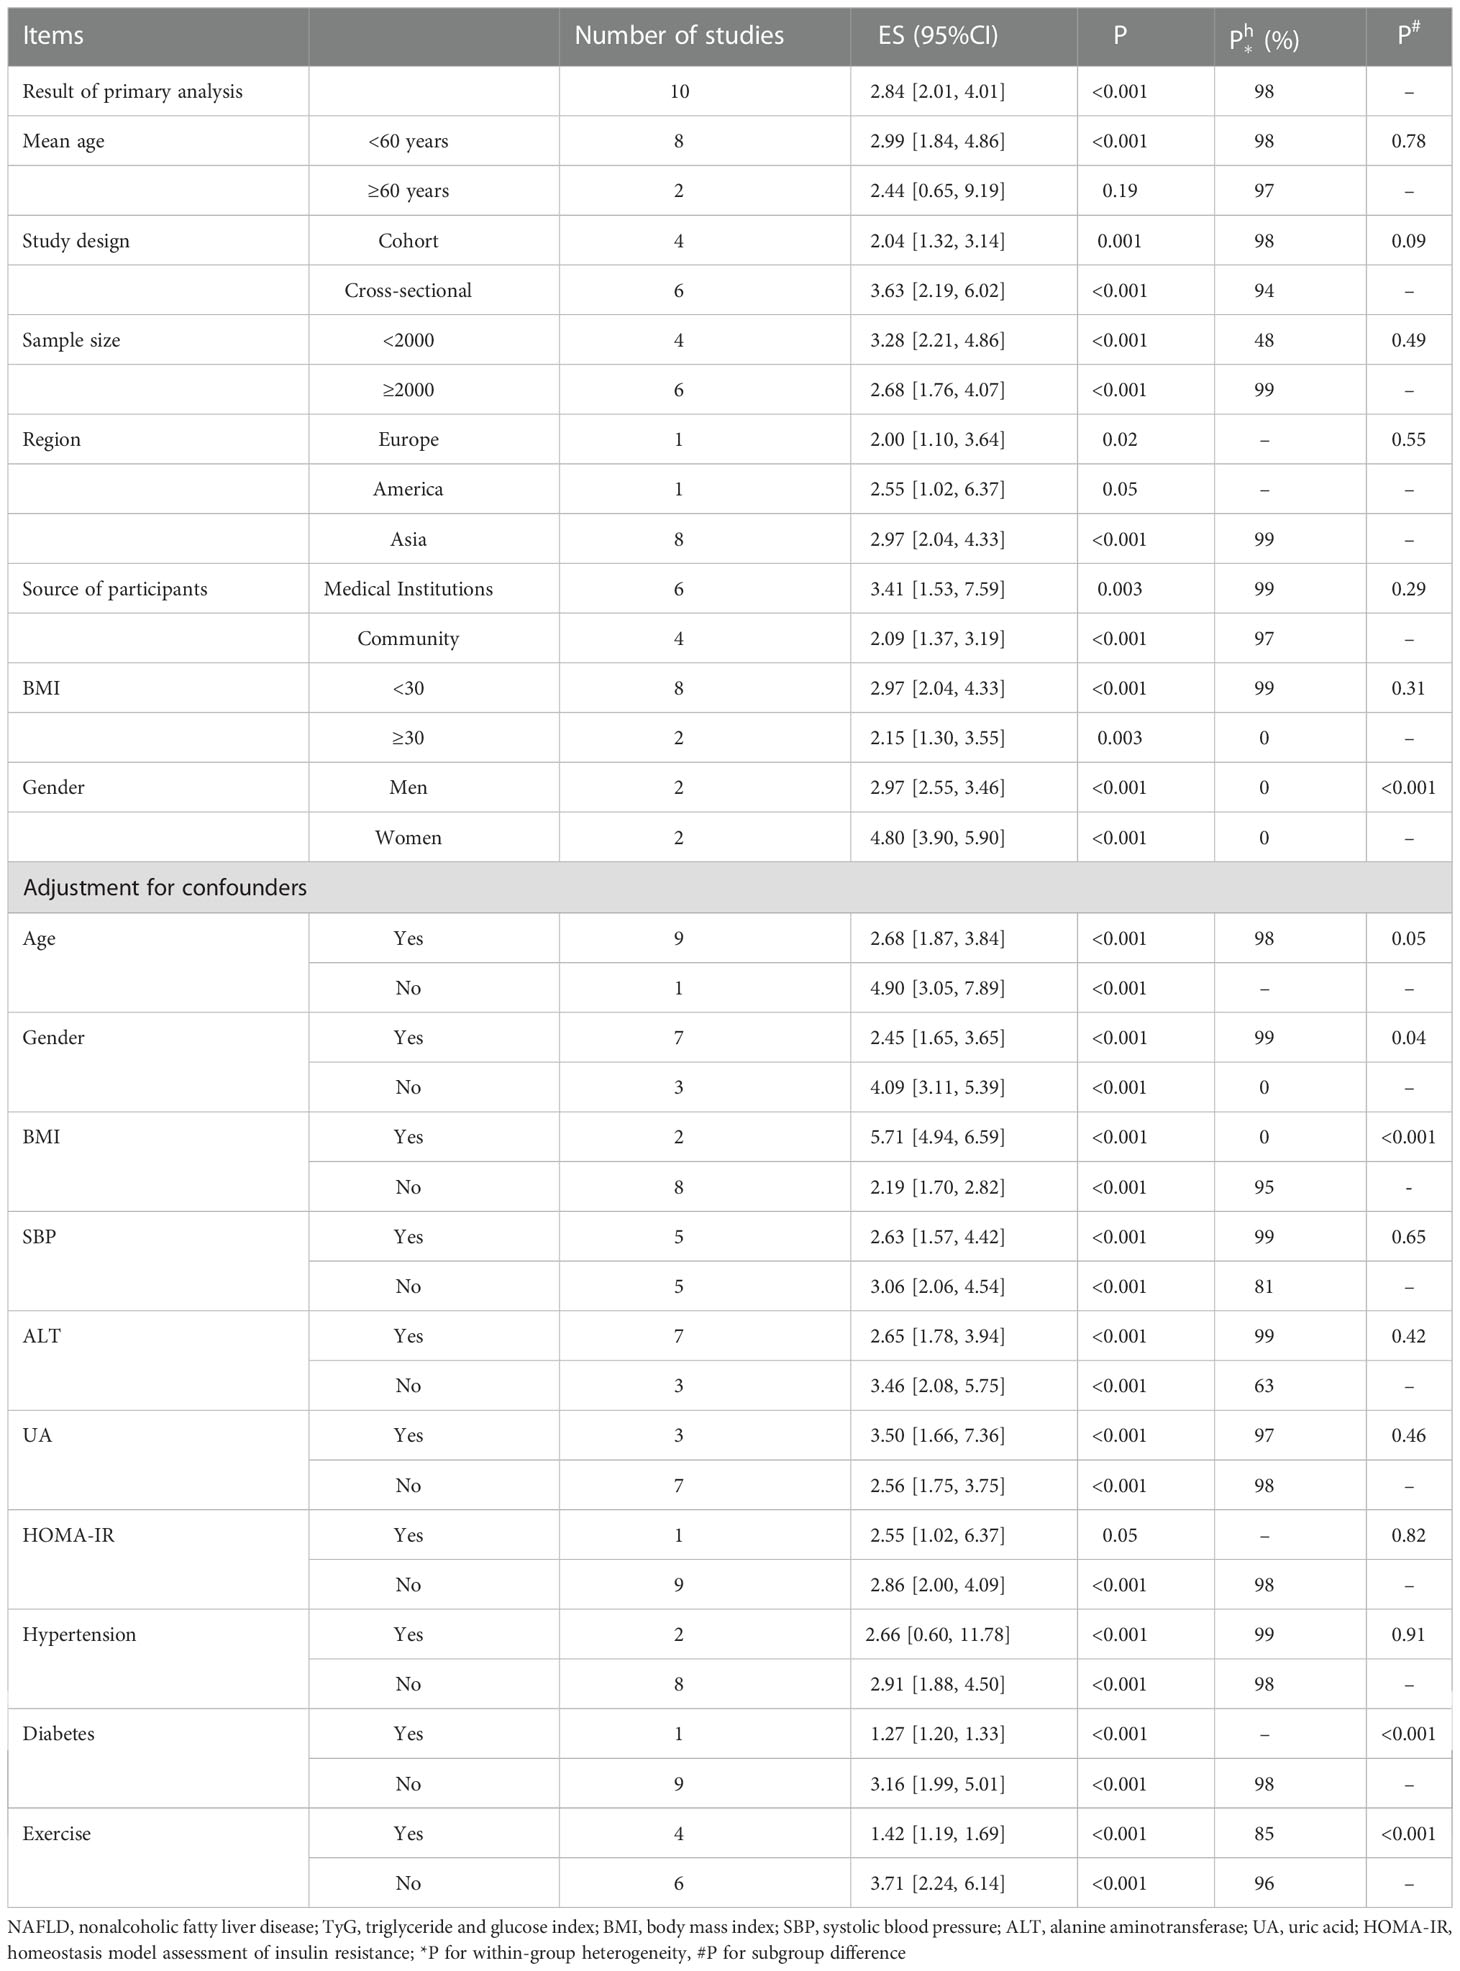
Table 2 Subgroup analysis of TyG and risk of NAFLD.
Our study found that the positive association between TyG and the risk of NAFLD in a linear model was strong, and for additional units of TyG, the risk of NAFLD increased by 2.84 times. To the best of our knowledge, this is the first time that the dose−response relationship between the TyG index and the risk of NAFLD has been presented. Our result is consistent with a previous meta-analysis of large observational studies (48). In addition, we evaluated the dose−response relationship between the TyG index and NAFLD for the first time, identifying a specific value for the increased risk of NAFLD that was caused by the per unit increase in the TyG index. Therefore, our study can provide new ideas for the detection and prevention of NAFLD and can also determine specific cut-off values, which is of great significance in clinical application.
With respect to sex in the subgroup analysis, we found that women had a 1.6 times higher risk of NAFLD than men for each additional unit of TyG. This finding caught our attention because women have more peripheral and subcutaneous fat than visceral and hepatic adipose tissue, and combined with the protective effect of estrogen on NAFLD, women may have a lower risk of NAFLD than men (49). The contradiction may come from the mean age of the populations included in this subgroup, which was more than 44 years old in both included studies. Most women at this age are going through menopause, accompanied by decreasing estrogen levels (50). Studies have shown that postmenopausal women have a higher prevalence of NAFLD than men due to the higher possibility of weight gain, fat redistribution, and dyslipidemia, all of which can contribute to an increased risk of NAFLD (51). Moreover, our results highlighted the changes in NAFLD when increasing the same amount of TyG in different sexes, which may be related to sex differences in increased carbohydrate and lipid metabolism, as well as menopausal changes in body fat morphology and increased susceptibility to metabolic complications (52). However, considering the limited number of sex subgroups (N=2), further research is needed to confirm the sex difference in the TyG index with NAFLD.
In the subgroup for confounding factors, there will be a great difference across adjustments stratified by BMI, sedentary lifestyle, and diabetes. These results were not surprising. BMI is an important indicator to assess obesity, and obesity is recognized to be closely associated with NAFLD (53). Moreover, a sedentary lifestyle (54) and diabetes (55) are also hazards for NAFLD. Hence, BMI, sedentary lifestyle and diabetes may be modifiers of the relationship of the TyG index with NAFLD.
The TyG index is calculated by fasting triglycerides and fasting plasma glucose, and it is highly sensitive and specific for the identification of IR and has been widely used as a reliable alternative indicator for IR in recent years (56). The potential pathophysiological mechanisms of the association between the TyG index and the risk of NAFLD are as follows (Figure 4). It is widely recognized that NAFLD is closely related to IR (57), which mainly occurs in the liver, adipose, and muscle tissue. The excess blood glucose caused by IR will be converted into fat and increase triglycerides accordingly, which can promote lipolysis to raise the level of free fatty acids (58). Excess fatty acids are transported through the blood to the liver and further synthesized into fat, causing extra lipid deposition in the liver and contributing to NAFLD. In addition, due to the decreased sensitivity of insulin in patients with IR, circulating glucose will remain at a high level for a long time, promoting the secretion of insulin and stimulating hunger (59). As a result, the patients will become more eager to strive for a high-carbohydrate diet, thus forming a vicious cycle.
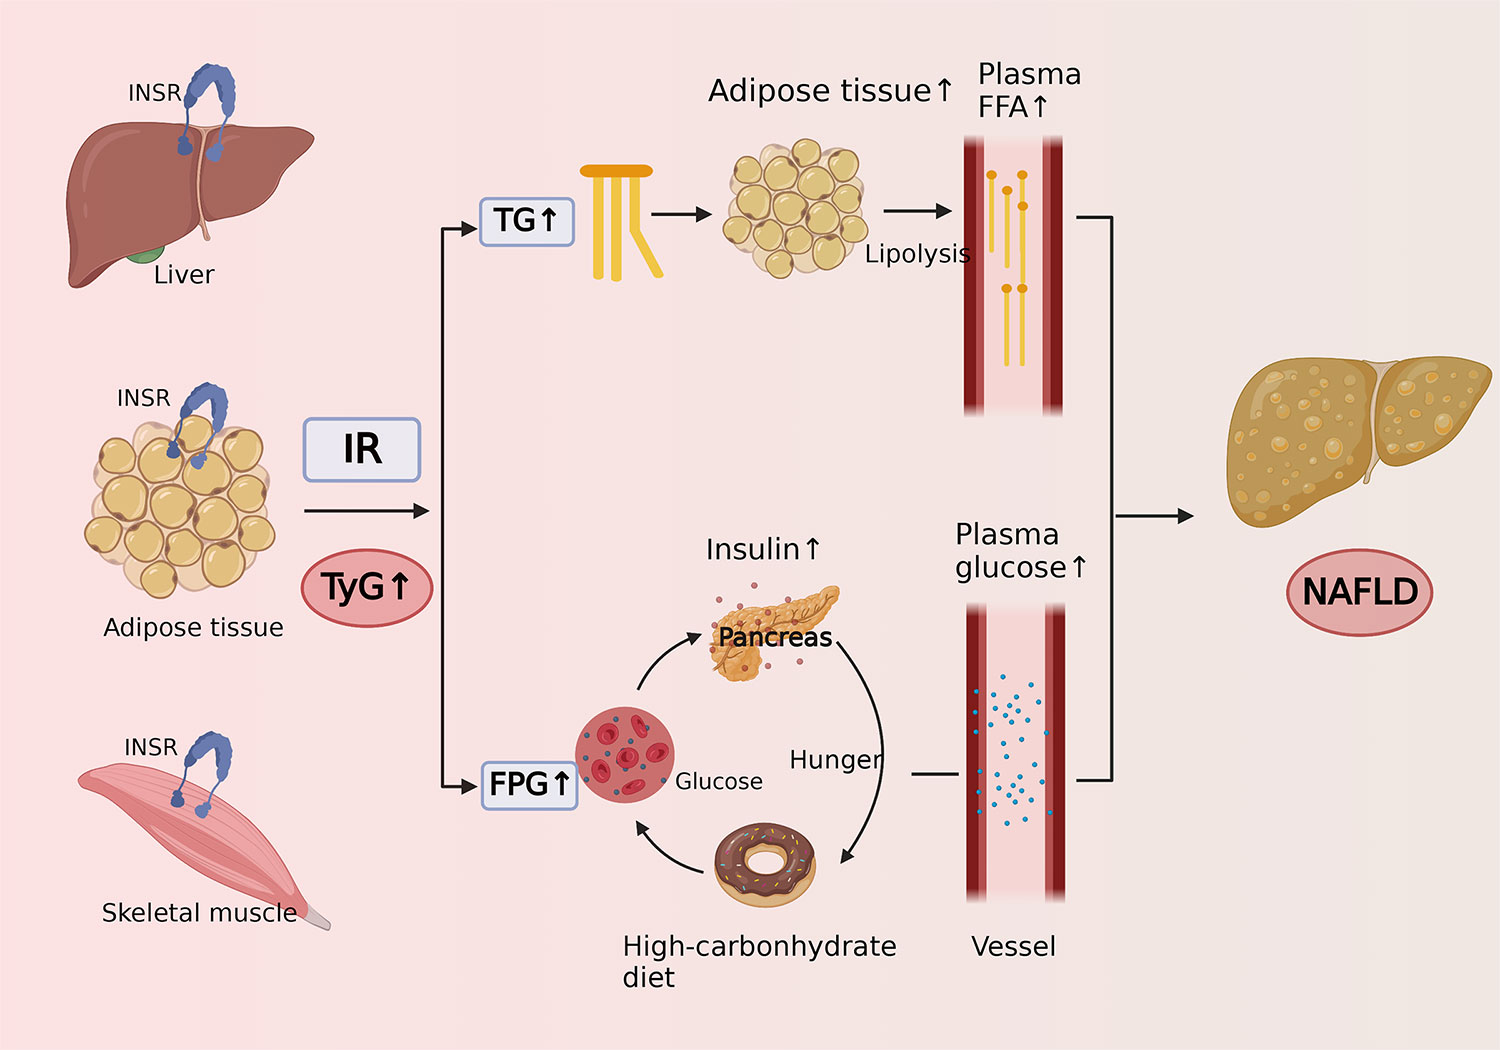
Figure 4 Cartoon describing the potential mechanism of the association between triglyceride-glucose index and risk of nonalcoholic fatty liver disease.
Both NAFLD and a high level of IR are associated with various diseases, such as liver cancer and many extraliver cancers, so the early detection of NAFLD may possibly alleviate or cure the potentially poor prognosis of this disease (60). The international diagnostic gold standard for NAFLD is liver biopsy (61), but it is invasive, complicated, and takes a long time to obtain results. Ultrasound, the technique commonly used in the clinical diagnosis of NAFLD, is mainly based on the grayscale to judge the lesion and its degree with the naked eye, which has shortcomings such as strong operation dependence and poor objectivity (62). Therefore, there is an urgent need for a noninvasive, accurate, and easy-to-judge method to diagnose NAFLD. The TyG index is a rapid, feasible, and applicable daily biomarker that can be obtained in routine medical examinations, and regular blood tests can effectively monitor the TyG index without extra cost. A study by Sheng et al (46) analysed the diagnostic performance of the TyG index for NAFLD, resulting in an area under the curve (AUC) of 0.98 (95% CI, 0.97-0.99). Moreover, Kim et al (27) and Zheng et al (6) also obtained high AUC values of 0.77 (95% CI, 0.76-0.78) and 0.76 (95% CI, 0.74-0.77), respectively. As a result, the TyG index may be an applicable tool to diagnose subjects with NAFLD noninvasively, and it may also serve as a good predictor for the risk of NAFLD. Some other studies have shown that TyG also has an association with the progression of NAFLD (15), and the role of TyG in the severity of NAFLD diagnosis should be verified in the future.
In general, most of our included studies were cross-sectional, which cannot prove a causal relationship (63). Although we only included the study of multivariate analysis, the remaining confounding factors will still affect our results. More studies with prospective designs are needed to confirm their association. Second, in patients with hyperglycemia, hyperlipidemia, or diabetes, the TyG index would be affected by these medications. However, due to the limitation of the number of included studies, the effect cannot be eliminated. In addition, due to the limitation of the number of studies, we cannot make a restriction or adjustment for factors such as the diet and lifestyle of the included population, which may have a profound impact on the TyG index. Moreover, only two of the included studies were conducted in Europe and America, while the majority were from Asia. As a result, more studies are needed to study the regional differences in the relationship between the TyG index and NAFLD.
Our dose−response analysis suggested that the TyG index may be a new risk factor for NAFLD independent of traditional risk factors. However, the association may be affected by some confounding factors due to the limitations of our study, so more prospective studies are necessary to confirm this result.
The original contributions presented in the study are included in the article/Supplementary Material. Further inquiries can be directed to the corresponding authors.
J-L, FW-L and P-Y participated in the whole project and were responsible for revising the draft. QL and JW-C X-L conducted the study selection, data extraction, statistical analysis, and interpretation of the data. Q-L and X-L wrote the first draft of the manuscript. All authors participated in the interpretation of the results and in revising the final version of the manuscript.
The authors declare that the research was conducted in the absence of any commercial or financial relationships that could be construed as a potential conflict of interest.
All claims expressed in this article are solely those of the authors and do not necessarily represent those of their affiliated organizations, or those of the publisher, the editors and the reviewers. Any product that may be evaluated in this article, or claim that may be made by its manufacturer, is not guaranteed or endorsed by the publisher.
The Supplementary Material for this article can be found online at: https://www.frontiersin.org/articles/10.3389/fendo.2022.1043169/full#supplementary-material
NAFLD, Nonalcoholic fatty liver disease; IR, insulin resistance; TyG index, triglyceride and glucose index; PROSPERO, International prospective register of systematic reviews; PRISMA, Systematic Reviews and Meta-Analyses; HR, hazard ratio; RR, relative risk; OR, odds ratio; CI, confidence interval; NOS, Newcastle−Ottawa Scale; REMR, robust error meta-regression method; SE, standard error; BMI, body mass index; AUC, area under the curve.
1. Kumar R, Priyadarshi RN, Anand U. Non-alcoholic fatty liver disease: Growing burden, adverse outcomes and associations. J Clin Transl Hepatol (2020) 8:76–86.
2. Khan RS, Bril F, Cusi K, Newsome PN. Modulation of insulin resistance in nonalcoholic fatty liver disease. Hepatology (2019) 70:711–24. doi: 10.1002/hep.30429
3. Simental-Mendía LE, Rodríguez-Morán M, Guerrero-Romero F. The product of fasting glucose and triglycerides as surrogate for identifying insulin resistance in apparently healthy subjects. Metab Syndr Relat Disord (2008) 6:299–304. doi: 10.1089/met.2008.0034
4. Lee SB, Kim MK, Kang S, Park K, Kim JH, Baik SJ, et al. Triglyceride glucose index is superior to the homeostasis model assessment of insulin resistance for predicting nonalcoholic fatty liver disease in Korean adults. Endocrinol Metab (Seoul) (2019) 34:179–86. doi: 10.3803/EnM.2019.34.2.179
5. Zhang S, Du T, Zhang J, Lu H, Lin X, Xie J, et al. The triglyceride and glucose index (TyG) is an effective biomarker to identify nonalcoholic fatty liver disease. Lipids Health Dis 16 (2017) 16:15. doi: 10.1186/s12944-017-0409-6
6. Zheng R, Du Z, Wang M, Mao Y, Mao W. A longitudinal epidemiological study on the triglyceride and glucose index and the incident nonalcoholic fatty liver disease. Lipids Health Dis (2018) 17:262. doi: 10.1186/s12944-018-0913-3
7. Xu C, Doi SAR. The robust error meta-regression method for dose-response meta-analysis. Int J Evid Based Healthc (2018) 16:138–44. doi: 10.1097/XEB.0000000000000132
8. Xu C, Liu Y, Jia P-L, Li L, Liu T-Z, Cheng L-L, et al. The methodological quality of dose-response meta-analyses needed substantial improvement: a cross-sectional survey and proposed recommendations. J Clin Epidemiol (2019) 107:1–11. doi: 10.1016/j.jclinepi.2018.11.007
9. Greenland S, Longnecker MP. Methods for trend estimation from summarized dose-response data, with applications to meta-analysis. Am J Epidemiol (1992) 135:1301–9. doi: 10.1093/oxfordjournals.aje.a116237
10. Wang R, Dai L, Zhong Y, Xie G. Usefulness of the triglyceride glucose-body mass index in evaluating nonalcoholic fatty liver disease: insights from a general population. Lipids Health Dis (2021) 20:77. doi: 10.1186/s12944-021-01506-9
11. Li Y, Zheng R, Li J, Feng S, Wang L, Huang Z. Association between triglyceride glucose-body mass index and non-alcoholic fatty liver disease in the non-obese Chinese population with normal blood lipid levels: a secondary analysis based on a prospective cohort study. Lipids Health Dis (2020) 19:229. doi: 10.1186/s12944-020-01409-1
12. Song K, Park G, Lee HS, Lee M, Lee HI, Choi HS, et al. Comparison of the triglyceride glucose index and modified triglyceride glucose indices to predict nonalcoholic fatty liver disease in youths. J Pediatr (2022) 242:79–85.e1. doi: 10.1016/j.jpeds.2021.11.042
13. Simental-Mendía LE, Ortega-Pacheco CJ, García-Guerrero E, Sicsik-Aragón MA, Guerrero-Romero F, Martínez-Aguilar G. The triglycerides and glucose index is strongly associated with hepatic steatosis in children with overweight or obesity. Eur J Pediatr (2021) 180:1755–60. doi: 10.1007/s00431-021-03951-1
14. Shi M, Liu P, Li J, Su Y, Zhou X, Wu C, et al. The performance of noninvasive indexes of adults in identification of nonalcoholic fatty liver disease in children. J Diabetes (2021) 13:744–53. doi: 10.1111/1753-0407.13169
15. Liu J, Guan L, Zhao M, Li Q, Song A, Gao L, et al. Association between the triglyceride-glucose index and outcomes of nonalcoholic fatty liver disease: A Large-scale health management cohort study. Diabetes Metab syndrome Obes Targets Ther (2021) 14:2829–39. doi: 10.2147/DMSO.S316864
16. Tutunchi H, Naeini F, Mobasseri M, Ostadrahimi A. Triglyceride glucose (TyG) index and the progression of liver fibrosis: A cross-sectional study. Clin Nutr ESPEN (2021) 44:483–7. doi: 10.1016/j.clnesp.2021.04.025
17. Son DH, Lee HS, Lee YJ, Lee JH, Han JH. Comparison of triglyceride-glucose index and HOMA-IR for predicting prevalence and incidence of metabolic syndrome. Nutrition Metab Cardiovasc Dis (2022) 32:596–604. doi: 10.1016/j.numecd.2021.11.017
18. Amzolini AM, Forțofoiu MC, Alhija AB, Vladu IM, Clenciu D, Mitrea A, et al. Triglyceride and glucose index as a screening tool for nonalcoholic liver disease in patients with metabolic syndrome. J Clin Med (2022) 11. doi: 10.3390/jcm11113043
19. Ye X, Li J, Wang H, Wu J. Pentraxin 3 and the TyG index as two novel markers to diagnose NAFLD in children. Dis Markers 2021 (2021) 2021:8833287. doi: 10.1155/2021/8833287
20. Amzolini AM, Forţofoiu MC, Barău Abu-Alhija A, Vladu IM, Clenciu D, Mitrea A, et al. Triglyceride and glucose index: a useful tool for non-alcoholic liver disease assessed by liver biopsy in patients with metabolic syndrome? Romanian J morphology embryology = Rev roumaine morphologie embryologie (2021) 62:475–80. doi: 10.47162/RJME.62.2.13
21. Cen C, Wang W, Yu S, Tang X, Liu J, Liu Y, et al. Development and validation of a clinical and laboratory-based nomogram to predict nonalcoholic fatty liver disease. Hepatol Int (2020) 14:808–16. doi: 10.1007/s12072-020-10065-7
22. Alasadi A, Humaish HH, Al-Hraishawi H. Evaluation the predictors of non-alcoholic fatty liver disease (NAFLD) in type 2 diabetes mellitus (T2DM) patients. Systematic Rev Pharm (2020) 11:421–30. doi: 10.31838/srp.2020.5.58
23. Simental-Mendía LE, Simental-Mendía E, Rodríguez-Hernández H, Rodríguez-Morán M, Guerrero-Romero F. The product of triglycerides and glucose as biomarker for screening simple steatosis and NASH in asymptomatic women. Ann Hepatol (2016) 15:715–20. doi: 10.5604/16652681.1212431
24. Li N, Tan H, Xie A, Li C, Fu X, Xang W, et al. Value of the triglyceride glucose index combined with body mass index in identifying non-alcoholic fatty liver disease in patients with type 2 diabetes. BMC endocrine Disord (2022) 22:101. doi: 10.1186/s12902-022-00993-w
25. Wang J, Su Z, Feng Y, Xi R, Liu J, Wang P. Comparison of several blood lipid-related indexes in the screening of non-alcoholic fatty liver disease in women: a cross-sectional study in the pearl river delta region of southern China. BMC Gastroenterol (2021) 21:482. doi: 10.1186/s12876-021-02072-1
26. Smiderle CA, Coral GP, DE Carli LA, Mattos AA, Mattos AZ, Tovo CV. Performace of triglyceride-glucose index on diagnosis and staging of nafld in obese patients. Arquivos gastroenterologia (2021) 58:139–44. doi: 10.1590/s0004-2803.202100000-24
27. Kim HS, Cho YK, Kim EH, Lee MJ, Jung CH, Park JY, et al. Triglyceride glucose-waist circumference is superior to the homeostasis model assessment of insulin resistance in identifying nonalcoholic fatty liver disease in healthy subjects. J Clin Med (2021) 11. doi: 10.3390/jcm11010041
28. Zhu J, Xu D, Yang R, Liu M, Liu Y. The triglyceride glucose index (TyG) and CDKAL1 gene rs10946398 SNP are associated with NAFLD in Chinese adults. Minerva endocrinologica (2020). doi: 10.23736/S0391-1977.20.03273-3
29. Guo W, Lu J, Qin P, Li X, Zhu W, Wu J, et al. The triglyceride-glucose index is associated with the severity of hepatic steatosis and the presence of liver fibrosis in non-alcoholic fatty liver disease: a cross-sectional study in Chinese adults. Lipids Health Dis (2020) 19:218. doi: 10.1186/s12944-020-01393-6
30. Katalin C, Ágnes B. TyG index correlation with surrogate measures of visceral obesity, insulin resistance and non-alcoholic fatty liver disease. Metabolism: Clin Exp (2022) 128. doi: 10.1016/j.metabol.2021.155074
31. Runderawala H, Desai N. The triglyceride and glucose index (TyG) as screening biomarker to identify non-alcoholic fatty liver disease. Indian J Gastroenterol (2020) 39:S48–9. doi: 10.1007/s12664-020-01133-9
32. Lim J. Validation of fatty liver index in a healthy Korean population and its comparison with triglyceride glucose index and its related parameters. Clinica Chimica Acta (2019) 493:S374. doi: 10.1016/j.cca.2019.03.801
33. Kim KS, Hwang YC, Ahn HY, Park SW, Park CY. Triglyceride and glucose (TYG) index is an effective predictor of nonalcoholic fatty liver disease/nonalcoholic steatohepatitis. Diabetes (2019) 68. doi: 10.2337/db19-1596-P
34. Kim MK, Kim JH, Park K, Lee SB, Nam JS, Kang S, et al. Relationship between the triglyceride glucose index and the presence and fibrosis of nonalcoholic fatty liver disease in Korean adults. Diabetes (2018) 67:A161. doi: 10.2337/db18-612-P
35. Inavolu P, Singla N, Nunsavata K, Bhashyakarla RK. Triglyceride and glucose index (TYG) index as an screening biomarker to identify nonalcoholic fatty liver disease. J Clin Exp Hepatol (2018) 8:S41. doi: 10.1016/j.jceh.2018.06.344
36. Inavolu P. Screening of non-alcoholic fatty liver disease using new screening biomarker triglyceride and glucose index (Tyg) index. Indian J Gastroenterol (2018) 37:A74. doi: 10.1007/s12664-018-0911-4
37. Kim HY, Ryu DR, Lee HA, Kim TH, Yoo K, Kim JS, et al. Noninvasive indices for the prediction of presence and severity of nonalcoholic fatty liver disease in patients with chronic kidney disease. Hepatol (Baltimore Md.) (2017) 66:1165A–6A. doi: 10.1002/hep.29501
38. Liu YT, Wang W, Tong J, Wang BY. [Relationship between triglyceride-glucose index and non-alcoholic fatty liver disease]. Zhonghua gan zang bing za zhi = Zhonghua ganzangbing zazhi = Chin J Hepatol (2021) 29:451–5. doi: 10.3760/cma.j.cn501113-20200615-00322
39. Huanan C, Sangsang L, Amoah AN, Yacong B, Xuejiao C, Zhan S, et al. Relationship between triglyceride glucose index and the incidence of non-alcoholic fatty liver disease in the elderly: a retrospective cohort study in China. BMJ Open (2020) 10:e039804. doi: 10.1136/bmjopen-2020-039804
40. Kim KS, Hong S, Ahn HY, Park CY. Triglyceride and glucose index is a simple and easy-to-calculate marker associated with nonalcoholic fatty liver disease. Obes (Silver Spring Md.) (2022) 30:1279–88. doi: 10.1002/oby.23438
41. Rivière B, Jaussent A, Macioce V, Faure S, Builles N, Lefebvre P, et al. The triglycerides and glucose (TyG) index: A new marker associated with nonalcoholic steatohepatitis (NASH) in obese patients. Diabetes Metab (2022) 48:101345. doi: 10.1016/j.diabet.2022.101345
42. Choe AR, Ryu DR, Kim HY, Lee HA, Lim J, Kim JS, et al. Noninvasive indices for predicting nonalcoholic fatty liver disease in patients with chronic kidney disease. BMC Nephrol (2020) 21:50. doi: 10.1186/s12882-020-01718-8
43. Khamseh ME, Malek M, Abbasi R, Taheri H, Lahouti M, Alaei-Shahmiri F. Triglyceride glucose index and related parameters (Triglyceride glucose-body mass index and triglyceride glucose-waist circumference) identify nonalcoholic fatty liver and liver fibrosis in individuals with Overweight/Obesity. Metab syndrome related Disord (2021) 19:167–73. doi: 10.1089/met.2020.0109
44. Kitae A, Hashimoto Y, Hamaguchi M, Obora A, Kojima T, Fukui M. The triglyceride and glucose index is a predictor of incident nonalcoholic fatty liver disease: A population-based cohort study. Can J Gastroenterol Hepatol (2019) 2019:5121574. doi: 10.1155/2019/5121574
45. Lin IT, Lee M-Y, Wang C-W, Wu D-W, Chen S-C. Gender differences in the relationships among metabolic syndrome and various obesity-related indices with nonalcoholic fatty liver disease in a Taiwanese population. Int J Environ Res Public Health (2021) 18. doi: 10.3390/ijerph18030857
46. Sheng G, Lu S, Xie Q, Peng N, Kuang M, Zou Y. The usefulness of obesity and lipid-related indices to predict the presence of non-alcoholic fatty liver disease. Lipids Health Dis (2021) 20:134. doi: 10.1186/s12944-021-01561-2
47. Zhang S, Du T, Li M, Jia J, Lu H, Lin X, et al. Triglyceride glucose-body mass index is effective in identifying nonalcoholic fatty liver disease in nonobese subjects. Medicine (2017) 96:e7041. doi: 10.1097/MD.0000000000007041
48. Beran A, Ayesh H, Mhanna M, Wahood W, Ghazaleh S, Abuhelwa Z, et al. Triglyceride-glucose index for early prediction of nonalcoholic fatty liver disease: A meta-analysis of 121,975 individuals. J Clin Med (2022) 11. doi: 10.3390/jcm11092666
49. Geer EB, Shen W. Gender differences in insulin resistance, body composition, and energy balance. Gend Med (2009) 6 Suppl 1:60–75. doi: 10.1016/j.genm.2009.02.002
50. Van Ommen CE, King EM, Murray MCM. Age at menopause in women living with HIV: a systematic review. Menopause (2021) 28:1428–36. doi: 10.1097/GME.0000000000001871
51. Chen KL, Madak-Erdogan Z. Estrogens and female liver health. Steroids (2018) 133:38–43. doi: 10.1016/j.steroids.2017.10.015
52. Sugiyama MG, Agellon LB. Sex differences in lipid metabolism and metabolic disease risk. Biochem Cell Biol (2012) 90:124–41. doi: 10.1139/o11-067
53. Sheka AC, Adeyi O, Thompson J, Hameed B, Crawford PA, Ikramuddin S. Nonalcoholic steatohepatitis: A review. JAMA (2020) 323:1175–83. doi: 10.1001/jama.2020.2298
54. Fan J-G, Kim S-U, Wong VW-S. New trends on obesity and NAFLD in Asia. J Hepatol (2017) 67:862–73. doi: 10.1016/j.jhep.2017.06.003
55. Tanase DM, Gosav EM, Costea CF, Ciocoiu M, Lacatusu CM, Maranduca MA, et al. The intricate relationship between type 2 diabetes mellitus (T2DM), insulin resistance (IR), and nonalcoholic fatty liver disease (NAFLD). J Diabetes Res (2020) 2020:3920196. doi: 10.1155/2020/3920196
56. Guerrero-Romero F, Simental-Mendía LE, González-Ortiz M, Martínez-Abundis E, Ramos-Zavala MG, Hernández-González SO, et al. The product of triglycerides and glucose, a simple measure of insulin sensitivity. Comparison euglycemic-hyperinsulinemic clamp. J Clin Endocrinol Metab (2010) 95:3347–51. doi: 10.1210/jc.2010-0288
57. Fujii H, Kawada N, Japan Study Group Of Nafld J-N. The role of insulin resistance and diabetes in nonalcoholic fatty liver disease. Int J Mol Sci (2020) 21. doi: 10.3390/ijms21113863
58. Mook S, Halkes Cj C, Bilecen S, Cabezas MC. In vivo regulation of plasma free fatty acids in insulin resistance. Metabolism (2004) 53:1197–201. doi: 10.1016/j.metabol.2004.02.023
59. Petersen MC, Shulman GI. Mechanisms of insulin action and insulin resistance. Physiol Rev (2018) 98:2133–223. doi: 10.1152/physrev.00063.2017
60. Tarantino G, Crocetto F, Di Vito C, Creta M, Martino R, Pandolfo SD, et al. Association of NAFLD and insulin resistance with non metastatic bladder cancer patients: A cross-sectional retrospective study. J Clin Med (2021) 10. doi: 10.3390/jcm10020346
61. Castera L, Friedrich-Rust M, Loomba R. Noninvasive assessment of liver disease in patients with nonalcoholic fatty liver disease. Gastroenterology (2019) 156:1264–81. doi: 10.1053/j.gastro.2018.12.036
62. Ajmera V, Loomba R. Imaging biomarkers of NAFLD, NASH, and fibrosis. Mol Metab (2021) 50:101167. doi: 10.1016/j.molmet.2021.101167
Keywords: triglyceride and glucose index, nonalcoholic fatty liver disease, dose-response, meta-analysis, prognosis
Citation: Ling Q, Chen J, Liu X, Xu Y, Ma J, Yu P, Zheng K, Liu F and Luo J (2023) The triglyceride and glucose index and risk of nonalcoholic fatty liver disease: A dose–response meta-analysis. Front. Endocrinol. 13:1043169. doi: 10.3389/fendo.2022.1043169
Received: 13 September 2022; Accepted: 28 December 2022;
Published: 19 January 2023.
Edited by:
Katherine Samaras, St Vincent’s Hospital Sydney, AustraliaReviewed by:
Giovanni Tarantino, University of Naples Federico II, ItalyCopyright © 2023 Ling, Chen, Liu, Xu, Ma, Yu, Zheng, Liu and Luo. This is an open-access article distributed under the terms of the Creative Commons Attribution License (CC BY). The use, distribution or reproduction in other forums is permitted, provided the original author(s) and the copyright owner(s) are credited and that the original publication in this journal is cited, in accordance with accepted academic practice. No use, distribution or reproduction is permitted which does not comply with these terms.
*Correspondence: Jun Luo, bHVvanVuMTk2NkAxNjMuY29t; Fuwei Liu, Z3psaXVmdXdlaUAxNjMuY29t
†These authors share first authorship
Disclaimer: All claims expressed in this article are solely those of the authors and do not necessarily represent those of their affiliated organizations, or those of the publisher, the editors and the reviewers. Any product that may be evaluated in this article or claim that may be made by its manufacturer is not guaranteed or endorsed by the publisher.
Research integrity at Frontiers
Learn more about the work of our research integrity team to safeguard the quality of each article we publish.